Abstract
In this study, we employed a chemical solution method to grow zinc oxide (ZnO) nanorods on SnO2:F (FTO) substrates as photoelectrodes for dye-sensitized solar cells (DSSCs). The influence of varying ZnO nanorod dimensions on cell performance was investigated. Specifically, we explored the effects of nanorod length and diameter on dye adsorption capacity and photovoltaic conversion efficiency. Characterization techniques such as electrochemical impedance spectroscopy (EIS), X-ray diffraction (XRD), and field-emission scanning electron microscopy (FE-SEM) were utilized to analyze the ZnO nanorods. Our results demonstrate that the sequential growth technique allows for control over the length and diameter of ZnO nanorods, thereby modulating their optoelectronic properties. XRD and FE-SEM analyses revealed that the surface morphology of the ZnO nanorods impacts dye adsorption capacity and photovoltaic conversion efficiency. EIS measurements further indicated a significant influence of dye adsorption on the electron lifetime of ZnO nanorods. Overall, this study highlights the potential of multi-step growth of ZnO nanorods to optimize the performance of dye-sensitized solar cells by tuning their morphology and surface properties.
1. Introduction
Dye-sensitized solar cells (DSSCs) are a promising new solar cell technology that offers several advantages over traditional silicon solar cells. DSSCs exhibit superior power generation capabilities under low light conditions compared to conventional silicon solar cells. Low manufacturing cost: DSSCs require simpler materials and manufacturing processes compared to traditional silicon solar cells, resulting in lower manufacturing costs. Moreover, the fabrication of DSSCs does not require high temperatures or pressures, making them less environmentally impactful. Excellent spectral selectivity: DSSCs can absorb visible and near-infrared light and convert it into electricity, exhibiting better spectral selectivity than traditional silicon solar cells. As a result, DSSCs can generate electricity even under low light conditions, making them suitable for indoor lighting and cloudy weather applications. Strong flexibility: DSSCs can utilize lightweight, thin, and flexible substrates as electrodes, providing excellent flexibility. This enables DSSCs to be applied in fields such as wearable electronics and flexible electronics, with the potential for further performance improvement and expanded application possibilities [1,2].
One of the most commonly used electron transport materials in DSSCs is TiO2. It possesses high stability, a wide bandgap (~3.2 eV) [3], and a porous structure [4], which can enhance its surface area and photocatalytic activity [5]. TiO2 is typically deposited as a thin film on the electrode and plays a crucial role in transferring the generated electrons from the photoconversion process to the external circuit. When photons enter the dye molecules, the dye molecules convert the photons into electrons, which are then transferred to the surface of TiO2. The electrons on the surface of TiO2 are transported to the electrode, generating electric current. The adsorption of dye molecules on the surface of TiO2 enhances light absorption and photovoltaic conversion efficiency. However, TiO2 exhibits low electron transfer efficiency, leading to carrier losses in the transport process. This results in lower efficiency of DSSCs as they cannot fully utilize all available light energy [6]. Additionally, TiO2 is prone to degradation when exposed to prolonged UV radiation. This degradation causes a decrease in the efficiency of DSSCs over time, requiring maintenance and replacement. Moreover, TiO2 is relatively expensive, which increases the production cost of DSSCs. Therefore, many studies have explored the replacement of TiO2 with zinc oxide (ZnO) as the electron transport layer. ZnO possesses a similar bandgap to TiO2, exhibiting good electron transport properties and an appropriate electron transport gap [7,8]. It also demonstrates excellent chemical stability and is less susceptible to degradation from light exposure and moisture. Consequently, ZnO can serve as a stable electron transport layer in DSSCs over an extended period.
ZnO nanostructures can be prepared through various methods, including the chemical solution method, chemical vapor deposition, sol–gel synthesis, spray deposition, and electrodeposition [9,10,11,12]. Among these methods, the chemical solution method is particularly noteworthy. The main reason is that the chemical solution method allows for precise control of the morphology, size, and density of ZnO nanostructures by adjusting the reaction conditions such as solution concentration, reaction time, and temperature [13,14,15]. This precise control enables tailoring of the performance of ZnO nanostructures to meet specific application requirements. Furthermore, the chemical solution method enables uniform growth of ZnO nanostructures on the substrate surface and can achieve uniform growth over large-area substrates, offering excellent uniformity. Additionally, by controlling the chemical reaction conditions, high-purity ZnO nanostructures can be obtained, thereby enhancing their optical and electrical properties and generating high-quality ZnO nanostructures. In various applications, zinc oxide nanorods (ZnO NRs) are commonly utilized as photoelectrodes in dye-sensitized solar cells. Typically, a single-step growth approach is adopted, involving the utilization of a singular chemical solution for the growth reaction [16,17,18]. While this method facilitates the production of elongated nanorods with heightened dye adsorption capabilities, it often faces limitations due to inadequate reactants present within a solitary chemical solution, thereby affecting nanorod growth [19]. Consequently, our study not only employs the chemical solution method for cultivating zinc oxide nanorods as photoelectrodes but also integrates a multi-step growth technique. This method encompasses changing the chemical solution before the reactants in a single solution are completely depleted, thereby enabling the ongoing growth of nanorods. The objective is to examine the impact of alterations in surface morphology on the attributes of solar cells. Hence, in this study, the chemical solution method was chosen to achieve the multi-step growth of ZnO nanorods, and their surface morphology and crystallinity were analyzed using a field emission scanning electron microscope (FE-SEM) and X-ray diffractometer (XRD). Moreover, the impact of the length and diameter of ZnO nanorods on dye adsorption and the photovoltaic characteristics of DSSCs was investigated, aiming to enhance the research momentum of ZnO nanorods in DSSCs.
2. Results
Figure 1a–d shows the SEM cross-sectional images of the zinc oxide nanorod growth for the 1-time, 2-time, 3-time, and 4-time samples, respectively. It can be observed that the lengths of the ZnO nanorods for the 1-time, 2-time, 3-time, and 4-time samples are approximately 1.3 μm, 4.5 μm, 5.5 μm, and 6.5 μm, respectively. As the number of chemical solution replacements increases, the length of the ZnO nanorods also increases. Additionally, it can be noted that near the bottom region, shorter and thinner nanorods are grown, and as the number of chemical solution replacements increases, these nanorods gradually elongate. Figure 1e–g shows the SEM top-view images of the ZnO nanorod growth for the 1-time, 2-time, 3-time, and 4-time samples, respectively. It can be observed that as the number of chemical solution replacements increases, the diameter of the ZnO nanorods becomes wider. Furthermore, from the top-view images, it is evident that the surface diameter of the ZnO nanorods in the 3-time and 4-time samples starts to exhibit uneven distribution. Additionally, the 1-time sample has the highest nanorod density, followed by the 2-time and 3-time samples (which have similar densities), while the 4-time sample has the lowest density. From the summarized diameter distribution, the approximate diameters of the ZnO nanorods for the 1-time, 2-time, 3-time, and 4-time samples are 64 nm, 231 nm, 296 nm, and 413 nm, respectively. Additionally, with an increase in the number of growth steps of ZnO nanorods, the specific surface area decreases accordingly. The observed phenomena can be attributed to the continuous consumption of reactants required for nanorod growth during the ZnO nanorod growth process. This leads to a decrease in the reactant concentration in the reaction environment, which cannot sustain sufficient ZnO nanorod growth. When a new chemical solution is introduced, it provides an adequate concentration to facilitate further growth of all ZnO nanorods. Additionally, when the ZnO nanorods are too densely packed, they may undergo fusion during growth.
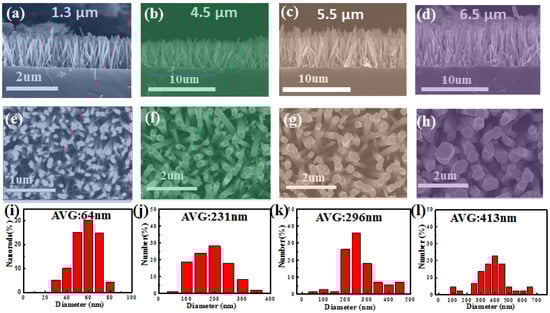
Figure 1.
SEM images of ZnO NRs with different multi-step growth times are shown in the figure. (a–h) depict the cross-section and top-view SEM images of ZnO NRs for the multi-step growth times of one, two, three, and four, respectively; (i–l) represent the diameter size distribution.
Figure 2a shows the XRD measurement results of the zinc oxide nanorods for the 1-time, 2-time, 3-time, and 4-time samples. It is evident that all samples exhibit a prominent ZnO(002) peak, and the peak intensity increases with the length of the nanorods. This indicates that, even with the replacement of the chemical solution, the ZnO nanorods primarily grow along the (002) plane. Furthermore, the full width at half maximum (FWHM) of the ZnO nanorods’ (002) XRD peak is nearly 0.28 for all samples. This implies that the quality of the ZnO nanorods is similar, and the main variation in this study is attributed to the differences in surface morphology. To further understand the influence of ZnO nanorod length and diameter on dye adsorption, the dye adsorption measurement shown in Figure 2b was performed.
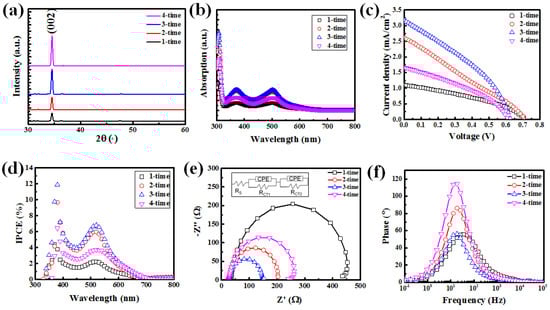
Figure 2.
(a) XRD spectrum and (b) optical absorption spectrum of N−719 dye for the 1−time, 2−time, 3−time and 4−time specimens. (c) J−V measurements underAM1.5 G (100 mA/cm2) and (d) IPCE spectra of DSSCs with ZnO NRs for various multi-step growth times. EIS of ZnO NRs’ dye-sensitized solar cells with different multi-step growth times. (e,f) Nyquist and Bode phase plots. The equivalent circuit of this study is shown in the inset of (e).
In this experiment, the 1-time, 2-time, 3-time, and 4-time samples of zinc oxide nanorods were first immersed in a 0.01 mM concentration of N-719 dye solution for one hour at room temperature to allow dye adsorption. Subsequently, the ZnO nanorods with adsorbed dye were washed using 5 mL of H2O and a 0.1 mM NaOH solution, which removed the dye adsorbed on the nanorods and dissolved it into the solution. Figure 2b shows a prominent peak around 510 nm, which corresponds to the main absorption band of the N-719 dye. Overall, it can be observed that as the number of chemical solution replacements increases, the dye adsorption capacity of the ZnO nanorods also increases. However, for the 4-time sample, the dye adsorption capacity decreases with further replacements. The reason behind this trend may be attributed to the significantly longer length of the ZnO nanorods in the 2-time and 3-time samples compared to the 1-time sample, while the diameter variation remains relatively insignificant. This leads to noticeable differences in dye adsorption capacity. In the case of the 4-time sample, although the length of the ZnO nanorods is not significantly different from that of the 3-time sample, the widening diameter and the initiation of fusion growth cause a decrease in the volume of the ZnO nanorods’ surface in contact with the dye, resulting in a reduction in dye adsorption.
Figure 2c–f presents the characterization results of dye-sensitized solar cells (DSSCs) composed of the 1-time, 2-time, 3-time, and 4-time zinc oxide nanorod photoelectrodes. Figure 2c shows the J-V curves of the DSSC devices under AM1.5G illumination for the 1-time, 2-time, 3-time, and 4-time samples. Component characteristics are listed in Table 1. The results indicate that as the number of chemical solution replacements increases, the open-circuit voltage (Voc) of the fabricated solar cells decreases. There could be two possible reasons for this phenomenon: First, due to the fusion of nanorods, the penetration of dye into the structure becomes difficult, resulting in non-uniform dye adsorption. This scenario can lead to the generation of non-uniform energy level differences, subsequently inducing Fermi level changes and resulting in a decrease in Voc [20]. The second reason is that with the increase in the length of the zinc oxide nanorods and their fusion, the electrolyte cannot fully penetrate, resulting in a decrease in the Voc of the fabricated dye-sensitized solar cells [21]. In this study, the ZnO NR photoelectrode, cultivated using the multi-step growth method, exhibits a declining trend in specific surface area as the number of growth steps increases. The heightened specific surface area facilitates a greater density of charges from dye loading to infiltrate the ZnO conduction band. This occurrence results in an upward shift of ZnO’s quasi-Fermi level, consequently augmenting the open-circuit voltage. Furthermore, XRD analysis indicates comparable crystal quality. Nonetheless, it is counterintuitive that nanorods with larger surface areas would theoretically display reduced Voc due to surface defects. This observation suggests that other factors may predominantly influence the Voc variation. As for the short-circuit current, with an increasing number of chemical solution replacements, the short-circuit current of the prepared solar cells increases. However, the short-circuit current of the 4-time sample noticeably decreases. This phenomenon may be related to the variation in dye adsorption, which is influenced by the diameter and length of the ZnO nanorods on the photoelectrode. Figure 2d demonstrates that in the wavelength range of 300–800 nm, the incident photon-to-electron conversion efficiency (IPCE) of the devices shows a proportional relationship with the variations in dye adsorption caused by the length and diameter of the ZnO nanorods. This finding is consistent with the results shown in Figure 2b. It is noteworthy that a distinct photocurrent peak is consistently observed around 378 nm in all devices, positioned between the photocurrent peak at approximately 520 nm. This difference in shape compared to the dye absorption spectrum is evident. This additional photocurrent peak is attributed to the light harvesting facilitated by the ZnO nanorods. Electrons within the ZnO conduction band disperse through the ZnO nanorods towards the transparent conductive oxide electrode, while the holes within the valence band are replenished through direct charge transfer from the I3−/I− electrolyte [22]. It is noteworthy that despite the much greater length of the ZnO nanorod photoelectrode in the 4-time sample compared to the 1-time sample, there is no significant difference in the short-circuit current. This is mainly due to the influence of length and diameter on dye adsorption.

Table 1.
Parameters of light current-voltage measurements obtained from DSSC based on different ZnO NRs’ multi-step growth.
Figure 2e presents the electrochemical impedance spectroscopy (EIS) measurement results, showing the Nyquist plots. The Nyquist plots exhibit a small semicircle at high frequency and a large semicircle at low frequency. The inset in Figure 2e illustrates the equivalent circuit used for the analysis, where Rs represents the resistance for electron transfer between the FTO glass and the external circuit, RCT1 is the resistance for electron transfer at the Pt electrode/electrolyte interface, and RCT2 is the resistance for electron transfer at the ZnO nanorod/dye/electrolyte interface [23]. By performing electrochemical impedance analysis and fitting, the impedance values for each interface can be obtained, and the results are listed in Table 2. In this study, the Pt electrodes were prepared with the same parameters, and the electrolyte used was also the same. Therefore, Rs and RCT1 would not differ significantly. The main focus is on investigating the electron transfer resistance at the ZnO nanorod/dye/electrolyte interface, which is represented by RCT2. From the measurements, it is found that the values of RCT2 for the ZnO nanorod photoelectrodes of samples 1-time, 2-time, 3-time, and 4-time are 404 Ω, 169 Ω, 116 Ω, and 222 Ω, respectively. The RCT2 values are inversely proportional to the dye adsorption amount. This can be attributed to the increase in free electrons in the ZnO nanorods when excited by sunlight, resulting in an increase in carrier conductivity and a decrease in resistance.
Table 2.
Electrochemical parameters of DSSCs.
Figure 2f shows the Bode phase plots of the characteristic frequency peaks (1–105 Hz), providing information about the variation in characteristic frequency peaks. The characteristic frequency can be considered as the reciprocal of the electron lifetime (τeff) or recombination lifetime (τr) in the ZnO nanorods [24]. The results are also listed in Table 2. Since the quality of the ZnO nanorods in this study is similar (as observed in the XRD analysis results), the improvement in charge transport resistance leads to longer electron lifetimes, primarily attributed to the difference in dye adsorption amount. Among the samples, the ZnO nanorod photoelectrode of the 3-time sample exhibits the lowest transmission resistance (reduced from 404 Ω to 116 Ω) and the longest electron lifetime (increased from 2.2 ms to 3.9 ms).
3. Materials and Methods
In this study, SnO2:F (FTO) substrate was used as the working electrode substrate. The fabrication process of zinc oxide nanorods can be referenced in various published works [25,26,27]. Initially, zinc acetate dihydrate (Zn(CH3COO)2·2H2O, Showa Chemical Industry Co. Ltd., Tokyo, Japan) and ethanol (C2H5OH, EtOH, Echo Chemical Co. Ltd., Tokyo, Japan) were combined and placed on a hot plate magnetic stirrer at 60 °C for 1 h. Monoethanolamine (C2H7NO, MEA, Acros Organics, Tokyo, Japan) was introduced during the stirring process, and the mixture was continually stirred at 60 °C for 2 h. The molar ratio concentration of Zn(CH3COO)2·2H2O to MEA was 1:1. Subsequently, the solution was allowed to sit at room temperature for 24 h to form a uniformly transparent solution. This solution was then drop-casted onto an FTO substrate, spun at 3000 rpm for 30 s, placed on a hot plate, and maintained at 140 °C for 20 min to facilitate sample drying. This sequence was repeated 6 times, and the final step encompassed annealing the sample in an atmospheric environment at 300 °C for 1 h within an oven, yielding a seed layer with an approximate thickness of 500 nm. For the formulation of the solution to facilitate the growth of zinc oxide nanorods, separate preparations of 100 mL of a 0.03 M zinc nitrate (Zn(NO3)2·6H2O, Sigma Aldrich, Tokyo, Japan) solution and 100 mL of a 0.03 M hexamethylenetetramine (C6H12N4, HMT, Sigma Aldrich, Tokyo, Japan) solution were undertaken (both solutions employed DI water as the solvent). These solutions were combined and stirred at room temperature for 20 min. Following this, the amalgamated solution was transferred into a beaker. Subsequently, the FTO substrate, already coated with the seed layer (with the seed layer facing downward), was immersed within the solution. The beaker was then covered using aluminum foil and positioned in an oven, pre-set at 90 °C for 6 h, to facilitate the growth of zinc oxide nanorods. The reaction can be described as follows:
C6H12N4 + 6H2O → 6HCHO + 4NH3
NH3 + H2O → NH4+ + OH−
Zn2+ + 2OH− → Zn(OH)2
The photo-electrode with 6 h of grown zinc oxide (ZnO) nanorods was designated as the 1-time sample. Subsequently, the same growth conditions were applied to the 1-time sample, and the growth solution was replaced every 12 h. This process was repeated to prepare the 2-time sample (18 h), 3-time sample (30 h), and 4-time sample (42 h).
Following the growth of zinc oxide nanorods, the samples underwent a cleaning process to eliminate surface impurities using deionized water. Subsequently, the samples were positioned on a hot plate and subjected to drying at 100 °C for a duration of 30 min. The resultant samples are illustrated in Figure 3. A dye solution was formulated by combining anhydrous alcohol with cis-bis(isothiocyanato)bis(2,2′-bipyridyl-4,4′-dicarboxylato)-ruthe-nium(II)bis-tetrabutylammonium (N-719 from Taiwan Eternal Chemical Industrial Co., Ltd., Taoyuan, Taiwan) to attain a volume of 100 mL and a concentration of 0.5 mM. The prepared ZnO NR samples were then immersed in the dye solution at room temperature for a duration of 1 h. Following this, the samples underwent rinsing with absolute ethanol to eliminate any un-adsorbed dye.
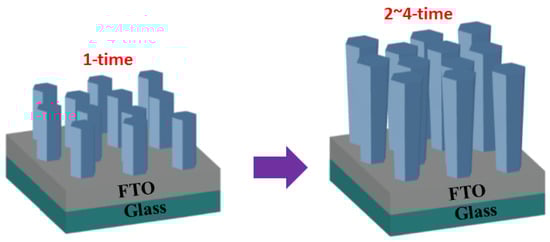
Figure 3.
Experimental schematic diagram.
For the electrode, a solution of 0.05 mM H2PtCl6 was prepared by dissolving it in an acetone/alcohol (9/1, v/v) mixture, followed by subjecting the solution to ultrasonic oscillation for a duration of 1 h to yield a Pt solution. Subsequently, 20 mL of the Pt solution was drop-casted onto the FTO substrate, spun at 3000 rpm for 30 s, and then placed in an oven set at 200 °C within an atmospheric environment for 30 min to undergo sintering. Following this, a polymer resin (Surlyn) with an approximate thickness of 60 µm was positioned between the two electrodes, thereby defining an area of 1 square centimeter. The assembly was transferred to a heating platform at 130 °C, with a weight of 3 kg placed atop it. After being heated for 5 min, the assembly was allowed to cool naturally, resulting in the formation of a sandwich structure. Lastly, the pores were filled with an electrolyte solution (0.5 M 4-tert-butyl-pyridine + 0.05 M I2 + 0.5 M LiI + 0.6 M tetrabutylammonium iodide) to finalize the assembly of the dye-sensitized solar cell. The fabricated DSSC was measured for its photovoltaic conversion efficiency under AM1.5G (100 mW/cm2) illumination using a Keithley 2420 source meter. The electrochemical impedance spectroscopy (EIS) was performed using an Autolab PGSTAT 30 impedance analyzer under AM 1.5G illumination while applying an open-circuit voltage (Voc). Additionally, a sinusoidal voltage with an amplitude of 10 mV was applied between the anode and cathode, and measurements were taken in the frequency range of 0.02 to 100 kHz. The incident photon-to-electron conversion efficiency (IPCE) was measured using a system comprising a 300 W xenon lamp (Newport 66984) as the light source and a monochromator (Newport 74112). The spot size on the sample was approximately 1 mm × 3 mm. The experiments were conducted at room temperature in the laboratory.
4. Conclusions
In this study, a low-temperature chemical solution method combined with multiple growth cycles was employed to prepare ZnO nanorod photoelectrodes with varying lengths and diameters, and their impact on the performance of dye-sensitized solar cells was investigated. The results showed that the quality of the nanorod photoelectrodes did not change with an increase in the number of growth times, but their morphology exhibited noticeable variations, thereby affecting the dye adsorption amount. In addition, the heightened specific surface area facilitates a greater density of charges from dye loading to infiltrate the ZnO conduction band. This occurrence results in an upward shift of ZnO’s quasi-Fermi level, consequently augmenting the open-circuit voltage. This study further revealed a significant influence of dye adsorption amount on the electron lifetime of ZnO nanorods. Based on these findings, the optimal DSSC efficiency achieved in this study was 0.69%. In future research, exploring how to enhance the efficiency of dye-sensitized solar cells through the modulation of nanorod morphology and surface properties can be further investigated.
Author Contributions
Conceptualization, F.-I.L. and S.-Y.K.; methodology, J.-F.Y. and Y.-C.H.; validation, F.-I.L., S.-Y.K. and W.-C.C.; formal analysis, Y.-C.H. and W.-C.C.; investigation, J.-F.Y., W.-C.C. and Y.-C.H.; resources, F.-I.L., S.-Y.K., W.-C.C. and Y.-C.H.; data curation, J.-F.Y.; writing—original draft preparation, J.-F.Y.; writing—review and editing, S.-Y.K.; supervision, S.-Y.K.; project administration, F.-I.L.; funding acquisition, F.-I.L., S.-Y.K., W.-C.C. and Y.-C.H. All authors have read and agreed to the published version of the manuscript.
Funding
This research was funded by the Green Technology Research Center of Chang Gung University, and also by a grant funded by Chang Gung Memorial Hospital (BMRP 956), the Ministry of Science and Technology (MOST111-2112-M-182-001, 110-2221-E-155-053-MY3), and the National Science and Technology Council (NSTC 111-2622-E-182-003).
Data Availability Statement
The data presented in this study are available in article.
Acknowledgments
The authors are grateful for the financial support provided by the MOST of Taiwan.
Conflicts of Interest
The authors declare that they have no known competing financial interest or personal relationships that could have appeared to influence the work reported in this paper.
References
- Luo, B.; Ye, D.; Wang, L. Recent Progress on Integrated Energy Conversion and Storage Systems. Adv. Sci. 2017, 4, 1700104. [Google Scholar] [CrossRef] [PubMed]
- Pu, X.; Song, W.; Liu, M.; Sun, C.; Du, C.; Jiang, C.; Huang, X.; Zou, D.; Hu, W.; Wang, Z.L. Wearable Power-Textiles by Integrating Fabric Triboelectric Nanogenerators and Fiber-Shaped Dye-Sensitized Solar Cells. Adv. Energy Mater. 2016, 6, 1601048. [Google Scholar] [CrossRef]
- Xie, W.; Li, R.; Xu, Q. Enhanced photocatalytic activity of Se-doped TiO2 under visible light irradiation. Sci. Rep. 2018, 8, 8752. [Google Scholar] [CrossRef]
- McFarland, E.W.; Tang, K. A photovoltaic device structure based on internal electron emission. Nature 2003, 421, 616–618. [Google Scholar] [CrossRef]
- Pavasupree, S.; Ngamsinlapasathian, S.; Nakajima, M.; Suzuki, Y.; Yoshikawa, S. Synthesis, characterization, photocatalytic activity and dye-sensitized solar cell performance of nanorods/nanoparticles TiO2 with mesoporous structure. J. Photochem. Photobiol. A Chem. 2006, 184, 163–169. [Google Scholar] [CrossRef]
- Wei, H.; Luo, J.; Li, S.; Wang, L. Revealing the Origin of Fast Electron Transfer in TiO2-based Dye-Sensitized Solar Cells. J. Am. Chem. Soc. 2016, 138, 8165–8174. [Google Scholar] [CrossRef] [PubMed]
- Davis, K.; Yarbrough, R.; Froeschle, M.; White, J.; Rathnayake, H. Band gap engineered zinc oxide nanostructures via a sol-gel synthesis of solvent driven shape-controlled crystal growth. RSC Adv. 2019, 9, 14638. [Google Scholar] [CrossRef]
- Nagaraj, G.; Senthil, R.A.; Ravichandran, K. Firmness and bandgap engineered anatase TiO2 nanoparticles for enhanced visible light photocatalytic activity. Mater. Res. Express 2019, 6, 095049. [Google Scholar] [CrossRef]
- Minegishi, K.; Koiwai, Y.; Kikuchi, Y.; Yano, K.; Kasuga, M.; Shimizu, A. Growth of p-type Zinc Oxide Films by Chemical Vapor Deposition. Jpn. J. Appl. Phys. 1997, 36, L1453. [Google Scholar] [CrossRef]
- Gal, D.; Hodes, G.; Lincot, D.; Schock, H.W. Electrochemical deposition of zinc oxide films from non-aqueous solution: A new buffer/window process for thin film solar cells. Thin Solid Film 2000, 361, 79–83. [Google Scholar] [CrossRef]
- Chaturvedi, N.; Swami, S.K.; Kumar, A.; Dutta, V. Role of ZnO nanostructured layer spray deposited under an electric field in stability of inverted organic solar cells. Sol. Energy Mater. Sol. Cells 2014, 16, 74–82. [Google Scholar] [CrossRef]
- Reddy, N.K.; Devika, M.; Hahn, Y.B. Excellent enhancement in the device performance of nitrogen plasma treated ZnO nanorods based diodes. Nano Converg. 2014, 1, 26. [Google Scholar] [CrossRef]
- Laila, I.K.R.; Mufti, N.; Maryam, S.; Fuad, A.; Taufiq, A.; Sunaryono. Synthesis and Characterization of ZnO Nanorods by Hydrothermal Methods and Its Application on Perovskite Solar Cells. J. Phys. Conf. Ser. 2018, 1093, 012012. [Google Scholar] [CrossRef]
- Alshehri, N.A.; Lewis, A.; Pleydell-Pearce, R.C.; Maffeis, T.G.G. Investigation of the growth parameters of hydrothermal ZnO nanowires for scale up applications. J. Saudi Chem. Soc. 2018, 22, 538–545. [Google Scholar] [CrossRef]
- Lai, F.I.; Yang, J.F.; Kuo, S.Y. Efficiency Enhancement of Dye-Sensitized Solar Cells’ Performance with ZnO Nanorods Grown by Low-Temperature Hydrothermal Reaction. Materials 2015, 8, 8860–8867. [Google Scholar] [CrossRef]
- Akshaya Kumar, A.; Naveen Kumar, S.K.; Aniley, A.A.; Fernandez, R.E.; Bhansali, S. Hydrothermal Growth of Zinc Oxide (ZnO) Nanorods (NRs) on Screen Printed IDEs for pH Measurement Application. J. Electrochem. Soc. 2019, 166, B3264. [Google Scholar] [CrossRef]
- Phromyothin, D.; Phatban, P.; Jessadaluk, S.; Khemasiri, N.; Kowong, R.; Vuttivong, S.; Pornthreeraphat, S.; Chananonnawathorn, C.; Horphathum, M. Growth of ZnO nanorods via low temperature hydrothermal method and their application for Hydrogen production. Mater. Today Proc. 2017, 4, 6326–6330. [Google Scholar] [CrossRef]
- Du, J.; Zhu, Q.; Teng, F.; Wang, Y.; Lu, N. Ag nanoparticles/ZnO nanorods for highly sensitive detection of small molecules with laser desorption/ionization mass spectrometry. Talanta 2019, 192, 79–85. [Google Scholar] [CrossRef]
- Chae, Y.J.; Park, J.T.; Koh, J.K.; Kim, J.H.; Kim, E. All-solid, flexible solar textiles based on dye—Sensitized solar cells with ZnO nano-rod arrays on stainless steel wires. Mater. Sci. Eng. B 2013, 178, 1117–1123. [Google Scholar] [CrossRef]
- Lim, J.; Kwon, Y.S.; Park, S.H.; Song, I.Y.; Choi, J.; Park, T. Thermodynamic Control over the Competitive Anchoring of N719 Dyeon Nanocrystalline TiO2 for Improving Photoinduced Electron Generation. Am. Chem. Soc. 2011, 27, 14647–14653. [Google Scholar]
- Jadhav, N.A.; Singh, P.K.; Rhee, H.W.; Pandey, S.P. Effect of Structure Texture and Morphology Modulation on Efficiency of Dye sensitized Solar Cells. Int. J. Electrochem. Sci. 2014, 9, 5377–5388. [Google Scholar] [CrossRef]
- Pasquier, A.D.; Chen, H.; Lu, Y. Dye sensitized solar cells using well-aligned zinc oxide nanotip arrays. Appl. Phys. Lett. 2006, 89, 253513. [Google Scholar] [CrossRef]
- Yu, H.; Lee, J.W.; Yun, J.; Lee, K.; Ryu, J.; Lee, J.; Hwang, D.; Kim, S.K.; Jang, J. Outstanding Performance of Hole-Blocking Layer-Free Perovskite Solar Cell Using Hierarchically Porous Fluorine-Doped Tin Oxide Substrate. Adv. Energy Mater. 2017, 7, 1700749. [Google Scholar] [CrossRef]
- Kern, R.; Sastrawan, R.; Ferber, J.; Stangl, R.; Luther, J. Modeling and interpretation of electrical impedance spectra of dye solar cells operated under open-circuit conditions. Electrochim. Acta 2002, 47, 4213–4225. [Google Scholar] [CrossRef]
- Idiawati, R.; Mufti, N.; Taufiq, A.; Wisodo, H.; Laila, I.-K.-R.; Fuad, A.; Sunaryono. Effect of Growth Time on the Characteristics of ZnO Nanorods. IOP Conf. Ser. Mater. Sci. Eng. 2017, 202, 012050. [Google Scholar] [CrossRef]
- Foo, K.L.; Hashim, U.; Muhammad, K.; Voon, C.H. Sol-gel synthesized zinc oxide nanorods and their structural and optical investigation for optoelectronic application. Nanoscale Res. Lett. 2014, 9, 429. [Google Scholar] [CrossRef]
- Shah, D.K.; KC, D.; Shaheer Akhtar, M.; Kim, C.Y.; Yang, O.B. Vertically Arranged Zinc Oxide Nanorods as Antireflection Layer for Crystalline Silicon Solar Cell: A Simulation Study of Photovoltaic Properties. Appl. Sci. 2020, 10, 6062. [Google Scholar] [CrossRef]
Disclaimer/Publisher’s Note: The statements, opinions and data contained in all publications are solely those of the individual author(s) and contributor(s) and not of MDPI and/or the editor(s). MDPI and/or the editor(s) disclaim responsibility for any injury to people or property resulting from any ideas, methods, instructions or products referred to in the content. |
© 2023 by the authors. Licensee MDPI, Basel, Switzerland. This article is an open access article distributed under the terms and conditions of the Creative Commons Attribution (CC BY) license (https://creativecommons.org/licenses/by/4.0/).