1. Introduction
As part of climate change mitigation, fossil fuel transportation demands can be substituted with biomass-derived biofuels. The development and use of biomass resources, as well as platform chemicals derived from biomass, has been considered an alternative substitute to fossil fuels in the face of increasing energy demands and climate change [
1]. Due to its carbon neutrality viewpoint, ecological, and economic sustainability, renewable biomass has attracted considerable attention for conversion into biofuels and chemicals. In the pursuit of sustainable alternatives to petroleum-based fuels and chemicals, it is becoming more important to convert lignocellulosic biomass into biofuels and platform chemicals. Furfural, a platform chemical obtained from biomass, may be further processed to provide furfuryl alcohol, 2-methylfuran, furan, tetrahydrofurfuryl alcohol, cyclopentanone, and tetrahydrofurfuryl alcohol [
2,
3,
4,
5]. As one of the most promising lignocellulosic biomass platform molecules, furfural is derived from hemicellulose by hydrolysing and dehydrating xylose, which is C
5 sugar [
6,
7]. The global production of furfural is almost 5,000,000 tons per annum from a variety feedstocks [
8], and it is also a typical oxygenated model compound found in biomass-derived bio-oils. Consequently, biomass-derived compounds contain a high level of oxygen, so selective hydrodeoxygenation (HDO) and hydrogenation have become a primary objective in most research studies.
It is difficult to control the selectivity of the products in furfural hydrogenation because of many possible reactions; for example, hydrogenolysis of C=O bonds, decarbonylation, and hydrogenation of C=O bonds or furan rings [
9,
10]. Catalytic hydrogenation of furfural to 2-methylfuran can be performed in either the gas or the liquid phase. In comparison with gas-phase hydrogenation of furfural, which requires higher energy consumption due to vaporisation and the harsh reaction temperature that often results in catalyst deactivation [
11], liquid-phase hydrogenation needs only a suitable temperature for reaction. As such, it would be advantageous to develop a solid catalyst capable of hydrogenating liquid furfural efficiently and selectively into 2-methylfuran.
Several value-added products can be produced from furfural that has the furan ring and the −CHO group which are unsaturated C=O and C=C bonds. In the production of 2-methylfuran, the furanic “O” and the double bond of the ring are not affected by selective hydrodeoxygenation (HDO). This involves the selective removal of the oxygen from the C=O side group of the furan while suppressing the competitive ring hydrogenation [
6,
10]. Through hydrogenolysis of C=O bonds, furfural undergoes HDO into 2-methylfuran. Thus, catalyst design and process optimisation can be challenging when it comes to selectively producing 2-methylfuran during a multiproduct reaction of furfural hydrogenation. Hence, a catalyst candidate for this conversion would possess catalytic active sites that are capable of excellent hydrogenation and hydrogenolysis. It is essential to develop a catalyst with appropriate activity, selectivity, and stability to achieve significant selectivity toward 2-methylfuran. The chemical compound 2-methylfuran is crucial to the production of furan compounds, pentanediol, important intermediate for pharmaceuticals, fuel additive, etc. It can also be partly blended with gasoline for engines and has a high octane number, boiling point, and energy density [
6,
12].
Catalytic hydrogenation of furfural to produce either 2-methylfuran or furfuryl alcohol in liquid phase had been explored using the following catalysts: Pt/g-C
3N
4, graphitic carbon nitride nanosheet [
12], NiCoZn@CN [
13], Pt/SiO
2, Pt/ZnO, Pt/MgO, Pt/γ-Al
2O
3, and Pt/CeO
2 [
14], Pt−Sn/SiO
2 [
4], CuZnAl hydrotalcite-like (HTLc) catalyst [
11], Ir/C [
8], Cu/ZrO
2, Pd/ZrO
2, and Cu-Pd/ZrO
2 [
12], Mo
2C [
6], Cu/SiO
2, Cu/Al
2O
3, and Cu/ZnO [
1], and Cu–Co/SiO
2, Cu–Co/H-ZSM5, and Cu–Co/γ-Al
2O
3 [
10]. Consequently, Pd/C, Pt/C, Re/C, Ru/C, Rh/C, Ni/C, and Cu/C catalysts have been used to study the hydrogenation, HDO, and ring opening of furfural [
15]. Also, comprehensive reviews have been published by several authors that discusses recent advances in the catalytic hydrogenation of furfural towards furfuryl alcohol, 2-methylfuran, furan, and other value-added products in terms of different noble metals and non-noble metals catalysts, reaction mechanisms related to the different catalytic materials, and reaction conditions [
5,
16]. However, most studies focus on catalysts that are selective toward furfuryl alcohol product. On one hand, the chemisorption of aromatic compounds and produced water from HDO reactions usually deactivate most of these support materials [
17]. Noble metals and bimetallic catalysts, on the other hand, are prohibitively expensive coupled with deactivation, limiting their industrial scale and widespread practical applicability. Thus, hydrogenation and HDO of oxygenate model compounds of bio-oil could become more cost effective and sustainable if biochar (BC), which is one of the by-products of biomass pyrolysis, can be recycled for catalyst support. It is also important to note that pristine BC, which is derived from biomass via pyrolysis, has certain constraints in the pore structure [
18], which limits mass transport during reactions. Thus, catalysis may be improved by synthesising highly mesoporous BC as catalyst support by increasing surface area and pore structure, which improves active metal dispersion. Studies on BC revealed that it has a relatively moderate porosity and surface area and possesses mineral elements such as K, Ca, and P, and functional groups on the surface [
19,
20].
In general, hydrogenation, HDO, and hydrogenolysis of the phenol, aldehyde, and methoxy groups of typical bio-oil model compounds are possible with the application for Ni-based catalysts. Therefore, a catalyst for furfural hydrogenation is developed using nickel and BC combined. Wet impregnation was used to immobilise Ni nanoparticles on mesoporous BC support. In this study, the mesoporosity of BC is enhanced through chemical modification using an acidic solvent, sulfuric acid (H
2SO
4). Through sulfuric acid treatment, the BC support material is tuned to improve the catalyst’s textural attributes, including surface area, mesoporosity, and pore volume. The objective is to enhance mass transport of reactants and increase specific surface area to improve the dispersion of nickel nanoparticles, and consequently catalyst performance. In our previous work, using Fourier-transform infrared spectroscopy (FTIR) technique, it was found that the surface of the BC contains functional groups such as the hydroxyl OH-group, carboxylic acids –COOH, –C–O stretching of cellulose, and C=C of aromatic systems [
21]. These surface functional groups could help improve metal–support interaction. To model the kinetics of this catalyst, a Langmuir−Hinshelwood−Hougen−Watson (LHHW) kinetic model for hydrogenation or HDO of bio-oil model compounds has been proposed for different catalysts based on earlier research works; e.g., vanillin, 1-heptyne and furfural substrates were applied [
22,
23,
24,
25]. These assume a single or dual nature of adsorption sites and a surface reaction between a partly hydrogenated furfural species and a dissociative adsorbed hydrogen. Using a batch reactor, 2-methylfuran is produced by liquid-phase catalytic hydrogenation of furfural utilising tetralin as a solvent over nickel supported on sulfuric acid modified biochar catalysts. The objective of this work is to develop a kinetic model of furfural hydrogenation into 2-methylfuran bespoke to the prepared Ni/BC catalyst. Thus, bio-oil catalytic upgrading with Ni/BC includes significant cost savings over previous catalysts, promotes circular economy, and is sustainable with a comparative performance to previous catalysts. The novelty of the study lies in the development of renewable and cost-effective catalysts for hydrodeoxygenation and hydrogenation of bio-oils. The construction of more mesopores within biochar by acid activation is needed to improve surface area, enhance metal nanoparticle dispersion, and increase catalytic activity and selectivity. Thus, circular economy and sustainability in the field of bio-oil upgrading can be achieved by activating biochar from the pyrolysis step and using it as a catalyst support. This study shows that the developed Ni/BC catalyst provides a cost effective and efficient means of hydrogenating furfural into 2-methylfurfuran.
2. Results and Discussion
A comparison of porosimetry properties of biochar after sulfuric acid treatment is shown in
Table 1. As a result of sulfuric acid treatment, the biochar gains more microporous (less than or equal to 2 nm) and mesoporous (2 nm to 50 nm) pores, and an increase is observed in pore volume for pore sizes greater than 5 nm, 2–5 nm, and smaller than 2 nm. In sulfuric acid-treated biochar, there are 7 times more micropores than in the biochar received, while the number of mesopores is 3.2 times greater. This suggests that sulfuric acid creates more micropores and mesopores as a result of the reaction with O-containing species in the biochar. Due to this, sulfuric acid-treated biochar has 4.7 times the surface area of as-received biochar. However, the mean pore diameter of as-received biochar is higher than that of sulfuric acid-treated one. The modified biochar is identified as Type IV isotherm based on the adsorption–desorption hysteresis patterns.
In previous study, a detailed characterisation of Ni/BC catalysts was reported [
21]. The developed Ni/BC catalyst characteristics reported already include pore size distribution based on nitrogen adsorption technique using Barrett–Joyner–Halenda (BJH) equation; transmission electron microscopy (TEM) report on the distributions of Ni nanoparticles (between 4 nm and 16 nm) over biochar support (
Figure S1); X-ray diffraction (XRD) patterns of the biochar and Ni/BC that revealed characteristic peaks of NiO at 2θ values of 37°, 44.5°, and 64.5°, respectively. Furthermore, a Fourier-transform infrared (FTIR) spectrometer was used to identify a number of complementary functional groups, including a phenolic OH-group at 3400 cm
−1 and carboxylic acids, –COOH, at 2330 cm
−1 (
Figure S2). Additionally, a reduction peak corresponding to the reduction of the impregnated Ni metal and its oxides (NiO) in the catalyst was identified at temperatures between 300 °C and 450 °C using hydrogen temperature-programmed reduction (H
2-TPR); the number and strength of the active sites of the Ni/BC catalyst were determined using carbon dioxide temperature-programmed desorption (CO
2-TPD) (
Figure S3); and thermogravimetric analysis was used to examine the catalysts’ thermal stability. These characterisation results were published in the literature [
21]. The amount of Ni metal incorporated into the biochar was determined using inductively coupled plasma-optical emission spectroscopy (ICP-OES). According to ICP-OES analysis results, the developed Ni/BC catalyst had a metal loading of 14.7 wt% (
Table S1). Details can be found in
Supplementary Information.
2.1. Mass Transport Study
Performance of slurry reactors may be affected by reaction kinetics as well as resistance to gas absorption and mass transport at catalyst particles. Prior to surface catalytic reaction in a slurry reactor (i.e., gas–liquid–solid phase system), several mass transport processes must be taken into consideration, such as gas–liquid mass transfer, liquid–solid mass transfer, and internal pore diffusion combined with surface chemical reactions [
26]. The elimination of transport restrictions, which include impacts of external and internal heat and mass transfer as well as the rate of hydrogen transfer from the gas phase to the liquid phase, is a crucial step in the process of validating quantitative kinetic models [
27]. To guarantee that the data are gathered under kinetically controlled reaction regime, the furfural hydrogenation reaction is carried out in this study under conditions where both external and internal mass transport restrictions are insignificant, as necessary for kinetic model development. Furthermore, due to the tendency of the catalyst to settle, it may be difficult to mix and disperse the catalyst within the solvent depending on catalyst concentration, average particle size, and stirring rate [
28,
29]. Adequate agitation is necessary for maintaining a uniform concentration and temperature throughout the reactor medium, but it must also be sufficient for mass transfer across the thickness of the boundary layer surrounding the catalyst particles [
22,
30]. To ensure the experiments are performed under negligible external mass transfer restrictions, the conversion and 2-methylfuran yield from furfural hydrogenation over the Ni/BC catalyst were examined as a function of mixing, with stirring speeds ranging from 600 to 1200 rpm.
Figure 1 shows the conversion of furfural and the yield of 2-methylfuran as a function of the stirring rate. Notably, the furfural conversion increases as stirring rate increases from 600 rpm to 800 rpm, and then plateaus between 800 rpm and 1200 rpm (
Figure 1a), whereas the yield of 2-methylfuran, and the corresponding rate of furfural hydrogenation, increases as the mixing speed rate increases from 600 rpm 1000 rpm (
Figure 1b).
Nevertheless, the conversion of furfural was not significantly altered by further increase in stirring rate from 1000 rpm to 1200 rpm. Based on this, it appears that the application of a 1000 rpm stirring rate eliminates the external transport restriction in the solid–liquid–gas phase reaction. Consequently, this outcome is consistent with stirring rates that are frequently cited in the literature as being adequate to cause negligible external transport limitations in batch reactors and related reaction investigations [
31,
32,
33]. As a result, data from future experiments were obtained with a mixing rate of 1000 rpm. This is because the mixing achieved by using a stirring rate of 1000 rpm can potentially achieve about 92% conversion and approximately 55% yield of 2-methylfuran, the product of interest in this study.
Internal mass transport constraints, such as pore diffusion or intraparticle diffusion, on the other hand, might influence the overall reaction rate. Hence, the synthesised Ni/BC catalyst powder was sieved into four different particle size ranges, such as >250 µm, 212–250 µm, 106–212 µm, and 106 µm for the purpose of obtaining the particle size that offers negligible internal diffusion limitations. Based on sieved catalyst powder in the following particle size ranges, >250 µm, 212–250 µm, 106–212 µm, and 106 µm, the effect of intraparticle diffusion was studied. A similar approach was published in the literature [
22,
23,
34]. Based on the conversion of furfural, the catalyst particle size range that results in the shortest diffusion length is determined. It is believed that the shorter the diffusion length to the active sites of the catalyst particles, the higher the conversion achieved, which indicates negligible intraparticle diffusion. The influence of catalyst particle size range on the conversion of furfural is shown in
Figure 2. It can be observed that furfural conversion increases as the catalyst particle size decreases from greater than or equal to 250 µm to less than 106 µm. There is no doubt that catalyst particle size impacts the rate of furfural hydrogenation. The conversion approximately plateaus around 96% between 106–212 µm and <106 µm catalyst particles sizes. In fact, when reducing particle size from 106–212 µm to less than 106 µm, the conversion of furfural was not significantly affected. The result suggests that intraparticle diffusion or internal transport constraint are negligible when catalyst particles smaller than 106 µm are used.
As the catalyst particle size decreases, the diffusion path length to the active sites also decreases. The resulting dispersed catalysts are made up of finely divided particles (less than 106 µm), which gives them a very large surface area (353.5 m2 g−1), short diffusion length, and a high mass transfer rate for the catalytic hydrogenation of furfural into 2-methylfuran. Thus, under these conditions (i.e., 1000 rpm and catalyst particle size less 106 µm), rapid hydrogen adsorption is encouraged by the presence of finely divided catalyst particles. This finding led to the usage of catalyst particles smaller than or equal to 106 µm in subsequent studies for the gathering of experimental data for kinetic model development.
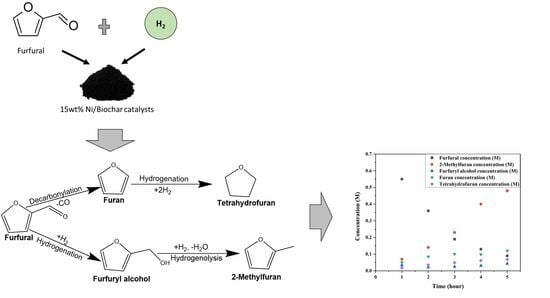
The conversion of furfural and the yields of products based on furfural hydrogenation over the Ni/BC catalyst with particle size less than or equal to 106 µm and a stirring rate of 1000 rpm is shown in
Figure 3. The identified products from the hydrogenation of furfural include furfuryl alcohol, 2-methyl furan, furan, and tetrahydrofuran. The result shows that the catalyst is more selective toward 2-methyl furan, which is the desired product with the highest yield. The reaction scheme can be summarised in
Figure 4 with the identified products, 2-methylfuran, furfuryl alcohol, furan, and tetrahydrofuran. The results suggest that furfuryl alcohol is very quickly transformed into 2-methylfuran. As a result of the catalyst’s hydrogenolysis abilities, furfural (C=O bond) was selectively hydrogenated, followed by cleavage and deoxygenation of the C–OH bond in furfuryl alcohol for the further production of 2-methylfuran. There is also the occurrence of the hydrogenolysis of C=O bonds, decarboxylation and hydrogenation of the C=O bond or the furan ring of furfural which resulted in the other observed products. It should be noted that the gaseous product was not analysed in this study.
The Ni/BC catalyst showed comparable conversion of furfural of about 92% to Mg-Al oxides supported by the Co-Ni bimetallic catalyst reported in the literature [
35]. In comparison to the CuZnAl catalyst that produced a 70% yield of 2-methylfuran [
11], the developed catalyst in this study produced a 60% yield. This result demonstrates the novel and efficient hydrogenation of furfural into 2-methylfurfuran using the developed Ni/BC catalysts.
2.2. Effect of Catalyst Loading on Initial Reaction Rate
Based on the collected concentration data, a plot of concentration as a function of time was produced. The initial rates were estimated by a polynomial fitting approach, differentiated at time zero (t = 0). This approach has been used and reported in many studies [
22,
23,
28,
34,
36]. Conversion into products was investigated as a function of catalyst loading. In
Figure 5, the effect of catalyst loading on initial reaction rates of furfural hydrogenation is presented. It is observed from the graph that initial rate of reaction increases as the amount of catalyst increases. This is because as the amount of catalyst for the reaction increases, the number of active sites available for furfural and hydrogen adsorption and surface reaction increases likewise. Hence, a kinetically controlled regime should result in an increase in reaction rates in proportion to the number of catalytic active sites accessible [
27].
It has been shown that both external and intraparticle diffusion transport constraints are negligible under reaction conditions of catalyst particle size below or equal to 106 µm and stirring rate of 1000 rpm. To validate this finding,
Figure 6 shows the Madon–Boudart test for furfural hydrogenation over a 15 wt% Ni/BC catalyst. According to the Madon–Boudart test, if reactions are carried out with internal transport restriction, the plot of ln
r0 vs. ln (catalyst activity) will have a slope of 0.5, but if reactions are carried out with external transport limitation, it will have a slope of zero [
27]. Catalyst activity in this case is proportional to catalyst quantity, and external mass transfer is negligible. The reason for this is because the rate of the reaction is proportional to the number of catalytic active sites when mass transport restrictions are eliminated. This demonstrates a linear relationship between reaction ln
r0—ln (catalyst activity) due to Ni nanoparticle loadings on the catalyst surface. The correlation line of data plot for ln
r0 vs. ln (catalyst activity) shown in
Figure 6 has a slope of 0.64, which is greater than 0.5, which is an important indicator of internal mass transport limitations. Based on this finding, there is neither mass or heat transport resistance for a stirring rate of 1000 rpm and catalyst particle size of less than or equal to 106 µm.
Under these conditions, the effect of catalyst loading on controlling resistance of gas–liquid interfaces within batch reactors was also studied. The dissolution of hydrogen gas at the gas–liquid interface is described by Henry’s law. Since the initial hydrogen pressure (i.e., 50 bar) was constant in all the experiments, the hydrogen concentration dissolved (
CH) was also constant. The technique of plotting (C
H/
r0) vs. 1/(catalyst loading) was utilised to determine the region of restriction in the gas–liquid interface within the system as detailed in the literature [
37,
38]. The slope signifies a combination of both external mass transfer and internal mass transport resistance at catalyst particles, while the intercept corresponds to the resistance to gas absorption at gas–liquid interfaces [
38]. The result is presented in
Figure 7. Resistance against gas absorption through the liquid film at the gas–liquid interface is represented by the intercept of the plot, which is 0.78 min, and the combined external mass transport restriction and internal pore diffusion restriction at the catalyst particle is 0.022 g min. Hence, the use of a more finely crushed catalyst particle decreases both internal and external mass transport resistances at catalyst particle ≤ 106 µm. This affirms the elimination of external and internal transport resistances under stirring rate 1000 rpm and ≤106 µm; the resistance to absorption is insignificant, and surface reaction between furfural and hydrogen is most likely within the system constraints.
2.3. Power Law Model Based on Initial Rate
Based on
Figure 4, the formation of 2-methylfuran (MF) through furfural (FAL) hydrogenation via furfuryl alcohol (FOL) can be expressed as follows: (FAL→FOL→2MF) [
11]. This suggests that furfuryl alcohol is produced right away from furfural and then converted into 2-methylfuran. The power law kinetic model is based on gathering data for furfural concentration as a function of time due to the intricacy of reaction pathways and difficulties in measuring the intermediate furfuryl alcohol during the hydrogenation process. The experimental data were collected at a constant hydrogen pressure of 50 bar. The effect of hydrogen pressure was not studied. Therefore, the rate of reaction terms of the concentration of furfural consumed per unit can be expressed using Equation (1):
where
r denotes the reaction rate (M min
−1),
k is the rate constant (M
1−n min
−1),
C is the concentration of furfural (M) and
n is the order of reaction.
The initial reaction rates (
r0) were computed using a polynomial fitting technique and then differentiated at time zero (t = 0) based on the plot of concentration as a function of time. To determine reaction rate constant (
k) and order (
n), the plot of natural log of the initial rates (ln
r0) against natural log of initial furfural concentration (ln
C0) was produced for reaction temperatures 200 °C, 220 °C and 240 °C as shown in
Figure 8. The order of reaction is the slope of the plot at each experimental temperature, while the corresponding rate constant is determined from the intercept.
The respective order of reaction (n) at reaction temperatures 200 °C, 220 °C and 240 °C is as follows: 0.42, 0.45 and 0.59, and the rate constants are 0.002695 M0.58 min−1, 0.003462 M0.55 min−1, and 0.005795 M0.41 min−1. The order of reaction is less than one, suggesting it is non-first order. The orders of reaction regarding furfural concentration vary from 0.42 to 0.6. Since the reaction cannot be described by a first-order reaction rate based on furfural initial concentration, the development of a model describing furfural hydrogenation reaction kinetics over the developed catalyst must consider processes occurring on the catalyst surface like adsorption, surface reaction, and desorption.
The Arrhenius equation, which is a thermodynamic function shown in Equation (2), was used to estimate activation energy. The plot of ln(
k) versus 1/T to determine activation energy (
Ea) and pre-exponential factor (
A) is shown in
Figure 9. The result shows that the rate constant increases as the reaction temperature increases from 200 °C to 260 °C. The estimated activation energy (
Ea) is 40.22 kJ mol
−1 and the pre-exponential factor (
A) is 70.26 min
−1,
where
R denotes the universal gas constant 8.314 J K
−1 mol
−1,
Ea is the activation energy (J mol
−1),
A is the pre-exponential factor (min
−1), and
k is the rate constant (M
0.55 min
−1).
2.4. Langmuir–Hinshelwood Kinetic Type Model
The Langmuir–Hinshelwood (L–H) reaction rate model type equations are more adequate than power law to describe the reaction kinetics of furfural hydrogenation over the Ni/BC catalyst. This is because the L–H type rate model considers the active sites and processes such as adsorption, surface reaction, and desorption occurring on the surface of the catalyst that controls the reaction rate. However, previous studies have suggested a Langmuir−Hinshelwood−Hougen−Watson (LHHW) kinetic model for HDO or hydrogenation of bio-oil model compounds including furfural hydrogenation over an active metal supported catalyst that assumes either a single or a dual type of adsorption site and a surface reaction between a partially hydrogenated furfural species and an adsorbed hydrogen [
23,
25,
34,
36]. On the catalyst surface, it is assumed that on S
1 sites, atoms of H are the predominant species, while furfural dominates on S
2 sites. Based on this assumption, the reaction mechanism is illustrated by reaction schemes 1 to 4 for furfural conversion to 2-methylfuran. Typical L–H kinetic models can be invoked, which involves hydrogen dissociatively adsorbing on dual active sites and hydrogen chemisorbed on the same surface reacting with chemisorbed furfural. It has been reported that the most plausible fit is a dual-site mechanism with dissociative adsorption of hydrogen and surface reactions as rate-controlling steps [
36], listed as follows:
- (i)
molecular adsorption of furfural (F), furfuryl alcohol (FOL), and 2-methyl furan (2MF),
- (ii)
dissociative adsorption of hydrogen on the catalyst active site,
- (iii)
during the reaction, the partial pressure of hydrogen can be considered constant due to the excess of hydrogen,
- (iv)
all adsorption sites are equivalent and independent of coverage, and
- (v)
surface reaction is a rate-determining step.
It is believed that hydrogen adsorption onto the catalyst surface occurr dissociatively. Accordingly, Equations (3)–(6) represent the elementary steps taken in determining rate expressions for both competitive and non-competitive adsorption of dissociatively chemisorbed hydrogen (
H2) and furfural (
F). Consequently, all adsorption and desorption sites of the catalysts are equivalent and independent of coverage [
36].
The following rate expressions (Equations (7)–(9)) are derived for the selective hydrogenation of furfural (F) into 2-methylfuran based on dissociation of hydrogen.
Model-I: Competitive adsorption of dissociative
H2 and furfural (
F) during hydrogenation:
Model-II: The model assumed one type of adsorption site (competitive adsorption) and the rate-determining step as a surface reaction between an adsorbed
H and a partially hydrogenated furfural species:
Model-III: Non-competitive adsorption of dissociative H
2 and furfural during hydrogenation. Based on the assumption that
H atoms dominate
S1, and furfural dominates
S2,
where
CH denotes concentration of dissolved hydrogen in the solvent,
CF is the concentration of furfural (mol dm
−3),
ks is the surface reaction rate constant (mol g
−1 min
−1),
kH is the hydrogen adsorption constant (m
3 mol
−1),
kF is the furfural adsorption constant (m
3 mol
−1), and
r is the rate of reaction.
In the literature, the models of the two sites, Model-II and Model-III, have been applied to study furfural hydrogenation over copper dispersed on three forms of carbon, namely activated carbon, diamond and graphitised fibres [
25]. In 2018, the hydrogenation of furfural derived from biomass into 2-methylfuran, which is a fuel additive, was studied over the Cu–Co/Al
2O
3 catalyst using Model-I and Model-II, respectively [
36]. A linearisation of Equations (7)–(9) was conducted to determine the most appropriate model for the hydrogenation of furfural over Ni/BC catalysts. At constant hydrogen pressure of 50 bar (5 MPa), the concentration of dissolved hydrogen gas (
CH) can be determined with the aid of Henry’s law
(CH = KHPH).Therefore, the plot of
and
should be a linear fit to the experimental data. Based on initial reaction rate obtained from the concentration time plots of the experimental data,
Figure 10 shows the linear fits of the models to the data obtained at reaction temperatures 200 °C, 220 °C, and 240 °C.
The coefficient of determination (
R2) value, which represents the proportion of variation in the dependent variable that can be predicted completely from the independent variable, is used to evaluate the extent of linear fits to the initial reaction rate data.
R2 is a range of values between zero and one, and a value close to one implies that the dependent variable can be predicted efficiently based on the independent variable with less error expected. Therefore, based on the linearised fits to the initial rate data, the
R2 values are as follows: Model-I (0.990 (200 °C), 0.998 (220 °C) and 0.988 (240 °C)), Model-II (0.996 (200 °C), 0.999 (220 °C) and 0.995 (240 °C)), and Model-III (0.994 (200 °C), 0.999 (220 °C) and 0.995 (240 °C)). Model fitting and experimental data differ very little, possibly due to the narrow range of
CF0/
r0. Based on
R2 values obtained through the linearised fits to the experimental data as shown in
Figure 10, all three models predict the experimental data with certain degrees of error, but Model-III has higher
R2 values and minimised errors compared to Model-I and Model-II. This suggests that both Model-II and Model-III are more favourable kinetic models to describe the experimental data better than Model-I. Hence, the experimental data are studied using Model-III. It can be concluded that the best match for the experimental data is a dual-site mechanism with hydrogen dissociative adsorption and surface reaction as the rate-controlling step.
2.5. Model Parameter Estimation
The sum of squared error (SSE) function was used for non-linear regression fit of model predictions (Model-III) by determining model parameters through the minimisation of residual sum of square (RSS) objective function shown in Equation (10). The model parameters were estimated by using the optimisation programme for a nonlinear generalised reduced gradient (GRG) solver in Microsoft Excel 2016. The RSS objective function was minimised to determine the model parameters that describe experimental data.
By minimising the RSS objective error function using Microsoft Excel’s GRG solver optimisation programme, kinetic Model-III parameters such as surface reaction rate constant (
kS) and adsorption constants (
KH and
KF) were determined, including heat of adsorption (∆
HH and ∆
HF) and intrinsic activation energy (
Ea).
Table 2 shows the estimated kinetic model parameters for furfural hydrogenation reaction over the Ni/BC catalyst at a constant hydrogen pressure of 50 bar (5 MPa). With
R2 values beyond 95%, the proposed mechanistic model fit the data satisfactorily based on its kinetic model parameters (
Table 2), as well as its correlation coefficients. In consequence, as reaction temperature increases, both rate constant and adsorption constant slightly increase. This indicates an increase in adsorption affinity and rate of reaction.
Figure 11 shows the plot of experimental reaction rates against model predicted rates for Model-III, which indicates a strong agreement between experimental reaction rates and predicted reaction rates. This claim can be supported by a correlation coefficient greater than 99% between the experimental rates and the predicted rates from the model. Hence, a good correlation is found between the predicted values by the model and experimental results. It can be concluded that the experimental results could also be mechanistically explained using Langmuir–Hinshelwood type kinetic models.
The activation energy for the hydrogenation reaction of furfural was determined using Arrhenius Equation (2), which relates reaction rate constant with temperature. Based on linearised Arrhenius equation, the plot of ln
kS vs. 1/T for reaction temperatures from 200 °C to 260 °C is shown in
Figure 12. However, the Van’t Hoff isochore expression (Equation (11)) was used to estimate the enthalpy of adsorption as shown in
Figure 13a,b for both furfural and hydrogen.
Van’t Hoff isochore equation is as follows:
where
R denotes the universal gas constant 8.314 J K
−1 mol
−1,
Ea is activation energy (J mol
−1),
A is the pre-exponential factor,
Kads is the adsorption equilibrium constant, Δ
Hads is the enthalpy changes due to adsorption, and Δ
S is the change in entropy of the system.
Based on the Arrhenius plot, the estimated activation energy is 24.39 kJ mol
−1. It has been found that the apparent energy of activation for the surface reaction is 11.8 kcal mol
−1 (49.4 kJ mol
−1) for furfural hydrogenation reaction over the Cu/SiO
2 catalyst [
39]. The active metals and support material properties can account for the differences. However, activation energy estimates indicate that experimental data were collected in a kinetically controlled regime, because they are lower than typical activation energies. Thus, due to the low activation energy of the reaction over the Ni/BC catalyst, it implies that the reaction proceeds quickly as many reactants possess the required energy. In other words, the Ni/BC catalyst is a material that is added to lower the reaction’s activation energy to speed up the reaction. Catalysis occur since the activation energy is reduced, thus speeding up the reaction. This confirms the conclusion that external and internal mass transport are negligible under the experimental conditions. On the other hand, the enthalpy of adsorption and entropy change for the adsorption of furfural on the active sites of the Ni/BC catalyst are −5.86 kJ mol
−1 and 14.81 J K
−1 mol
−1, respectively, while the values of adsorption of hydrogen enthalpy and entropy change are −11.43 kJ mol
−1 and 12.04 J K
−1 mol
−1. It can be seen from the plots that furfural adsorbs on Ni/BC with a higher heat of adsorption than hydrogen. Compared with hydrogen, furfural shows a stronger adsorption on the catalyst surface. The enthalpy of adsorption shows that heat is released during physisorption adsorption of hydrogen and furfural to the surface of the biochar. Thermodynamically, adsorption is more favourable since it is an exothermic process [
40]. It agrees with the exothermic process involved in adsorption, and similar values have been reported for hydrogen and furfural adsorption [
35]. Notwithstanding, the experimental results obtained for the reaction indicate that at a higher temperature, all components have greater adsorption constant values, which is consistent with the observation (
Table 2).
2.6. Catalyst Reusability
Reusability of catalysts is essential for improving process economics. The reusability of the Ni/BC catalyst was studied by recovering the spent catalyst and reusing the catalysts for four successive furfural hydrogenation reaction cycles. The recovered catalysts were dried at 200 °C for 30 min to remove unreacted furfural, solvent, and products from the catalyst pores, before being used in subsequent experiment. The reusability of the Ni/BC catalyst was studied over four successive cycle reactions at a temperature of 230 °C, initial concentration of 0.39 M, hydrogen gas pressure of 50 bar, catalyst loading pf 0.3 g, stirring rate of 1000 rpm and reaction time of 5 h.
Figure 14 displays changes in conversion and product yields for each reaction cycle. As can be seen from the graph, there is a slight noticeable difference between the first and fourth cycles when it comes to furfural conversion (99% to 90%) and the yield of 2-methyl furan (57% to 54%). the yields of furan and tetrahydrofuran follow the same trend. The catalyst is stable as evidenced by this observation. On the other hand, the yield of furfuryl alcohol increases as the reaction cycle increases from first to fourth cycle. Based on XRD patterns for the catalyst spent in the first cycle experiment reported in a previous publication [
21], the peak positions and intensities of Ni/BC catalysts did not change, which indicates that over the course of reaction time, no phase transformation or deactivation occurred due to furfural hydrogenation. For more insight into the reason for gradual decrease in furfural conversion and 2-methylfuran yield, it is worthwhile to systematically characterise the spent after each reaction cycle.
Regarding the observed decline in furfural conversion and the yield of 2-methyl furan, this occurs possibly due to the reduced strength in the catalyst active sites after successive reaction and drying steps [
32]. This is further reaffirmed by the increasing yield of furfuryl alcohol from first cycle to fourth cycle, signifying that the hydrogenation of furfuryl alcohol to 2-methyl furan is impacted. This can be attributed to the chemisorbed aromatic species (furfural, furan, 2-methyl furan, etc.) on the catalyst active sites after consecutive reaction, which could have adversely impacted the strength since no appropriate regeneration of catalysts was performed before reuse. Additionally, it has been proposed that aromatic molecules that are adsorbed onto the catalyst’s active sites during HDO or the hydrogenation of bio-oil oxygenate model compounds may result in a decrease in the catalyst’s activity in subsequent reaction cycles [
41]. This explains the gradual decrease in the yield of 2-methyl furan and, correspondingly, in the yield of furfuryl alcohol. In contrast, a solvent such as acetone can be used to wash the spent catalyst before drying at 200 °C in order to remove most of the bound aromatics and furans.
2.7. Effect of Acidification Time
In a prior study published in our previous work, it was found that treating the BC with sulfuric acid (H
2SO
4) greatly improved the surface area, pore volume, and mesoporosity [
21]. Therefore, acid treatment of a catalyst could increase reaction rates by improving mass transport and providing more surface area for adsorption and surface reactions. The surface area and porosity of catalysts are believed to increase with increasing acid time (
Table 1).
Figure 15 demonstrates how BC duration in the sulfuric acid affects the catalytic performance of the Ni/BC catalyst in terms of the yield of products and furfural conversion. Based on furfural conversion and 2-methyl furan yield, the acid-treated Ni/BC catalyst outperforms the non-treated (NT) counterpart. This is consistent with the improvement in the physicochemical characteristics of the catalyst observed in prior published work after chemical treatment of the BC [
21,
42,
43]. It has been observed that a sulfuric-activated BC catalyst has excellent mesopores and a high surface area, thereby improving the adsorptive effect and therefore catalytic activity.
Notably, when the sulfuric acid treatment duration of the BC employed in the catalyst development increased from 3 to 9 h, the conversion of furfural and the yield of 2-methyl furan increased slightly. An increase in the yield of furan and tetrahydrofuran can also be observed, along with a decrease in the yield of furfuryl alcohol. In 9 h sulfuric acid treatment of BC, approximately 100% of furfural is converted, and 71% of 2-methyl furan is yielded. Plausible explanation can be attributed to increased mesoporosity of the BC support following acid treatment [
21], resulting in the enhancement of mass transport, activity, and selectivity for 2-methyl furan (
Figure 15). This is supported by the fact that the yield of furfuryl alcohol, a required product for producing 2-methyl furan, diminishes with increasing acid treatment duration. The improvement in catalyst pore size following 9 h of acid treatment can also be favourable for high-molecular-weight hydrocarbon tetralin used as a solvent due to the enhanced intraparticle diffusion. A greater mass transport efficiency favours the kinetic control regime, benefiting adsorption and surface reactions, respectively. It appears that the reaction resulting in pore creation with sulfuric acid of biochar is slow, since sulfuric acid activation time shows significant change in furfural conversion and yield of products.
4. Conclusions
The current study used a chemical activation method to modify BC textural characteristics to achieve a greatly enhanced specific surface area, mesopore structure, and pore volume in comparison to its pristine BC. In this study, sulfuric acid modified BC was used to develop a Ni/BC catalyst that can selectively hydrogenate furfural into 2-methylfuran. In comparison with previous catalysts, Ni/BC is a cost-effective catalyst with comparative performance that enables circular economy, sustainability, and industrial scale application in bio-oil catalytic upgrading. Using a stirring rate of 1000 rpm and a catalyst particle size of less than or equal to 106 µm, both external and intra-particle diffusion became insignificant, ensuring that the experiments were carried out under a kinetic controlled regime.
Three plausible Langmuir–Hinshelwood–Hougen–Watsson (LHHW) kinetic type models, competitive (Model-I), with a competitive adsorption site (Model-II) and a non-competitive adsorption site (Model-III), were screened based on the fact that an R2 value greater than 99% demonstrated that the experimental data were satisfactorily fit to the model. It was shown that the best fit is Model-III, which is a dual-site adsorption mechanism involving furfural adsorption as well as hydrogen dissociative adsorption and surface reactions. Based on the results of four successive experimental studies, the developed Ni/BC catalyst demonstrated excellent stability in terms of furfural conversion (96%) and 2-methylfuran yield (54%) at the fourth experiment compared to 99% and 57% for the first experiment. To gain further insight into the reason for the gradual decline in Ni/BC catalyst performance in terms of furfural conversion and 2-methylfuran yield, it would be beneficial to characterise the spent catalyst after each reaction cycle systematically.


