

Surface Chemical Effects on Fischer–Tropsch Iron Oxide Catalysts Caused by Alkali Ion (Li, Na, K, Cs) Doping

 , ,
, , 

 and
and
Abstract
:1. Introduction
2. Results and Discussion
2.1. SXRD Studies
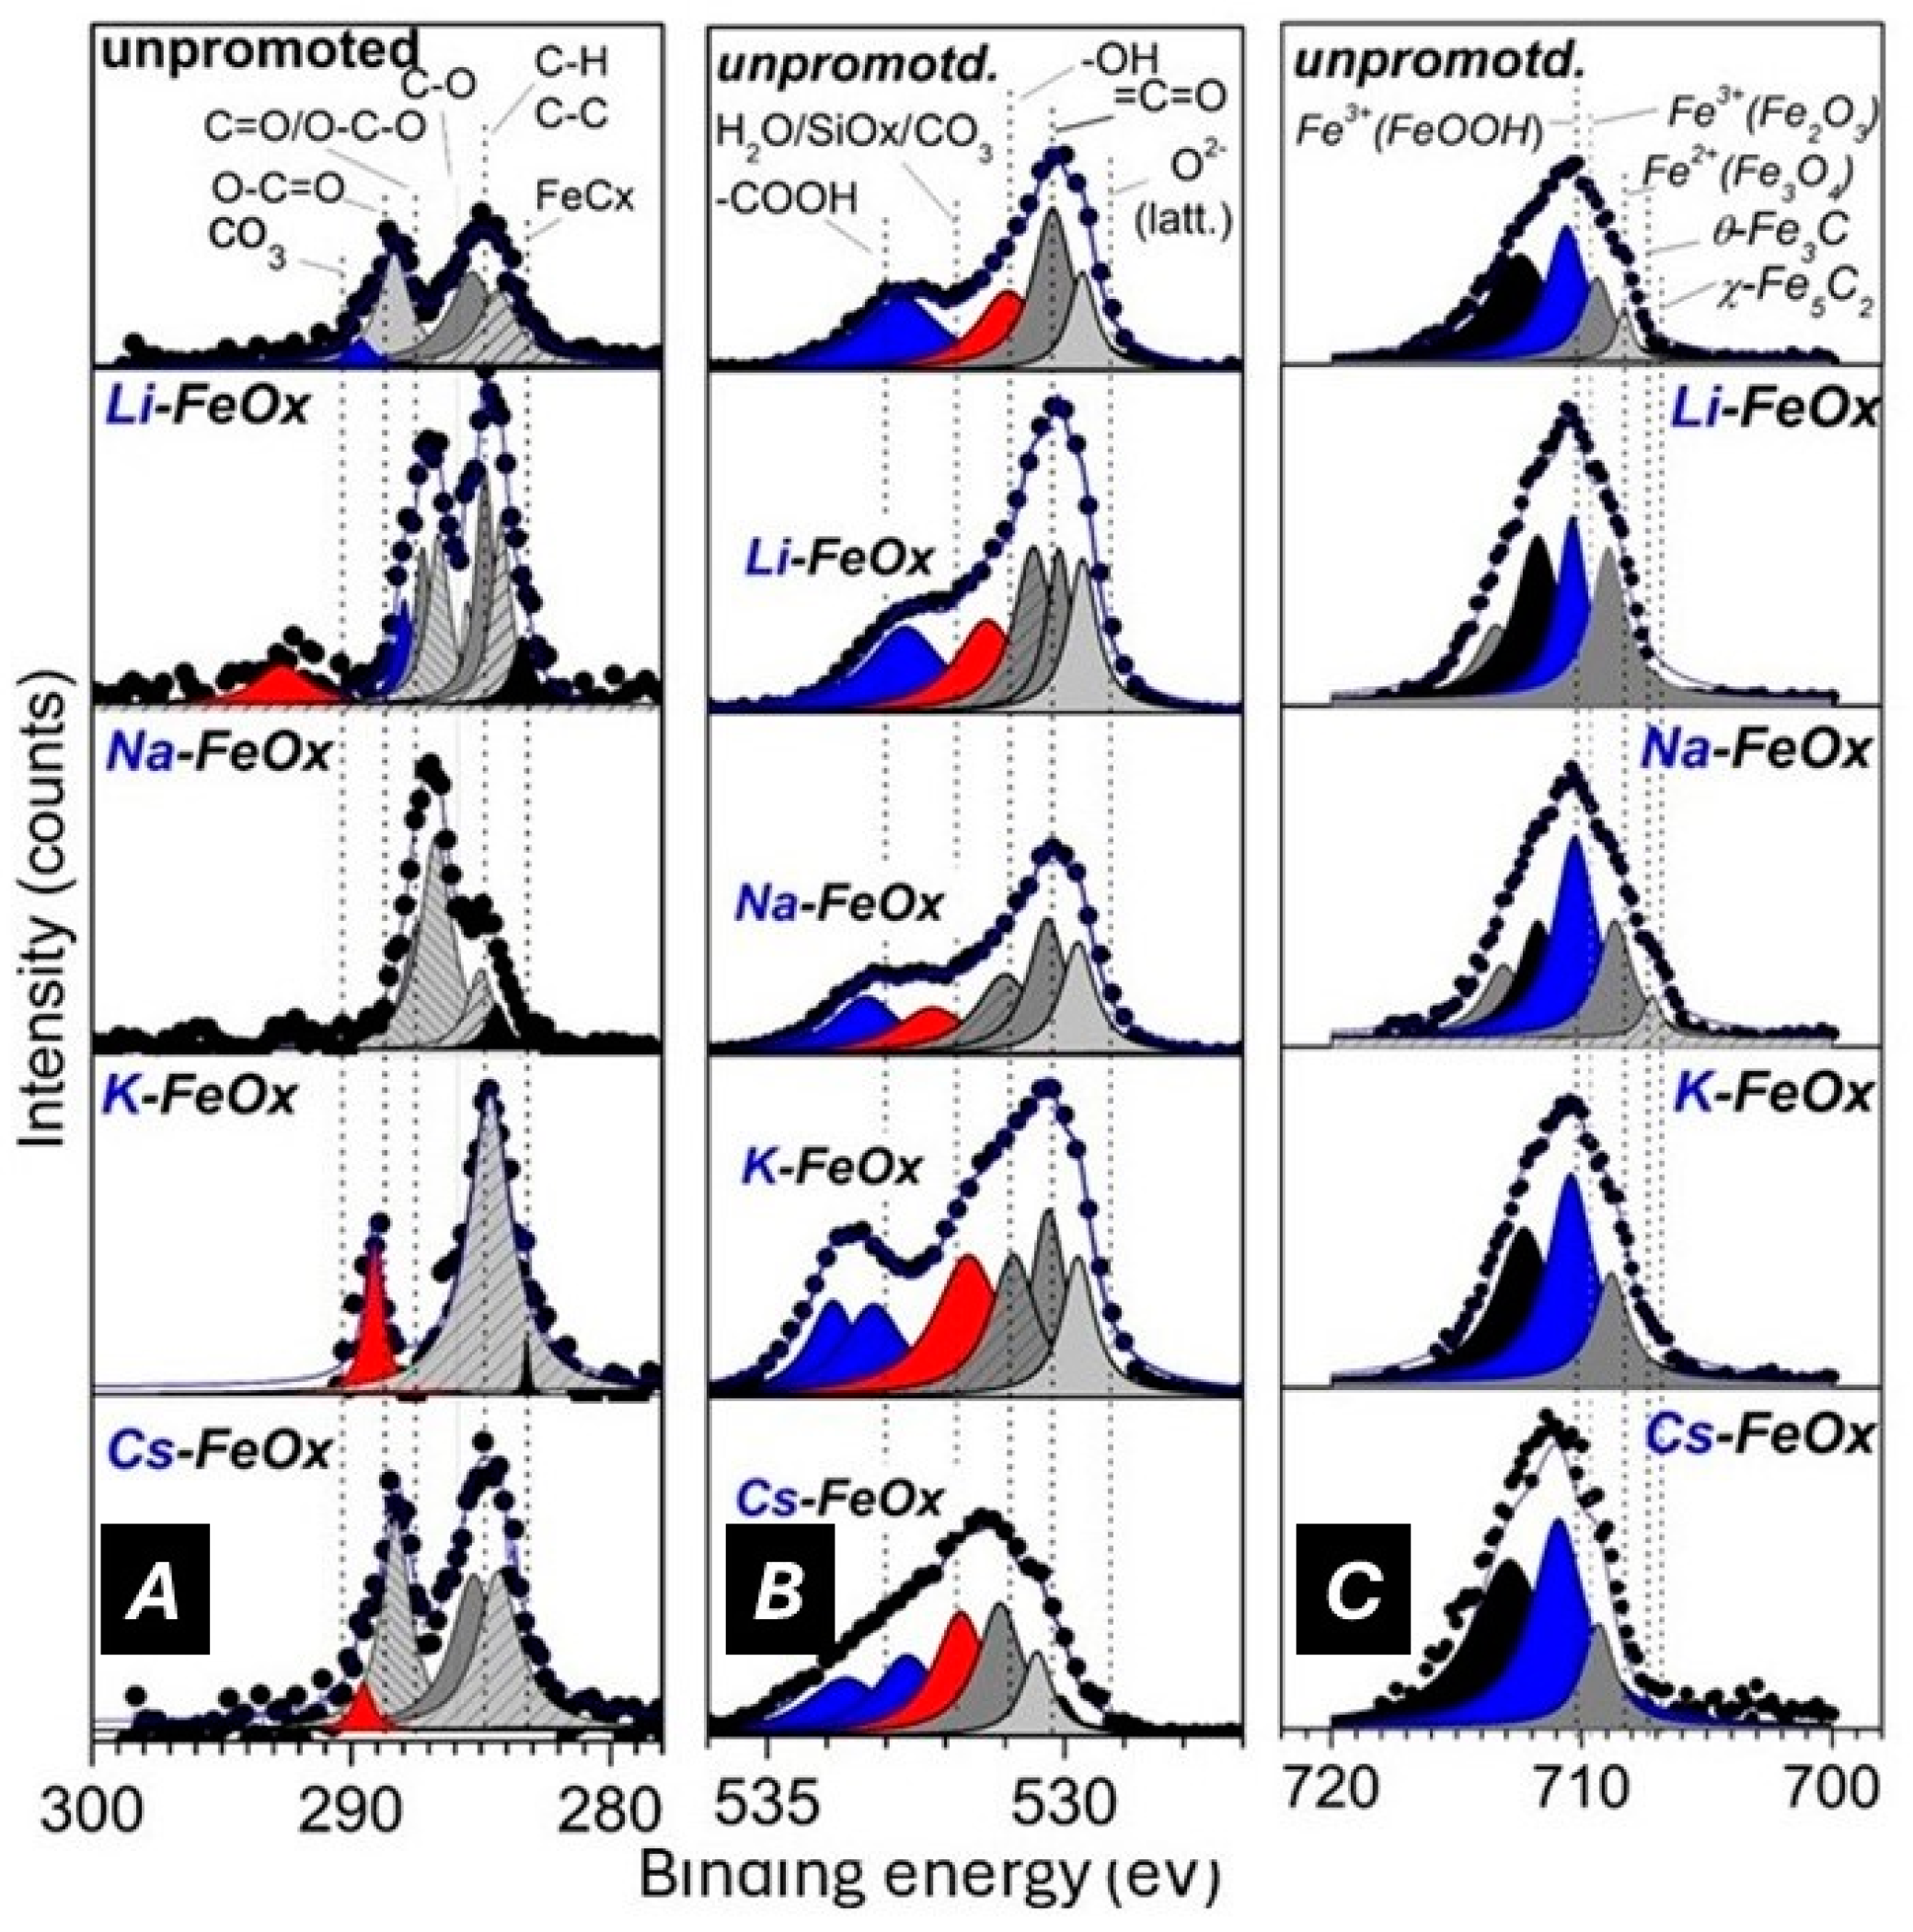
2.2. SXPS Studies
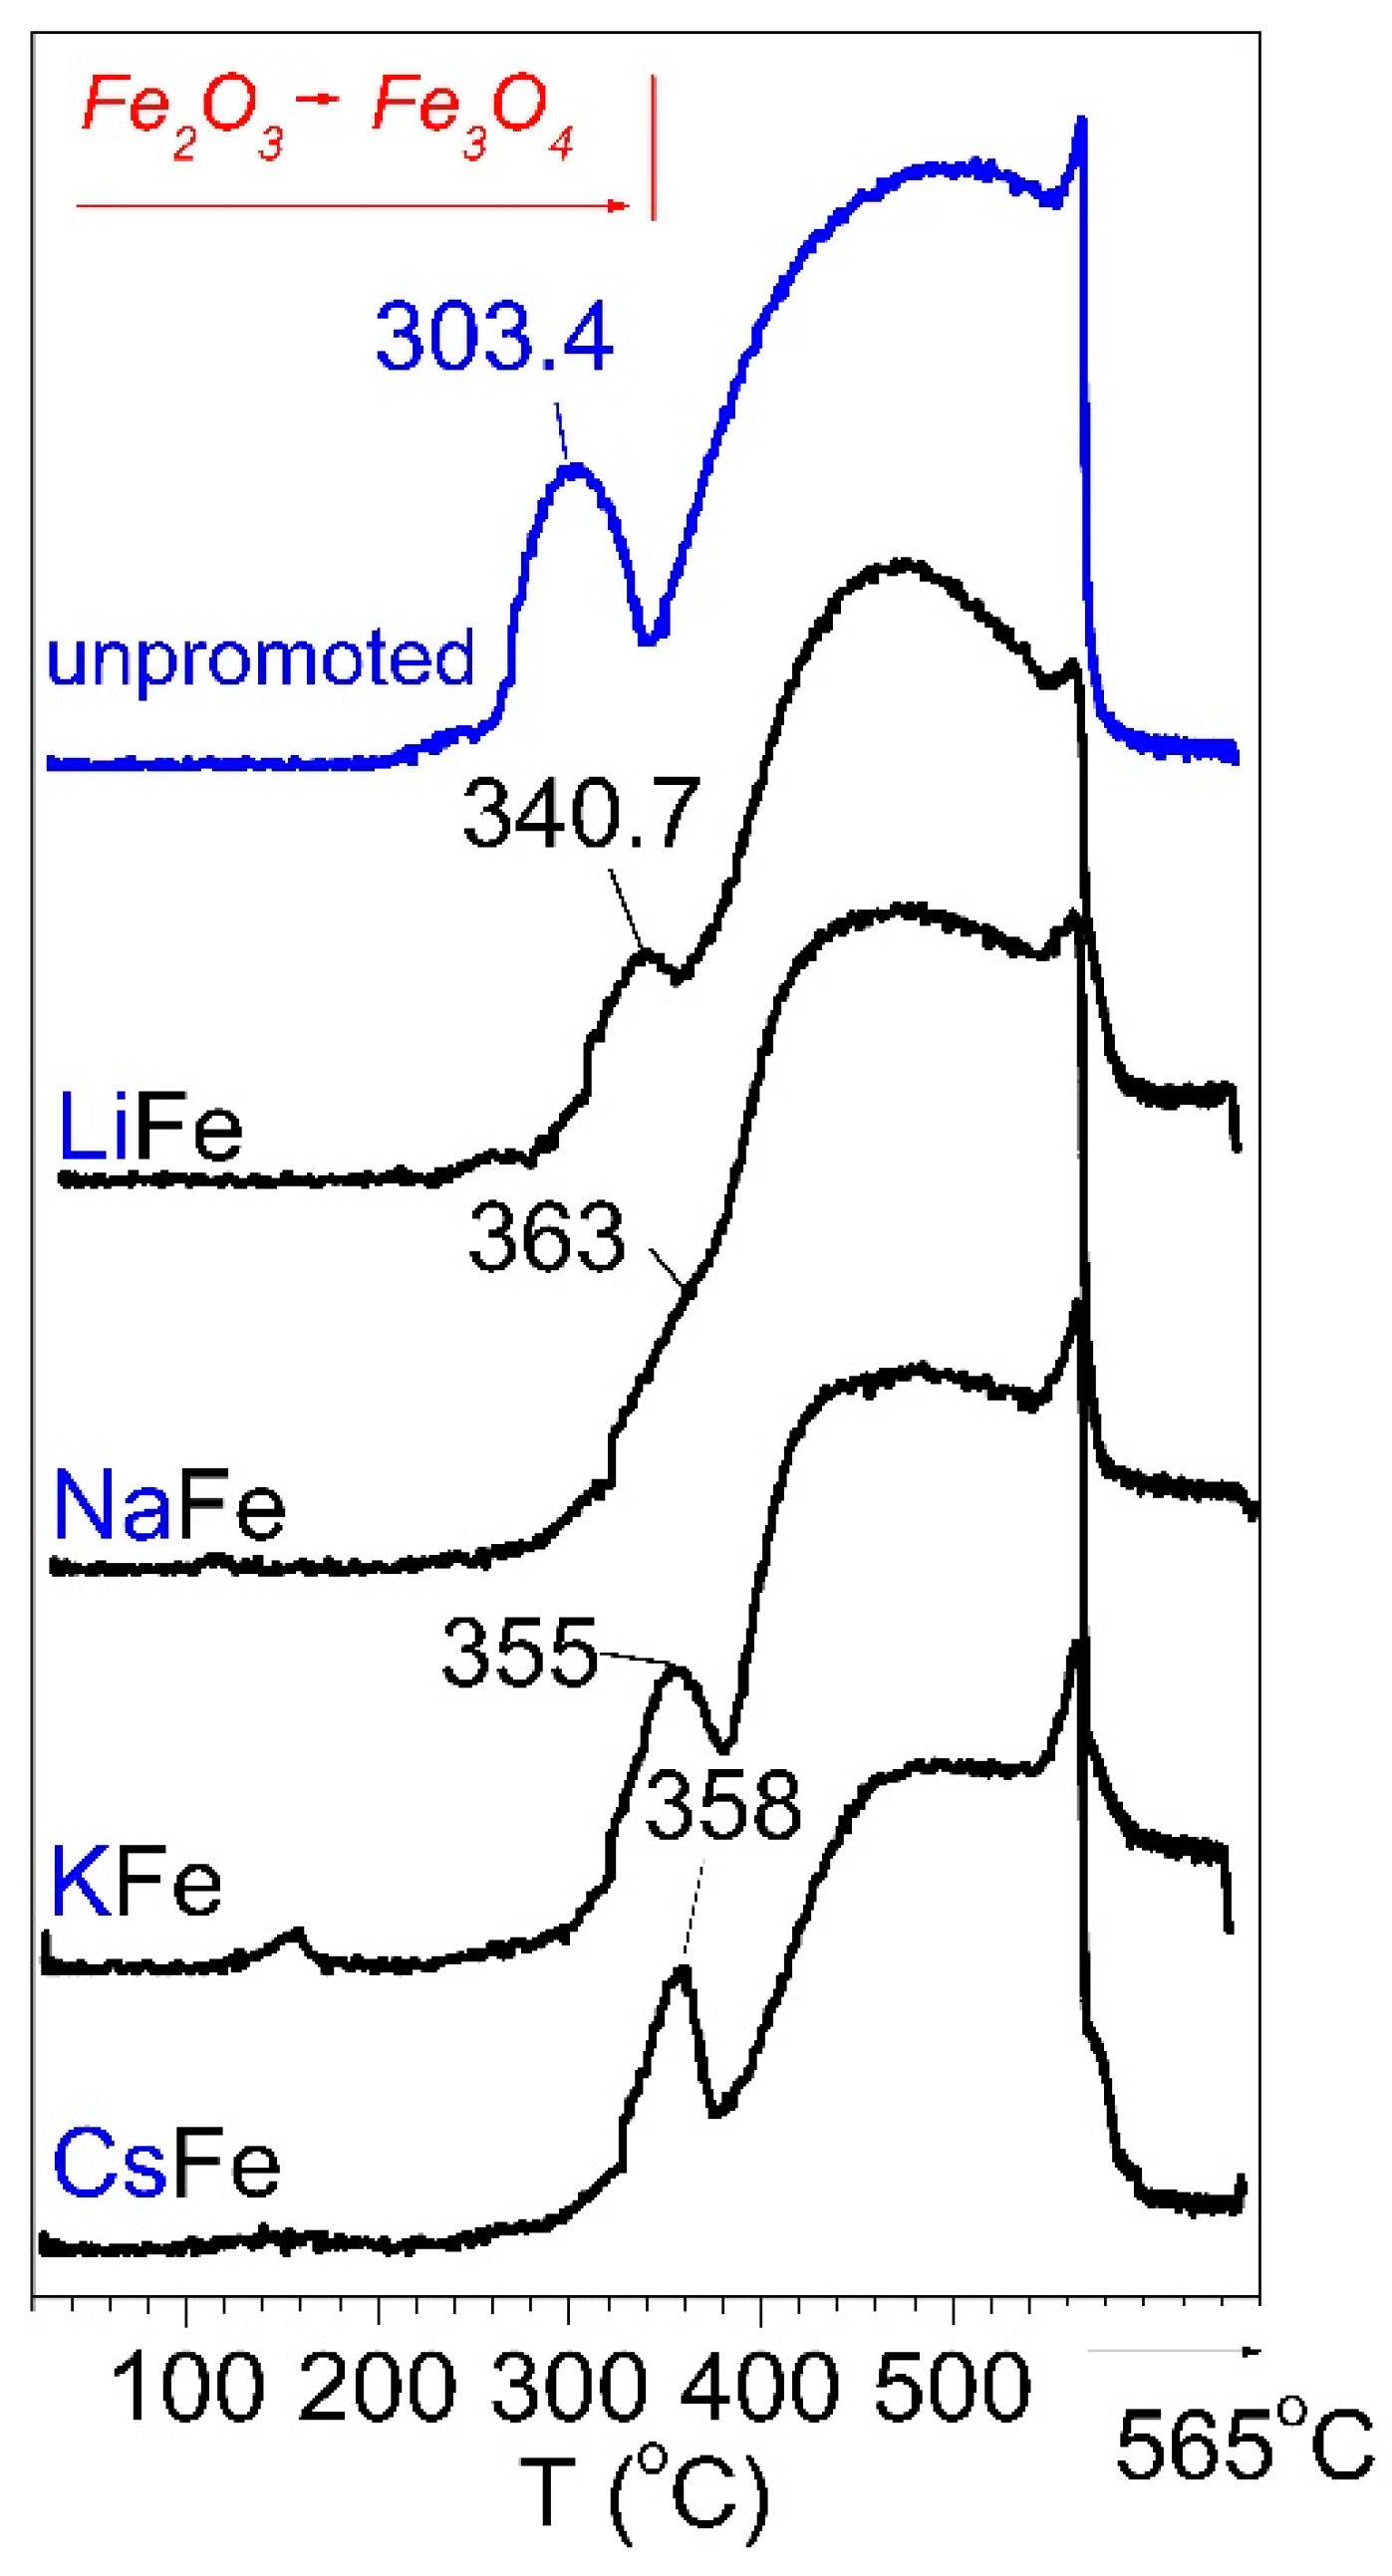
2.3. Temperature Programmed Reaction Studies
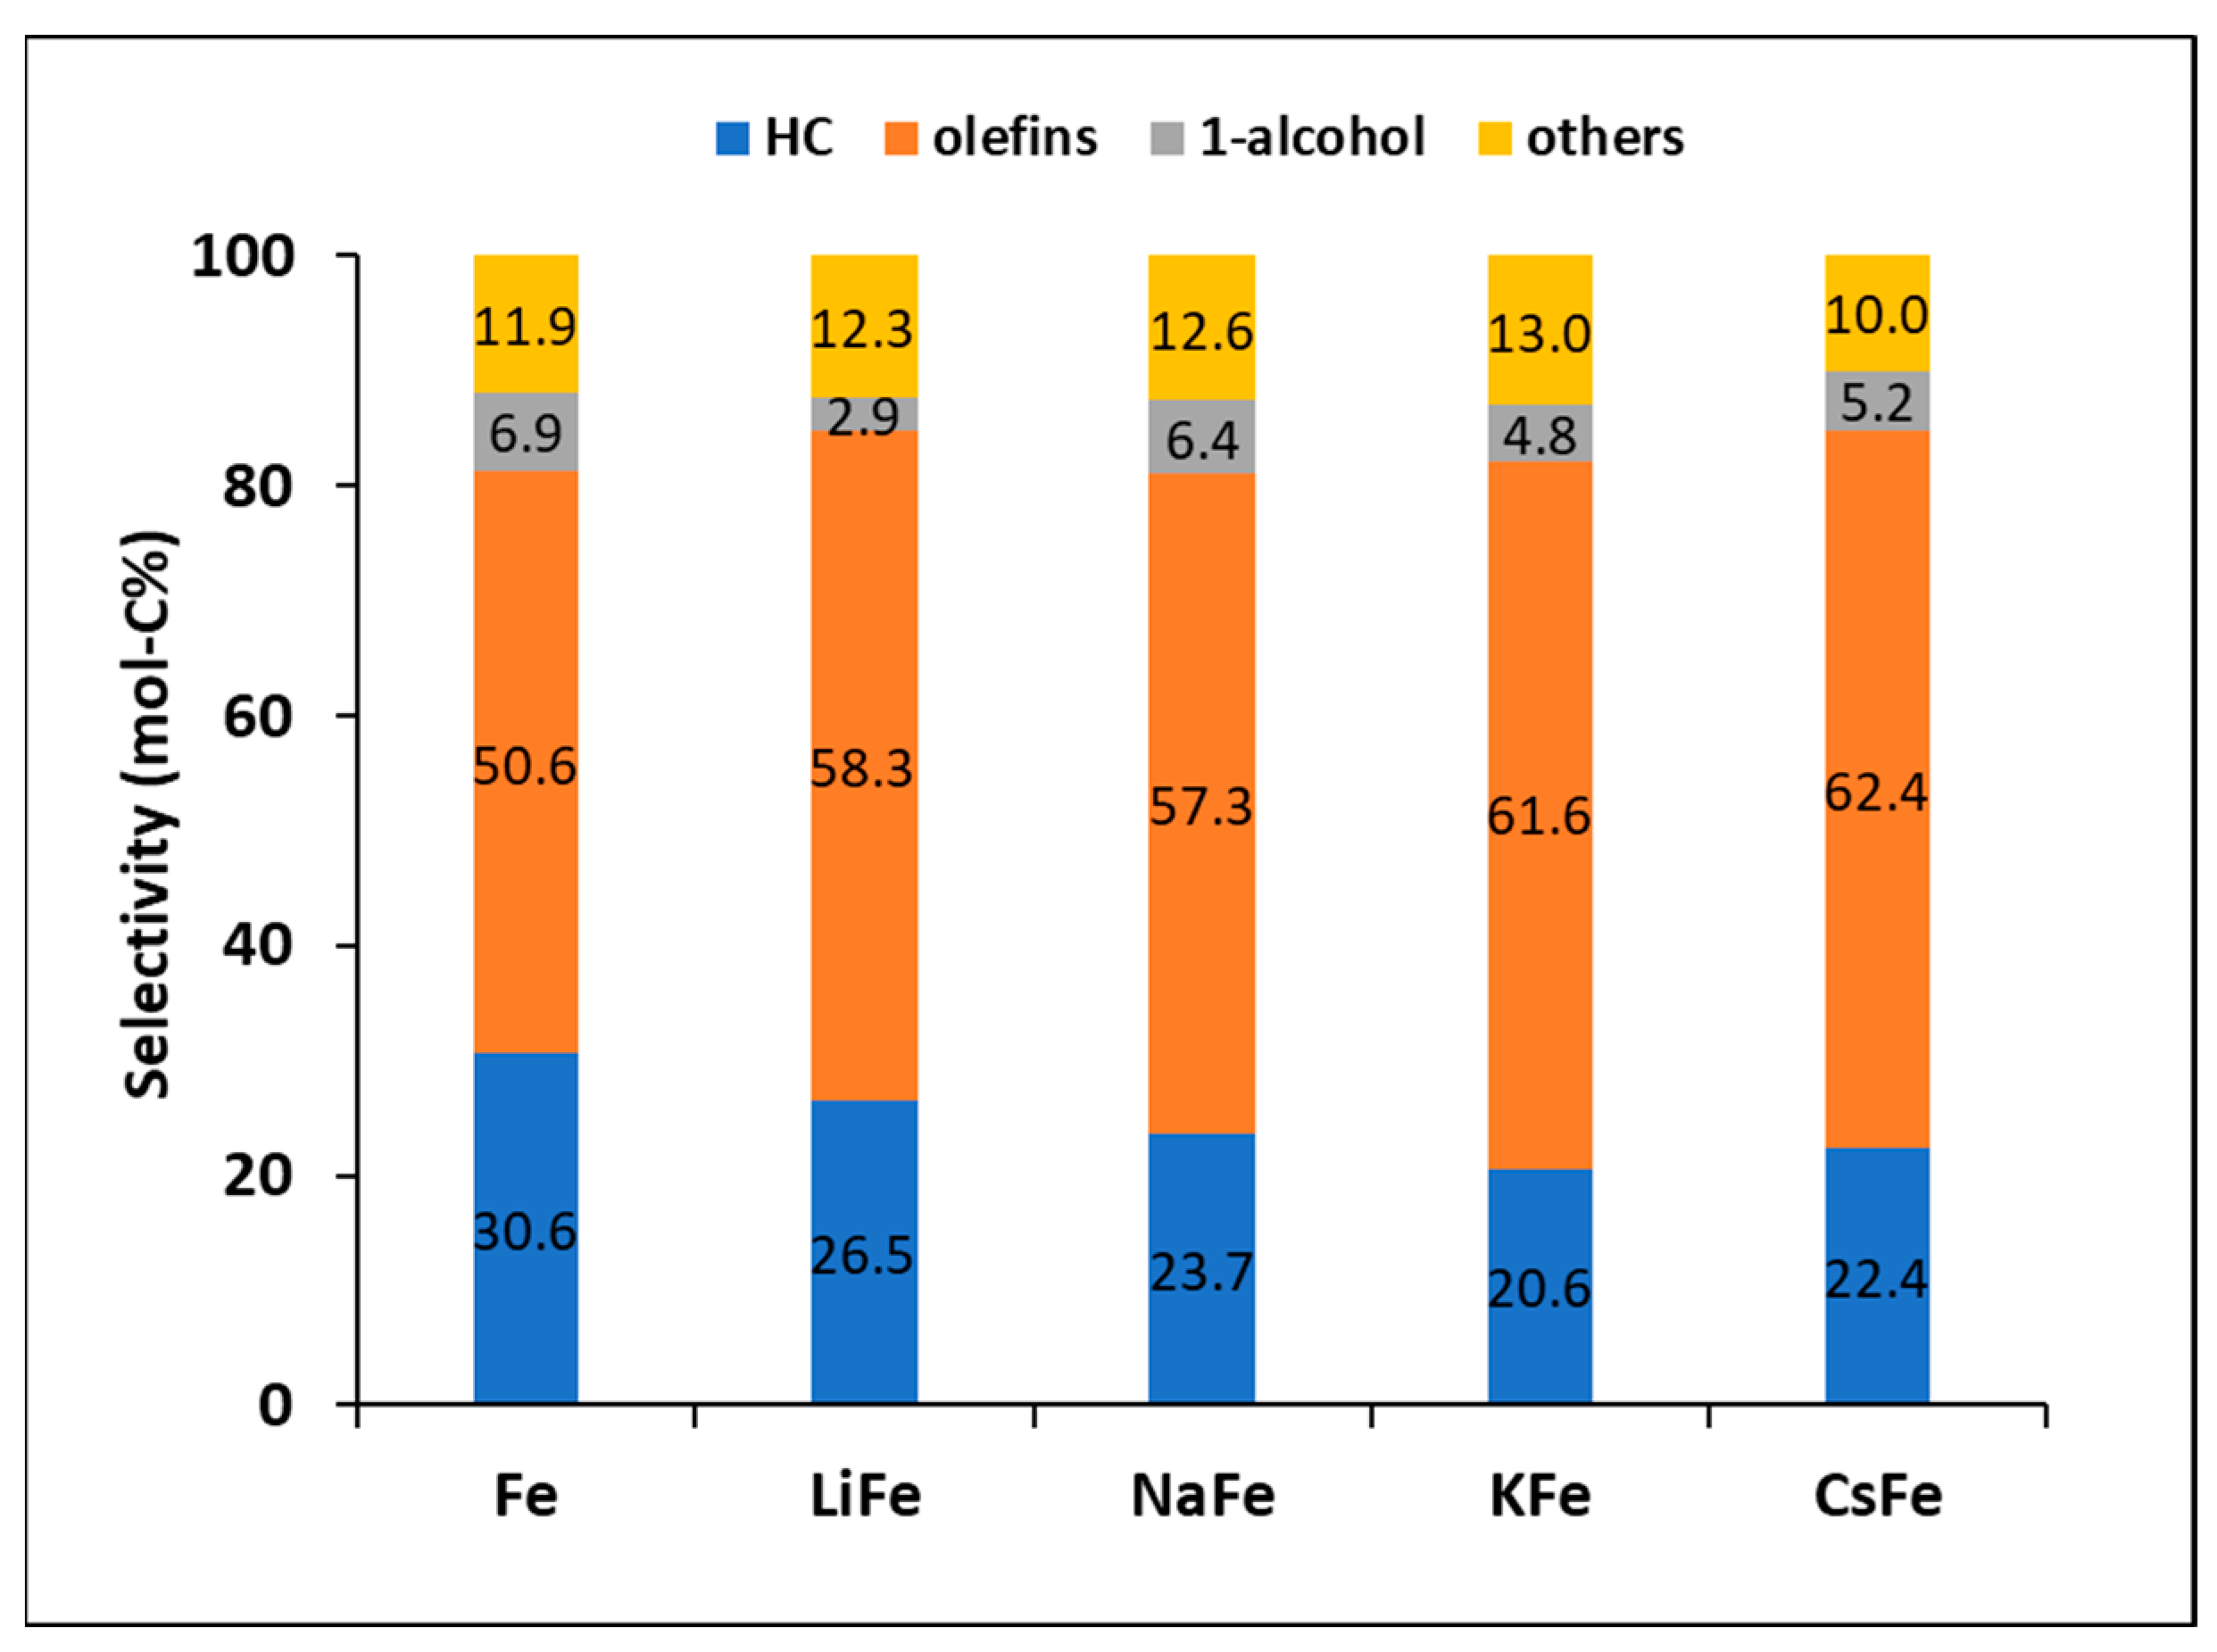
2.4. Catalytic Testing
3. Materials and Methods
3.1. Catalyst Synthesis
3.2. Catalyst Characterization by In-Situ SXPS
3.3. Characterization by In-Situ SXRD
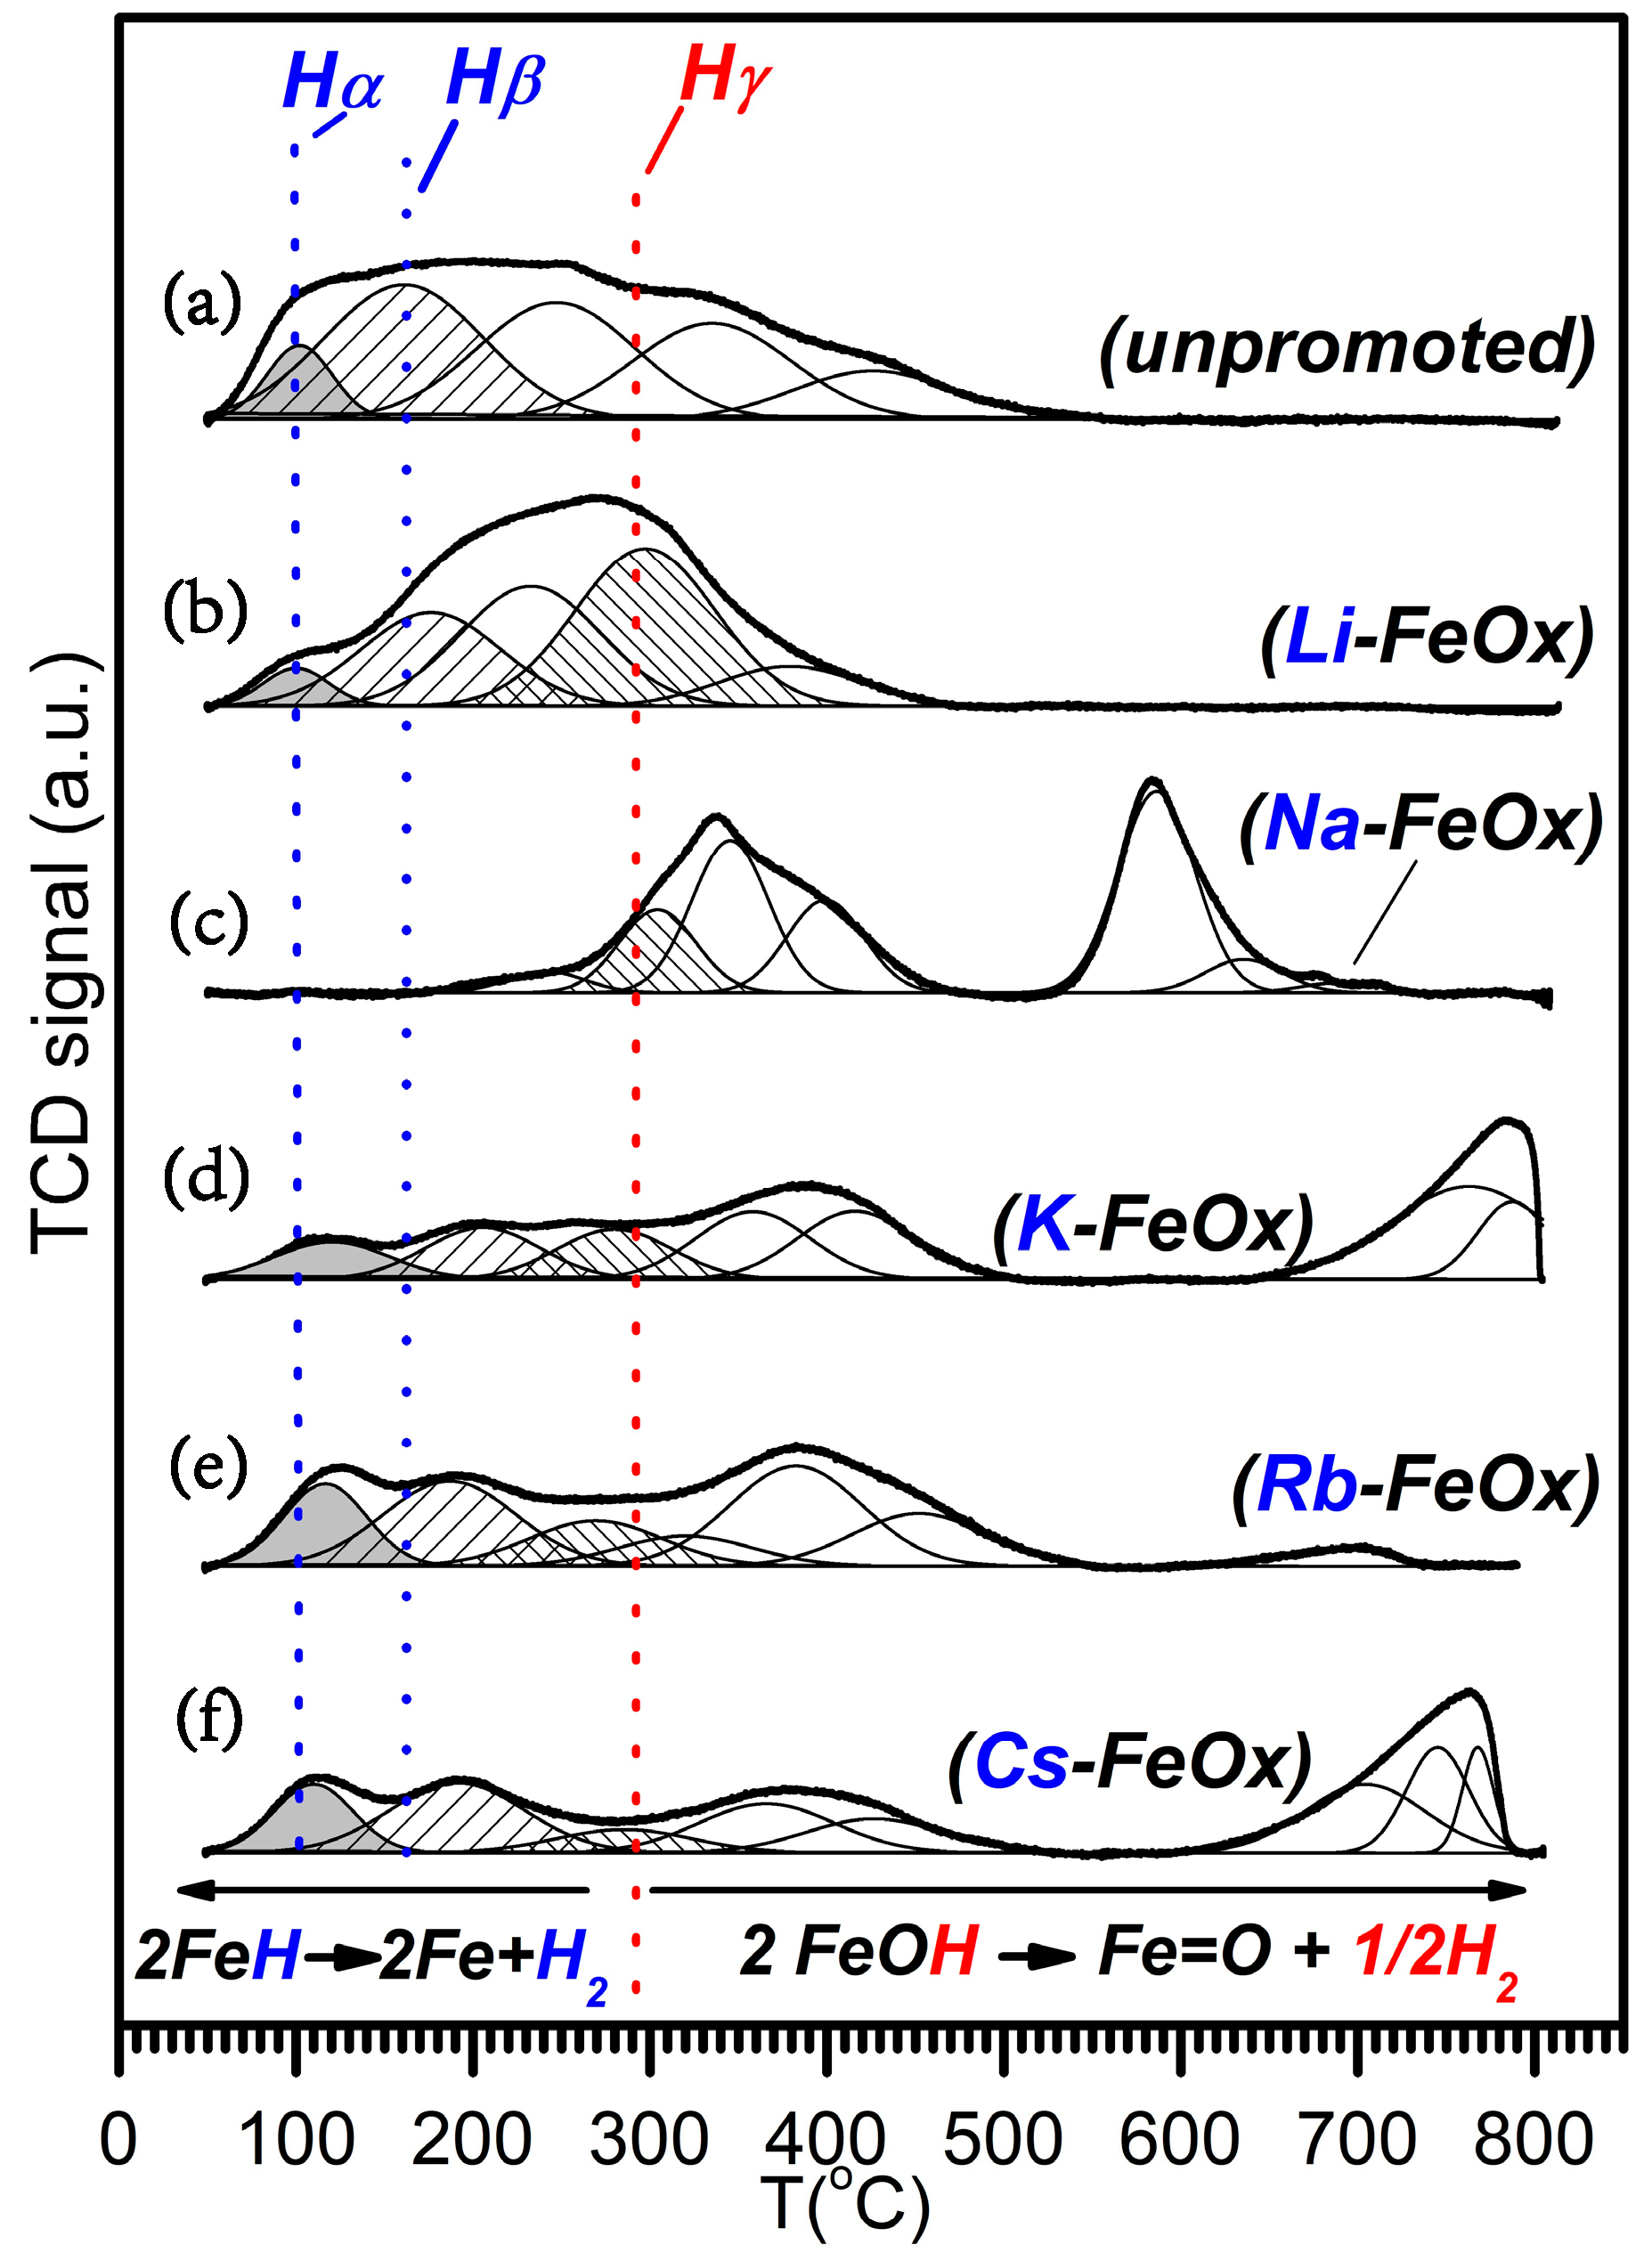
3.4. Characterization by TPR-H2/TPC-CO/TPD-H2/TPD-CO2
3.5. Fischer-Tropsch Synthesis
4. Conclusions
Author Contributions
Funding
Data Availability Statement
Acknowledgments
Conflicts of Interest
References
- Han, Z.; Qian, W.; Zhang, H.; Ma, H.; Sun, Q.; Ying, W. Effect of Rare-Earth Promoters on Precipitated Iron-Based Catalysts for Fischer-Tropsch Synthesis. Ind. Eng. Chem. Res. 2020, 59, 14598–14605. [Google Scholar] [CrossRef]
- Barrios, A.J.; Gu, B.; Luo, Y.; Peron, D.V.; Chernavskii, P.A.; Virginie, M.; Wojcieszak, R.; Thybaut, J.W.; Ordomsky, V.V.; Khodakov, A.Y. Identification of efficient promoters and selectivity trends in high temperature Fischer-Tropsch synthesis over supported iron catalysts. Appl. Catal. B Environ. 2020, 273, 119028. [Google Scholar] [CrossRef]
- Gu, B.; He, S.; Peron, D.V.; Pedrolo, D.R.S.; Moldovan, S.; Ribeiro, M.C.; Lobato, B.; Chernavskii, P.A.; Ordomsky, V.V.; Khodakov, A.Y. Synergy of nanoconfinement and promotion in the design of efficient supported iron catalysts for direct olefin synthesis from syngas. J. Catal. 2019, 376, 1–16. [Google Scholar] [CrossRef]
- Evdokimenko, N.D.; Kapustin, G.I.; Tkachenko, O.P.; Kalmykov, K.B.; Kustov, A.L. Zn Doping Effect on the Performance of Fe-Based Catalysts for the Hydrogenation of CO2 to Light Hydrocarbons. Molecules 2022, 27, 1065. [Google Scholar] [CrossRef] [PubMed]
- Li, S.; Krishnamoorthy, S.; Li, A.; Meitzner, G.D.; Iglesia, E. Promoted Iron-Based Catalysts for the Fischer-Tropsch Synthesis: Design, Synthesis, Site Densities, and Catalytic Properties. J. Catal. 2002, 206, 202–217. [Google Scholar] [CrossRef]
- Ali, S.; Zabidi, N.A.M.; Subbarao, D. Effect of niobium promoters on iron-based catalysts for Fischer-Tropsch reaction. J. Fuel Chem. Technol. 2012, 40, 48–53. [Google Scholar] [CrossRef]
- Abbaslou, R.M.M.; Soltan, J.; Dalai, A.K. Iron catalyst supported on carbon nanotubes for Fischer-Tropsch synthesis: Effects of Mo promotion. Fuel 2011, 90, 1139–1144. [Google Scholar] [CrossRef]
- Luo, M.; Davis, B.H. Fischer-Tropsch synthesis: Group II alkali-earth metal promoted catalysts. Appl. Catal. A Gen. 2003, 246, 171–181. [Google Scholar] [CrossRef]
- Li, J.; Zhang, C.; Cheng, X.; Qing, M.; Xu, J.; Wu, B.; Yang, Y.; Li, Y. Effects of alkaline-earth metals on the structure, adsorption and catalytic behavior of iron-based Fischer-Tropsch synthesis catalysts. Appl. Catal. A Gen. 2013, 464–465, 10–19. [Google Scholar] [CrossRef]
- Ma, H.; Yang, Y.; Fu, H.; Zhang, H.; Qian, W.; Sun, Q.; Ying, W. Effect of alkaline-earth metals (Mg, Ca, Sr, and Ba) on precipitated iron-based catalysts for high-temperature Fischer-Tropsch synthesis of light olefins. Fuel 2024, 357, 129605. [Google Scholar] [CrossRef]
- Ribeiro, M.Z.L.L.; Souza, J.C.; Gnanamani, M.K.; Martinelli, M.; Upton, G.F.; Jacobs, G.; Ribeiro, M.C. Fischer-Tropsch Synthesis: Effect of the Promoter’s Ionic Charge and Valence Level Energy on Activity. Reactions 2021, 2, 408–426. [Google Scholar] [CrossRef]
- Li, J.; Cheng, X.; Zhang, C.; Yang, Y.; Li, Y. Effects of alkali on iron-based catalysts for Fischer-Tropsch synthesis: CO chem-isorptions study. J. Mol. Catal. A Chem. 2015, 396, 174–180. [Google Scholar] [CrossRef]
- Dry, M.; Shingles, T.; Boshoff, L.; Oosthuizen, G. Heats of chemisorption on promoted iron surfaces and the role of alkali in Fischer-Tropsch synthesis. J. Catal. 1969, 15, 190–199. [Google Scholar] [CrossRef]
- Ribeiro, M.C.; Jacobs, G.; Davis, B.H.; Cronauer, D.C.; Kropf, A.J.; Marshall, C.L. Fischer-Tropsch Synthesis: An In-Situ TPR-EXAFS/XANES Investigation of the Influence of Group I Alkali Promoters on the Local Atomic and Electronic Structure of Carburized Iron/Silica Catalysts. J. Phys. Chem. C 2010, 114, 7895–7903. [Google Scholar] [CrossRef]
- Li, J.; Cheng, X.; Zhang, C.; Chang, Q.; Wang, J.; Wang, X.; Lv, Z.; Dong, W.; Yang, Y.; Li, Y. Effect of alkalis on iron-based Fisch-er-Tropsch synthesis catalysts: Alkali-FeOx interaction, reduction, and catalytic performance. Appl. Catal. A Gen. 2016, 528, 131–141. [Google Scholar] [CrossRef]
- Li, J.; Cheng, X.; Zhang, C.; Wang, J.; Dong, W.; Yang, Y.; Li, Y. Alkalis in iron-based Fischer-Tropsch synthesis catalysts: Distribution, migration and promotion. J. Chem. Technol. Biotechnol. 2017, 92, 1472–1480. [Google Scholar] [CrossRef]
- Ngantsoue-Hoc, W.; Zhang, Y.; O’Brien, R.J.; Luo, M.; Davis, B.H. Fischer-Tropsch synthesis: Activity and selectivity for Group I alkali promoted iron-based catalysts. Appl. Catal. A Gen. 2002, 236, 77–89. [Google Scholar] [CrossRef]
- Ribeiro, M.C.; Jacobs, G.; Pendyala, R.; Davis, B.H.; Cronauer, D.C.; Jeremy Kropf, A.; Marshall, C.L. Fischer-Tropsch Synthesis: Influence of Mn on the Carburization Rates and Activities of Fe-Based Catalysts by TPR-EXAFS/XANES and Catalyst Testing. J. Phys. Chem. C 2011, 115, 4783–4792. [Google Scholar] [CrossRef]
- Suo, H.; Wang, S.; Zhang, C.; Xu, J.; Wu, B.; Yang, Y.; Xiang, H.; Li, Y.W. Chemical and structural effects of silica in iron-based Fischer-Tropsch synthesis catalysts. J. Catal. 2012, 286, 111–123. [Google Scholar] [CrossRef]
- O’Brien, R.J.; Davis, B.H. Impact of copper on an alkali promoted iron Fischer-Tropsch catalyst. Catal. Lett. 2004, 94, 1–6. [Google Scholar] [CrossRef]
- O’Brien, R.J.; Xu, L.; Spicer, R.L.; Bao, S.; Milburn, D.R.; Davis, B.H. Activity and selectivity of precipitated iron Fischer-Tropsch catalysts. Catal. Today 1997, 36, 325–334. [Google Scholar] [CrossRef]
- Ertl, G.; Lee, S.; Weiss, M. Adsorption of nitrogen on potassium promoted Fe(111) and (100) surfaces. Surf. Sci. 1982, 114, 527–545. [Google Scholar] [CrossRef]
- Lee, E.H. Iron Oxide Catalysts for Dehydrogenation of Ethylbenzene in the Presence of Steam. Catal. Rev. 1974, 8, 285–305. [Google Scholar] [CrossRef]
- Muhler, M.; Schlögl, R.; Ertl, G. The nature of the iron oxide-based catalyst for dehydrogenation of ethylbenzene to styrene 2. Surface chemistry of the active phase. J. Catal. 1992, 138, 413–444. [Google Scholar] [CrossRef]
- Muhler, M.; Schlögl, R.; Reller, A.; Ertl, G. The nature of the active phase of the Fe/K-catalyst for dehydrogenation of ethylbenzene. Catal. Lett. 1989, 2, 201–210. [Google Scholar] [CrossRef]
- Hirano, T. Roles of potassium in potassium-promoted iron oxide catalyst for dehydrogenation of ethylbenzene. Appl. Catal. 1986, 26, 65–79. [Google Scholar] [CrossRef]
- Kuhrs, C.; Arita, Y.; Weiss, W.; Ranke, W.; Schlögl, R. Understanding heterogeneous catalysis on an atomic scale: A combined surface science and reactivity investigation for the dehydrogenation of ethylbenzene over iron oxide catalysts. Top. Catal. 2000, 14, 111–123. [Google Scholar] [CrossRef]
- Maciá-Agulló, J.A.; Cazorla-Amorós, D.; Linares-Solano, A.; Wild, U.; Su, D.S.; Schlögl, R. Oxygen functional groups involved in the styrene production reaction detected by quasi in situ XPS. Catal. Today 2005, 102–103, 248–253. [Google Scholar] [CrossRef]
- Zhang, J.; Liu, X.; Blume, R.; Zhang, A.; Schlögl, R.; Su, D.S. Surface-Modified Carbon Nanotubes Catalyze Oxidative Dehydrogenation of n-Butane. Science 2008, 322, 73–77. [Google Scholar] [CrossRef]
- de Smit, E.; Weckhuysen, B.M. The renaissance of iron-based Fischer-Tropsch synthesis: On the multifaceted catalyst deactivation behaviour. Chem. Soc. Rev. 2008, 37, 2758–2781. [Google Scholar] [CrossRef]
- Zhang, C.; Zhao, G.; Liu, K.; Yang, Y.; Xiang, H.; Li, Y. Adsorption and reaction of CO and hydrogen on iron-based Fischer-Tropsch synthesis catalysts. J. Mol. Catal. A Chem. 2010, 328, 35–43. [Google Scholar] [CrossRef]
- Yin, Q.; Wang, H.; Zhao, J.; Li, C.; Mao, Y. A DFT study towards dynamic structures of iron and iron carbide and their effects on the activity of the Fischer–Tropsch process. RSC Adv. 2023, 13, 34262–34272. [Google Scholar] [CrossRef]
- Shafer, W.; Gnanamani, M.; Graham, U.; Yang, J.; Masuku, C.; Jacobs, G.; Davis, B. Fischer-Tropsch: Product Selectivity—The Fingerprint of Synthetic Fuels. Catalysts 2019, 9, 259. [Google Scholar] [CrossRef]
- Yang, T.; Wen, S.D.; Li, Y.W.; Wang, J.; Jiao, H. Interaction of alkali metals with the Fe3O4(111) Surface. Surf. Sci. 2009, 603, 78–83. [Google Scholar] [CrossRef]
- Gong, J.; Cao, C.; Sun, R.; Cui, L.; Gao, R.; Hao, H. A DFT Insight into the Tuning Effect of Potassium Promoter on the Formation of Carbon Atoms via Carburization Gases Dissociation on Iron-Based Catalysts. Catalysts 2020, 10, 527. [Google Scholar] [CrossRef]
- Zhao, S.; Liu, X.W.; Huo, C.F.; Li, Y.W.; Wang, J.; Jiao, H. The role of potassium promoter in surface carbon hydrogenation on Hägg carbide surfaces. Appl. Catal. A Gen. 2015, 493, 68–76. [Google Scholar] [CrossRef]
- Petersen, M.A.; Cariem, M.J.; Claeys, M.; van Steen, E. A DFT perspective of potassium promotion of χ-Fe5C2(100). Appl. Catal. A Gen. 2015, 496, 64–72. [Google Scholar] [CrossRef]
- Chen, H.; Ma, N.; Wang, C.; Liu, C.; Shen, J.; Wang, Y.; Xu, G.; Yang, Q.; Feng, X. Insight into the activation of CO2 and H2 on K2O-adsorbed Fe5C2(110) for olefins production: A density functional theory study. Mol. Catal. 2022, 524, 112323. [Google Scholar] [CrossRef]
- Liu, B.; Li, W.; Zheng, J.; Lin, Q.; Zhang, X.; Zhang, J.; Jiang, F.; Xu, Y.; Liu, X. CO2 formation mechanism in Fischer-Tropsch synthesis over iron-based catalysts: A combined experimental and theoretical study. Catal. Sci. Technol. 2018, 8, 5288–5301. [Google Scholar] [CrossRef]
- Nie, X.; Meng, L.; Wang, H.; Chen, Y.; Guo, X.; Song, C. DFT insight into the effect of potassium on the adsorption, activation and dissociation of CO2 over Fe-based catalysts. Phys. Chem. Chem. Phys. 2018, 20, 14694–14707. [Google Scholar] [CrossRef]
- Gaube, J.; Klein, H.F. The promoter effect of alkali in Fischer-Tropsch iron and cobalt catalysts. Appl. Catal. A Gen. 2008, 350, 126–132. [Google Scholar] [CrossRef]
- Graf, B.; Schulte, H.; Muhler, M. The formation of methane over iron catalysts applied in Fischer-Tropsch synthesis: A transient and steady state kinetic study. J. Catal. 2010, 276, 66–75. [Google Scholar] [CrossRef]
- Dry, M.; Oosthuizen, G. The correlation between catalyst surface basicity and hydrocarbon selectivity in the Fischer-Tropsch synthesis. J. Catal. 1968, 11, 18–24. [Google Scholar] [CrossRef]
- Rajabi, Z.; Martinelli, M.; Watson, C.D.; Cronauer, D.C.; Kropf, A.J.; Jacobs, G. Influence of Cs loading on Pt/m-ZrO2 water-gas shift catalysts. Catalysts 2021, 11, 570. [Google Scholar] [CrossRef]
- Watson, C.D.; Martinelli, M.; Cronauer, D.C.; Kropf, A.J.; Jacobs, G. Low temperature water-gas shift: Enhancing stability through optimizing Rb loading on Pt/ZrO2. Catalysts 2021, 11, 210. [Google Scholar] [CrossRef]
- Blyholder, G. Molecular orbital view of chemisorbed carbon monoxide. J. Phys. Chem. 1964, 68, 2772–2777. [Google Scholar] [CrossRef]
- Bonzel, H.P. Alkali-promoted gas adsorption and surface reactions on metals. J. Vac. Sci. Technol. A 1984, 2, 866–872. [Google Scholar] [CrossRef]
- Huo, C.F.; Wu, B.-S.; Gao, P.; Yang, Y.; Li, Y.W.; Jiao, H. The Mechanism of Potassium Promoter: Enhancing the Stability of Active Surfaces. Angew. Chem. Int. Ed. 2011, 50, 7403–7406. [Google Scholar] [CrossRef]
- Pendyala, V.R.R.; Jacobs, G.; Mohandas, J.C.; Luo, M.-S.; Hamdeh, H.H.; Ji, Y.; Ribeiro, M.C.; Davis, B.H. Fischer-Tropsch synthesis: Effect of water over iron-based catalysts. Catal. Lett. 2010, 140, 98–105. [Google Scholar] [CrossRef]
- Klissurski, D.; Mitov, I. Mössbauer Studies of the Reduction of α-Fe2O3 Containing Alkali Metal Hydroxides. J. De Phys. Colloq. 1979, 40, 353–354. [Google Scholar] [CrossRef]
- Weatherup, R.S.; Amara, H.; Blume, R.; Dlubak, B.; Bayer, B.C.; Diarra, M.; Bahri, M.; Cabrero-Vilatela, A.; Caneva, S.; Kidambi, P.R.; et al. Interdependency of Subsurface Carbon Distribution and Graphene-Catalyst Interaction. J. Am. Chem. Soc. 2014, 136, 13698–13708. [Google Scholar] [CrossRef] [PubMed]
- Kraffert, K.; Kabelitz, A.; Siemensmeyer, K.; Schmack, R.; Bernsmeier, D.; Emmerling, F.; Kraehnert, R. Nanocasting of Superparamagnetic Iron Oxide Films with Ordered Mesoporosity. Adv. Mater. Interfaces 2018, 5, 1700960. [Google Scholar] [CrossRef]
- Kuivila, C.S.; Stair, P.C.; Butt, J.B. Compositional aspects of iron Fischer-Tropsch catalysts: An XPS/reaction study. J. Catal. 1989, 118, 299–311. [Google Scholar] [CrossRef]
- Gupta, A.; Mittal, M.; Singh, M.K.; Suib, S.L.; Prakash, O. Low temperature synthesis of NbC/C nanocomposites as visible light photoactive catalyst. Sci. Rep. 2018, 8, 13597. [Google Scholar] [CrossRef]
- Gamba, O.; Hulva, J.; Pavelec, J.; Bliem, R.; Schmid, M.; Diebold, U.; Parkinson, G.S. The Role of Surface Defects in the Adsorption of Methanol on Fe3O4(001). Top. Catal. 2017, 60, 420–430. [Google Scholar] [CrossRef]
- Tatara, R.; Karayaylali, P.; Yu, Y.; Zhang, Y.; Giordano, L.; Maglia, F.; Jung, R.; Schmidt, J.P.; Lund, I.; Horn, Y.S. The Effect of Electrode-Electrolyte Interface on the Electrochemical Impedance Spectra for Positive Electrode in Li-Ion Battery. J. Electrochem. Soc. 2019, 166, A5090. [Google Scholar] [CrossRef]
- Pavelec, J.; Hulva, J.; Halwidl, D.; Bliem, R.; Gamba, O.; Jakub, Z.; Brunbauer, F.; Schmid, M.; Diebold, U.; Parkinson, G.S. A multi-technique study of CO2 adsorption on Fe3O4 magnetite. J. Chem. Phys. 2017, 146, 014701. [Google Scholar] [CrossRef]
- Shchukarev, A.; Korolkov, D. XPS Study of group IA carbonates. Open Chem. 2004, 2, 347–362. [Google Scholar] [CrossRef]
- Smit, E.; van Schooneveld, M.M.; Cinquini, F.; Bluhm, H.; Sautet, P.; de Groot, F.M.; Weckhuysen, B.M. On the surface chemistry of iron oxides in reactive gas atmospheres. Angew. Chem. 2011, 123, 1584–1588. [Google Scholar] [CrossRef]
- Rao, K.R.P.M.; Huggins, F.E.; Mahajan, V.; Huffman, G.P.; Rao, V.U.S. The role of magnetite in Fischer-Tropsch synthesis. Hyperfine Interact. 1994, 93, 1745–1749. [Google Scholar] [CrossRef]
- Grosvenor, A.P.; Kobe, B.A.; Biesinger, M.C.; McIntyre, N.S. Investigation of multiplet splitting of Fe 2p XPS spectra and bonding in iron compounds. Surf. Interface Anal. 2004, 36, 1564–1574. [Google Scholar] [CrossRef]
- Nesbitt, H.W.; Bancroft, G.M.; Henderson, G.S.; Ho, R.; Dalby, K.N.; Huang, Y.; Yan, Z. Bridging, non-bridging and free (O2−) oxygen in Na2O-SiO2 glasses: An X-ray Photoelectron Spectroscopic (XPS) and Nuclear Magnetic Resonance (NMR) study. J. Non-Cryst. Solids 2011, 357, 170–180. [Google Scholar] [CrossRef]
- Arinchtein, A.; Ye, M.-Y.; Geske, M.; Frisch, M.; Kraehnert, R. Influence of Phase Composition and Pretreatment on the Conversion of Iron Oxides into Iron Carbides in Syngas Atmospheres. Catalysts 2021, 11, 773. [Google Scholar] [CrossRef]
- Gnanamani, M.K.; Jacobs, G.; Graham, U.M.; Ribeiro, M.C.; Noronha, F.B.; Shafer, W.D.; Davis, B.H. Influence of carbide formation on oxygenates selectivity during Fischer-Tropsch synthesis over Ce-containing Co catalysts. Catal. Today 2016, 261, 40–47. [Google Scholar] [CrossRef]
- Riedel, T.; Claeys, M.; Schulz, H.; Schaub, G.; Nam, S.S.; Jun, K.W.; Choi, M.J.; Kishan, G.; Lee, K.W. Comparative study of Fischer-Tropsch synthesis with H2/CO and H2/CO2 syngas using Fe- and Co-based catalysts. Appl. Catal. A Gen. 1999, 186, 201–213. [Google Scholar] [CrossRef]
- Konopatsky, A.; Kustov, A.; Evdokimenko, N.; Shesterkina, A.; Varlamova, L.A.; Teplyakova, T.; Leybo, D.; Antipina, L.Y.; Sorokin, P.B.; Fang, X.; et al. Layered Ferrihydrite and BN Nanoparticle Heterostructures Doped with Ag for CO2 Hydrogenation. ACS Appl. Nano Mater. 2024, 7, 10257–10267. [Google Scholar] [CrossRef]
- Harris, J.; Andersson, S. H2 Dissociation at Metal Surfaces. Phys. Rev. Lett. 1985, 55, 1583–1586. [Google Scholar] [CrossRef] [PubMed]
- Ding, M.; Yang, Y.; Wu, B.; Li, Y.; Wang, T.; Ma, L. Study on reduction and carburization behaviors of iron phases for iron-based Fischer-Tropsch synthesis catalyst. Appl. Energy 2015, 160, 982–989. [Google Scholar] [CrossRef]
- Salama, T.M.; Ebitani, H.K.; Hattori, H.; Kita, H. Electron paramagnetic resonance studies of reduced platinum supported on titanium oxide: Effect of hydrogen adsorption-desorption on paramagnetic platinum(I) and titanium(III) species. Chem. Mater. 1994, 6, 21–26. [Google Scholar] [CrossRef]
- Mehariya, S.; Iovine, A.; Casella, P.; Musmarra, D.; Figoli, A.; Marino, T.; Sharma, N.; Molino, A. Chapter 7—Fischer-Tropsch synthesis of syngas to liquid hydrocarbons. In Lignocellulosic Biomass to Liquid Biofuels, 1st ed.; Yousuf, A., Pirozzi, D., Sannino, F., Eds.; Academic Press: Cambridge, MA, USA, 2020; pp. 217–248. [Google Scholar]
- Cheng, K.; Ordomsky, V.V.; Legras, B.; Virginie, M.; Paul, S.; Wang, Y.; Khodakov, A.Y. Sodium-promoted iron catalysts prepared on different supports for high temperature Fischer-Tropsch synthesis. Appl. Catal. A Gen. 2015, 502, 204–214. [Google Scholar] [CrossRef]
- Gnanamani, M.K.; Hamdeh, H.H.; Shafer, W.D.; Hopps, S.D.; Davis, B.H. Hydrogenation of carbon dioxide over iron carbide prepared from alkali metal promoted iron oxalate. Appl. Catal. A Gen. 2018, 564, 243–249. [Google Scholar] [CrossRef]
- Xu, J.; Bartholomew, C.H. Temperature-Programmed Hydrogenation (TPH) and in Situ Mossbauer Spectroscopy Studies of Carbonaceous Species on Silica-Supported Iron Fischer-Tropsch Catalysts. J. Phys. Chem. 2005, 109, 2392–2403. [Google Scholar] [CrossRef]
- Ordomsky, V.V.; Legras, B.; Cheng, K.; Paul, S.; Khodakov, A.Y. The role of carbon atoms of supported iron carbides in Fischer-Tropsch synthesis. Catal. Sci. Technol. 2015, 5, 1433–1437. [Google Scholar] [CrossRef]
- Davis, B.H. Fischer-Tropsch Synthesis: Reaction mechanisms for iron catalysts. Catal. Today 2012, 141, 25–33. [Google Scholar] [CrossRef]
- Herranz, T.; Rojas, S.; Perez-Alonso, F.J.; Ojeda, M.; Terreros, P.; Fierro, J.L.G. Genesis of iron carbides and their role in the synthesis of hydrocarbons from synthesis gas. J. Catal. 2006, 243, 199–211. [Google Scholar] [CrossRef]
- Xiong, H.; Motchelaho, M.A.; Moyo, M.; Jewell, L.L.; Coville, N.J. Effect of Group I alkali metal promoters on Fe/CNT catalysts in Fischer-Tropsch synthesis. Fuel 2015, 150, 687–696. [Google Scholar] [CrossRef]
- An, X.; Wu, B.-S.; Wan, H.J.; Li, T.Z.; Tao, Z.C.; Xiang, H.-W.; Li, Y.W. Comparative study of iron-based Fischer-Tropsch synthesis catalyst promoted with potassium or sodium. Catal. Commun. 2007, 8, 1957–1962. [Google Scholar] [CrossRef]
- Luo, M.; Hamdeh, H.; Davis, B.H. Fischer-Tropsch Synthesis Catalyst activation of low alpha iron catalyst. Catal. Today 2009, 140, 127–134. [Google Scholar] [CrossRef]
- Miller, D.G.; Moskovits, M. A study of the effects of potassium addition to supported iron catalysts in the Fischer-Tropsch reaction. J. Phys. Chem. 1988, 92, 6081–6085. [Google Scholar] [CrossRef]
- Bukur, D.B.; Lang, X.; Akgerman, A.; Feng, Z. Effect of Process Conditions on Olefin Selectivity during Conventional and Supercritical Fischer-Tropsch Synthesis. Ind. Eng. Chem. Res. 1997, 36, 2580–2587. [Google Scholar] [CrossRef]
- Dietz, W.A. Response factors for gas chromatographic analyses. J. Chromatogr. Sci. 1967, 5, 68–71. [Google Scholar] [CrossRef]


| Phase | Code | Space Group | Unit Cell Parameters | |||
|---|---|---|---|---|---|---|
| a (Å) | b (Å) | c (Å) | β (deg.) | |||
| Fe3O4 | ICSD 26410 | F d −3 m | 8.3941 | |||
| χ-Fe5C2 | COD 1521831 | C 2/c | 11.588 | 4.579 | 5.059 | 97.75 |
| Θ-Fe3C | amcsd 0013523 | P n m a | 5.092 | 6.741 | 4.527 | |
| α-Fe2O3 | amcsd 0000143 | R −3 c | 5.038 | 5.038 | 13.772 | |
| FeO | amcsd 0013893 | F m −3 m | 4.326 | |||
| Catalyst Promoter | Areas < 250 °C | Areas, 250 °C–400 °C | Areas > 400 °C |
|---|---|---|---|
| Unpromoted | 66.0 | 22.6 | 11.4 |
| Li | 53.9 | 46.1 | 0 |
| Na | 3.6 | 55.1 | 41.2 |
| K | 21.2 | 28.1 | 50.7 |
| Rb | 35.9 | 46.5 | 17.6 |
| Cs | 31.4 | 20.7 | 47.8 |
| Catalyst | T < 300 °C | 300 °C < T < 500 °C | 500 °C < T < 700 °C | >700 °C | Relative Total Area Using Na as a Basis |
|---|---|---|---|---|---|
| Unpromoted | 66.6 | 21.0 | 6.2 | 6.2 | 8.7% |
| Li | 43.6 | 32.0 | 14.6 | 9.8 | 11.1% |
| Na | 5.8 | 3.4 | 82.2 | 8.6 | 100% |
| K | 8.0 | 6.0 | 1.2 | 84.8 | 62.6% |
| Cs | 7.7 | 12.4 | 5.0 | 74.9 | 91.9% |
| Catalysts | TOS(h) | Conv. (%) | H2/CO Usage | CO2 sel. (mol-%) | HC sel. (wt%) | (C2–C4) = /(C2–C4)o | Ref. | |||
|---|---|---|---|---|---|---|---|---|---|---|
| CO | CO + H2 | CH4 | C2–C4 | C5+ | ||||||
| Fe | 94 | 63.2 | 65.0 | 0.75 | 44.6 | 6.4 | 32.3 | 61.3 | 1.92 | this work |
| LiFe | 41 | 50.3 | 52.9 | 0.79 | 42.6 | 4.6 | 25.1 | 70.3 | 3.21 | this work |
| NaFe | 91 | 62.6 | 58.9 | 0.60 | 49.2 | 5.9 | 22.5 | 71.6 | 3.49 | this work |
| KFe | 98 | 61.4 | 57.1 | 0.58 | 47.3 | 3.3 | 13.8 | 82.9 | 5.26 | this work |
| CsFe | 50 | 55.3 | 52.8 | 0.62 | 49.1 | 3.9 | 13.7 | 82.4 | 5.48 | this work |
| FeSi | 140 | 53.4 | 40.7 | - | 33.7 | 24.9 | 49.4 | 25.7 | 0.45 | [41] |
| LiFeSi | 143 | 30.1 | 25.7 | - | 27.1 | 16.0 | 39.7 | 44.3 | 0.56 | [41] |
| NaFeSi | 142 | 42.4 | 27.6 | - | 29.2 | 14.9 | 35.5 | 49.6 | 0.63 | [41] |
| KFeSi | 141 | 57.3 | 33.3 | - | 46.1 | 12.9 | 30.3 | 56.8 | 0.61 | [41] |
| CsFeSi | 141 | 57.1 | 38.5 | - | 36.5 | 15.6 | 31.2 | 53.2 | 0.64 | [41] |
| Fe/CNT | - | 46.4 | - | - | 9.4 | 29.1 | 13.5 | 57.4 | - | [77] |
| Fe-3Li/CNT | - | 62.2 | - | - | 10.3 | 30.2 | 17.6 | 52.2 | - | [77] |
| Fe-3Na/CNT | - | 73.0 | - | - | 14.0 | 12.0 | 25.1 | 63.0 | - | [77] |
| Fe-3K/CNT | - | 38.4 | - | - | 8.5 | 13.6 | 29.9 | 56.5 | - | [77] |
| FeCu/SiO2 | 201 | 28.8 | - | - | 30.4 | 9.9 | 41.4 | 48.7 | 2.38 | [78] |
| FeCuNa/SiO2 | 202 | 63.5 | - | - | 45.1 | 6.6 | 29.3 | 64.1 | 3.60 | [78] |
| FeCuK/SiO2 | 199 | 69.1 | - | - | 47.1 | 5.2 | 19.9 | 75.0 | 3.72 | [78] |
| FeSiKCu | - | 86.2 | 82.5 | 0.60 | 45.6 | - | - | 61.4 | - | [79] |
Disclaimer/Publisher’s Note: The statements, opinions and data contained in all publications are solely those of the individual author(s) and contributor(s) and not of MDPI and/or the editor(s). MDPI and/or the editor(s) disclaim responsibility for any injury to people or property resulting from any ideas, methods, instructions or products referred to in the content. |
© 2024 by the authors. Licensee MDPI, Basel, Switzerland. This article is an open access article distributed under the terms and conditions of the Creative Commons Attribution (CC BY) license (https://creativecommons.org/licenses/by/4.0/).
Share and Cite
Ribeiro, M.Z.L.L.; Souza, J.C.; Gomes, I.F.; Gnanamani, M.K.; Martinelli, M.; Jacobs, G.; Ribeiro, M.C. Surface Chemical Effects on Fischer–Tropsch Iron Oxide Catalysts Caused by Alkali Ion (Li, Na, K, Cs) Doping. Catalysts 2024, 14, 682. https://doi.org/10.3390/catal14100682
Ribeiro MZLL, Souza JC, Gomes IF, Gnanamani MK, Martinelli M, Jacobs G, Ribeiro MC. Surface Chemical Effects on Fischer–Tropsch Iron Oxide Catalysts Caused by Alkali Ion (Li, Na, K, Cs) Doping. Catalysts. 2024; 14(10):682. https://doi.org/10.3390/catal14100682
Chicago/Turabian StyleRibeiro, Mirtha Z. Leguizamón León, Joice C. Souza, Igor Ferreira Gomes, Muthu Kumaran Gnanamani, Michela Martinelli, Gary Jacobs, and Mauro Celso Ribeiro. 2024. "Surface Chemical Effects on Fischer–Tropsch Iron Oxide Catalysts Caused by Alkali Ion (Li, Na, K, Cs) Doping" Catalysts 14, no. 10: 682. https://doi.org/10.3390/catal14100682
APA StyleRibeiro, M. Z. L. L., Souza, J. C., Gomes, I. F., Gnanamani, M. K., Martinelli, M., Jacobs, G., & Ribeiro, M. C. (2024). Surface Chemical Effects on Fischer–Tropsch Iron Oxide Catalysts Caused by Alkali Ion (Li, Na, K, Cs) Doping. Catalysts, 14(10), 682. https://doi.org/10.3390/catal14100682