Article

Site-Directed Mutagenesis of Two-Domain Laccase ScaSL for Obtaining a Biocatalyst with Improved Characteristics

1
G.K. Skryabin Institute of Biochemistry and Physiology of Microorganisms, Federal Research Center “Pushchino Scientific Center for Biological Research of the Russian Academy of Sciences”, Prospekt Nauki, 5, 142290 Pushchino, Russia
2
Institute of Protein Research of the Russian Academy of Sciences, Institutskaya St., 4, 142290 Pushchino, Russia
3
Institute of Basic Biological Problems, Federal Research Center “Pushchino Scientific Center for Biological Research of the Russian Academy of Sciences”, Institutskaya Str., 2, 142290 Pushchino, Russia
4
Biotechnology Department, Tula State University, Pr. Lenina 92, 300012 Tula, Russia
5
Laboratory of Ecological and Medical Biotechnology, Tula State University, Friedrich Engels Street 157, 300012 Tula, Russia
*
Author to whom correspondence should be addressed.
Catalysts 2024, 14(10), 694; https://doi.org/10.3390/catal14100694 (registering DOI)
Submission received: 30 August 2024 / Revised: 21 September 2024 / Accepted: 24 September 2024 / Published: 5 October 2024
(This article belongs to the Section Biocatalysis)

Abstract

:
Analysis of the structure of two-domain laccase ScaSL from Streptomyces carpinensis VKM Ac-1300 (with a middle-redox potential) revealed determinants that could affect the increased potential of ScaSL. Site-directed mutagenesis of the ScaSL laccase was carried out, and mutants H286A, H286T, H286W, and F232Y/F233Y were obtained. Replacement of His 286 with Ala led to a decrease in redox potential (0.45 V) and an increase in stability at pH 9 and 11; replacement with Thr led to an increase in redox potential (0.51 V) but to a decrease in the thermal stability of the protein; replacement with Trp did not affect the enzyme properties. Replacement of Phe residues 232 and 233 with Tyr led to a shift in enzyme activity to the acidic pH range without changing the redox potential and a decrease in the thermostability and pH stability of the enzyme. All mutants more efficiently oxidized phenolic substrate 2,6-DMP and were able to participate in direct electron transfer (DET) with MWCNT-modified electrodes. The F232Y/F233/Y mutant was unable to degrade triphenylmethane dyes without a mediator but showed a greater degree of decolorization of azo dyes in the presence of the mediator. The crystal structure of laccase with the highest potential was determined with high resolution.

1. Introduction

Laccases are multi-copper enzymes (EC 1.10.3.2.) that catalyze the oxidation of organic and inorganic compounds, with the participation of O2, which is reduced to water. The active site of laccase contains four copper atoms forming copper centers: T1, which carries one copper atom; T2, which also contains one copper atom; and T3, which carries two copper atoms [1,2]. Laccases have been found in fungi, bacteria, plants, and insects [3]. Fungal, plant, and insect laccases are classified as three-domain proteins. Among bacteria, there are both three-domain and two-domain proteins [4]. Three-domain fungal laccases have the ability to oxidase diverse organic compounds with high redox potential, including different pollutants from contaminated water [5]. Due to this, fungal laccases are widely used as biocatalysts in the development of biotechnologies for dye decolorization and wastewater treatment [6]. An important feature of multi-copper oxidases is their ability to participate in electrode reactions without redox mediators as bioelectrocatalysts for dioxygen reduction (direct electron transfer, DET) [7]. For the first time, Berezin et al. showed the potential of fungal laccase involvement in DET in 1978 [8]. These unique enzyme properties have determined their significance in the development of bioelectrochemical systems, such as biofuel cells and electrochemical biosensors [9,10,11,12].
Unlike them, two-domain bacterial laccases usually have low-redox potential (between 0.35 and 0.4 V) [13,14,15,16], which limits their ability to oxidize substrates and makes them less useful in industry. However, two-domain laccases, unlike fungal three-domain laccases [4], are enzymes with high thermostability. They are active in the homotrimeric form, and they are capable of catalyzing the oxidation of phenolic compounds at alkaline and neutral pH values. From this point of view, the only drawback of laccases that limits their implementation in biotechnological processes is their low-redox potential [17].
At the current level of development of molecular biology, it is possible to predict and carry out point substitutions of amino acids in a protein, which makes it possible to change the desirable properties of enzymes (redox potential, specificity, catalytic efficiency, stability, resistance to certain environmental components, etc.). One of the modern approaches to obtaining laccase with desired properties or improved biocatalytic characteristics is site-directed mutagenesis [18]. It was found that the nature of the axial ligand affects the electron transfer to the T1 copper site. In high-potential and medium-potential fungal laccases, phenylalanine and leucine/isoleucine act as axial ligands of the T1 copper site, respectively, while low-potential plant and bacterial laccases have methionine as an axial ligand [19]. Work has been conducted to modify the two-domain laccases sLAC and Ssl1 by site-directed mutagenesis. In sLAC, the axial methionine was replaced with phenylalanine [19]. Laccase Ssl1 was modified by replacing axial methionine with leucine, isoleucine, and phenylalanine [20]. Although the redox potential of Ssl1 mutants increases, the kcat values for typical laccase substrates (2,6-DMP and syringaldazine) decrease. This is also true for SLAC mutant kcat values for 2,6-DMP and ABTS, along with less thermally stable.
Another factor that influences the redox potential value of laccases is the amino acid composition of the second coordination sphere around the copper atom of the T1-site. Mutations that affect amino acids in the second coordination sphere and enlarge the substrate pocket were performed on the same laccases: Ssl1 [20] and sLAC [16,21]. The mutations in sLAC led to more efficient oxidation of 2,6-DMP and some dyes and increasing redox potential; the mutations in Ssl1 resulted in a slight increase in redox potential and a decrease in catalytic activity for syringaldazine. Thus, mutations affecting the axial ligand of the T1 copper site and the amino acid composition of the second coordination sphere around the copper atom of the T1-site can lead to an increase in redox potential of proteins-mutants, but this can negatively affect the oxidative activity enzymes, as well as their thermostability. Additional studies involving other similar proteins may help to clarify the conflicting results.
Recently, we have discovered and investigated two new two-domain actinobacterial laccases: ScaSL from Streptomyces carpinensis [22] and CjSL from Catenuloplanes japonicus [23]. Unlike other two-domain laccases, these two enzymes had a middle redox potential (0.47 V and 0.51 V, respectively) and had the «low-potential» amino acid methionine as the axial ligand of the T1 copper site (and the range of substrates oxidized by them was wider than that of low-potential laccases). As a result, there are certain amino acids that may contribute to the increased redox potential of these enzymes and the ability to oxidize substrates, including toxic dyes.
The search for amino acid determinants that are located on the periphery of the T1 copper center but can affect protein conformation, the availability of active laccase centers for substrates, including dioxygen, and, as a result, the redox potential, and catalytic efficiency of laccases, is the main task of this study.

2. Results

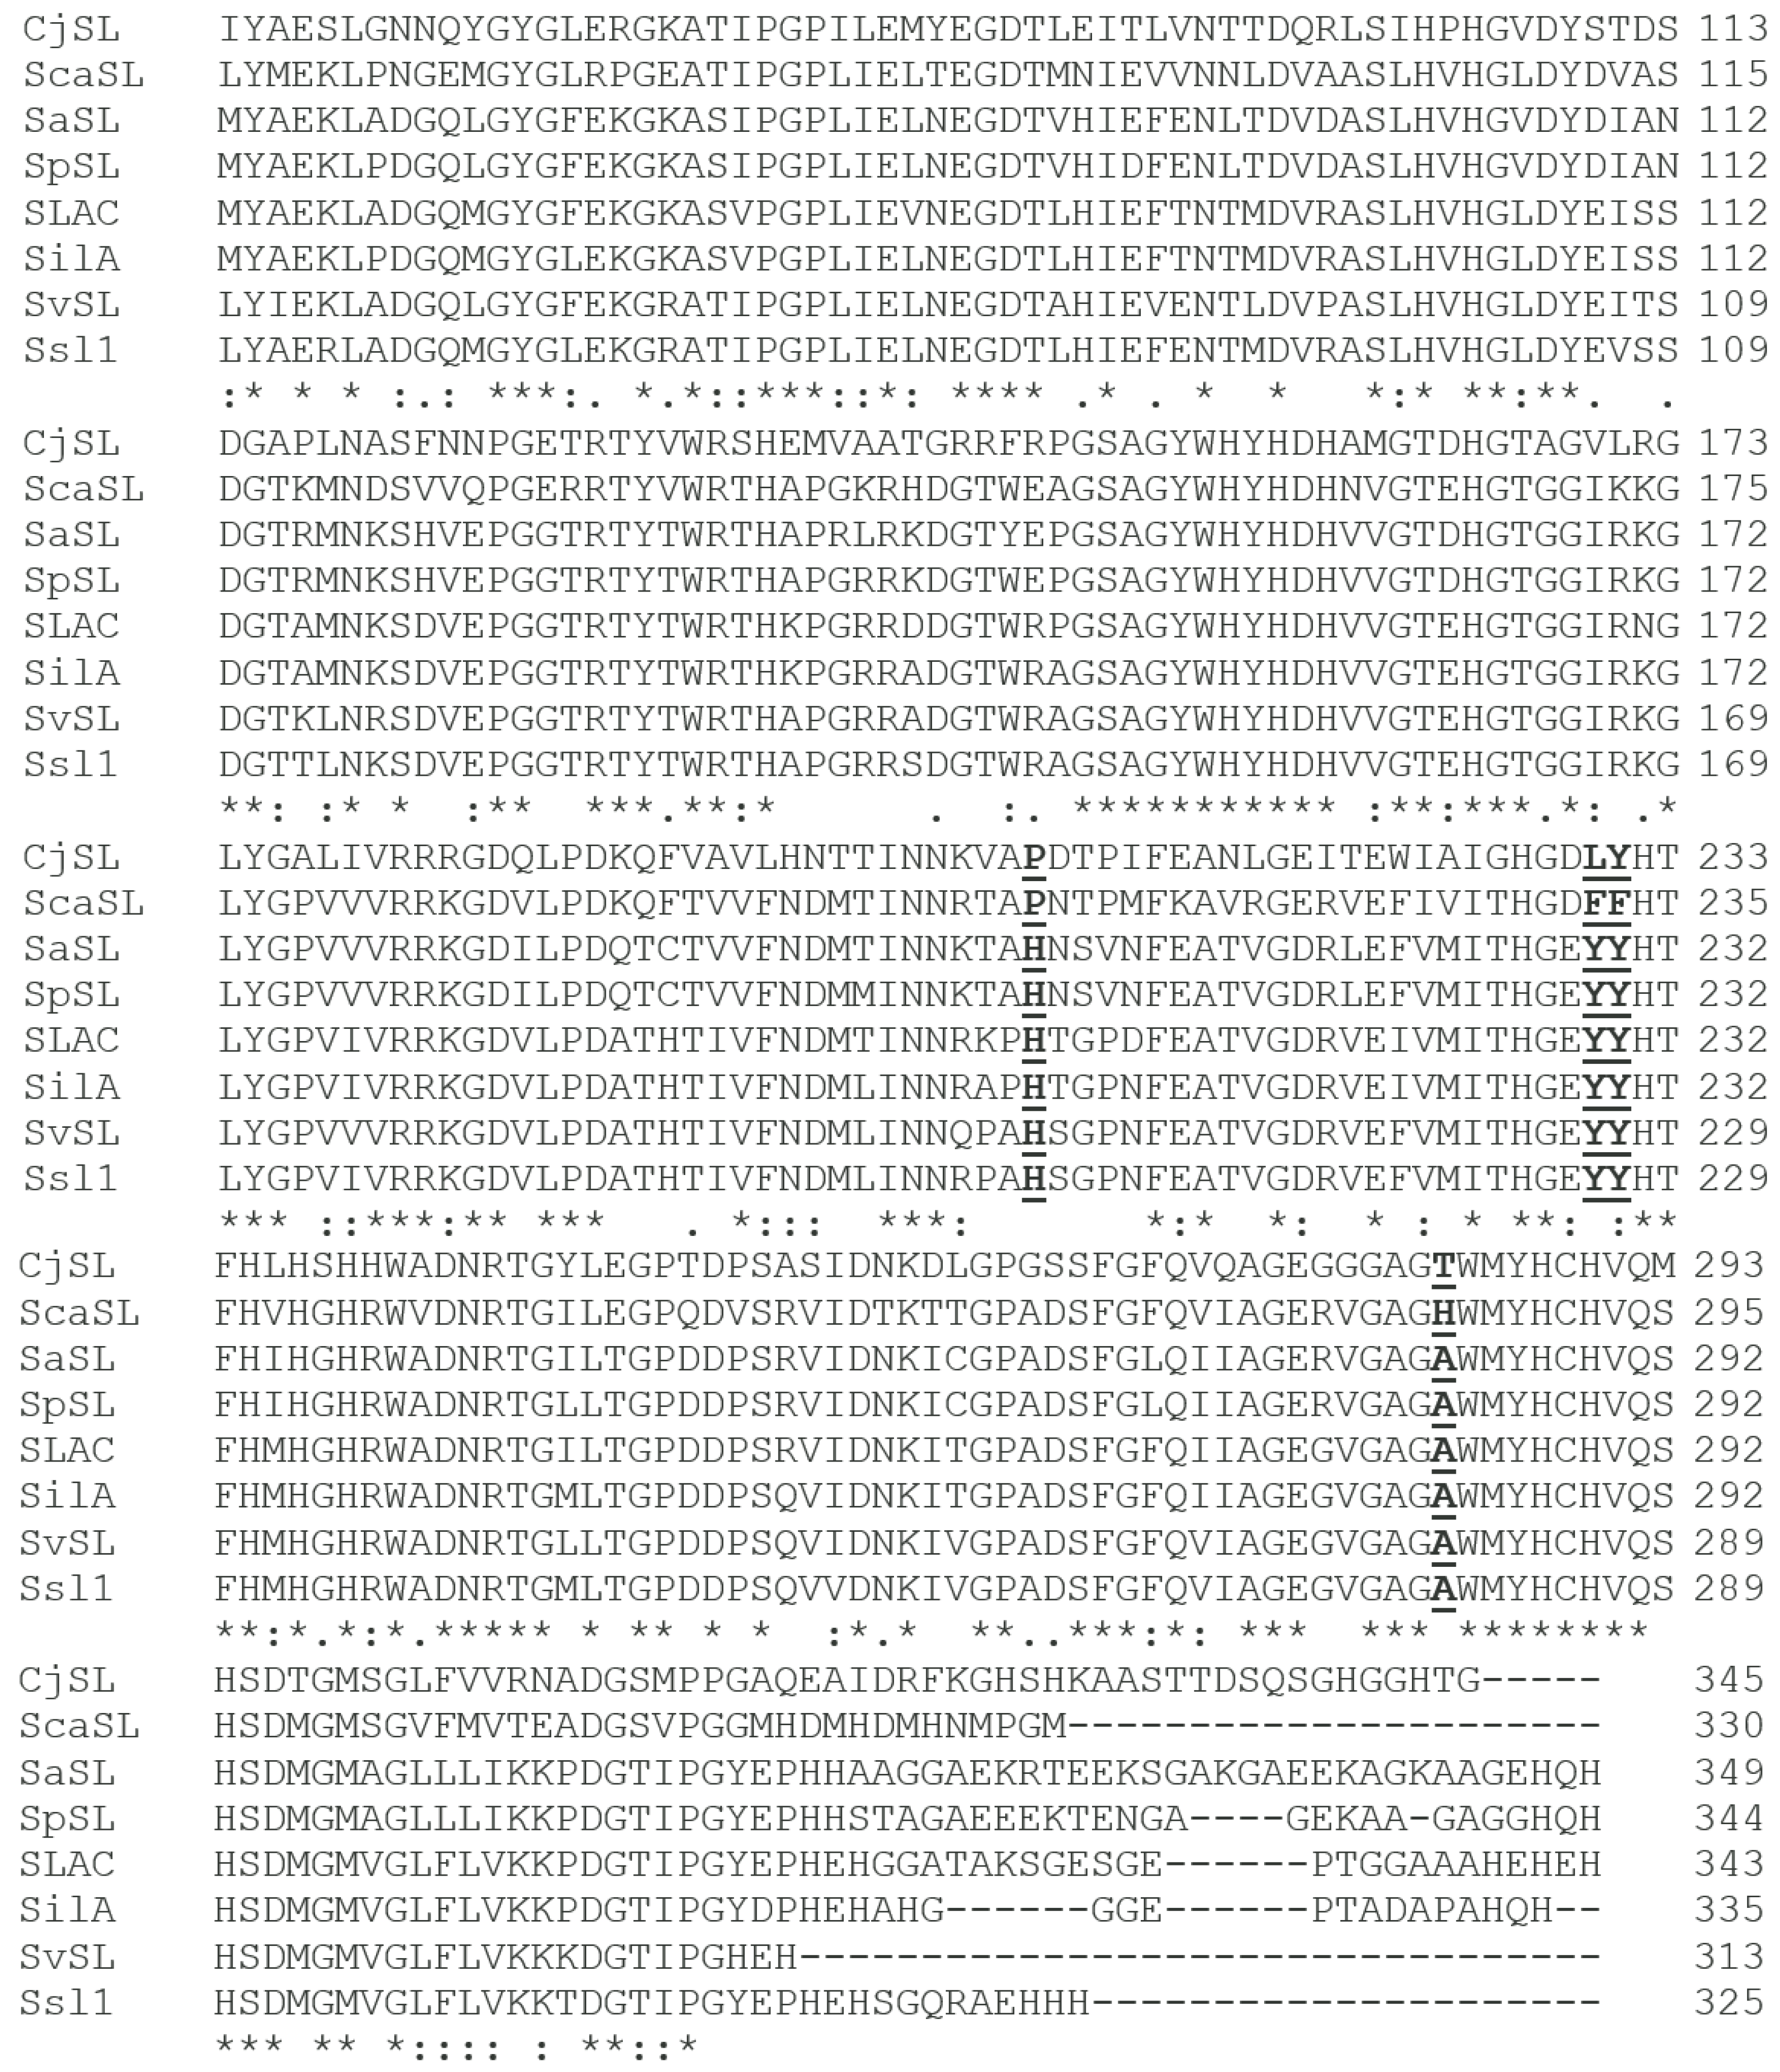
2.1. Alignment of Laccase Sequences and Modeling Their Three-Dimensional Structure

Alignment of amino acid sequences of laccases with a middle (ScaSL and CjSL) and low (SvSL, SaSL, SpSL, Ssl1, SLAC, SilA) redox potential was performed in Clustal Omega (https://www.ebi.ac.uk/jdispatcher/msa/clustalo, accessed on 1 August 2024) (Figure 1). It revealed that there are several residues that could serve as possible determinants of medium redox potential. The sequences used for alignment were ScaSL from S. carpinensis (WP_086728190.1) [22], CjSL from C. japonicas (WP_033344226.1) [23], SvSL from S. viridochromogenes (AFR45923.1) [15], SaSL from S. anulatus (WP_057666916.1) [24], SpSL from S. californicus (MER5815792.1), Ssl1 from S. sviceus (EDY55866.1) [13], sLAC from S. coelicolor (WP_003972284) [16], and SilA from S. ipomoea (ABH10611) [15]. The possible determinants were highlighted in the alignment (see the alignment below, highlighted with bold and underlined).
Of three possible determinants found in the sequence of ScaSL laccase, two were selected for mutagenesis. Histidine residue H286 was selected for mutagenesis due to the analysis of the model of its three-dimensional structure. This histidine residue is localized between T1 and T2/T3 copper atoms (corresponding distances 22.077 and 14.002 Å, respectively) (Figure 2). Its substitution to alanine could lead to the loss of the long-range interaction of imidazole group π-electronic cloud with copper atoms; its substitution to threonine could lead to mostly the same change (but without reducing hydrophilicity), whereas the substitution to tryptophan was selected as a possible mutation in order to increase the size of π-electronic cloud interacting with copper atoms and to enhance the effect of this residue on the redox potential.
Phenylalanine residues F232–F233 were chosen for mutagenesis due to their localization belonging to the second coordination sphere of the copper atom of the T1 center. Their substitution to tyrosine should make the surface interacting with the substrate more hydrophilic (which is observed in most two-domain laccases with low-redox potential) and more polar without decreasing the size of the π-electronic cloud significantly. These residues (Figure 3) are localized in the center of the trimer, and their alteration could disrupt the hydrophobic core of the intersubunit interaction in the trimer.

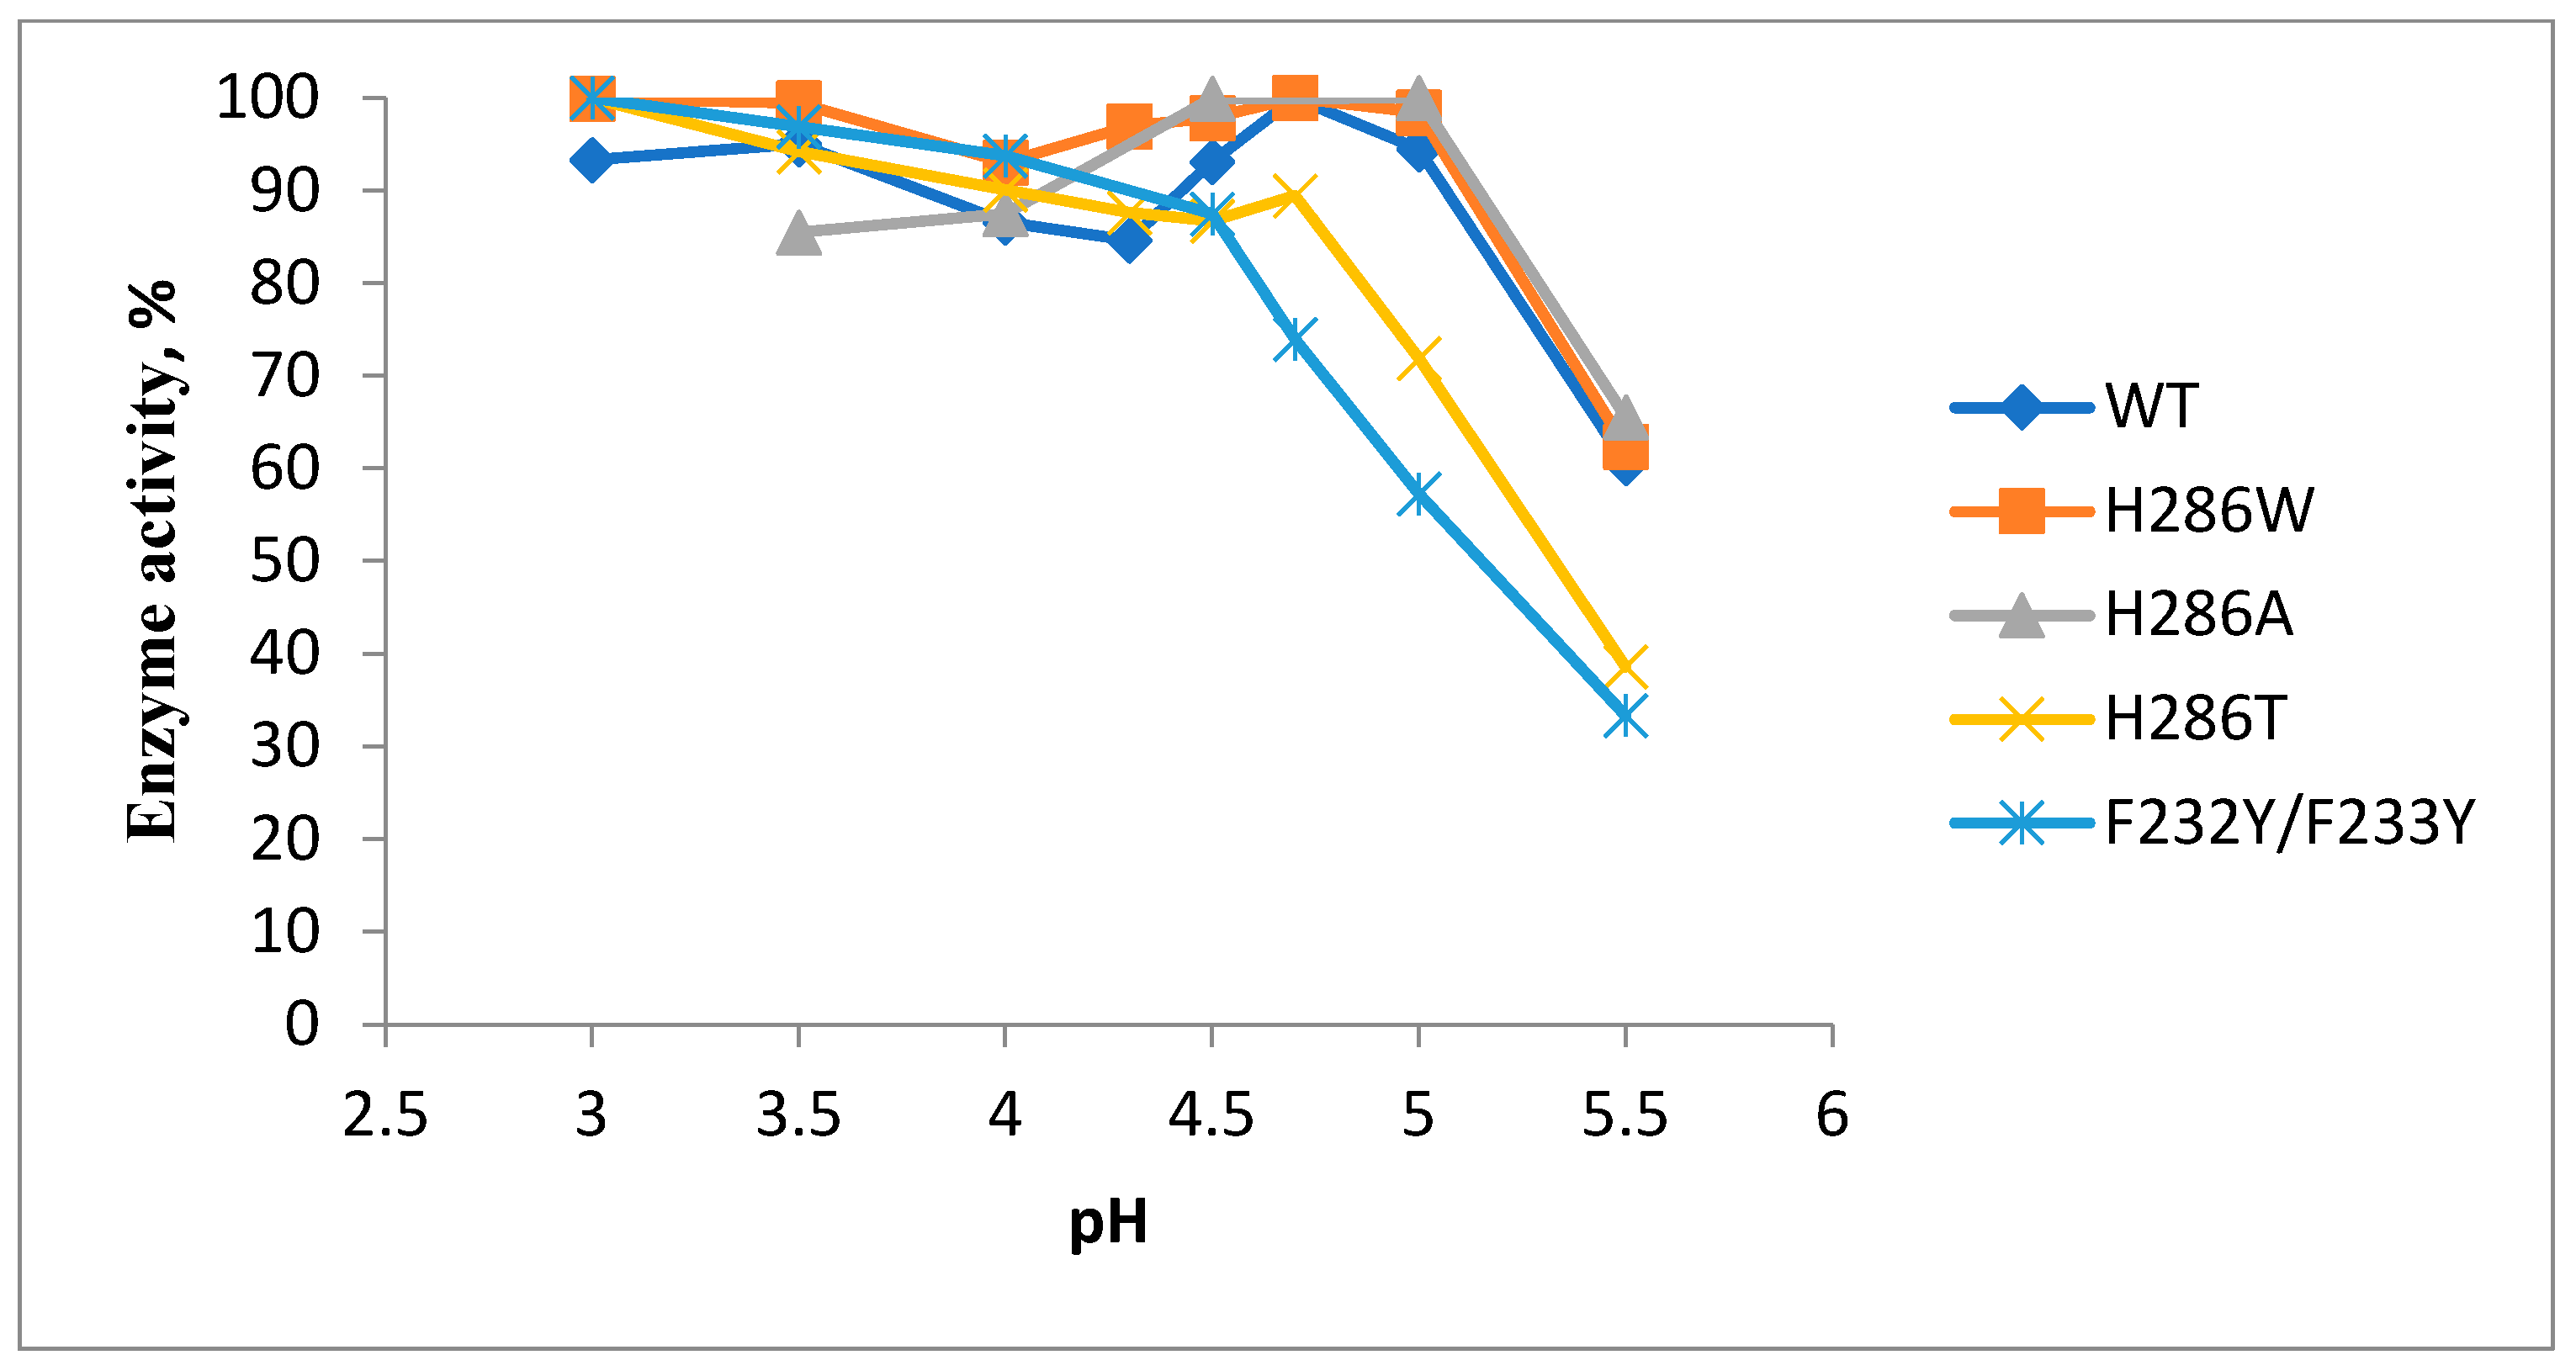
2.2. Production and Physic-Chemical Properties of Mutant Proteins

E. coli cells carrying a vector with ScaSL mutant genes produced laccases H286A, H286T, and F232Y/F233Y with high yields (more than 100 mg per 1 L of culture). However, the yield of laccase H286W was lower, about 40–50 mg per liter of medium. All purified laccases had a distinctive blue color and were obtained in a homogeneous state.
The absorption spectra of two-domain laccases were analyzed (Figure 4). All laccases exhibited an absorption maximum at 590 nm and a shoulder at 330 nm, which is typical for all two-domain laccases.
It was found that the mutant laccases H286A and H286W, like the wild-type laccase, oxidized a non-phenolic organic compound ABTS at the maximum rate in the pH range of 4.5–5.0. However, laccases H286T and F232Y/F233Y oxidized ABTS with a maximum rate at pH 3.0–4.0 (Figure 5). The mutants H286A, H286T, and H286W, like the wild-type laccase, oxidized the phenolic compound 2,6-DMP with a maximum rate at pH 7.5. Conversely, the mutant F232Y/F233Y showed the highest oxidation rate at pH 7.0 (Figure 6).
Mutations affected the stability of the recombinant enzymes. Although all the mutant proteins, like the wild-type protein, were more stable at pH 9 and pH 11, their residual activity after 5 days of incubation at these pH values differed (Table 1). For example, the H286A mutant showed greater residual activity at both pH 9 and 11 (95% and 82% of residual activity, respectively), while the F232Y/F233Y mutant had less (54% and 49%, respectively). The H286T and H286W mutants were more stable than the ScaSL variant at pH 9 (77% and 72%, respectively) but less so at pH 11 (57% and 61%).
Table 1 presents data on the residual activity of mutant and wild-type laccases after 1 h of incubation at 70 °C, 80 °C, and 90 °C. The thermal stability of H286A and H286W differed slightly from that of the wild-type laccase. H286T and F232Y/F233Y mutants were less stable at 80 °C and 90 °C than other laccases.

2.3. Redox Potential and Kinetic Characteristics of Mutant Laccases

Kinetic constants of the ScaSL mutants were determined with non-phenolic organic substrate ABTS and phenolic substrate 2,6-DMP. The data are presented in Table 2.
Mutations affected the affinity of the enzymes for substrates and the rate of enzyme reaction. The H286T mutant had the highest redox potential of the T1-copper center.

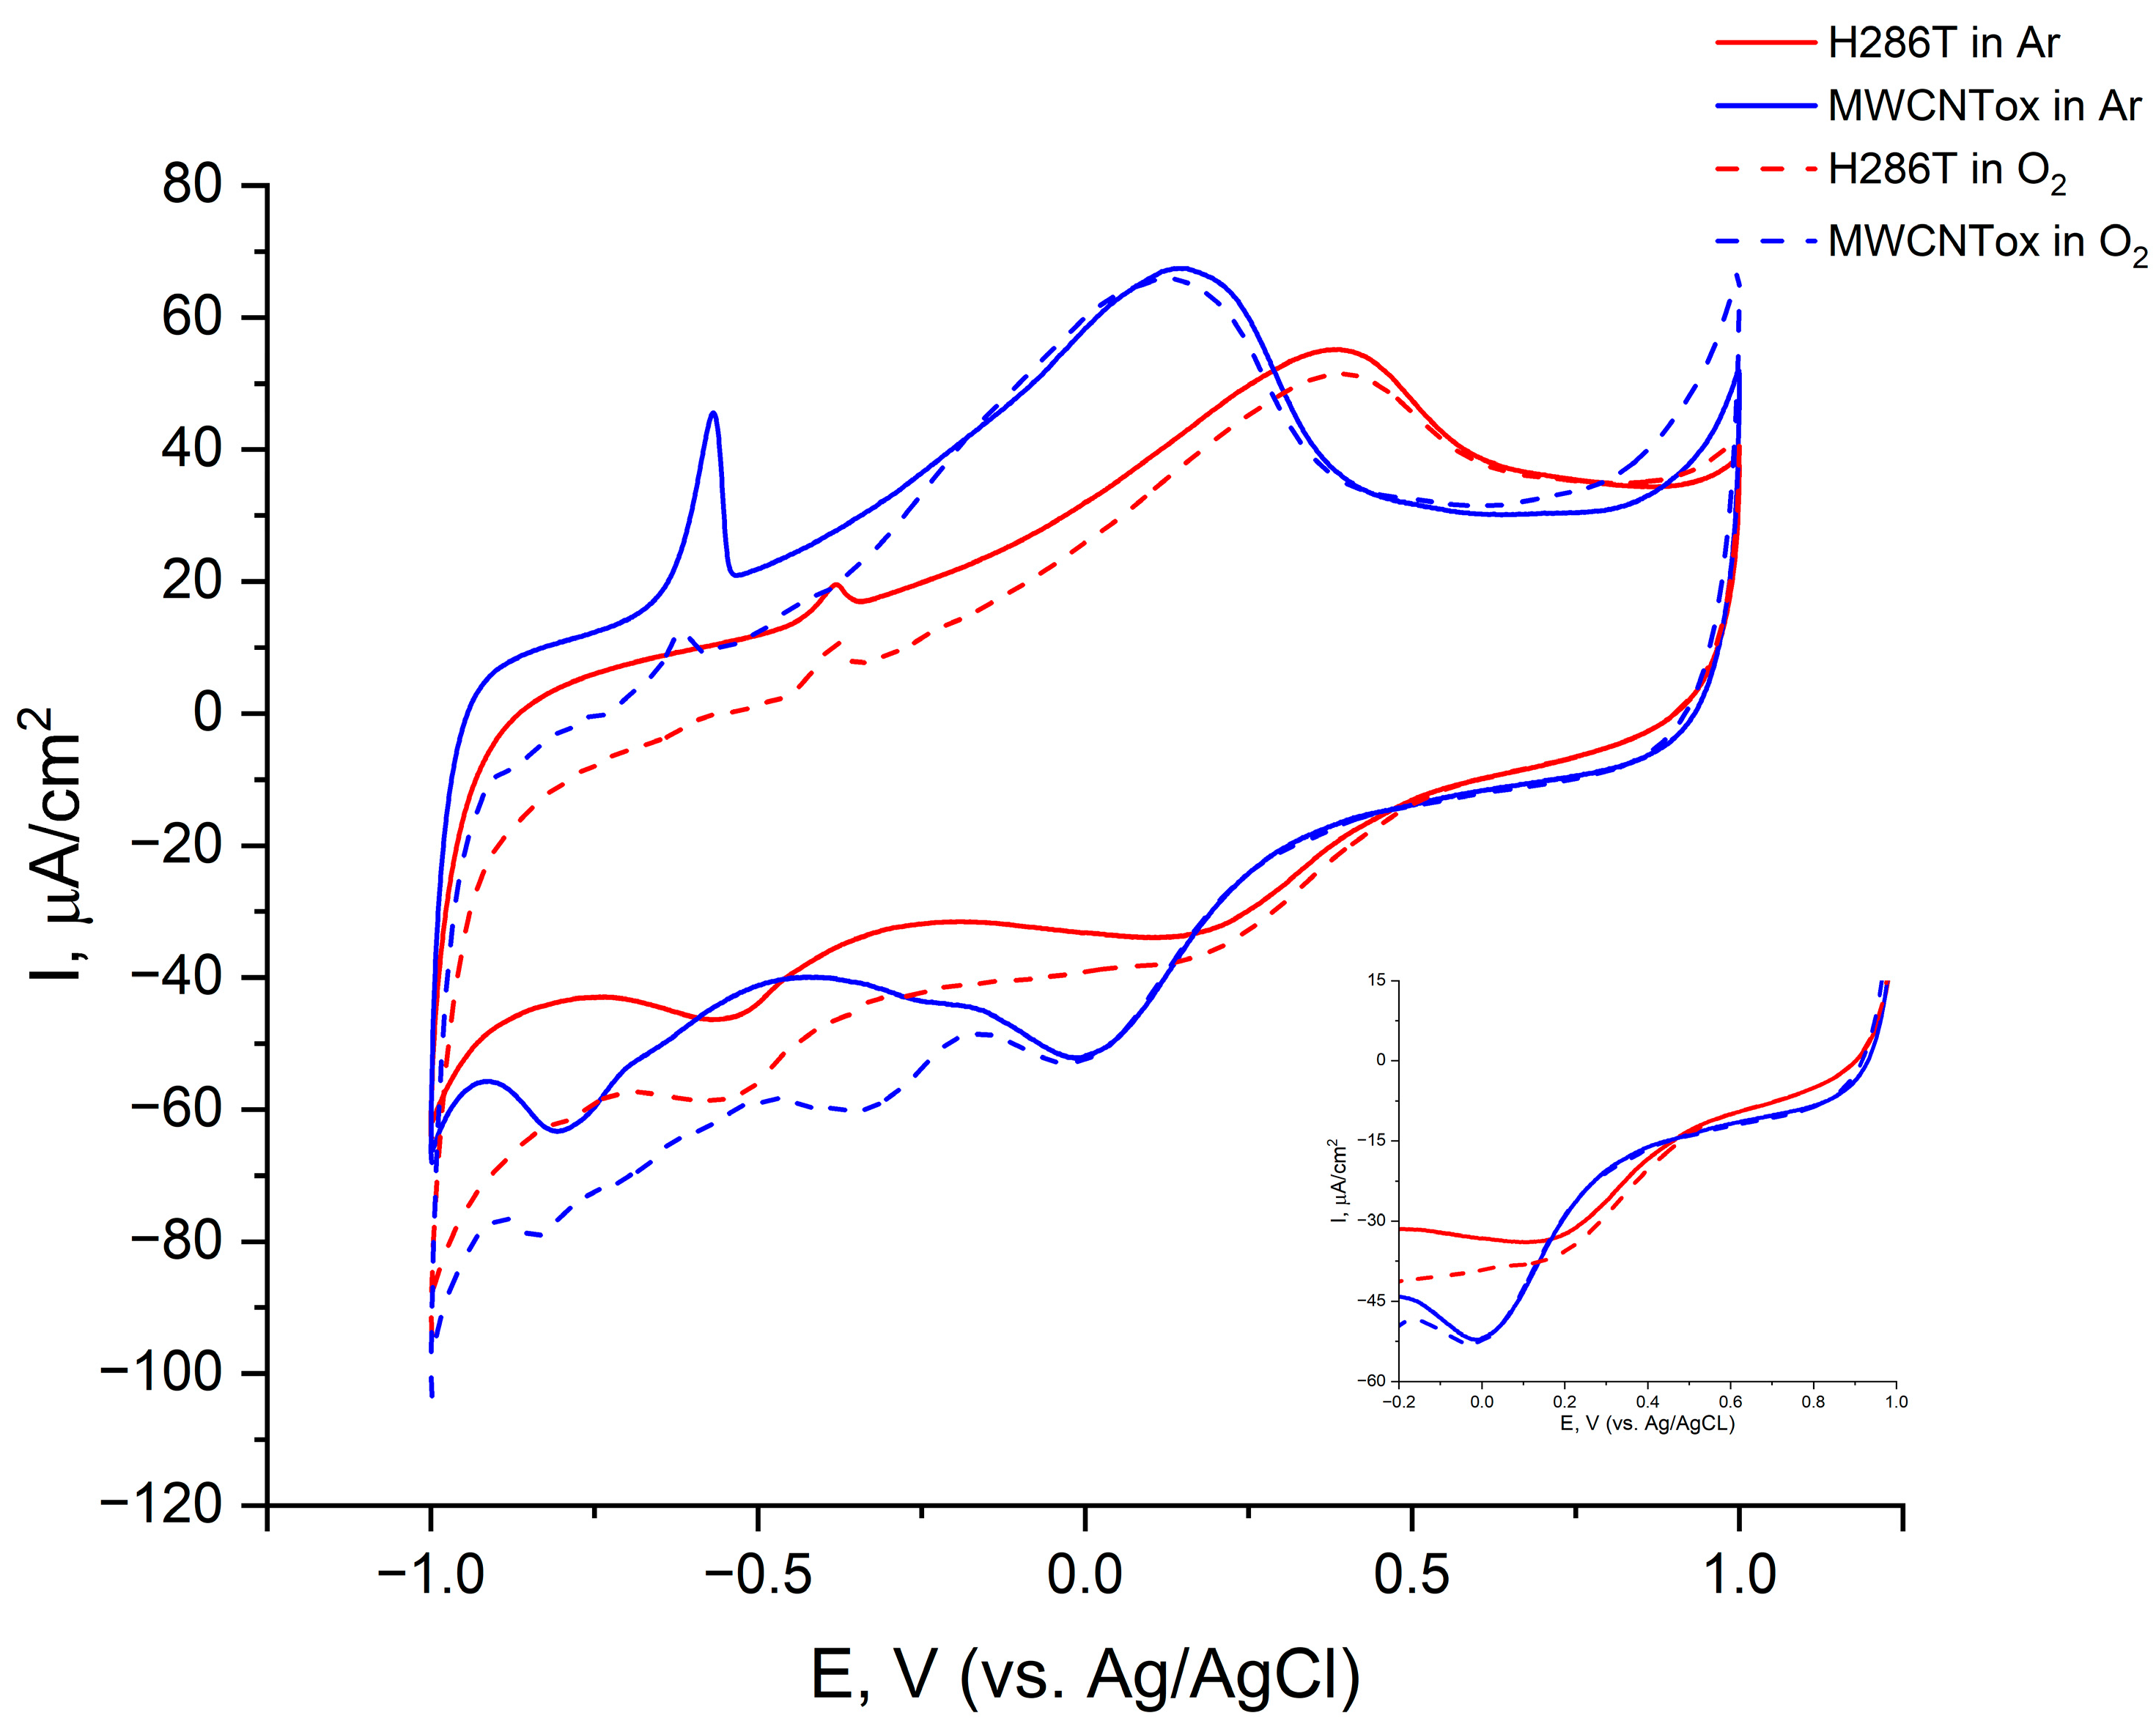
2.4. Bioelectrocatalysis

For the occurrence of direct electron transfer (DET) between the electrode and the redox cofactor of the enzyme, the distance should not exceed 20 Å (2 nm). That is, the electrode is a substrate for laccase. DET between the electrode surface and laccase is only possible if the enzyme is oriented relative to the electrode surface by its T1 center (Figure S1).
We were able to provide direct electron transfer in bioelectrocatalytic systems based on two-domain bacterial laccases and multi-walled oxidized carbon nanotubes (MWCNTox).
Graphite rod electrodes (GREs) and pencil graphite electrodes (PGEs) [25] were used to study bioelectrocatalytic oxygen reduction in the presence of laccases, the surface of which had been modified with MWCNTox, as described in [26]. Enzymes were applied to the end surface of the electrodes. Figure 7 shows the voltammograms of glass–carbon electrodes modified with MWCNTox and the mutant H286T laccase.
At potentials above 0 V (vs. Ag/AgCl), no oxygen reduction currents were recorded in an electrochemical system based on a modified MWCNTox/glass–carbon electrode. The polarization reduction waves in argon and air media did not differ (Figure 7, blue solid and dotted curves). However, in the presence of laccase, an increase in reduction current in a dioxygen medium was observed at potentials as low as 0.5 V (Figure 7, red dotted curve). This increase is due to the molecular oxygen reduction process catalyzed by laccase (direct electron transfer). Similar results were obtained for other enzymes studied, where an oxygen reduction current appeared in the range of 0.3–0.5 V (Figure S2).
DET is thermodynamically feasible when the redox potential of laccase is higher than the potential applied to the electrode [27,28]. The potential at which the oxygen reduction current is not observed can be considered the redox potential of laccase under these conditions. To determine the value of laccase’s redox potential, the chronoamperometry method was used, which has recently made it possible to characterize CjSL laccase as a medium-potential oxidase [26]. Figure 8 shows the chronoamperometric curves of the laccase mutant H286T/MWCNTox modified electrode at different potentials.
On the obtained chronoamperograms, after oxygen supply (turning on the agitator), the current value increased at potentials +0.1 and +0.2 V vs. Ag/AgCl. However, further increasing the applied potential led to a decrease in the reduction current of dioxygen until it completely disappeared. Based on these chronoamperometric studies, we determined the redox potentials of ScaSL and H286 mutants in a bioelectrochemical system with MWCNTox (Table 3). These values correlated with the T1 potential values of the enzyme center, which were determined by redox titration.
A comparative analysis of the effectiveness of bioelectrocatalysis was carried out based on the value of oxygen reduction current at 0.2 V (vs. Ag/AgCl), as shown in Table 3.
All laccases (wild-type and mutants) have practically no difference in the effectiveness of bioelectrocatalysis.

2.5. Dye Decolorization

The purified laccases ScaSL (WT), H286A, H286T, and H286W were able to efficiently decolorize triphenylmethane dyes, malachite green and brilliant green, at pH 4.5 without a mediator (Table 4, Figure S3). The decolorization rate of brilliant green by laccases was 92–95%/day. The decolorization rate of malachite green by laccases was 77–89%/day. Azo dyes methyl orange and Congo red were unoxidizable by laccase without a mediator or oxidized, with a low rate (8%/day and less) (Table 4).
The highest decolorization rate for brilliant green and malachite green was observed with enzymes ScaSL and H286T in the presence of SA. It reached 96%/day and 93%/day for each dye, respectively. Azo dye methyl orange was degraded with the highest rate at pH; 4.5 and pH 4.0 (for F232Y/F233Y) in the presence of ABTS (decolorization rate was 50–61%/day), whereas in the presence of syringaldehyde, the rate was much lower (26–31%) (Table 5). Laccases were able to decolorize azo dye Congo red at pH 7 and 7.5 in the presence of ABTS. The highest decolorization rate was observed with enzyme F232Y/F233Y. It reached 61%. Control samples without enzymes were run in parallel under the same conditions. No change in adsorption was observed in the control sample.

2.6. Crystal Structure of H286T Mutant

Histidine 286 is located on the laccase surface near the entrance to the channel leading to the T3β copper ion in the T2/T3 center. Presumably, dioxygen enters the T2/T3 active center through this channel [29,30]. In the ScaSL mutant, His286, which is positively charged at low pH, is replaced by polar threonine (Figure 9).

3. Discussion

In the course of this study, site-directed mutagenesis was carried out for the two-domain laccase ScaSL with a middle redox potential in order to identify determinants located on the periphery of the T1 copper center that can affect protein conformation, the availability of laccase active centers for substrates, including molecular oxygen, and as a result, redox potential and catalytic efficiency of ScaSL. To select the positions for mutations, a multiple alignment of middle- and low-potential two-domain laccases was performed, along with an analysis of the three-dimensional structure of laccases. Two amino acid residues of phenylalanine were selected as potential positions for mutation, as they are present in ScaSL but absent in low redox potential two-domain laccases (Figure 1). These residues are located in the laccase substrate-binding pocket and belong to the second coordination sphere of the T1 center. As can be seen in Figure 3, the presence of two phenylalanine residues in the substrate-binding pocket makes it hydrophobic in middle-potential laccases. In contrast, two tyrosine amino acid residues present in low-potential laccases, as shown in Figure S4, reduce the pocket’s hydrophobicity.
We assumed that replacing phenylalanines with tyrosines in laccase would lead to a decrease in its redox potential. However, this was not the case for the F232Y/F233Y mutant. Instead, the mutation seemed to affect the pH and thermal stability of the enzyme, as well as shifting downward the optimal pH for oxidation of ABTS and 2,6-DMP. Interestingly, laccase also began to oxidize these substrates more efficiently after the mutation. Similar results were observed in other studies on site-directed mutagenesis of laccase [16,19]. One study focused on the second coordination sphere of the T1 center and found that mutations affected the substrate-binding pocket, specifically the positions of tyrosine (229), valine (290), and serine (292). In this case, replacing tyrosine with phenylalanine did not increase the redox potential but did change the catalytic properties, leading to an increase in kcat value for ABTS. In another study, the valine at position 290 was replaced with asparagine in the protein. This led to a decrease in the thermal stability of the mutant protein and a shift downward in the pH optimum.
The loss of the F232Y/F233Y mutant’s ability to oxidize triphenylmethane dyes without mediators can be attributed to a decrease in the hydrophobicity of the substrate-binding pocket. At the same time, the effectiveness of hydrophobic interactions between the phenolic groups of the substrate and the tyrosine core of the substrate-binding pocket decreases. As a result, direct electron transfer from the dye molecule to the active site of laccase is no longer possible.
Multiple alignments also revealed another potential determinant for site-directed mutagenesis: the histidine at position 286. This amino acid is not part of the second coordination sphere of the T1 center or an axial ligand to the copper atom in the T1 center. Instead, it is located on the surface of the protein, near the entrance to the tunnel leading to the T2/T3 copper center. This location suggests that it may reduce the availability of dioxygen for the active site and indirectly affect the redox potential of the laccase. In low-potential laccases, the hydrophobic amino acid alanine is typically found at this position. However, in CjSL laccase, which has a higher potential than ScaSL laccase, a polar uncharged amino acid threonine is found instead. We assume that the H286A mutation would decrease the potential while the H286T mutation would increase it. Additionally, we replaced the histidine with tryptophan in our experiments. We hypothesized that replacing a charged aromatic heterocyclic amino acid with an uncharged one would affect the properties of the mutant. Consistent with our expectations, the potential of the H286A mutant decreased, and its stability increased at pH 9 and 11. However, the potential of the H286T mutant increased, although its thermal stability decreased. The H286W mutation resulted in a slight increase in potential, although the enzyme did not significantly differ in its physic-chemical properties from the wild-type. It is worth noting that all mutants were able to oxidize ABTS and 2,6-DMF substrates more efficiently and discolor triphenylmethane dyes in the absence of mediators.
However, amino acid substitutions had virtually no effect on the efficiency of bioelectrocatalytic oxygen reduction on electrodes modified by MWCNTox. It is known that an important role in the organization of efficient electron transfer is played not only by redox potential but also by other factors such as the orientation of protein molecules immobilized on the electrode [31,32,33] or a change in internal ET [34]. A similar result was obtained when studying the bioelectrocatalytic reduction of dioxygen with high redox potential fungal laccase [35]. Electrochemical characterization of the GreeDo variant of a high redox potential fungal laccase obtained by laboratory evolution together with computer-guided mutagenesis, in comparison to its parental variety (the OB-1 mutant), were capable of both non-mediated and mediator-based bioelectroreduction of molecular oxygen at low overpotentials. However, even though in homogeneous catalysis, GreeDo outperforms OB-1 in terms of turnover numbers and catalytic efficiency, when exposed to high redox potential substrates, direct electron-transfer-based bioelectrocatalytic currents of GreeDo and OB-1 modified electrodes were similar.
To clarify the role of His286 in internal electron transfer, the most effective biocatalyst, the H286T mutant, was crystallized, and its structure was determined. Comparative analysis of the structures of H286T with ScaSL did not reveal significant changes in the structure of active sites in the mutant protein. It is possible that the location of this amino acid near the entrance to the T2–T3 channel affects the ability of molecular oxygen to diffuse into the active center of laccase. This leads to a change in the thermodynamic characteristics of the biocatalyst and its ability to oxidize a wider range of dyes.
The replacement of phenylalanines with tyrosines influenced the geometry and hydrophobicity of the laccase’s substrate-binding pocket but not the redox potential of the T1 active center. Interestingly, the replacement of one of the two tyrosine residues with alanine in the active center of 2D laccase from Streptomyces griseoflavus [36] also led to a shift in the pH optimum for ABTS oxidation to a more acidic region.

4. Materials and Methods

4.1. Alignment and Modeling of Three-Dimensional Structure of Laccase

Multiple alignment of laccase amino acid sequences was performed in Clustal Omega [37]. An amino acid was considered a determinant of middle redox potential if it was present in middle-potential laccases and absent in low-potential laccases and also if it could interact with copper atoms of T1 and/or T2/T3 centers. To assess such interactions, models of three-dimensional structure were built in MODELLER [38] using the experimental three-dimensional structure of laccase from Streptomyces coelicolor (PDB ID: 3CG8 [39]). Analysis of the three-dimensional structure was performed in YASARA Structure [40]; the distance from the selected residue to the copper atoms was measured in angstroms.

4.2. Construction of the ScaSL Mutants and Proteins Purification

A gene for ScaSL (NCBI WP_086728190.1) lacking the sequence of the signal sequence (37 amino acid residues) was used to produce the following mutant proteins ScaSL: H286A, H286T, and H286W. Mutations were introduced with primers harboring the desired codon exchanges (indicated by underlining): 1300His286AlaF GGTCGGCGCGGGCGCCTGGATGTACCACTG, 1300His286AlaR CAGTGGTACATCCAGGCGCCCGCGCCGACC; 1300His286TrpF GGTCGGCGCGGGCTGGTGGATGTACCACTGC, 1300His286TrpR GCAGTGGTACATCCACCAGCCCGCGCCGACC; 1300His286ThrF GGTCGGCGCGGGCACCTGGATGTACCACTGC, 1300His286ThrR GCAGTGGTACATCCAGGTGCCCGCGCCGACC. A plasmid pQE::scasl [22] was used as a template in PCR with KOD DNA Polymerase. Amplicons were digested with DpnI to eliminate non-mutated variants and then transformed into rubidium-competent cells. Correct sequences of laccase genes were verified by sequencing.
To introduce the F232Y and F233Y mutation into the ScaSL protein, a recombinant plasmid containing a gene with the necessary point mutations was constructed. Three DNA fragments were amplified: pQE30_core (QE30_HindIII_F 5′ TGAAAGCTTAATTAGCTGAGCTTGG 3′ and QE30_SacI_R 5′ TGAGCTCGCATGCGGATC 3′), GOI_up (ScaSL_up_SacI_F 5′ CGAGCTCACCTCGGACAAGCCC 3′ and ScaSL(EE)up_SapI_ R 5′ ACTGCTCTTCATTCTTCGTCGCCGTGGGTGATCAC 3′), GOI_down (ScaSL(EE)down_SapI_F 5′ ACAGCTCTTCTGAACACACCTTCCACGTGCAC 3′, and ScaSL_down_HindIII_R 5′ ATTAAGCTTTCACATGCCGGG 3′). The recombinant plasmid was assembled using the restriction–ligation method. The correctness of the mutation was confirmed by sequencing.
Plasmids carrying a correct gene mutation were used to transform E. coli M15 [pREP4] cells (Qiagen). Cells were grown, and the proteins were isolated as in [22]. ScaSL mutants H286A, H286T, H286W, and F232Y/F233/Y were obtained from cells growing in the presence of 1 mM CuSO4 and then were dialyzed against 20 mM Tris-HCl (pH 9.0). Enzymes were stored at 8 °C.

4.3. Characterization of ScaSL Mutants

Protein concentration was determined using a molar extinction coefficient calculated from the protein sequence using the Vector NTI Program (Life Technologies, Carlsbad, CA, USA). H286A ε280 = 38.930 M–1·cm–1, H286T ε280 = 38.930 M–1·cm–1, H286W ε280 = 44,620 M–1·cm–1, F232Y/F233/Y ε280 = 31.490 M–1·cm–1. Molecular weight of the enzymes was determined with SDS-PAGE, according to Laemmli [41]. Activity of laccase was routinely determined at room temperature from the rate of 2,6-dimethoxyphenol (2,6-DMP) oxidation (ɛ469 = 49.600 M–1·cm–1) [42] and 2,2-azino-bis-(3-ethylbenzthiazoline-6-sulfonate) (ABTS) oxidation (ε420 = 36.000 M–1·cm–1) [43] in a 50 mM Britton–Robinson buffer [44]. UV-visible absorption spectrum of laccases was recorded in the wavelength range from 700 to 300 nm (using a Shimadzu UV-1800 spectrophotometer, Shimadzu, Kyoto, Japan). The pH optimum of enzyme activity was determined using 50 mM Britton–Robinson buffer within the pH range of 3 to 5.5 for ABTS and from 5.5 to 9 for 2.6-DMP.
Stability of enzymes was determined at pH 3, 5, 7, 9, 11 using 100 mM Britton–Robinson buffer. Residual activity was routinely determined for 5 days at room temperature in 50 mM Britton–Robinson buffer with 0.2 mM ABTS. Thermal stability was determined by measuring the residual activity of laccases incubated at 70 °C, 80 °C, and 90 °C for 1 h in 50 mM Britton–Robinson buffer with 0.2 mM ABTS. Steady-state kinetic constants were obtained at 30 °C for the substrates ABTS and 2,6-DMP at pHs 4.7 and 7.5, respectively, for H286A, H286T, and H286W, and at pHs 4.0 and 7.0, respectively, for F232Y/F233/Y. Calculation of kinetic constants was performed using nonlinear regression of the data with the Sigma Plot 11.0 software.

4.4. Redox Potential Determination by Redox Titration

Redox potential of the T1 site of H286A, H286T, H286W, and F232Y/F233/Y mutants was determined by redox titrations [45]. Redox potentials were calculated according to the Nernst equation, where E0 of the redox couple K3[Fe(CN)6]/K4[Fe(CN)6] was 0.433 V [46]. Reduction of T1 site was monitored by the decrease in the absorption maximum at 590 nm. To provide anaerobic conditions, titrations were performed under a nitrogen atmosphere (solutions and cuvettes were purged with pure nitrogen before the addition of the enzyme) [14,20].

4.5. Bioelectrocatalysis

4.5.1. MWCNTox Characteristics

The outer diameter of individual nanotubes is between 10 and 30 nanometers, the inner diameter is between 5 and 15 nanometers, and the length is approximately 2 μm. The specific surface area of these nanotubes exceeds 270 square meters per gram. MWCNTox (10 h of oxidation) were produced by treating CNTs “Taunit-M” from the Nanotech Center LLC, Tambov, Russia, with boiling nitric acid for 10 h (pure for analysis). After oxidation, the CNTs were separated from the excess acid, washed on a filter to achieve a neutral pH, and then dried by freeze-drying on a Scientz-10N instrument (Scientz, Ningbo, Zhejiang, China) [26].

4.5.2. Preparation of Modified Electrodes

The glass–carbon electrode from Zhuhai Minngchuan Technology (Zhuhai, China) was prepared by sanding it with aluminum oxide powder and filter paper. After that, 4 μL of MWCNTox solution (2 mg/mL) was applied to the surface of the working electrode with a diameter of 2 mm. The solution was allowed to dry for 1 h at 100 °C. Laccase immobilization was carried out using the adsorption technique. A solution of laccase in 20 mM Tris HCl buffer (pH = 9.0), with a concentration of 1.4 mg/mL, was applied to the electrode and allowed to dry at room temperature for 15–20 min. After washing with a buffer solution, the electrode was ready for electrochemical measurements
Pencil graphite electrodes (Visconti Graphix, Florence, Italy, hardness HB, diameter 2.0 mm) were washed with distilled water and treated with acetone using ultrasound for 5 min. The electrodes were then dried at 100 °C for 1.5 h to remove any residual solvent. MWCNTox was then dispersed in deionized water using ultrasound (10 mg/5 mL) for 10 min to prepare a solution. The prepared MWCNTox solution was applied to the electrodes by immersion, and the modified electrodes were placed in an oven at 100 °C for another 1.5 h.

4.5.3. Electrochemical Measurements

Voltammetry measurements were carried out using the CS Studio (Corr Test Instruments, Wuhan, China) electrochemical station in a three-electrode electrochemical cell. A modified glass–carbon electrode served as the working electrode, while a silver chloride electrode filled with 0.01 M KCl served as the reference electrode. A platinum electrode with dimensions 1 × 1 × 0.1 cm was an auxiliary electrode. The measurements were performed in 0.1 M sodium acetate buffer with a pH of 5 and a concentration of 0.01 M KCl. Cyclic voltammetry was carried out for each laccase sample, both in an argon atmosphere and in air, with and without 0.1 mM ABTS. The solution was considered saturated with oxygen after bubbling for 15 min with air. Measurements in argon were performed after bubbling with argon for 40 min. All measurements were repeated at least three times for accuracy. Cyclic voltammograms were recorded between −1 and 1 V with a scan rate of 50 mV/s.
The oxygen reduction current was calculated using Equation (1):
I = I O 2 I A r 0.0314
where I is the oxygen reduction current at 200 mV (500 vs. NBE);
I O 2 —current in oxygen at 200 mV (410 vs. NBE), µA·cm–2;
IAr—current in argon at 200 mV (410 vs. NBE), µA·cm–2;
0.0314—working electrode surface area, cm2.
Chronoamperometry measurements were conducted using Corr Test Instruments’ CS Studio electrochemical station (Corr Test Instruments, Wuhan, China), using a two-electrode electrolytic cell. A modified glass–carbon electrode was used as the working electrode, while a silver chloride electrode filled with 1 M KCL was used as the reference electrode. The measurements were carried out in a 4 mL pre-degassed Na-acetate buffer solution (pH = 5.0) in an oxygen-containing environment with stirring and in an argon-filled environment with reduced oxygen content. A total of 50 μL of 1 mM ABTS was used as a mediator, and an oxygen sensor was used to monitor the oxygen content of the cell. The response was measured as the difference between the initial current (at the start of stirring) and the final current (after reaching a steady state) of oxygen reduction in the medium.

4.5.4. Redox Potential Determination by Chronoamperometric Measurements

Chronoamperometric measurements were performed in a sealed electrochemical cell in a 15 mL sodium acetate buffer solution (pH = 5) using the CS Studio electrochemical station (Corr Test Instruments, Wuhan, China). A two-electrode system was used consisting of a silver chloride electrode filled with saturated KCl and a modified working electrode. The time dependence of the current was measured at different potentials (0, 50, 100, 150, 200, 250, 300 mV and above) until the direct electron transfer current reached zero. An anaerobic environment in the cell was achieved by bubbling argon through the solution for 30 min to remove oxygen. After reaching a constant current, the medium was saturated with oxygen using an air compressor NR-841550 (Naribo, Zhongshan, China). The potential at which the oxygen supply current remained unchanged was assumed to be the potential of the active site of the enzyme. This value was calculated by taking the average of three repeated measurements.

4.6. Dye Decolorization

The decolorization of the following triarylmethane dyes by laccase was tested: malachite green (λmax = 617 nm (pH 4.0 for F232/F233Y and pH 4.5 for other enzymes)), brilliant green (λmax = 624 nm (pH 4.0 for F232/F233Y and pH 4.5 for other enzymes)); azo dyes: methyl orange (λmax = 463 nm (pH 4.0 and pH 7.0 for F231Y, pH 4.5 and pH 7.5 for other enzymes)), Congo red (λmax = 501 nm (pH 4.0 for F232/F233Y and pH 4.5 for other enzymes); λmax = 488 nm (pH 7.0 for F232/F233Y and pH 7.5 for other enzymes). The reaction mixture (1 mL) contained 50 mM Britton–Robinson buffer (pH 4.0, 4.5, 7, or pH 7.5), dye (final concentration—50 µM), and purified enzyme—5 µg. A total of 25 µM ABTS and 25 µM syringaldehyde (SA) were used as potential redox mediators. Reaction mixture was incubated at 30 °C for 24 h. Control samples without enzyme were run in parallel under the same conditions. The dye degradation was judged by change in absorption spectrum of the oxidized compound and expressed in decolorization rate [23]. The calculation formula: D = (A0 − A1)/A0 × 100%, where D represents the decolorization rate (%/day), A0 is the initial absorbance of the dye solution at the maximum absorption wavelength, A1 results from the initial absorbance of the dye solution at the maximum absorption wavelength after the reaction.

4.7. Crystallization and Crystallography

Crystallization experiments were performed at 22 °C using the hanging-drop vapor-diffusion method on siliconized glass cover slides in Linbro plates (Molecular Dimensions, Sheffield, UK). Crystallization drops were made by mixing 1 μL of protein solution with concentration 40 mg/mL and 1 μL of reservoir solution. Crystals of H286T mutant laccase were obtained in 0.2 M ammonium sulfate, 0.1 M sodium acetate, pH = 4.6, 25% v/v PEG Smear broad (condition #34 of BCS-1, «Molecular Dimensions»,UK). Prior to flash freezing, a single crystal was soaked in a cryo solution consisting of 0.07 M sodium acetate trihydrate, pH = 4.6, 5.6% PEG 4000, 30% v/v glycerol (condition #37 of Crystal Screen Cryo from Hampton Research, Aliso Viejo, CA, USA).
The diffraction data from the H286T mutant crystal were collected using a home-source Rigaku XtaLAB Synergy-S laboratory system (The Woodlands, TX, USA) [47]. The reflection data were processed and merged using CrysAlis software 42.89a [48]. The structures were determined using molecular replacement with Phaser [49], with the wild-type structure of two-domain laccase from Streptomyces carpinensis, determined at a 2.35 Å resolution (pdb id 8AIP), being used as a search model. The water molecules were removed from the model. The initial model was subjected to crystallographic refinement with REFMAC5 [50]. The manual rebuilding of the model was carried out in Coot [51]. The final cycle, with occupancy refinement, was performed in Phenix [52]. The data and refinement statistics are summarized in Table 5. The atom coordinates and structure factors were deposited in the Protein Data Bank. Figures were prepared using PyMOL v.3.0 [53].

5. Conclusions

Site-directed mutagenesis of two-domain laccase ScaSL from Streptomyces carpinensis VKM Ac-1300 was performed. It affected the amino acid on the surface of the protein at the entrance to the channel of the T2/T3 site, as well as the amino acid in the second coordination sphere of the copper atom of the T1 center.
Mutations on the surface of the protein affected the redox potential as well as the physicochemical properties of mutant enzymes. Replacement of histidine 286 with alanine led to a slight decrease in redox potential and an increase in stability at pH 9 and 11; replacement of histidine 286 with threonine led to an increase in redox potential but to a decrease in the thermal stability of the protein. Thus, despite the fact that the mutated amino acid was at a sufficient distance from the active centers of the enzyme, its replacement affected the change in the redox potential as well as the physicochemical properties of the wild-type protein.
Mutation in the second coordination sphere of the copper atom of the T1 center did not lead to a decrease in the redox potential, as we assumed, but led to changes in the physicochemical properties of the mutant enzyme. It can be concluded that a decrease in the hydrophobicity of the substrate pocket due to the replacement of phenylalanine residues 232 and 233 with tyrosines led to a shift in enzyme activity to the acidic pH and a decrease in the thermostability and pH stability. All enzymes were able to degrade the triphenylmethane dyes with mediator ABTS more effectively than the azo dyes. The crystal structure of laccase with the highest potential (H286T) was determined with a 2 Å resolution. Comparative analysis of the structures of H286T with ScaSL did not reveal significant changes in the structure of active sites in the mutant protein.
The results of this study indicate that point substitutions of amino acids, even at re-mote positions from the active site of laccases, can lead to changes not only in their physicochemical properties but also affect their redox potential and catalytic activity. These findings expand our understanding of the amino acid determinants that influence the efficiency of biocatalytic reactions involving bacterial laccases. Additionally, these data contribute to the identification of new amino acid determinants and provide valuable information for the development of machine learning algorithms for the targeted design of efficient biocatalysts based on two-domain bacterial laccases.

Supplementary Materials

The following supporting information can be downloaded at: https://www.mdpi.com/article/10.3390/catal14100694/s1, Figure S1: a direct electron transfer scheme for laccase using mutant H286T laccase as an example, Figure S2: voltametric characteristics of glassy carbon electrodes modified with MWCNTox and different laccase mutants: a—MWCNYox without laccase; b—MWCNYox without laccase in the presence of ABTS as mediator; c—MWCNYox and immobilized laccase ScaSL (WT); d—MWCNYox and immobilized laccase mutant F232Y/F233Y; e—MWCNYox and immobilized laccase mutant H286T; f—MWCNYox and immobilized laccase mutant H866A, Figure S3: tri-phenylmethane dyes used in the study, Figure S4: the location of charged residues in laccase ScaSL (A) and SvSL (B). Negatively charged residues are shown in red (according to the standard color for oxygen), positively charged residues are shown in blue (according to the standard color for nitrogen), hydrophobic residues are yellow. The green arrows connect the T1 copper centers, Figure S5: charts of decolorization of the brilliant green dye by laccases at pH 4.5, where at M1 are reaction mixtures with an ABTS as a mediator (25 µmol); at M2 are reaction mixtures with an ASA as a mediator (25 µmol). Under the letter C, there are reaction mixtures without the addition of an enzyme. Under the E1–E4, there are reaction mixtures with the addition of laccase (WT)SeaSL-1300, H286A, H286B, and H286W, respectively (50 microns per reaction) The measurements were carried out within 24 h. The measurement time (hours) is located on the x-axis, and the optical density of the solution is located on the y-axis, Figure S6: charts of decolorization of brilliant green at pH 4 by laccase F231Y, where C—reaction mixtures without the addition of enzyme or mediator, M1—reaction mixtures with the mediator ABTS (25 μM); M2—reaction mixtures with the mediator SA (25 μM); E—reaction mixtures with the addition of the enzyme (50 μM); M1+E—reaction mixtures with the addition of the mediator ABTS (25 μM) and the enzyme (50 μM); M2+E—reaction mixtures with the addition of the mediator SA (25 μM) and the enzyme (50 μM) The measurements were carried out within 24 h. The measurement time (hours) is located on the x-axis, and the optical density of the solution is located on the y-axis, Figure S7: charts of decolorization of malachite green at pH 4 by laccase F231Y, where C—reaction mixtures without the addition of enzyme or mediator, M1—reaction mixtures with the mediator ABTS (25 μM); M2—reaction mixtures with the mediator SA (25 μM); E—reaction mixtures with the addition of the enzyme (50 μM); M1+E—reaction mixtures with the addition of the mediator ABTS (25 μM) and the enzyme (50 μM); M2+E—reaction mixtures with the addition of the mediator SA (25 μM) and the enzyme (50 μM) The measurements were carried out within 24 h. The measurement time (hours) is located on the x-axis, and the optical density of the solution is located on the y-axis, Figure S8: Charts of decolorization of the malachite green dye by laccases at pH 4.5, where at M1 are reaction mixtures with an ABTS as a mediator (25 µmol); at M2 are reaction mixtures with an ASA as a mediator (25 µmol). Under the letter C there are reaction mixtures without the addition of an enzyme, under the E1- E4 there are reaction mixtures with the addition of laccase (WT)SeaSL-1300, H286A, H286B and H286W, respectively (50 microns per reaction). The measurements were carried out within 24 h.The measurement time (hours) is located on the x axis, and the optical density of the solution is located on the y axis. Figure S9: charts of decolorization of the Congo red dye by laccases at pH 4.5, where at M1 are reaction mixtures with an ABTS as a mediator (25 µmol); at M2 are reaction mixtures with an ASA as a mediator (25 µmol). Under the letter C, there are reaction mixtures without the addition of an enzyme; under the E1–E4, there are reaction mixtures with the addition of laccase (WT)SeaSL-1300, H286A, H286B, and H286W, respectively (50 microns per reaction) The measurements were carried out within 24 h. The measurement time (hours) is located on the x-axis, and the optical density of the solution is located on the y-axis, Figure S10: charts of decolorization of Congo red at pH 4 by laccase F231Y, where C—reaction mixtures without the addition of enzyme or mediator, M1—reaction mixtures with the mediator ABTS (25 μM); M2—reaction mixtures with the mediator SA (25 μM); E—reaction mixtures with the addition of the enzyme (50 μM); M1+E—reaction mixtures with the addition of the mediator ABTS (25 μM) and the enzyme (50 μM); M2+E—reaction mixtures with the addition of the mediator SA (25 μM) and the enzyme (50 μM). The measurements were carried out within 24 h. The measurement time (hours) is located on the x-axis, and the optical density of the solution is located on the y-axis, Figure S11: charts of decolorization of the Congo red dye by laccases at pH 7.5, where at M1 are reaction mixtures with an ABTS as a mediator (25 µmol); at M2 are reaction mixtures with an ASA as a mediator (25 µmol). Under the letter C, there are reaction mixtures without the addition of an enzyme; under the E1–E4, there are reaction mixtures with the addition of laccase (WT)SeaSL-1300, H286A, H286B, and H286W, respectively (50 microns per reaction). The measurements were carried out within 24 h. The measurement time (hours) is located on the x-axis, and the optical density of the solution is located on the y-axis, Figure S12: charts of decolorization of Congo red at pH 7 by laccase F231Y, where C—reaction mixtures without the addition of enzyme or mediator, M1—reaction mixtures with the mediator ABTS (25 μM); M2—reaction mixtures with the mediator SA (25 μM); E—reaction mixtures with the addition of the enzyme (50 μM); M1+E—reaction mixtures with the addition of the mediator ABTS (25 μM) and the enzyme (50 μM); M2+E—reaction mixtures with the addition of the mediator SA (25 μM) and the enzyme (50 μM). The measurements were carried out within 24 h. The measurement time (hours) is located on the x-axis, and the optical density of the solution is located on the y-axis, Figure S13: charts of decolorization of the methyl orange dye by laccases at pH 4.5, where at M1 are reaction mixtures with an ABTS as a mediator (25 µmol); at M2 are reaction mixtures with an ASA as a mediator (25 µmol). Under the letter C, there are reaction mixtures without the addition of an enzyme; under the E1–E4, there are reaction mixtures with the addition of laccase (WT)SeaSL-1300, H286A, H286B, and H286W, respectively (50 microns per reaction). The measurements were carried out within 24 h. The measurement time (hours) is located on the x-axis, and the optical density of the solution is located on the y-axis, Figure S14: charts of decolorization of the methyl orange dye by laccases at pH 7.5, where at M1 are reaction mixtures with an ABTS as a mediator (25 µmol); at M2 are reaction mixtures with an ASA as a mediator (25 µmol). Under the letter C, there are reaction mixtures without the addition of an enzyme; under the E1–E4, there are reaction mixtures with the addition of laccase (WT)SeaSL-1300, H286A, H286B, and H286W, respectively (50 microns per reaction). The measurements were carried out within 24 h. The measurement time (hours) is located on the x-axis, and the optical density of the solution is located on the y-axis, Figure S15: charts of decolorization of methyl orange at pH 4 (at number 1) and pH 7(at number 2) by laccase F231Y, where C—reaction mixtures without the addition of enzyme or mediator; M1—reaction mixtures with the mediator ABTS (25 μM); M2—reaction mixtures with the mediator SA (25 μM); E—reaction mixtures with the addition of the enzyme (50 μM); M1+E—reaction mixtures with the addition of the mediator ABTS (25 μM) and the enzyme (50 μM); M2+E—reaction mixtures with the addition of the mediator SA (25 μM) and the enzyme (50 μM). The measurements were carried out within 24 h. The measurement time (hours) is located on the x-axis, and the optical density of the solution is located on the y-axis.

Author Contributions

Conceptualization, L.T., A.A. and A.L. (Alexey Leontievsky); investigation, I.T., A.L. (Anna Larionova), M.P., V.T., K.E., A.G. and L.T.; validation, L.T., A.L. (Anna Larionova), S.T., V.T. and M.P.; software, A.A., K.E. and S.A.; writing—original draft preparation, L.T., A.A., A.G., S.A. and I.T.; writing—review and editing, L.T., A.A., S.T. and O.P.; supervision, A.L. (Alexey Leontievsky) and O.P.; project administration, O.P. and S.A.; funding acquisition, O.P. All authors have read and agreed to the published version of the manuscript.

Funding

The research was supported by the grant of the Russian Science Foundation № 24-14-20013, https://rscf.ru/project/24-14-20013/ (accessed on 30 August 2024) and by the Tula Region Committee for Science and Innovation.

Data Availability Statement

The original contributions presented in the study are included in the article/Supplementary Material, further inquiries can be directed to the corresponding author.

Acknowledgments

The authors are grateful to Irina Pozdnyakova-Filatova—researcher in the Laboratory of Molecular Microbiology, G.K. Skryabin Institute of Biochemistry and Physiology of Microorganisms, RAS, Federal Research Center “Pushchino Scientific Center for Biological Research of the Russian Academy of Sciences” for helping in carrying out this study. The authors are also grateful to Ekaterina Shuvalova and Pavel Oskin for their kind help in electrochemical measurements.

Conflicts of Interest

The authors declare no conflicts of interest.

References

  1. Palmer, A.E.; Lee, S.K.; Solomon, E.I. Decay of the Peroxide Intermediate in Laccase:  Reductive Cleavage of the O−O Bond. J. Am. Chem. Soc. 2001, 123, 6591–6599. [Google Scholar] [CrossRef] [PubMed]
  2. Mot, A.C.; Silaghi-Dumitrescu, R. Laccases: Complex architectures for one-electron oxidations. Biochemistry 2012, 77, 1395–1407. [Google Scholar] [CrossRef] [PubMed]
  3. Janusz, G.; Pawlik, A.; Swiderska-Burek, U.; Polak, J.; Sulej, J.; Jarosz-Wilkolazka, A.; Paszczynski, A. Laccase Properties, Physiological Functions, and Evolution. Int. J. Mol. Sci. 2020, 21, 966. [Google Scholar] [CrossRef]
  4. Chauhan, P.S.; Goradia, B.; Saxena, A. Bacterial laccase: Recent update on production, properties and industrial applications. 3 Biotech 2017, 7, 323. [Google Scholar] [CrossRef]
  5. Arregui, L.; Ayala, M.; Gómez-Gil, X.; Gutiérrez-Soto, G.; Hernández-Luna, C.E.; Herrera de los Santos, M.; Levin, L.; Rojo-Domínguez, A.; Romero-Martínez, D.; Saparrat, M.C.N.; et al. Laccases: Structure, function, and potential application in water bioremediation. Microb. Cell Factories 2019, 18, 200. [Google Scholar] [CrossRef]
  6. Upadhyay, P.; Shrivastava, R.; Agrawal, P.K. Bioprospecting and biotechnological applications of fungal laccase. 3 Biotech 2016, 6, 15. [Google Scholar] [CrossRef] [PubMed]
  7. Shleev, S.; Tkac, J.; Christenson, A.; Ruzgas, T.; Yaropolov, A.I.; Whittaker, J.W.; Gorton, L. Direct electron transfer between copper-containing proteins and electrodes. Biosens. Bioelectron. 2005, 20, 2517–2554. [Google Scholar] [CrossRef]
  8. Berezin, I.V.; Bogdanovskaya, V.A.; Varfolomeev, S.D.; Tarasevich, M.R.; Yaropolov, A.I. Bioelectrocatalysis—Equilibrium oxygen potential in the presence of laccase. Dokl. Akad. Nauk SSSR 1978, 240, 615–618. [Google Scholar]
  9. Le Goff, A.; Holzinger, M.; Cosnier, S. Recent progress in oxygen-reducing laccase biocathodes for enzymatic biofuel cells. Cell. Mol. Life Sci. 2015, 72, 941–952. [Google Scholar] [CrossRef]
  10. Haque, S.u.; Duteanu, N.; Ciocan, S.; Nasar, A.; Inamuddin. A review: Evolution of enzymatic biofuel cells. J. Environ. Manag. 2021, 298, 113483. [Google Scholar] [CrossRef]
  11. Zhang, Y.; Lv, Z.Y.; Zhou, J.; Xin, F.X.; Ma, J.F.; Wu, H.; Fang, Y.; Jiang, M.; Dong, W.L. Application of eukaryotic and prokaryotic laccases in biosensor and biofuel cells: Recent advances and electrochemical aspects. Appl. Microbiol. Biotechnol. 2018, 102, 10409–10423. [Google Scholar] [CrossRef] [PubMed]
  12. Rodríguez-Delgado, M.M.; Alemán-Nava, G.S.; Rodríguez-Delgado, J.M.; Dieck-Assad, G.; Martínez-Chapa, S.O.; Barceló, D.; Parra, R. Laccase-based biosensors for detection of phenolic compounds. TrAC Trends Anal. Chem. 2015, 74, 21–45. [Google Scholar] [CrossRef]
  13. Gunne, M.; Höppner, A.; Hagedoorn, P.L.; Urlacher, V.B. Structural and redox properties of the small laccase Ssl1 from Streptomyces sviceus. FEBS J. 2014, 281, 4307–4318. [Google Scholar] [CrossRef] [PubMed]
  14. Trubitsina, L.I.; Tishchenko, S.V.; Gabdulkhakov, A.G.; Lisov, A.V.; Zakharova, M.V.; Leontievsky, A.A. Structural and functional characterization of two-domain laccase from Streptomyces viridochromogenes. Biochimie 2015, 112, 151–159. [Google Scholar] [CrossRef] [PubMed]
  15. Blánquez, A.; Rodríguez, J.; Brissos, V.; Mendes, S.; Martins, L.O.; Ball, A.S.; Arias, M.E.; Hernández, M. Decolorization and detoxification of textile dyes using a versatile Streptomyces laccase-natural mediator system. Saudi J. Biol. Sci. 2019, 26, 913–920. [Google Scholar] [CrossRef] [PubMed]
  16. Wang, J.-X.; Vilbert, A.C.; Cui, C.; Mirts, E.N.; Williams, L.H.; Kim, W.; Jessie Zhang, Y.; Lu, Y. Increasing Reduction Potentials of Type 1 Copper Center and Catalytic Efficiency of Small Laccase from Streptomyces coelicolor through Secondary Coordination Sphere Mutations. Angew. Chem. Int. Ed. 2023, 62, e202314019. [Google Scholar] [CrossRef]
  17. Kaur, R.; Salwan, R.; Sharma, V. Structural properties, genomic distribution of laccases from Streptomyces and their potential applications. Process Biochem. 2022, 118, 133–144. [Google Scholar] [CrossRef]
  18. Dey, B.; Dutta, T. Laccases: Thriving the domain of bio-electrocatalysis. Bioelectrochemistry 2022, 146, 108144. [Google Scholar] [CrossRef] [PubMed]
  19. Prins, A.; Kleinsmidt, L.; Khan, N.; Kirby, B.; Kudanga, T.; Vollmer, J.; Pleiss, J.; Burton, S.; Le Roes-Hill, M. The effect of mutations near the T1 copper site on the biochemical characteristics of the small laccase from Streptomyces coelicolor A3 (2). Enzym. Microb. Technol. 2015, 68, 23–32. [Google Scholar] [CrossRef]
  20. Olbrich, A.C.; Schild, J.N.; Urlacher, V.B. Correlation between the T1 copper reduction potential and catalytic activity of a small laccase. J. Inorg. Biochem. 2019, 201, 110843. [Google Scholar] [CrossRef]
  21. Toscano, M.D.; De Maria, L.; Lobedanz, S.; Ostergaard, L.H. Optimization of a small laccase by active-site redesign. Chembiochem 2013, 14, 1209–1211. [Google Scholar] [CrossRef] [PubMed]
  22. Trubitsina, L.I.; Trubitsin, I.V.; Lisov, A.V.; Gabdulkhakov, A.G.; Zavarzina, A.G.; Belova, O.V.; Larionova, A.P.; Tishchenko, S.V.; Leontievsky, A.A. A Novel Two-Domain Laccase with Middle Redox Potential: Physicochemical and Structural Properties. Biochemistry 2023, 88, 1658–1667. [Google Scholar] [CrossRef] [PubMed]
  23. Trubitsina, L.I.; Abdullatypov, A.V.; Larionova, A.P.; Trubitsin, I.V.; Alferov, S.V.; Ponamoreva, O.N.; Leontievsky, A.A. Expression of thermophilic two-domain laccase from Catenuloplanes japonicus in Escherichia coli and its activity against triarylmethane and azo dyes. PeerJ 2021, 9, e11646. [Google Scholar] [CrossRef] [PubMed]
  24. Lisov, A.V.; Trubitsina, L.I.; Lisova, Z.A.; Trubitsin, I.V.; Zavarzina, A.G.; Leontievsky, A.A. Transformation of humic acids by two-domain laccase from Streptomyces anulatus. Process Biochem. 2019, 76, 128–135. [Google Scholar] [CrossRef]
  25. Nathani, A.; Vishnu, N.; Sharma, C.S. Review-Pencil Graphite Electrodes as Platform for Enzyme and Enzyme-Like Protein Immobilization for Electrochemical Detection. J. Electrochem. Soc. 2020, 167, 11. [Google Scholar] [CrossRef]
  26. Abdullatypov, A.; Oskin, P.; Fedina, V.; Trubitsina, L.; Yakimovich, S.; Shuvalova, E.; Verma, P.; Dyachkova, T.; Ponamoreva, O.; Alferov, S. Functionalization of MWCNTs for Bioelectrocatalysis by Bacterial Two-Domain Laccase from Catenuloplanes japonicus. Nanomaterials 2023, 13, 3019. [Google Scholar] [CrossRef]
  27. Ben Tahar, A.; Żelechowska, K.; Biernat, J.F.; Paluszkiewicz, E.; Cinquin, P.; Martin, D.; Zebda, A. High catalytic performance of laccase wired to naphthylated multiwall carbon nanotubes. Biosens. Bioelectron. 2020, 151, 111961. [Google Scholar] [CrossRef]
  28. Che, A.-F.; Germain, V.; Cretin, M.; Cornu, D.; Innocent, C.; Tingry, S. Fabrication of free-standing electrospun carbon nanofibers as efficient electrode materials for bioelectrocatalysis. New J. Chem. 2011, 35, 2848–2853. [Google Scholar] [CrossRef]
  29. Jones, S.M.; Solomon, E.I. Electron transfer and reaction mechanism of laccases. Cell. Mol. Life Sci. 2015, 72, 869–883. [Google Scholar] [CrossRef]
  30. Gabdulkhakov, A.; Kolyadenko, I.; Kostareva, O.; Mikhaylina, A.; Oliveira, P.; Tamagnini, P.; Lisov, A.; Tishchenko, S. Investigations of Accessibility of T2/T3 Copper Center of Two-Domain Laccase from Streptomyces griseoflavus Ac-993. Int. J. Mol. Sci. 2019, 20, 3184. [Google Scholar] [CrossRef]
  31. Liu, J.; Xie, Y.; Peng, C.; Yu, G.; Zhou, J. Molecular Understanding of Laccase Adsorption on Charged Self-Assembled Monolayers. J. Phys. Chem. B 2017, 121, 10610–10617. [Google Scholar] [CrossRef] [PubMed]
  32. Hoshikawa, Y.; Castro-Muñiz, A.; Tawata, H.; Nozaki, K.; Yamane, S.; Itoh, T.; Kyotani, T. Orientation control of Trametes laccases on a carbon electrode surface to understand the orientation effect on the electrocatalytic activity. Bioconjugate Chem. 2018, 29, 2927–2935. [Google Scholar] [CrossRef] [PubMed]
  33. Gentil, S.; Rousselot-Pailley, P.; Sancho, F.; Robert, V.; Mekmouche, Y.; Guallar, V.; Tron, T.; Le Goff, A. Efficiency of Site-Specific Clicked Laccase-Carbon Nanotubes Biocathodes towards O2 Reduction. Chem.—Eur. J. 2020, 26, 4798–4804. [Google Scholar] [CrossRef]
  34. Milton, R.D.; Minteer, S.D. Direct enzymatic bioelectrocatalysis: Differentiating between myth and reality. J. R. Soc. Interface 2017, 14, 20170253. [Google Scholar] [CrossRef]
  35. Aleksejeva, O.; Mateljak, I.; Ludwig, R.; Alcalde, M.; Shleev, S. Electrochemistry of a high redox potential laccase obtained by computer-guided mutagenesis combined with directed evolution. Electrochem. Commun. 2019, 106, 106511. [Google Scholar] [CrossRef]
  36. Kolyadenko, I.; Scherbakova, A.; Kovalev, K.; Gabdulkhakov, A.; Tishchenko, S. Engineering the catalytic properties of two-domain laccase from Streptomyces griseoflavus Ac-993. Int. J. Mol. Sci. 2022, 23, 65. [Google Scholar] [CrossRef] [PubMed]
  37. Sievers, F.; Wilm, A.; Dineen, D.; Gibson, T.J.; Karplus, K.; Li, W.; Lopez, R.; McWilliam, H.; Remmert, M.; Söding, J.; et al. Fast, scalable generation of high-quality protein multiple sequence alignments using Clustal Omega. Mol. Syst. Biol. 2011, 7, 539. [Google Scholar] [CrossRef]
  38. Eswar, N.; Webb, B.; Marti-Renom, M.A.; Madhusudhan, M.S.; Eramian, D.; Shen, M.Y.; Pieper, U.; Sali, A. Comparative protein structure modeling using Modeller. Curr. Protoc. Bioinform. 2006, 54, 5–6. [Google Scholar] [CrossRef]
  39. Skálová, T.; Dohnálek, J.; Østergaard, L.H.; Østergaard, P.R.; Kolenko, P.; Dušková, J.; Štěpánková, A.; Hašek, J. The Structure of the Small Laccase from Streptomyces coelicolor Reveals a Link between Laccases and Nitrite Reductases. J. Mol. Biol. 2009, 385, 1165–1178. [Google Scholar] [CrossRef]
  40. Land, H.; Humble, M.S. YASARA: A Tool to Obtain Structural Guidance in Biocatalytic Investigations. In Protein Engineering: Methods and Protocols; Bornscheuer, U.T., Höhne, M., Eds.; Springer: New York, NY, USA, 2018; pp. 43–67. [Google Scholar]
  41. Laemmli, U.K. Cleavage of Structural Proteins during the Assembly of the Head of Bacteriophage T4. Nature 1970, 227, 680–685. [Google Scholar] [CrossRef]
  42. Wariishi, H.; Valli, K.; Gold, M.H. Manganese (II) oxidation by manganese peroxidase from the basidiomycete Phanerochaete chrysosporium. Kinetic mechanism and role of chelators. J. Biol. Chem. 1992, 267, 23688–23695. [Google Scholar] [CrossRef] [PubMed]
  43. Heinfling, A.; Martínez, M.a.J.; Martínez, A.T.; Bergbauer, M.; Szewzyk, U. Purification and characterization of peroxidases from the dye-decolorizing fungus Bjerkandera adusta. FEMS Microbiol. Lett. 1998, 165, 43–50. [Google Scholar] [CrossRef] [PubMed]
  44. Britton, H.T.S.; Robinson, R.A. CXCVIII.—Universal buffer solutions and the dissociation constant of veronal. J. Chem. Soc. (Resumed) 1931, 1456–1462. [Google Scholar] [CrossRef]
  45. Xu, F.; Shin, W.; Brown, S.H.; Wahleithner, J.A.; Sundaram, U.M.; Solomon, E.I. A study of a series of recombinant fungal laccases and bilirubin oxidase that exhibit significant differences in redox potential, substrate specificity, and stability. Biochim. Biophys. Acta (BBA)—Protein Struct. Mol. Enzymol. 1996, 1292, 303–311. [Google Scholar] [CrossRef]
  46. Xu, F. Effects of Redox Potential and Hydroxide Inhibition on the pH Activity Profile of Fungal Laccases. J. Biol. Chem. 1997, 272, 924–928. [Google Scholar] [CrossRef] [PubMed]
  47. Rigaku XtaLAB Synergy-S. Available online: https://www.rigaku.com/products/crystallography/synergys (accessed on 20 October 2023).
  48. Rigaku Oxford Diffraction. CrysAlisPro; Rigaku Oxford Diffraction: Yarnton, UK, 2019. [Google Scholar]
  49. McCoy, A.J.; Grosse-Kunstleve, R.W.; Adams, P.D.; Winn, M.D.; Storoni, L.C.; Read, R.J. Phaser crystallographic software. J. Appl. Crystallogr. 2007, 40, 658–674. [Google Scholar] [CrossRef]
  50. Murshudov, G.N.; Skubák, P.; Lebedev, A.A.; Pannu, N.S.; Steiner, R.A.; Nicholls, R.A.; Winn, M.D.; Long, F.; Vagin, A.A. REFMAC5 for the refinement of macromolecular crystal structures. Acta Crystallographica. Sect. D Biol. Crystallogr. 2011, 67, 355–367. [Google Scholar] [CrossRef]
  51. Emsley, P.; Lohkamp, B.; Scott, W.G.; Cowtan, K. Features and development of Coot. Acta Crystallographica. Sect. D Biol. Crystallogr. 2010, 66, 486–501. [Google Scholar] [CrossRef]
  52. Liebschner, D.; Afonine, P.V.; Baker, M.L.; Bunkóczi, G.; Chen, V.B.; Croll, T.I.; Hintze, B.; Hung, L.W.; Jain, S.; McCoy, A.J.; et al. Macromolecular structure determination using X-rays, neutrons and electrons: Recent developments in Phenix. Acta Crystallographica. Sect. D Struct. Biol. 2019, 75, 861–877. [Google Scholar] [CrossRef]
  53. DeLano, W.L. The PyMOL Molecular Graphics System. Available online: http://www.pymol.org/ (accessed on 20 October 2023).
Figure 1. Sequence alignment of SvSL and CjSL with low-potential laccases. Homologous amino acid residues are highlighted with dots, identical ones with asterisks.
Catalysts 14 00694 g001
Figure 2. Laccase from Streptomyces carpinensis, His 286 with distances from the imidazole group to T1 copper atom (green arrow) and to T2/T3 copper atom (yellow arrow). Substitution to alanine leads to loss of such a long-range interaction.
Catalysts 14 00694 g002
Figure 3. Localization of residues F232–F233 in the trimer of ScaSL laccase (red spheres). Hydrophobic residues are shown as yellow spheres. Copper atoms are shown as magenta spheres.
Catalysts 14 00694 g003
Figure 4. Absorption spectra of laccases.
Catalysts 14 00694 g004
Figure 5. Optimum pH of the enzymes with ABTS.
Catalysts 14 00694 g005
Figure 6. Optimum pH of the enzymes with 2,6-dimethoxyphenol.
Catalysts 14 00694 g006
Figure 7. Voltammograms of glass–carbon electrodes modified with MWCNTox and mutant laccase H286T.
Catalysts 14 00694 g007
Figure 8. Chronoamperometry curves of laccase mutant H286T/modified MWCNTox electrode poised at +0.1, +0.2, and +0.3 V vs. Ag/AgCl in phosphate buffer solution (pH 5, 0.1 M) saturated with argon or dioxygen.
Catalysts 14 00694 g008
Figure 9. Superposition of the wild-type ScaSL (cyan) and H286T mutant (orange) structures in the region of the T2/T3 center. The names of amino acid residues whose position does not change are shown in black.
Catalysts 14 00694 g009
Table 1. Comparative characterization of physic-chemical properties of mutant laccases.
LaccasepH OptimumResidual Activity after 60 h Incubation, %Thermostability after Incubation at 70, 80, and 90 °C, Respectively, %
ABTS2,6-DMPat pH 9.0at pH 11.0
ScaSL (WT)4.5–5.07.5706662; 40; 33
H286A4.5–5.07.5958267; 43; 35
H286T3.0–4.07.5775758; 36; 21
H286W4.5–5.07.5726162; 40; 28
F232Y/F233Y3.0–4.07.0544969; 29; 12
Table 2. Kinetic constants for ABTS and 2,6-DMP conversion and T1-center redox potentials of ScaSL mutants *.
LaccaseKinetic Constants for ABTSKinetic Constants for 2,6-DMPRedox Potential, V 1
Km, mMVmaxkcat, s−1Km, mMVmaxkcat, s−1
ScaSL (WT)0.100 0.00640 ± 119.7 ± 0.70.840 ± 0.0021.99 ± 0.010.36 ± 0.010.472 ± 0.007/0.47
H286A0.170 ± 0.00465 ± 274 ± 30.62 ± 0.042.03 ± 0.011.16 ± 0.010.455 ± 0.002/0.45
H286T0.180 ± 0.00876 ± 367 ± 20.84 ± 0.112.52 ± 0.151.11 ± 0.06>0.47/0.50
H286W0.150 ± 0.00772 ± 318 ± 30.89 ± 0.052.35 ± 0.041.37 ± 0.01>0.47/0.48
F232Y/F233Y0.025 ± 0.00146 ± 136.0 ± 0.20.600 ± 0.0031.24 ± 0.010.98 ± 0.01>0.47/Undetermined
1—The table shows the redox potential values of recombinant laccases determined by redox titration/chronoamperometry. * Data are presented with standard deviations for three measurements.
Table 3. Bioelectrocatalytic oxygen reduction at a potential of 0.2 V (vs. Ag/AgCl) *.
LaccaseScaSLH286TH286AF232Y/F233Y
Enzyme quantity, E8.0 ± 0.18.6 ± 1.18.2 ± 0.25.0 ± 0.6
Direct electron transport current, nA108 ± 6173 ± 2495 ± 3470 ± 19
Specific current of direct electron transfer, mA·E−11.3 ± 0.11.9 ± 0.41.2 ± 0.51.5 ± 0.5
* Data are presented with standard deviations for three measurements.
Table 4. Decolorization of dyes by ScaSL and mutant laccases without or with mediators at different pH and 30 °C *.
Decolorization of Dye, %
ScaSL
(WT)
H286AH286TH286WF232Y/
F233Y
Brilliant greenE95.3 ± 0.295.4 ± 0.192.4 ± 0.493.5 ± 0.30
E+ABTS91.5 ± 0.291.4 ± 0.692.0 ± 0.392.1 ± 0.681.9 ± 0.5
E+SA96.0 ± 0.196.6 ± 0.296.0± 0.495.2 ± 0.317.0 ± 1.1
Malachite greenE87.7 ± 2.989.8 ± 0.977.7 ± 0.977.6 ± 20.6 ± 2
E+ABTS88.8 ± 0.489.5 ± 0.389.3 ± 189.0 ± 0.490.2 ± 0.3
E+SA92.8 ± 0.488.0 ± 1.592.5 ± 0.888.1 ± 0.92.8 ± 0.4
Methyl orange, pH 4/4.5E6.6 ± 3.48.4 ± 1.55.9 ± 1.24.9 ± 0.80.1± 4
E+ABTS49.8 ± 1.952.3 ± 0.750.6 ± 0.152.2 ± 1.360.6 ± 1
E+SA31.3 ± 0.828.2 ± 0.929.2 ± 1.725.7 ± 0.925.6 ± 2
Methyl orange, pH 7/7.5E00002.5±0.7
E+ABTS13.2 ± 0.712.2 ± 1.711.8 ± 1.810.7 ± 2.141.4 ± 7
E+SA1.7 ± 0.72.2 ± 0.72.0 ± 0.81.6 ± 1.110.0 ± 2
Congo red, pH 7/7.5E00000.2 ± 0.5
E+ABTS46.9 ± 0.646.8 ± 2.145.6 ± 0.942.8 ± 3.160.7 ± 1
E+SA12.9 ± 0.913.8 ± 0.713.6 ± 0.813.5 ± 1.420.6 ± 1
* Data are presented with standard deviations for three measurements.
Table 5. Crystallographic data collection and refinement statistics.
Data Collection
Wavelength (Å)1.54179
Resolution range (Å)30.00–2.00
(2.07–2.00) a
Space groupI23
Cell parameters
a = b = c (Å)196.54
α = β = γ (◦)90.0
Collection temperature (K)120
Total reflections1,789,093 (182,322)
Unique reflections84,698 (8403)
Rint (%)26.2 (74.2)
Multiplicity21.1 (21.7)
Completeness (%)99.9 (99.9)
Mean I/sigma(I)8.17 (1.51)
Wilson B-factor (Å2)21.1
CC1/20.99 (0.88)
Refinement
Resolution range25.81–2.05
(2.08–2.05)
Reflections used in refinement74,749 (2645)
Reflections used for R-free3793 (145)
R-work, %20.91 (28.18)
R-free, %25.83 (36.57)
RMSD bond lengths (Å)0.007
RMSD bond angles (◦)0.843
Ramachandran favored (%)98.08
Ramachandran allowed (%)1.92
Ramachandran outliers (%)0.00
Average B-factor (Å2)22.80
Macromolecules22.72
Ligands27.75
Solvent23.62
PDB ID9IX9
a Values in parentheses are for the highest resolution shell.
Disclaimer/Publisher’s Note: The statements, opinions and data contained in all publications are solely those of the individual author(s) and contributor(s) and not of MDPI and/or the editor(s). MDPI and/or the editor(s) disclaim responsibility for any injury to people or property resulting from any ideas, methods, instructions or products referred to in the content.

