
Oxidative Steam Reforming of Methanol over Cu-Based Catalysts

 , , ,
, , ,  and
and 
Abstract
:
1. Introduction
2. Experimental
2.1. Catalysts Preparation
2.1.1. Precipitation Method
2.1.2. Flame Spray Pyrolysis
- 10 wt% NiO supported on CeO2;
- 20 wt% NiO supported on CeO2.
2.1.3. Wet-Impregnation Method
2.2. Catalysts Characterization
2.3. Activity Testing Procedure
3. Results
3.1. Catalysts Characterization
3.1.1. XRD
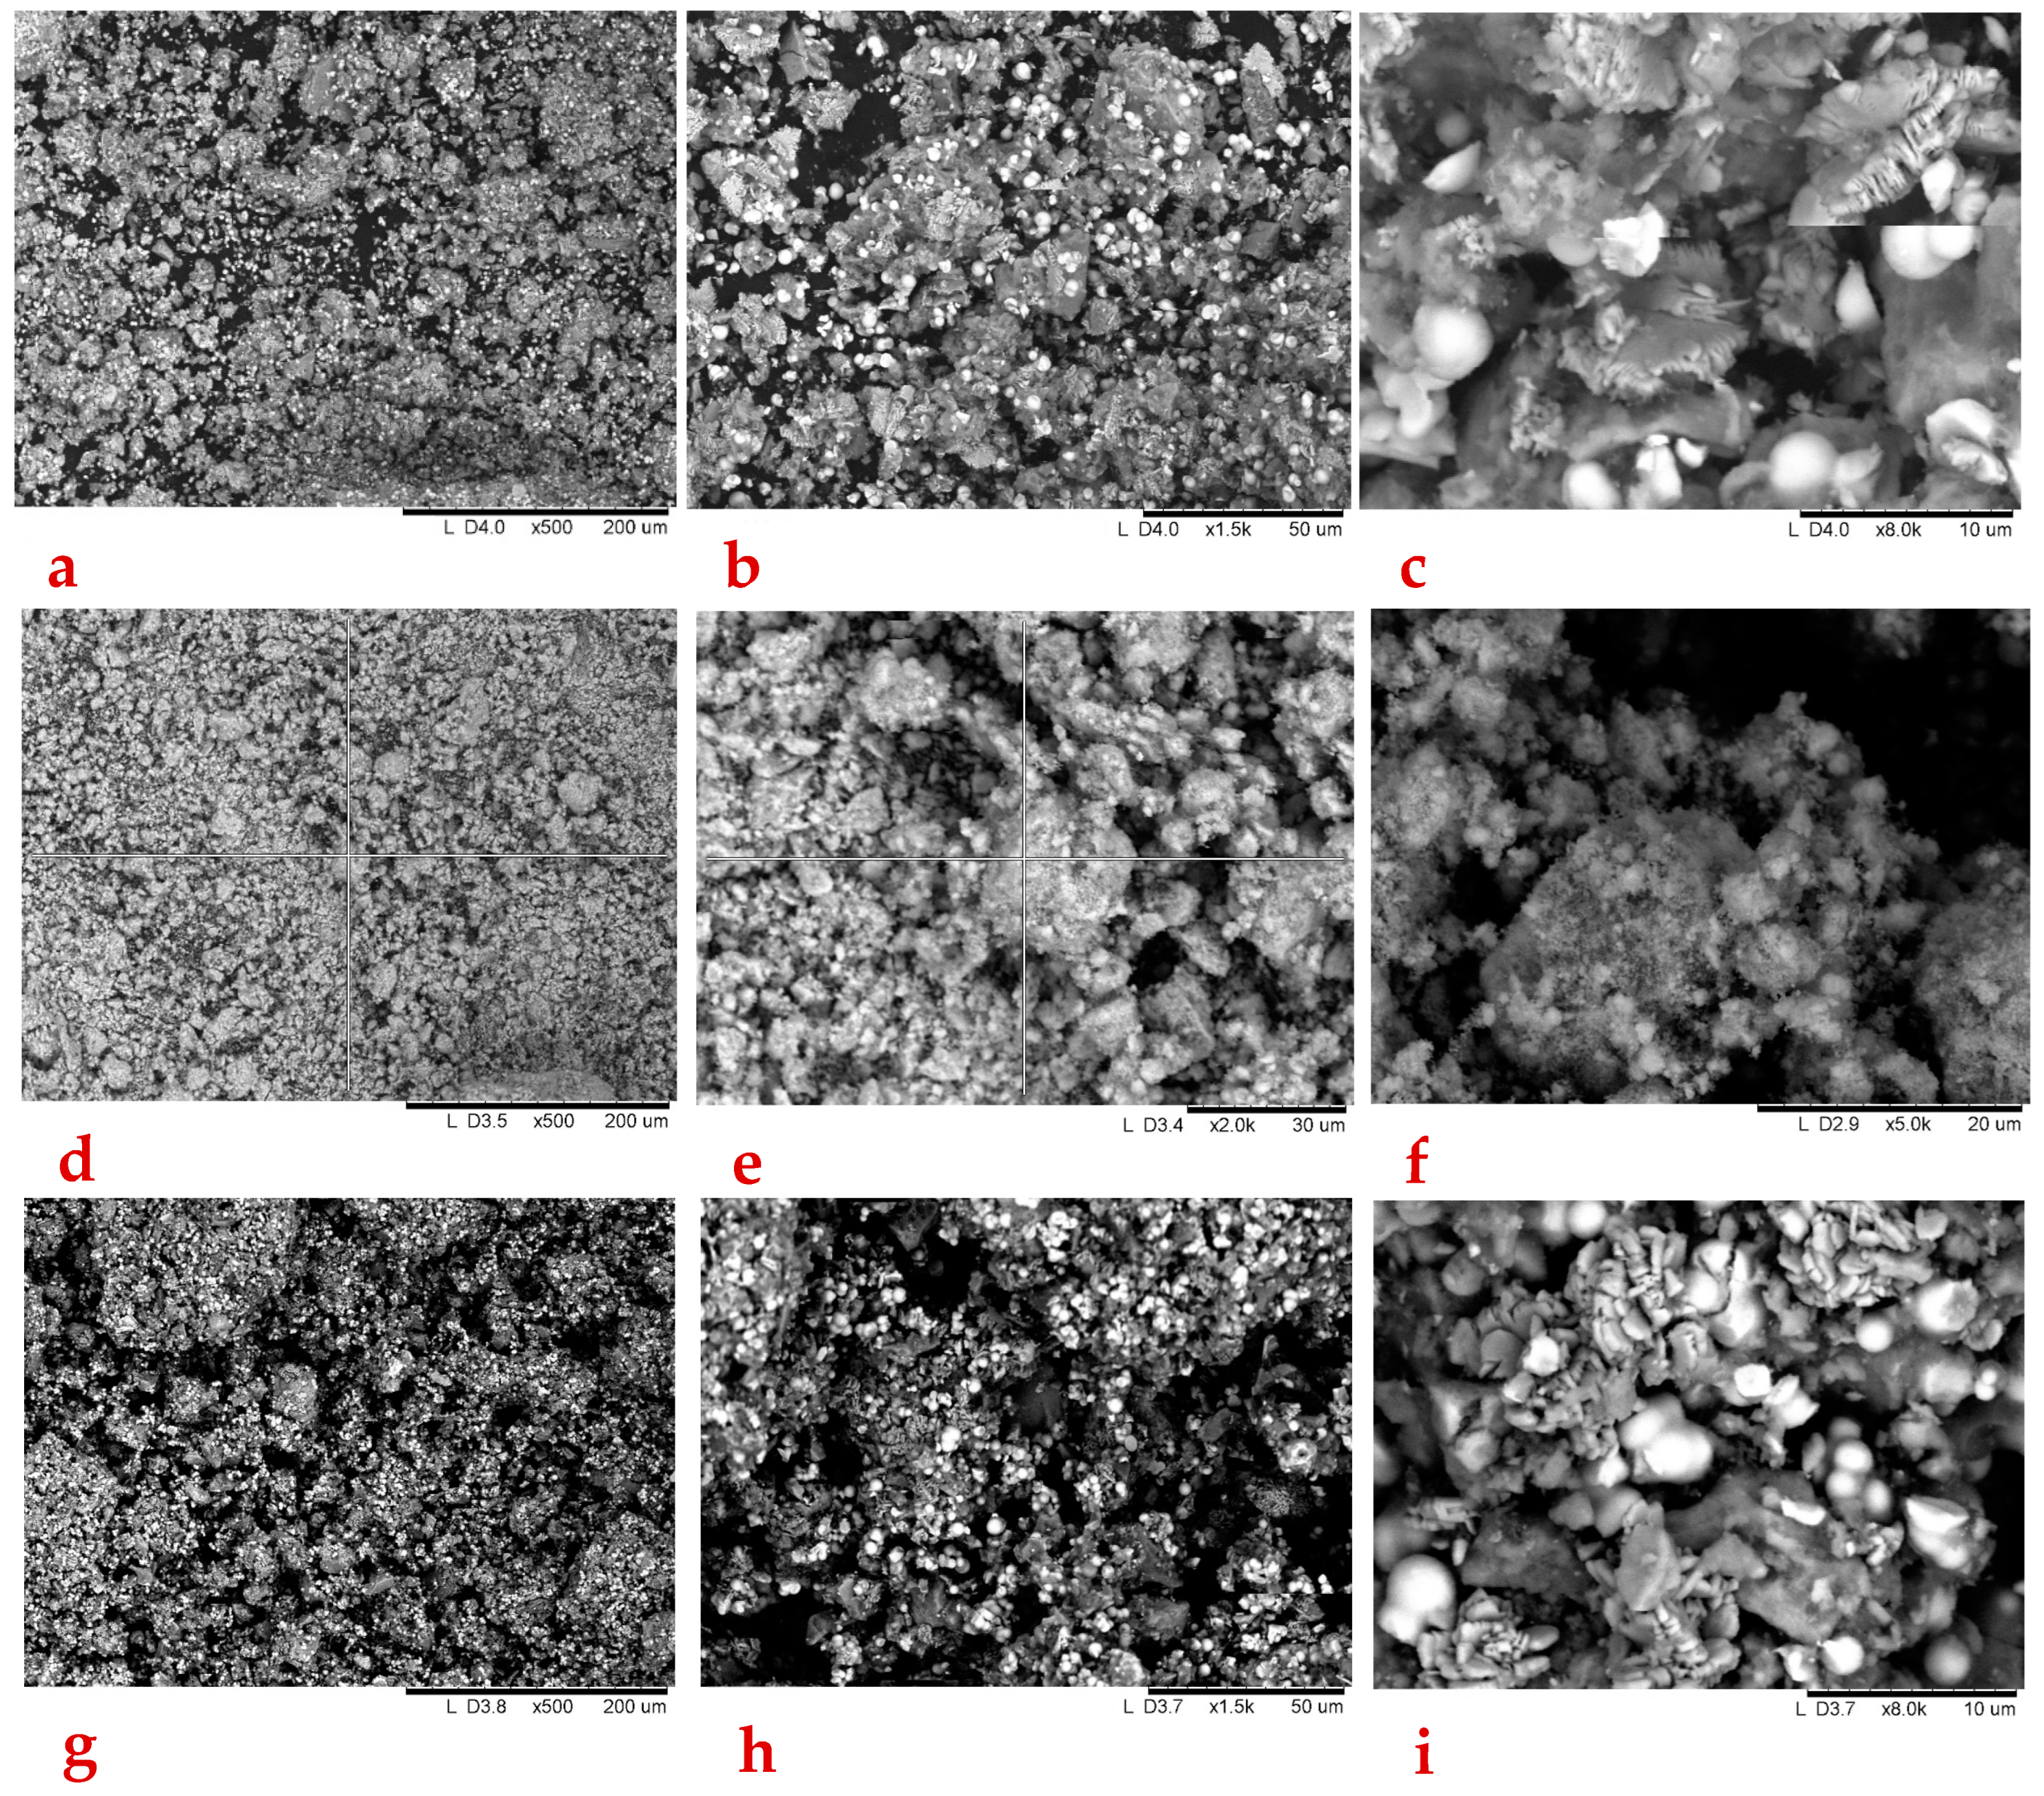
3.1.2. SEM-EDX
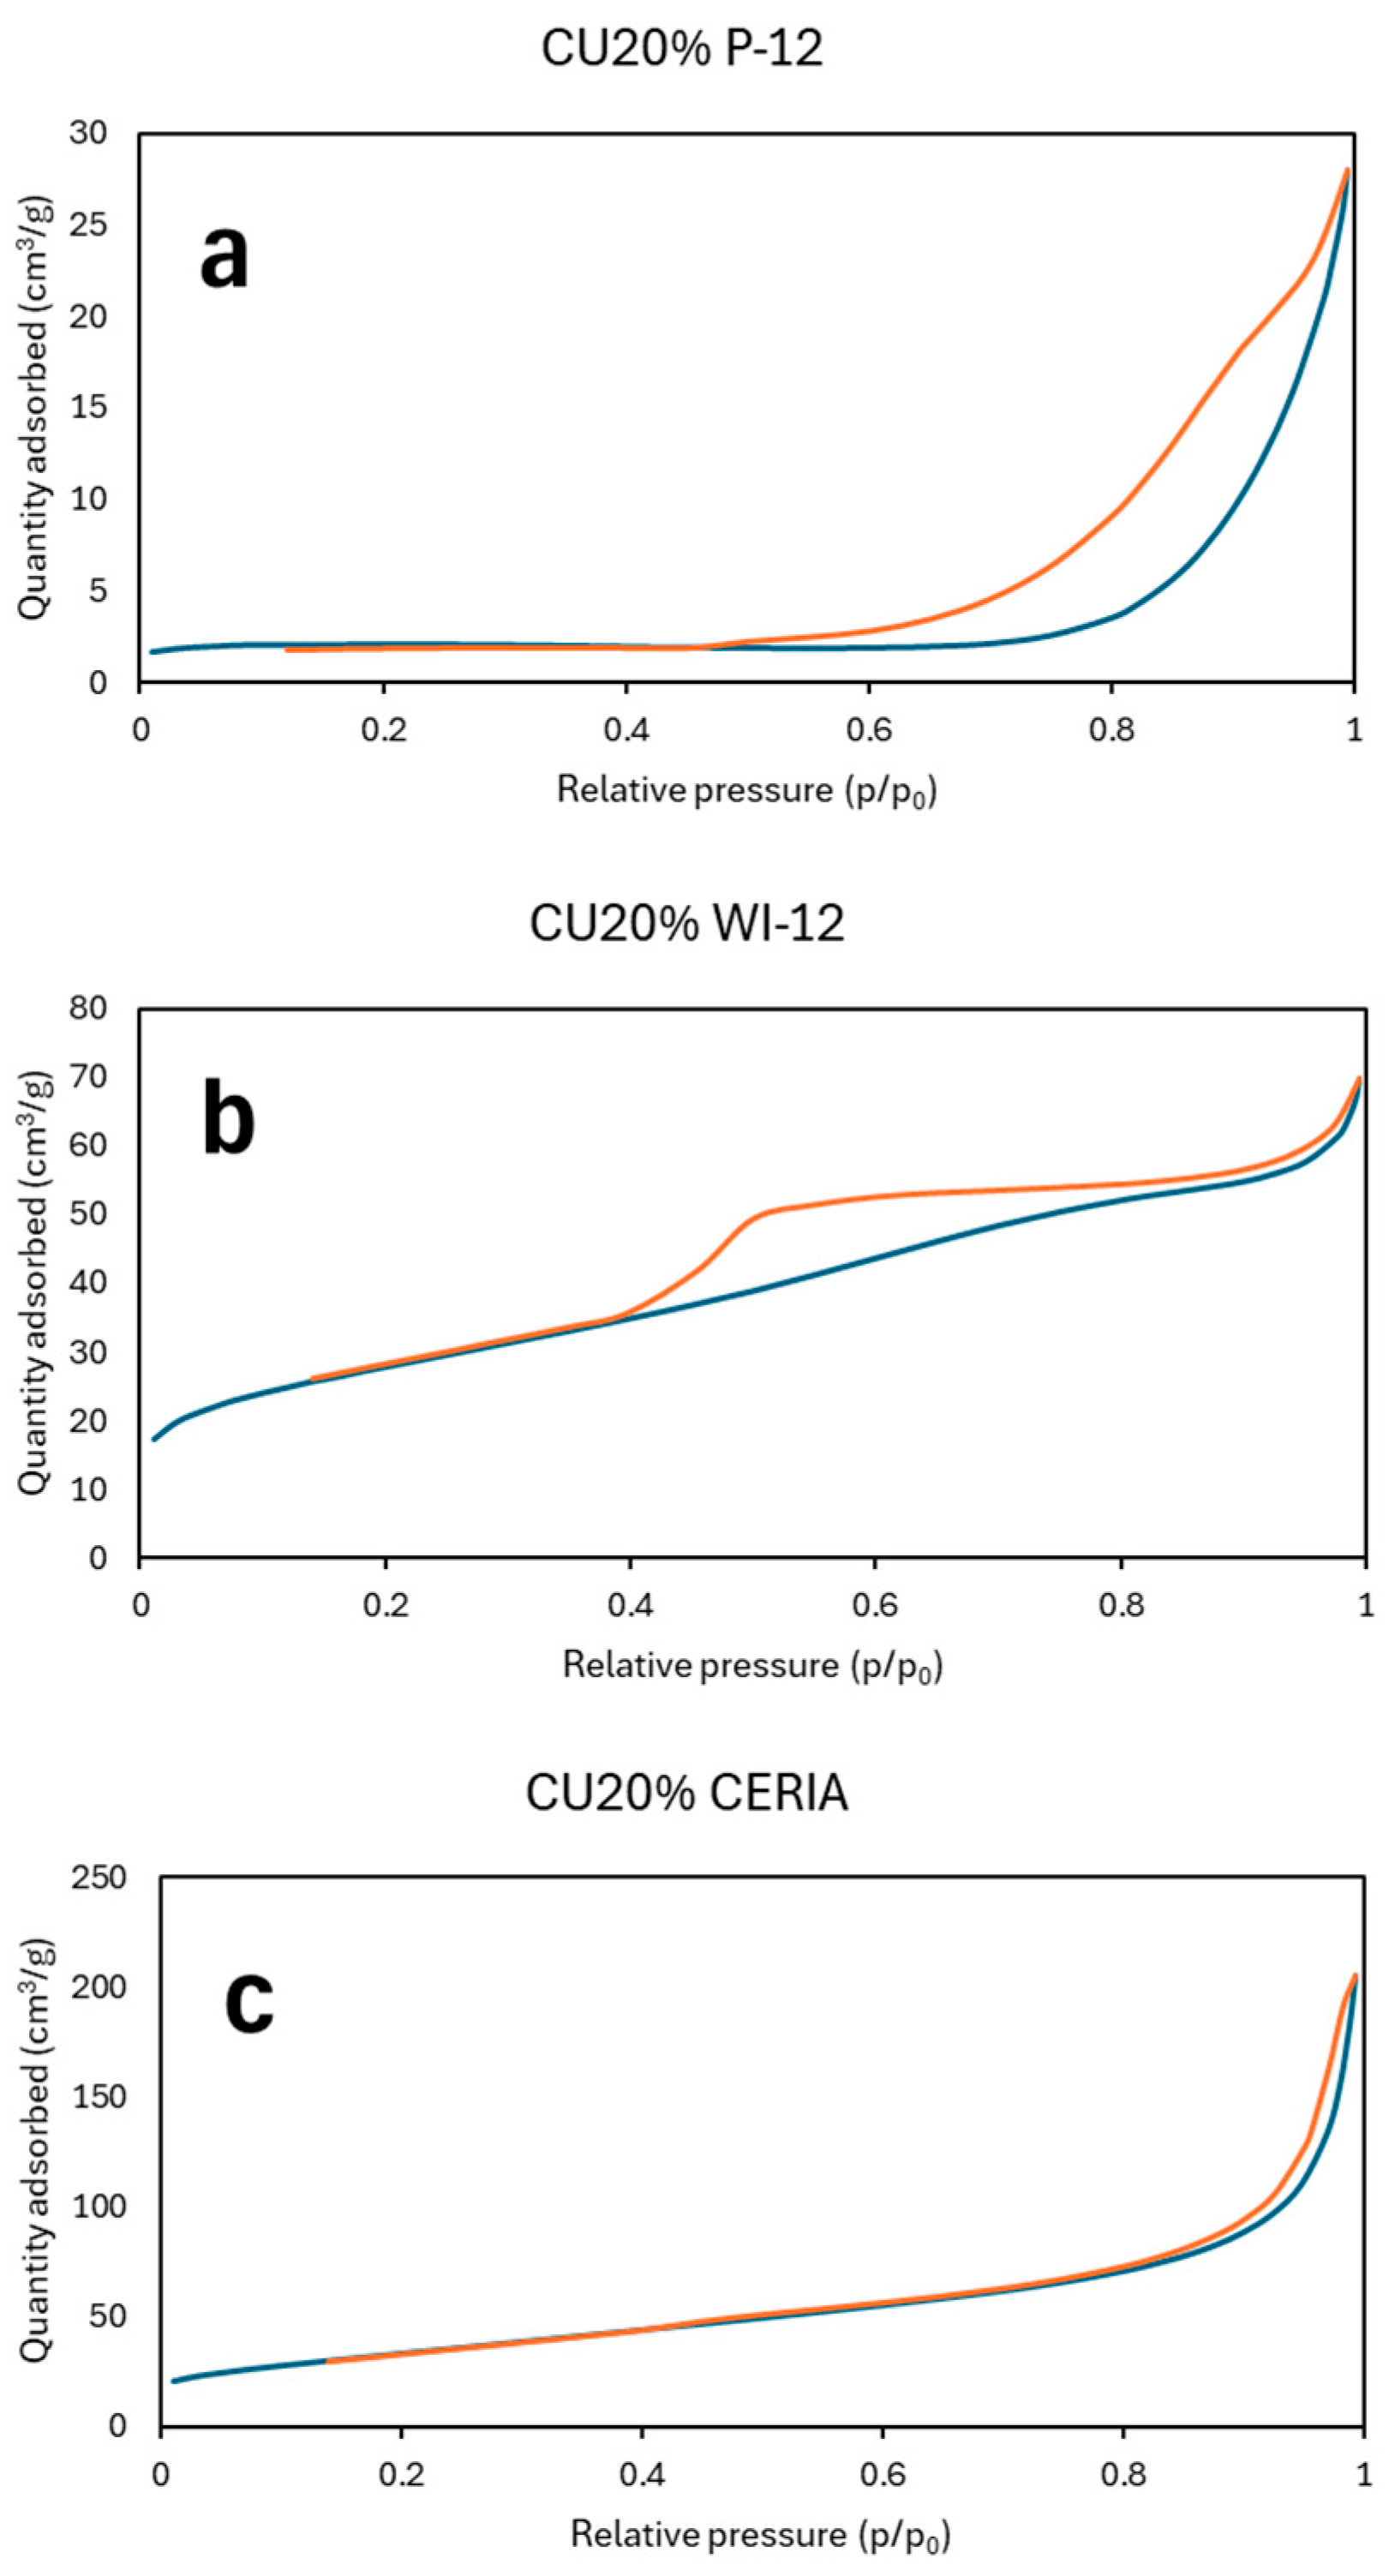
3.1.3. N2 Physisorption Analysis
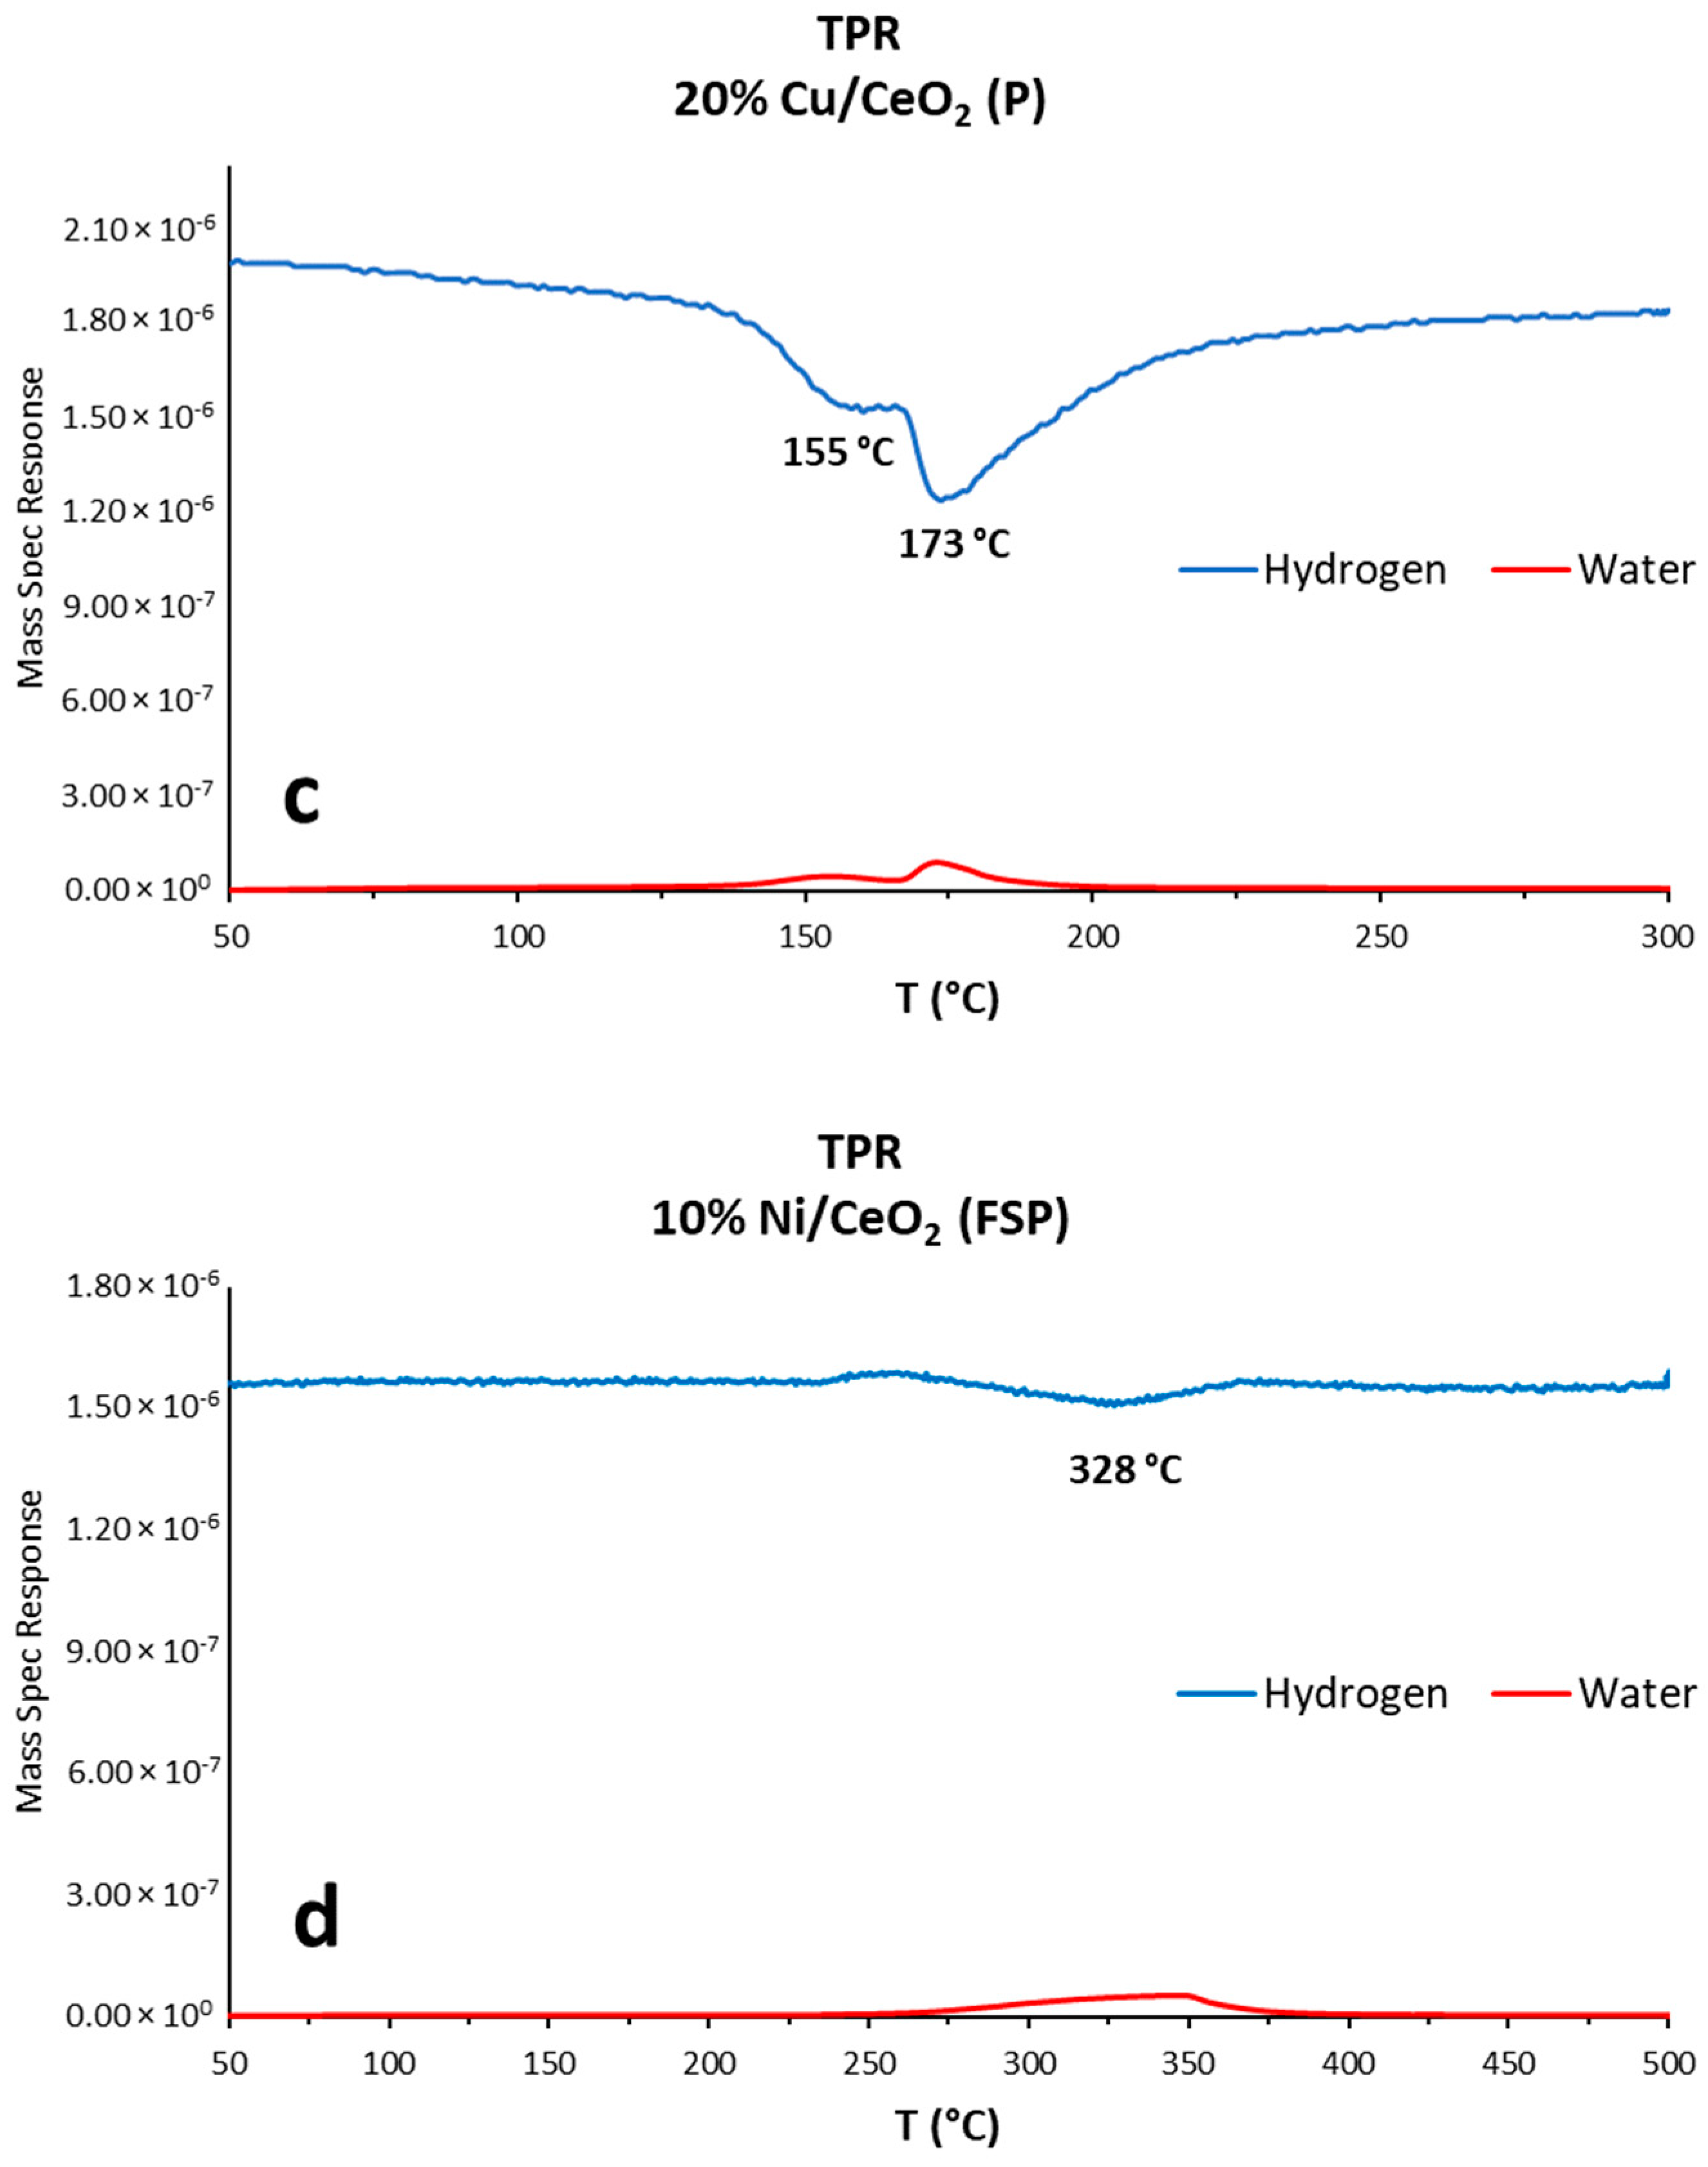
3.1.4. Temperature-Programmed Reduction (TPR)
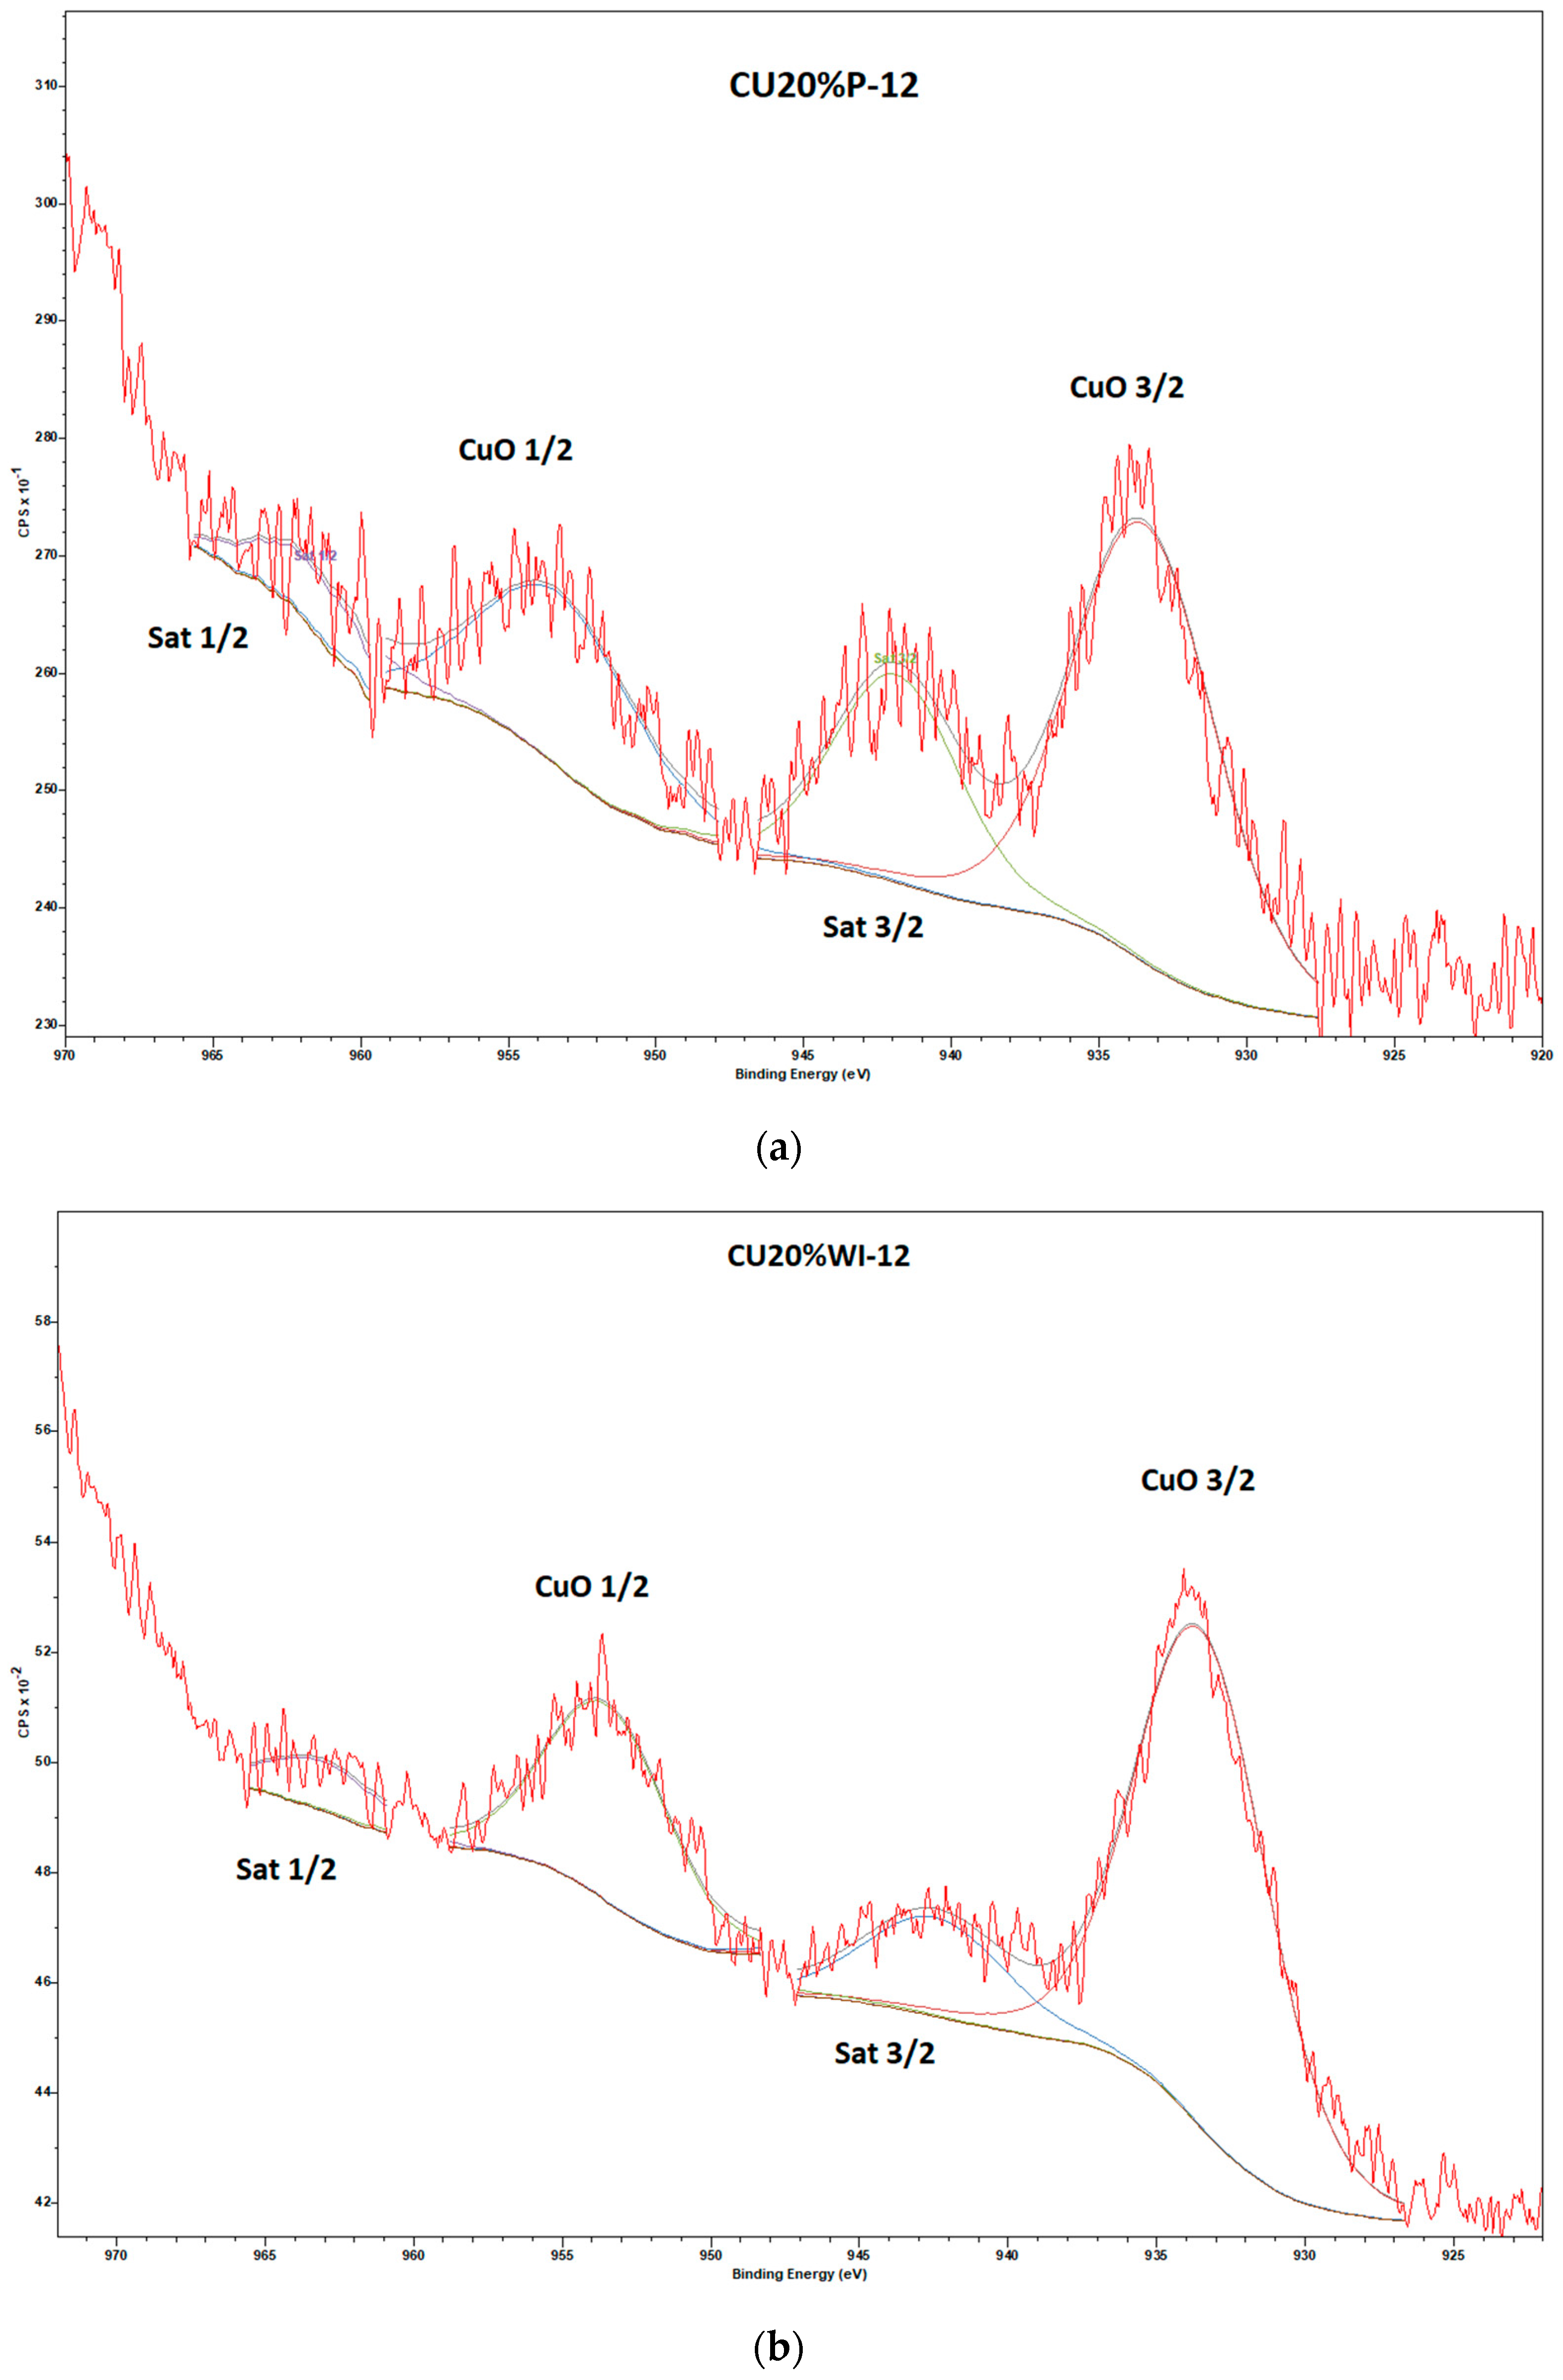
3.1.5. XPS Analysis
3.2. Activity Testing
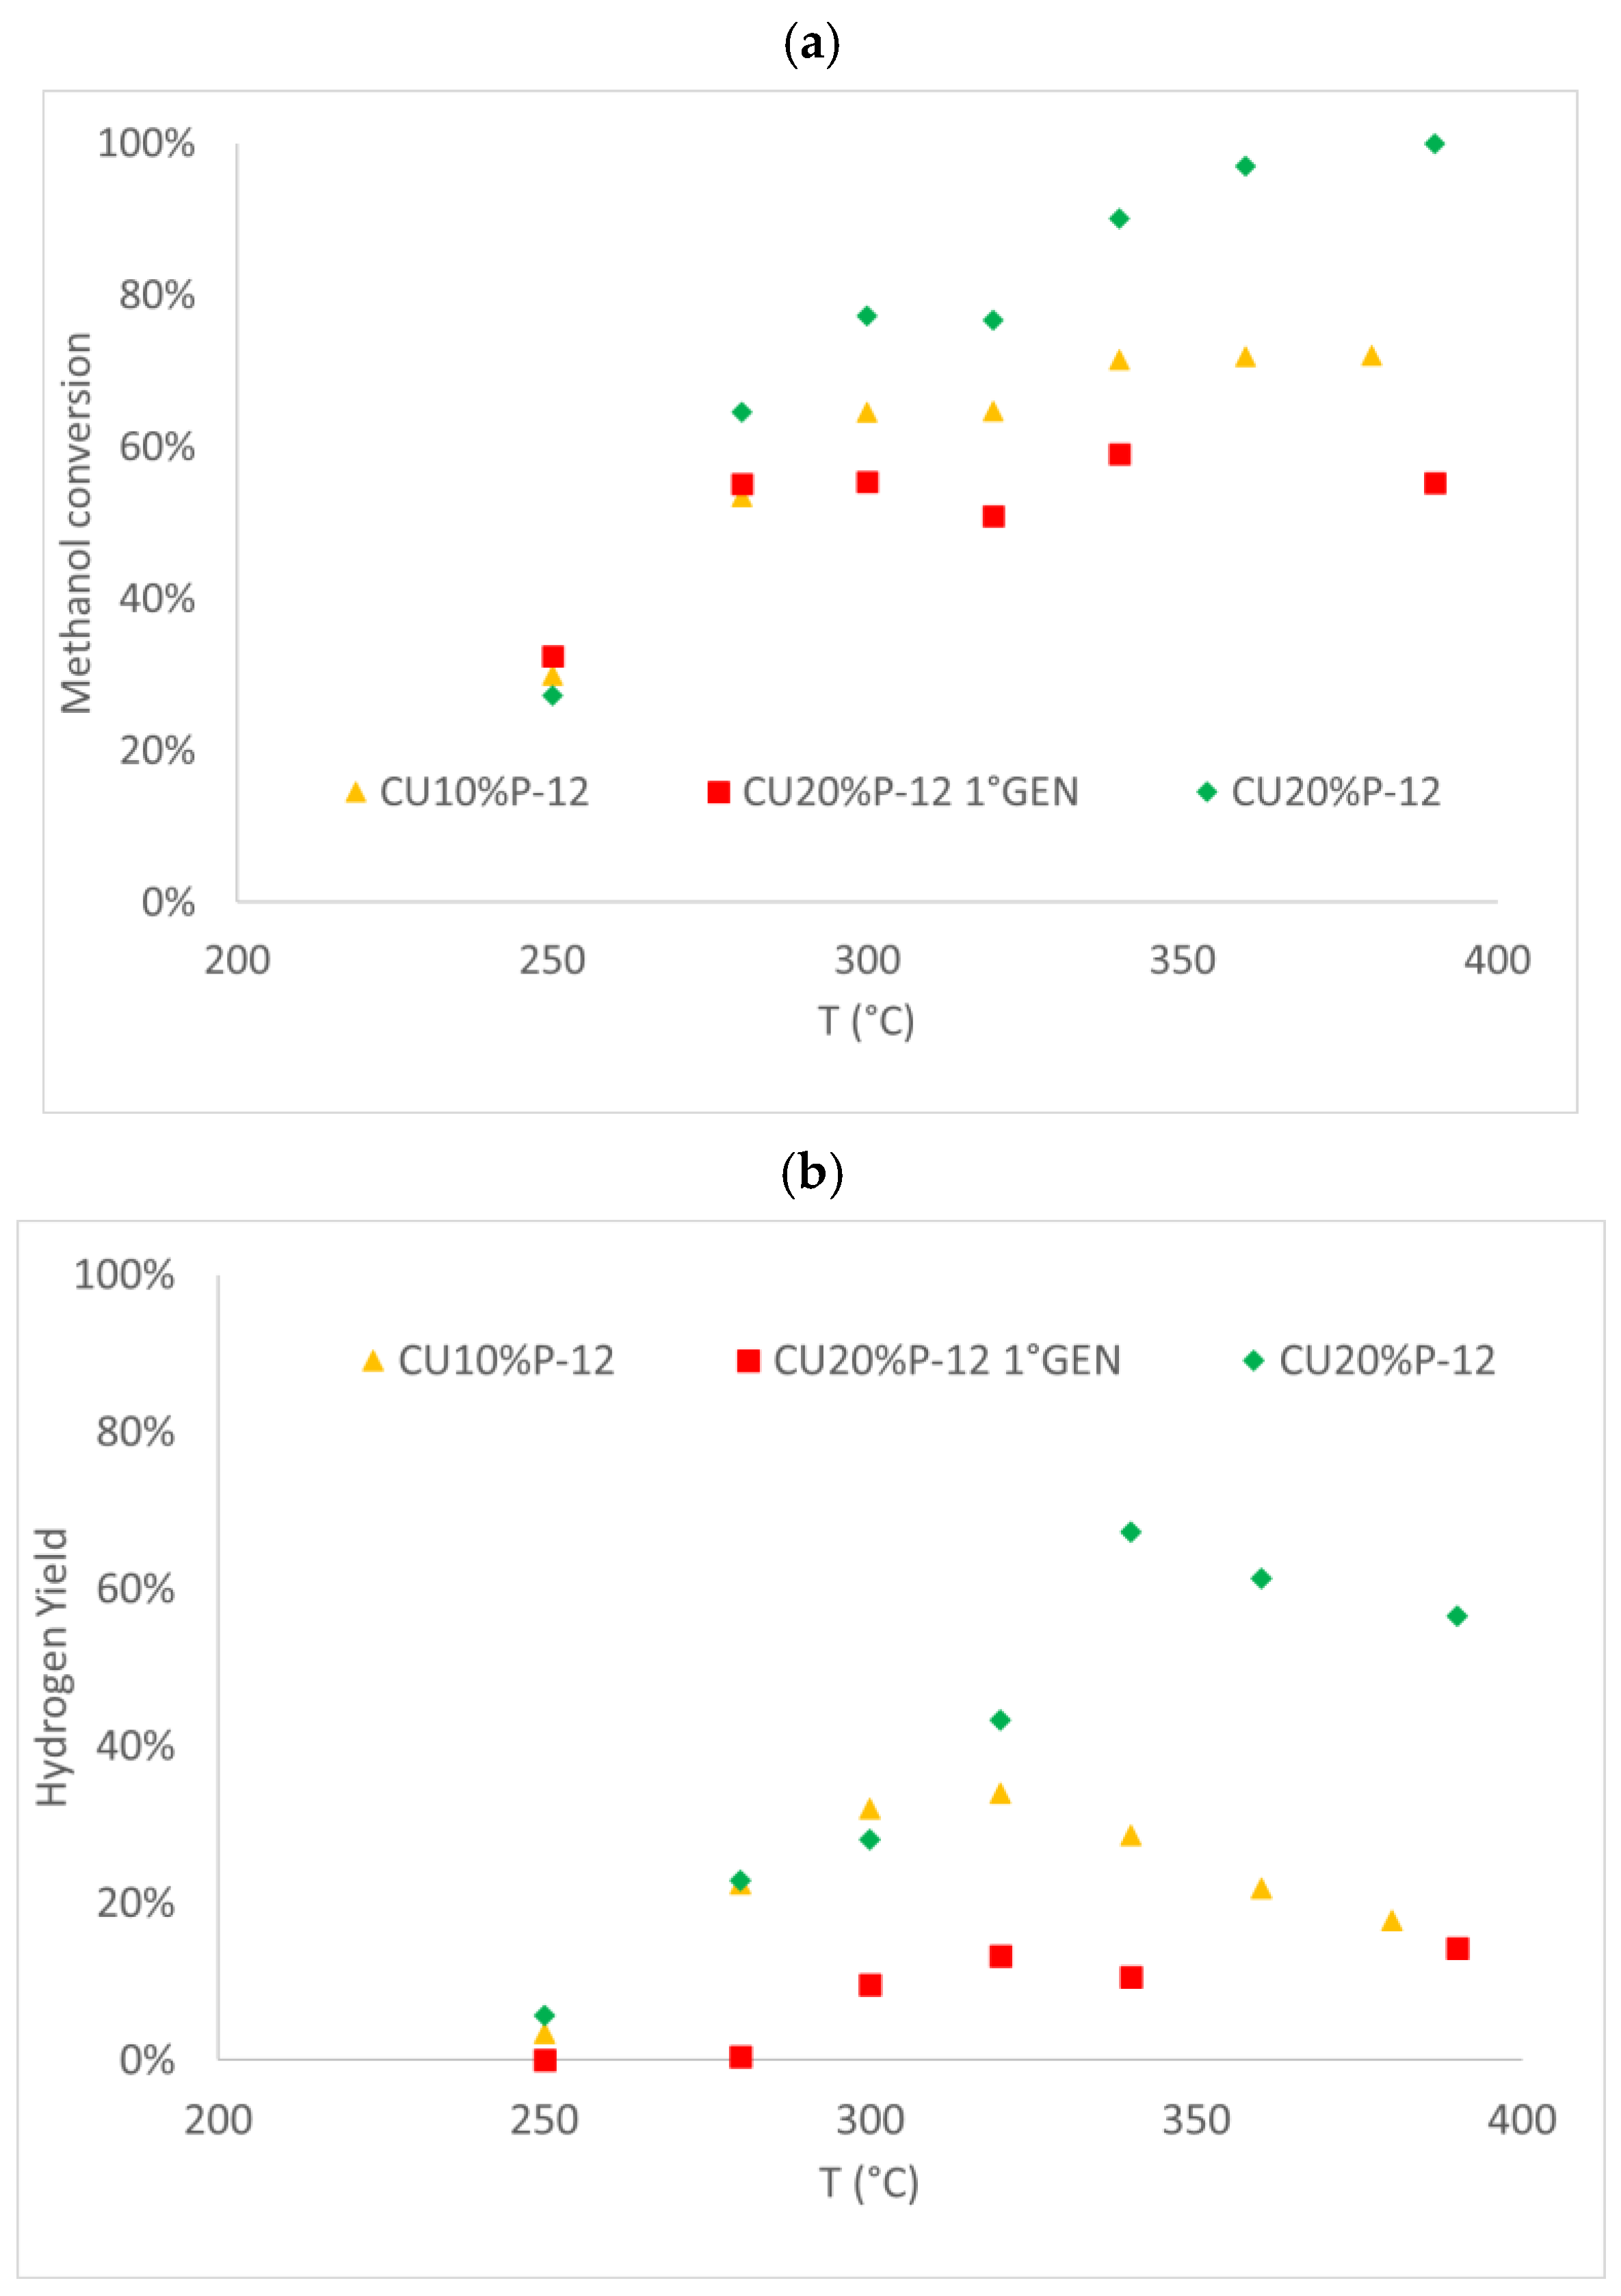
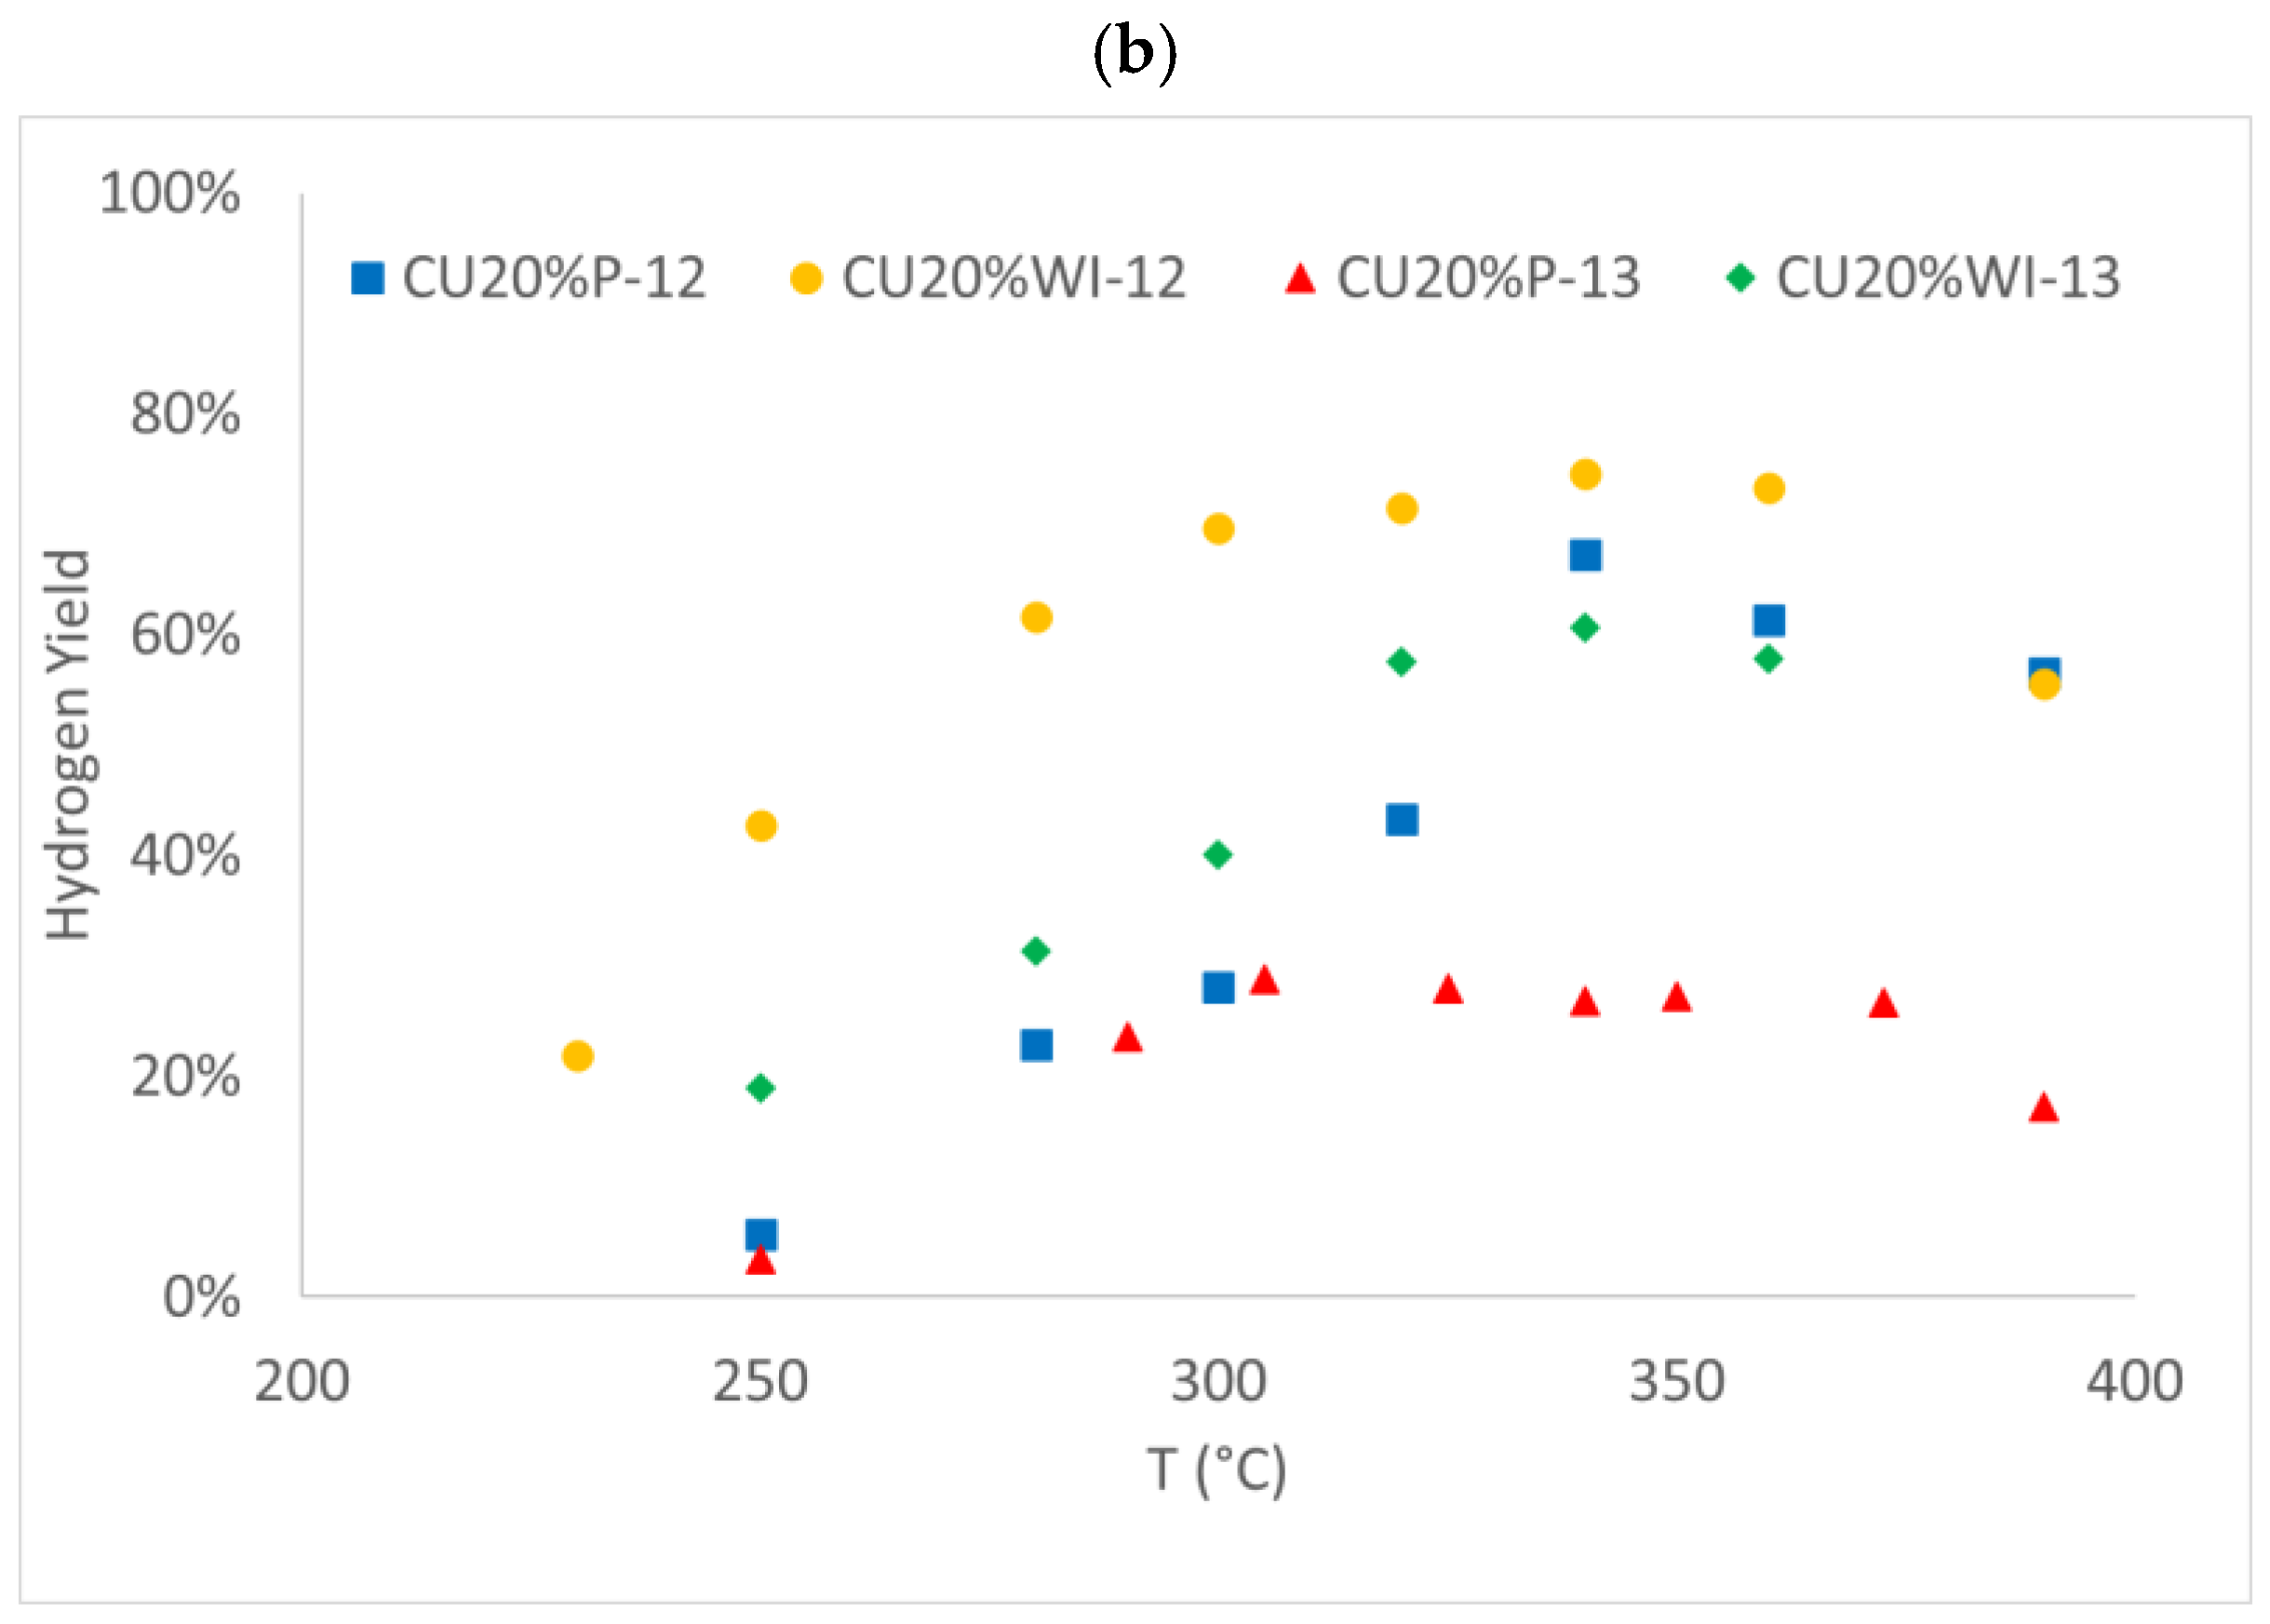
3.2.1. Copper-Based Catalysts
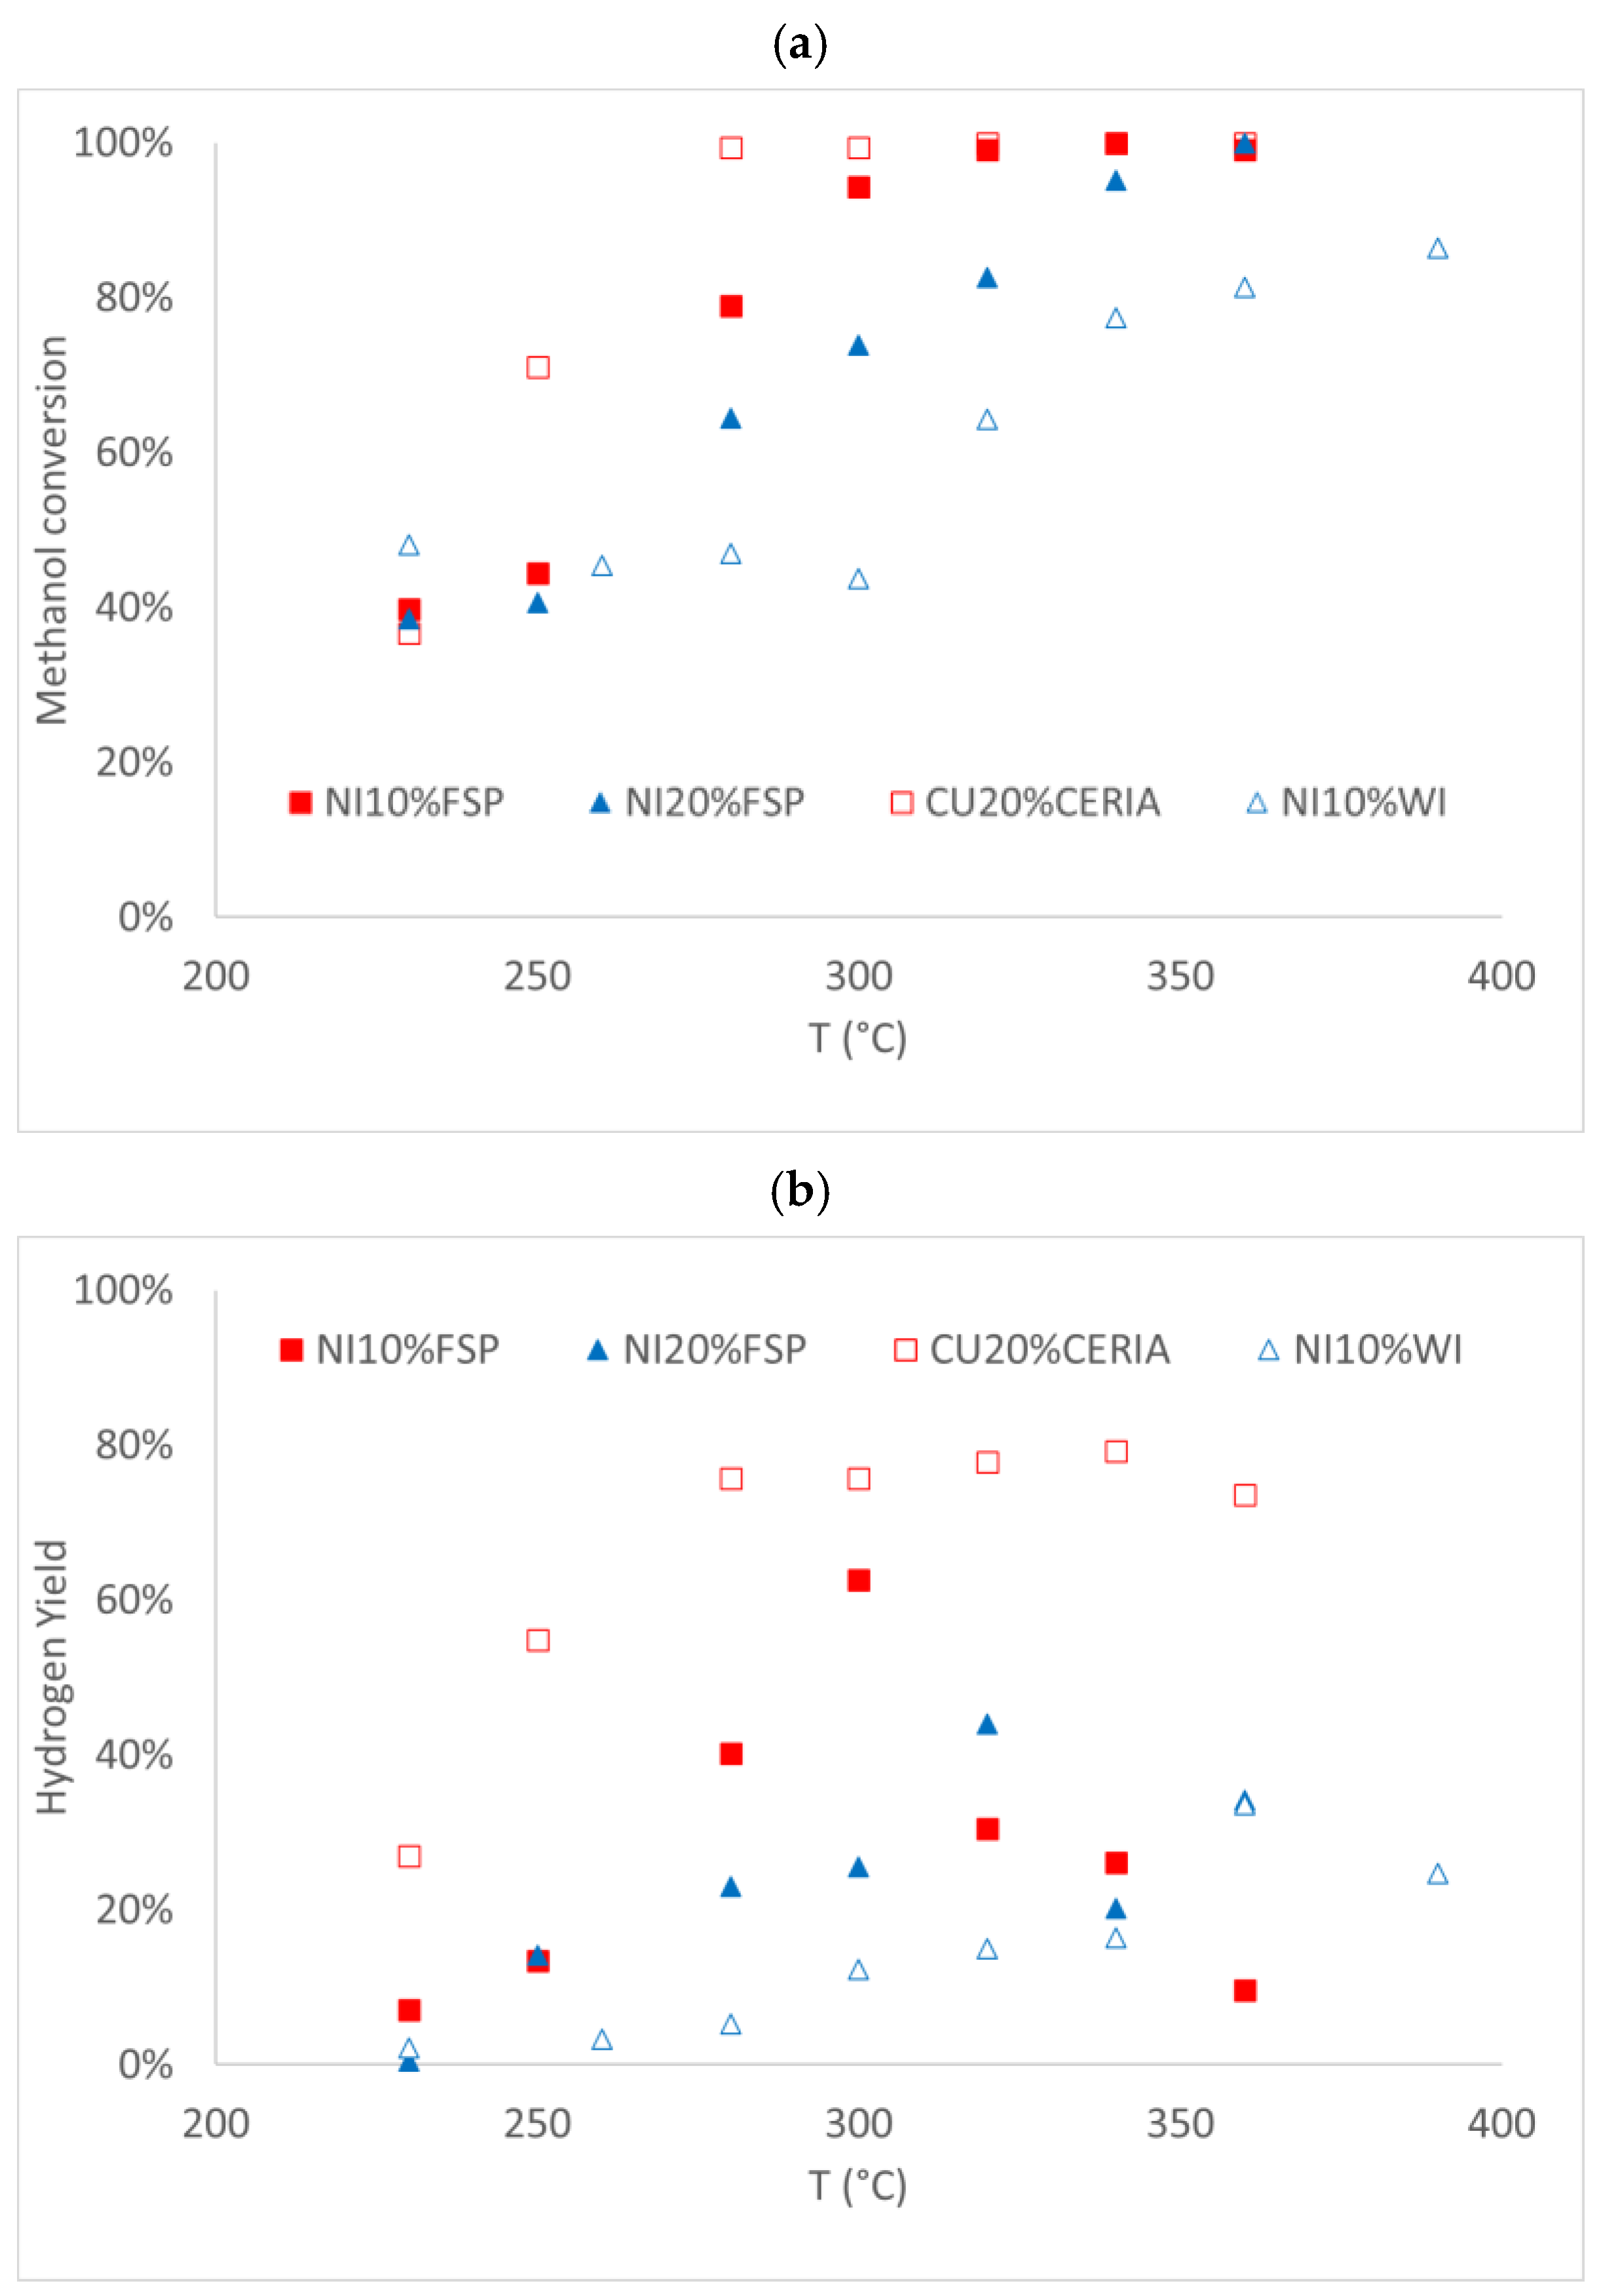
3.2.2. Nickel-Based Catalyst
3.2.3. Durability Test
4. Discussion
5. Conclusions
Supplementary Materials
Author Contributions
Funding
Data Availability Statement
Acknowledgments
Conflicts of Interest
References
- Rossetti, I.; Tripodi, A. Catalytic Production of Renewable Hydrogen for Use in Fuel Cells: A Review Study. Top. Catal. 2022. [Google Scholar] [CrossRef]
- Gielen, D.; Boshell, F.; Saygin, D.; Bazilian, M.D.; Wagner, N.; Gorini, R. The role of renewable energy in the global energy transformation. Energy Strateg. Rev. 2019, 24, 38–50. [Google Scholar] [CrossRef]
- Valera-Medina, A.; Amer-Hatem, F.; Azad, A.K.; Dedoussi, I.C.; De Joannon, M.; Fernandes, R.X.; Glarborg, P.; Hashemi, H.; He, X.; Mashruk, S.; et al. Review on ammonia as a potential fuel: From synthesis to economics. Energy Fuels 2021, 35, 6964–7029. [Google Scholar] [CrossRef]
- Li, C.; Sage, V.; Wang, T.; Tang, L.; Yang, Y.; Lee, W.J.; Lippi, R.; Wang, F.; Kozielski, K.; Patel, J. Evaluation and outlook for Australian renewable energy export via circular liquid hydrogen carriers. Int. J. Hydrogen Energy 2023, 49, 1509–1527. [Google Scholar] [CrossRef]
- Haydary, J.; Šuhaj, P.; Husár, J. Waste biomass to methanol–optimisation of gasification agent to feed ratio. Biomass Convers. Biorrefin. 2021, 11, 419–428. [Google Scholar] [CrossRef]
- Kamarudin, S.K.; Shamsul, N.S.; Ghani, J.A.; Chia, S.K.; Liew, H.S.; Samsudin, A.S. Production of methanol from biomass waste via pyrolysis. Bioresour. Technol. 2013, 129, 463–468. [Google Scholar] [CrossRef]
- Hussain, I.; Mustapha, U.; Al-Qathmi, A.T.; Malaibari, Z.O.; Alotaibi, S.; Samia; Alhooshani, K.; Ganiyu, S.A. The critical role of intrinsic physicochemical properties of catalysts for CO2 hydrogenation to methanol: A state of the art review. J. Ind. Eng. Chem. 2023, 128, 95–126. [Google Scholar] [CrossRef]
- Mierczynski, P.; Mosinska, M.; Maniukiewicz, W.; Nowosielska, M.; Czylkowska, A.; Szynkowska, M.I. Oxy-steam reforming of methanol on copper catalysts. React. Kinet. Mech. Catal. 2019, 127, 857–874. [Google Scholar] [CrossRef]
- Compagnoni, M.; Tripodi, A.; Di Michele, A.; Sassi, P.; Signoretto, M.; Rossetti, I. Low Temperature Ethanol Steam Reforming: New Ni/MxO-ZrO2 active and stable catalysts prepared by Flame Spray Pyrolysis. Int. J. Hydrogen Energy 2017, 42. in press. [Google Scholar] [CrossRef]
- Madej-Lachowska, M.; Kulawska, M.; Słoczyński, J. Methanol as a high purity hydrogen source for fuel cells: A brief review of catalysts and rate expressions. Chem. Process Eng.-Inz. Chem. i Proces. 2017, 38, 147–162. [Google Scholar] [CrossRef]
- Patel, S.; Pant, K.K. Kinetic modeling of oxidative steam reforming of methanol over Cu/ZnO/CeO2/Al2O3 catalyst. Appl. Catal. A Gen. 2009, 356, 189–200. [Google Scholar] [CrossRef]
- Mosińska, M.; Szynkowska-Jóźwik, M.I.; Mierczyński, P. Catalysts for hydrogen generation via oxy–steam reforming of methanol process. Materials 2020, 13, 5601. [Google Scholar] [CrossRef]
- Kapran, A.Y.; Orlyk, S.M. Hydrogen Production in Methanol Reforming on Modified Copper–Zinc Catalysts: A Review. Theor. Exp. Chem. 2017, 53, 3–16. [Google Scholar] [CrossRef]
- Glisenti, A.; Galenda, A.; Natile, M.M. Steam reforming and oxidative steam reforming of methanol and ethanol: The behaviour of LaCo0.7Cu0.3O3. Appl. Catal. A Gen. 2013, 453, 102–112. [Google Scholar] [CrossRef]
- Russo, D.; De Martino, M.; Di Benedetto, A.; Portarapillo, M.; Turco, M. Oxidative Methanol Reforming for Hydrogen-fed HT-PEMFC: Applications in the Naval Sector. Chem. Eng. Trans. 2023, 99, 367–372. [Google Scholar] [CrossRef]
- Esposito, S.; Turco, M.; Bagnasco, G.; Cammarano, C.; Pernice, P.; Aronne, A. Highly dispersed sol-gel synthesized Cu-ZrO2 materials as catalysts for oxidative steam reforming of methanol. Appl. Catal. A Gen. 2010, 372, 48–57. [Google Scholar] [CrossRef]
- Pérez-Hernández, R.; Gutiérrez-Martínez, A.; Gutiérrez-Wing, C.E. Effect of Cu loading on CeO2 for hydrogen production by oxidative steam reforming of methanol. Int. J. Hydrogen Energy 2007, 32, 2888–2894. [Google Scholar] [CrossRef]
- Eaimsumang, S.; Petchakan, S.; Luengnaruemitchai, A. Dependence of the CeO2 morphology in CuO/CeO2 catalysts for the oxidative steam reforming of methanol. React. Kinet. Mech. Catal. 2019, 127, 669–690. [Google Scholar] [CrossRef]
- Tesser, R.; Di Serio, M.; Santacesaria, E. Methanol steam reforming: A comparison of different kinetics in the simulation of a packed bed reactor. Chem. Eng. J. 2009, 154, 69–75. [Google Scholar] [CrossRef]
- Nichele, V.; Signoretto, M.; Pinna, F.; Menegazzo, F.; Rossetti, I.; Cruciani, G.; Cerrato, G.; Di Michele, A. Ni/ZrO2 catalysts in ethanol steam reforming: Inhibition of coke formation by CaO-doping. Appl. Catal. B Environ. 2014, 150–151, 12–20. [Google Scholar] [CrossRef]
- Jeevanandam, P.; Pulimi, V.R.R. Synthesis of nanocrystalline NiO by sol-gel and homogeneous precipitation methods. Indian J. Chem.—Sect. A Inorg. Phys. Theor. Anal. Chem. 2012, 51, 586–590. [Google Scholar]
- Giacomuzzi, R.A.M.; Portinari, M.; Rossetti, I.; Forni, L. A New Method for Preparing Nanometer-Size Perovskitic Catalysts for CH4 Flameless Combustion. In Studies in Surface Science and Catalysis; Elsevier: Amsterdam, The Netherlands, 2000; Volume 130A. [Google Scholar]
- Finocchio, E.; Rossetti, I.; Ramis, G. Redox properties of Co- and Cu-based catalysts for the steam reforming of ethanol. Int. J. Hydrogen Energy 2013, 38, 3213–3225. [Google Scholar] [CrossRef]
- Chiarello, G.L.; Rossetti, I.; Forni, L.; Lopinto, P.; Migliavacca, G. Solvent nature effect in preparation of perovskites by flame-pyrolysis. 1. Carboxylic acids. Appl. Catal. B Environ. 2007, 72, 218–226. [Google Scholar] [CrossRef]
- Chiarello, G.L.; Rossetti, I.; Forni, L.; Lopinto, P.; Migliavacca, G. Solvent nature effect in preparation of perovskites by flame pyrolysis. 2. Alcohols and alcohols + propionic acid mixtures. Appl. Catal. B Environ. 2007, 72, 227–232. [Google Scholar] [CrossRef]
- Kydd, R.; Teoh, W.Y.; Wong, K.; Wang, Y.; Scott, J.; Zeng, Q.H.; Yu, A.B.; Zou, J.; Amal, R. Flame-synthesized ceria-supported copper dimers for preferential oxidation of CO. Adv. Funct. Mater. 2009, 19, 369–377. [Google Scholar] [CrossRef]
- Compagnoni, M.; Lasso, J.; Di Michele, A.; Rossetti, I. Flame-pyrolysis-prepared catalysts for the steam reforming of ethanol. Catal. Sci. Technol. 2016, 6, 6247–6256. [Google Scholar] [CrossRef]
- Chiarello, G.L.; Rossetti, I.; Lopinto, P.; Migliavacca, G.; Forni, L. Preparation by flame spray pyrolysis of ABO3 catalysts for the flameless combustion of methane. Catal. Today 2006, 117, 549–553. [Google Scholar] [CrossRef]
- Cho, Y.-S.; Moon, J.W.; Chung, K.C.; Lee, J.-G. Synthesis of Nickel and Copper Nanopowders by Plasma Arc Evaporation. J. Korean Powder Metall. Inst. 2013, 20, 411–424. [Google Scholar] [CrossRef]
- Roknabadi, R.; Mirzaei, A.A.; Atashi, H. Assessment of composition and calcination parameters in Fischer-Tropsch synthesis over Fe-Mn-Ce/γ -Al2O3 nanocatalyst. Oil Gas Sci. Technol. 2021, 76, 11. [Google Scholar] [CrossRef]
- Deraz, N.M. The comparative jurisprudence of catalysts preparation methods: I. Precipitation and impregnation methods. J. Ind. Environ. Chem. 2018, 2, 19–21. [Google Scholar]
- Rossetti, I.; Lasso, J.; Finocchio, E.; Ramis, G.; Nichele, V.; Signoretto, M.; Di Michele, A. TiO2-supported catalysts for the steam reforming of ethanol. Appl. Catal. A Gen. 2014, 477, 42–53. [Google Scholar] [CrossRef]
- Advanced Selected Powder Diffraction Data, Miner. DBM; J.C.P.D.S.: Swarthmore, PA, USA, 1974.
- Scherrer, P.; Debye, P. Scherrer equation. Physik 1916, 17, 277–283. [Google Scholar]
- Cychosz, K.A.; Thommes, M. Progress in the Physisorption Characterization of Nanoporous Gas Storage Materials. Engineering 2018, 4, 559–566. [Google Scholar] [CrossRef]
- Zimmer, P.; Tschöpe, A.; Birringer, R. Temperature-programmed reaction spectroscopy of ceria- and Cu/ceria-supported oxide catalyst. J. Catal. 2002, 205, 339–345. [Google Scholar] [CrossRef]
- Ratnasamy, P.; Srinivas, D.; Satyanarayana, C.V.V.; Manikandan, P.; Senthil Kumaran, R.S.; Sachin, M.; Shetti, V.N. Influence of the support on the preferential oxidation of CO in hydrogen-rich steam reformates over the CuO-CeO2-ZrO2 system. J. Catal. 2004, 221, 455–465. [Google Scholar] [CrossRef]
- Luo, M.F.; Zhong, Y.J.; Yuan, X.X.; Zheng, X.M. TPR and TPD studies of CuO/CeO2 catalysts for low temperature CO oxidation. Appl. Catal. A Gen. 1997, 162, 121–131. [Google Scholar] [CrossRef]
- Avgouropoulos, G.; Ioannides, T. Effect of synthesis parameters on catalytic properties of CuO-CeO2. Appl. Catal. B Environ. 2006, 67, 1–11. [Google Scholar] [CrossRef]
- Yang, W.; Li, D.; Xu, D.; Wang, X. Effect of CeO2 preparation method and Cu loading on CuO/CeO2 catalysts for methane combustion. J. Nat. Gas Chem. 2009, 18, 458–466. [Google Scholar] [CrossRef]
- Zou, H.; Dong, X.; Lin, W. Selective CO oxidation in hydrogen-rich gas over CuO/CeO2 catalysts. Appl. Surf. Sci. 2006, 253, 2893–2898. [Google Scholar] [CrossRef]
- Fierro, G.; Lo Jacono, M.; Inversi, M.; Porta, P.; Cioci, F.; Lavecchia, R. Study of the reducibility of copper in CuO-ZnO catalysts by temperature-programmed reduction. Appl. Catal. A Gen. 1996, 137, 327–348. [Google Scholar] [CrossRef]
- Wang, W.; Li, X.; Zhang, Y.; Zhang, R.; Ge, H.; Bi, J.; Tang, M. Strong metal–support interactions between Ni and ZnO particles and their effect on the methanation performance of Ni/ZnO. Catal. Sci. Technol. 2017, 7, 4413–4421. [Google Scholar] [CrossRef]
- Zedan, A.F.; AlJaber, A.S. Combustion synthesis of non-precious CuO-CeO2 nanocrystalline catalysts with enhanced catalytic activity for methane oxidation. Materials 2019, 12, 878. [Google Scholar] [CrossRef]
- Kundakovic, L.; Flytzani-Stephanopoulos, M. Cu- and Ag-modified cerium oxide catalysts for methane oxidation. J. Catal. 1998, 179, 203–221. [Google Scholar] [CrossRef]
- Liu, W.; Flytzani-Stephanopoulos, M. Total oxidation of carbon monoxide and methane over transition metal fluorite oxide composite catalysts: I. Catalyst composition and activity. J. Catal. 1995, 153, 304–316. [Google Scholar] [CrossRef]
- Udani, P.P.C.; Gunawardana, P.V.D.S.; Lee, H.C.; Kim, D.H. Steam reforming and oxidative steam reforming of methanol over CuO-CeO2 catalysts. Int. J. Hydrogen Energy 2009, 34, 7648–7655. [Google Scholar] [CrossRef]
- Li, M.; Amari, H.; van Veen, A.C. Metal-oxide interaction enhanced CO2 activation in methanation over ceria supported nickel nanocrystallites. Appl. Catal. B Environ. 2018, 239, 27–35. [Google Scholar] [CrossRef]
- Yang, S.-C.; Pang, S.H.; Sulmonetti, T.P.; Su, W.-N.; Lee, J.-F.; Hwang, B.-J.; Jones, C.W. Synergy between Ceria Oxygen Vacancies and Cu Nanoparticles Facilitates the Catalytic Conversion of CO2 to CO under Mild Conditions. ACS Catal. 2018, 8, 12056–12066. [Google Scholar] [CrossRef]
- Li, J.; Zhu, J.; Fu, S.; Tao, L.; Chu, B.; Qin, Q.; Wang, J.; Li, B.; Dong, L. Insight into copper-cerium catalysts with different Cu valence states for CO-SCR and in-situ DRIFTS study on reaction mechanism. Fuel 2023, 339, 126962. [Google Scholar] [CrossRef]
- Chen, J.; Zhan, Y.; Zhu, J.; Chen, C.; Lin, X.; Zheng, Q. The synergetic mechanism between copper species and ceria in NO abatement over Cu/CeO2 catalysts. Appl. Catal. A Gen. 2010, 377, 121–127. [Google Scholar] [CrossRef]
- Liu, H.-X.; Li, S.-Q.; Wang, W.-W.; Yu, W.-Z.; Zhang, W.-J.; Ma, C.; Jia, C.-J. Partially sintered copper–ceria as excellent catalyst for the high-temperature reverse water gas shift reaction. Nat. Commun. 2022, 13, 867. [Google Scholar] [CrossRef]
- Mierczynski, P.; Mierczynska, A.; Ciesielski, R.; Mosinska, M.; Nowosielska, M.; Czylkowska, A.; Maniukiewicz, W.; Szynkowska, M.I.; Vasilev, K. High active and selective Ni/CeO2–Al2O3 and Pd–Ni/CeO2–Al2O3 catalysts for oxy-steam reforming of methanol. Catalysts 2018, 8, 13–16. [Google Scholar] [CrossRef]
- Pérez-Hernández, R.; Mondragón Galicia, G.; Mendoza Anaya, D.; Palacios, J.; Angeles-Chavez, C.; Arenas-Alatorre, J. Synthesis and characterization of bimetallic Cu-Ni/ZrO2 nanocatalysts: H2 production by oxidative steam reforming of methanol. Int. J. Hydrogen Energy 2008, 33, 4569–4576. [Google Scholar] [CrossRef]
- Mosinska, M.; Stępińska, N.; Maniukiewicz, W.; Rogowski, J.; Mierczynska-Vasilev, A.; Vasilev, K.; Szynkowska, M.I.; Mierczynski, P. Hydrogen production on Cu-Ni catalysts via the oxy-steam reforming of methanol. Catalysts 2020, 10, 273. [Google Scholar] [CrossRef]
- Mierczynski, P.; Mosinska, M.; Zakrzewski, M.; Dawid, B.; Ciesielski, R.; Maniukiewicz, W.; Maniecki, T. Influence of the Zn–Al binary oxide composition on the physicochemical and catalytic properties of Ni catalysts in the oxy-steam reforming of methanol. React. Kinet. Mech. Catal. 2017, 121, 453–472. [Google Scholar] [CrossRef]
- Mierczynski, P.; Vasilev, K.; Mierczynska, A.; Maniukiewicz, W.; Ciesielski, R.; Rogowski, J.; Szynkowska, I.M.; Trifonov, A.Y.; Dubkov, S.V.; Gromov, D.G.; et al. The effect of gold on modern bimetallic Au–Cu/MWCNT catalysts for the oxy-steam reforming of methanol. Catal. Sci. Technol 2016, 6, 4168–4183. [Google Scholar] [CrossRef]
- Mierczynski, P.; Vasilev, K.; Mierczynska, A.; Maniukiewicz, W.; Szynkowska, M.I.; Maniecki, T.P. Bimetallic Au–Cu, Au–Ni catalysts supported onMWCNTs for oxy-steam reforming of methanol. Appl. Catal. B Environ. 2016, 185, 281–294. [Google Scholar] [CrossRef]
- Luengnaruemitchai, A.; Pojanavaraphan, C.; Kumyam, A.; Thunyaratchatanon, C.; Gulari, E. Hydrogen production from the oxidative steam reforming of methanol over Au–Cu nanoparticles supported on Ce1-xZrxO2 in a fixed-bed reactor. Int. J. Hydrogen Energy 2019, 44, 1686–1700. [Google Scholar] [CrossRef]
- Rabe, S.; Vogel, F. A thermogravimetric study of the partial oxidation of methanol for hydrogen production over a Cu/ZnO/Al2O3 catalyst. Appl. Catal. B Environ. 2008, 84, 827–834. [Google Scholar] [CrossRef]
- Yong, S.T.; Ooi, C.W.; Chai, S.P.; Wu, X.S. Review of methanol reforming-Cu-based catalysts, surface reaction mechanisms, and reaction schemes. Int. J. Hydrogen Energy 2013, 38, 9541–9552. [Google Scholar] [CrossRef]
- Wachs, I.E.; Madix, R.J. The selective oxidation of CH3OH to H2CO on a copper(110) catalyst. J. Catal. 1978, 53, 208–227. [Google Scholar] [CrossRef]
- Lee, J.K.; Ko, J.B.; Kim, D.H. Methanol steam reforming over Cu/ZnO/Al2O3 catalyst: Kinetics and effectiveness factor. Appl. Catal. A Gen. 2004, 278, 25–35. [Google Scholar] [CrossRef]
- Sakong, S.; Gross, A. Total oxidation of methanol on Cu(110): A density functional theory study. J. Phys. Chem. A 2007, 111, 8814–8822. [Google Scholar] [CrossRef] [PubMed]
- Manzoli, M.; Chiorino, A.; Boccuzzi, F. Decomposition and combined reforming of methanol to hydrogen: A FTIR and QMS study on Cu and Au catalysts supported on ZnO and TiO2. Appl. Catal. B Environ. 2005, 57, 201–209. [Google Scholar] [CrossRef]
- Yong, S.T.; Hidajat, K.; Kawi, S. The roles of Cu, Zn and Mn in Cu0.5Zn0.5Mn2O4 spinel-lattice catalyst for methanol decomposition. Catal. Today 2008, 131, 188–196. [Google Scholar] [CrossRef]
 [JCPDS 45-0937], CeO2
  [JCPDS 75-0076], Al2O3
  [JCPDS 29-0063]).
[JCPDS 45-0937], CeO2 [JCPDS 75-0076], Al2O3 [JCPDS 29-0063]).
[JCPDS 29-0063]).
[JCPDS 45-0937], CeO2 [JCPDS 75-0076], Al2O3 [JCPDS 29-0063]).
 [JCPDS 45-0937], Cu
  [JCPDS 03-1018], CeO2
  [JCPDS 75-0076], NiO
  [JCPDS 47-1049], and Ni
  [JCPDS 87-0712]).
[JCPDS 45-0937], Cu [JCPDS 03-1018], CeO2 [JCPDS 75-0076], NiO [JCPDS 47-1049], and Ni [JCPDS 87-0712]).
[JCPDS 87-0712]).
[JCPDS 45-0937], Cu [JCPDS 03-1018], CeO2 [JCPDS 75-0076], NiO [JCPDS 47-1049], and Ni [JCPDS 87-0712]).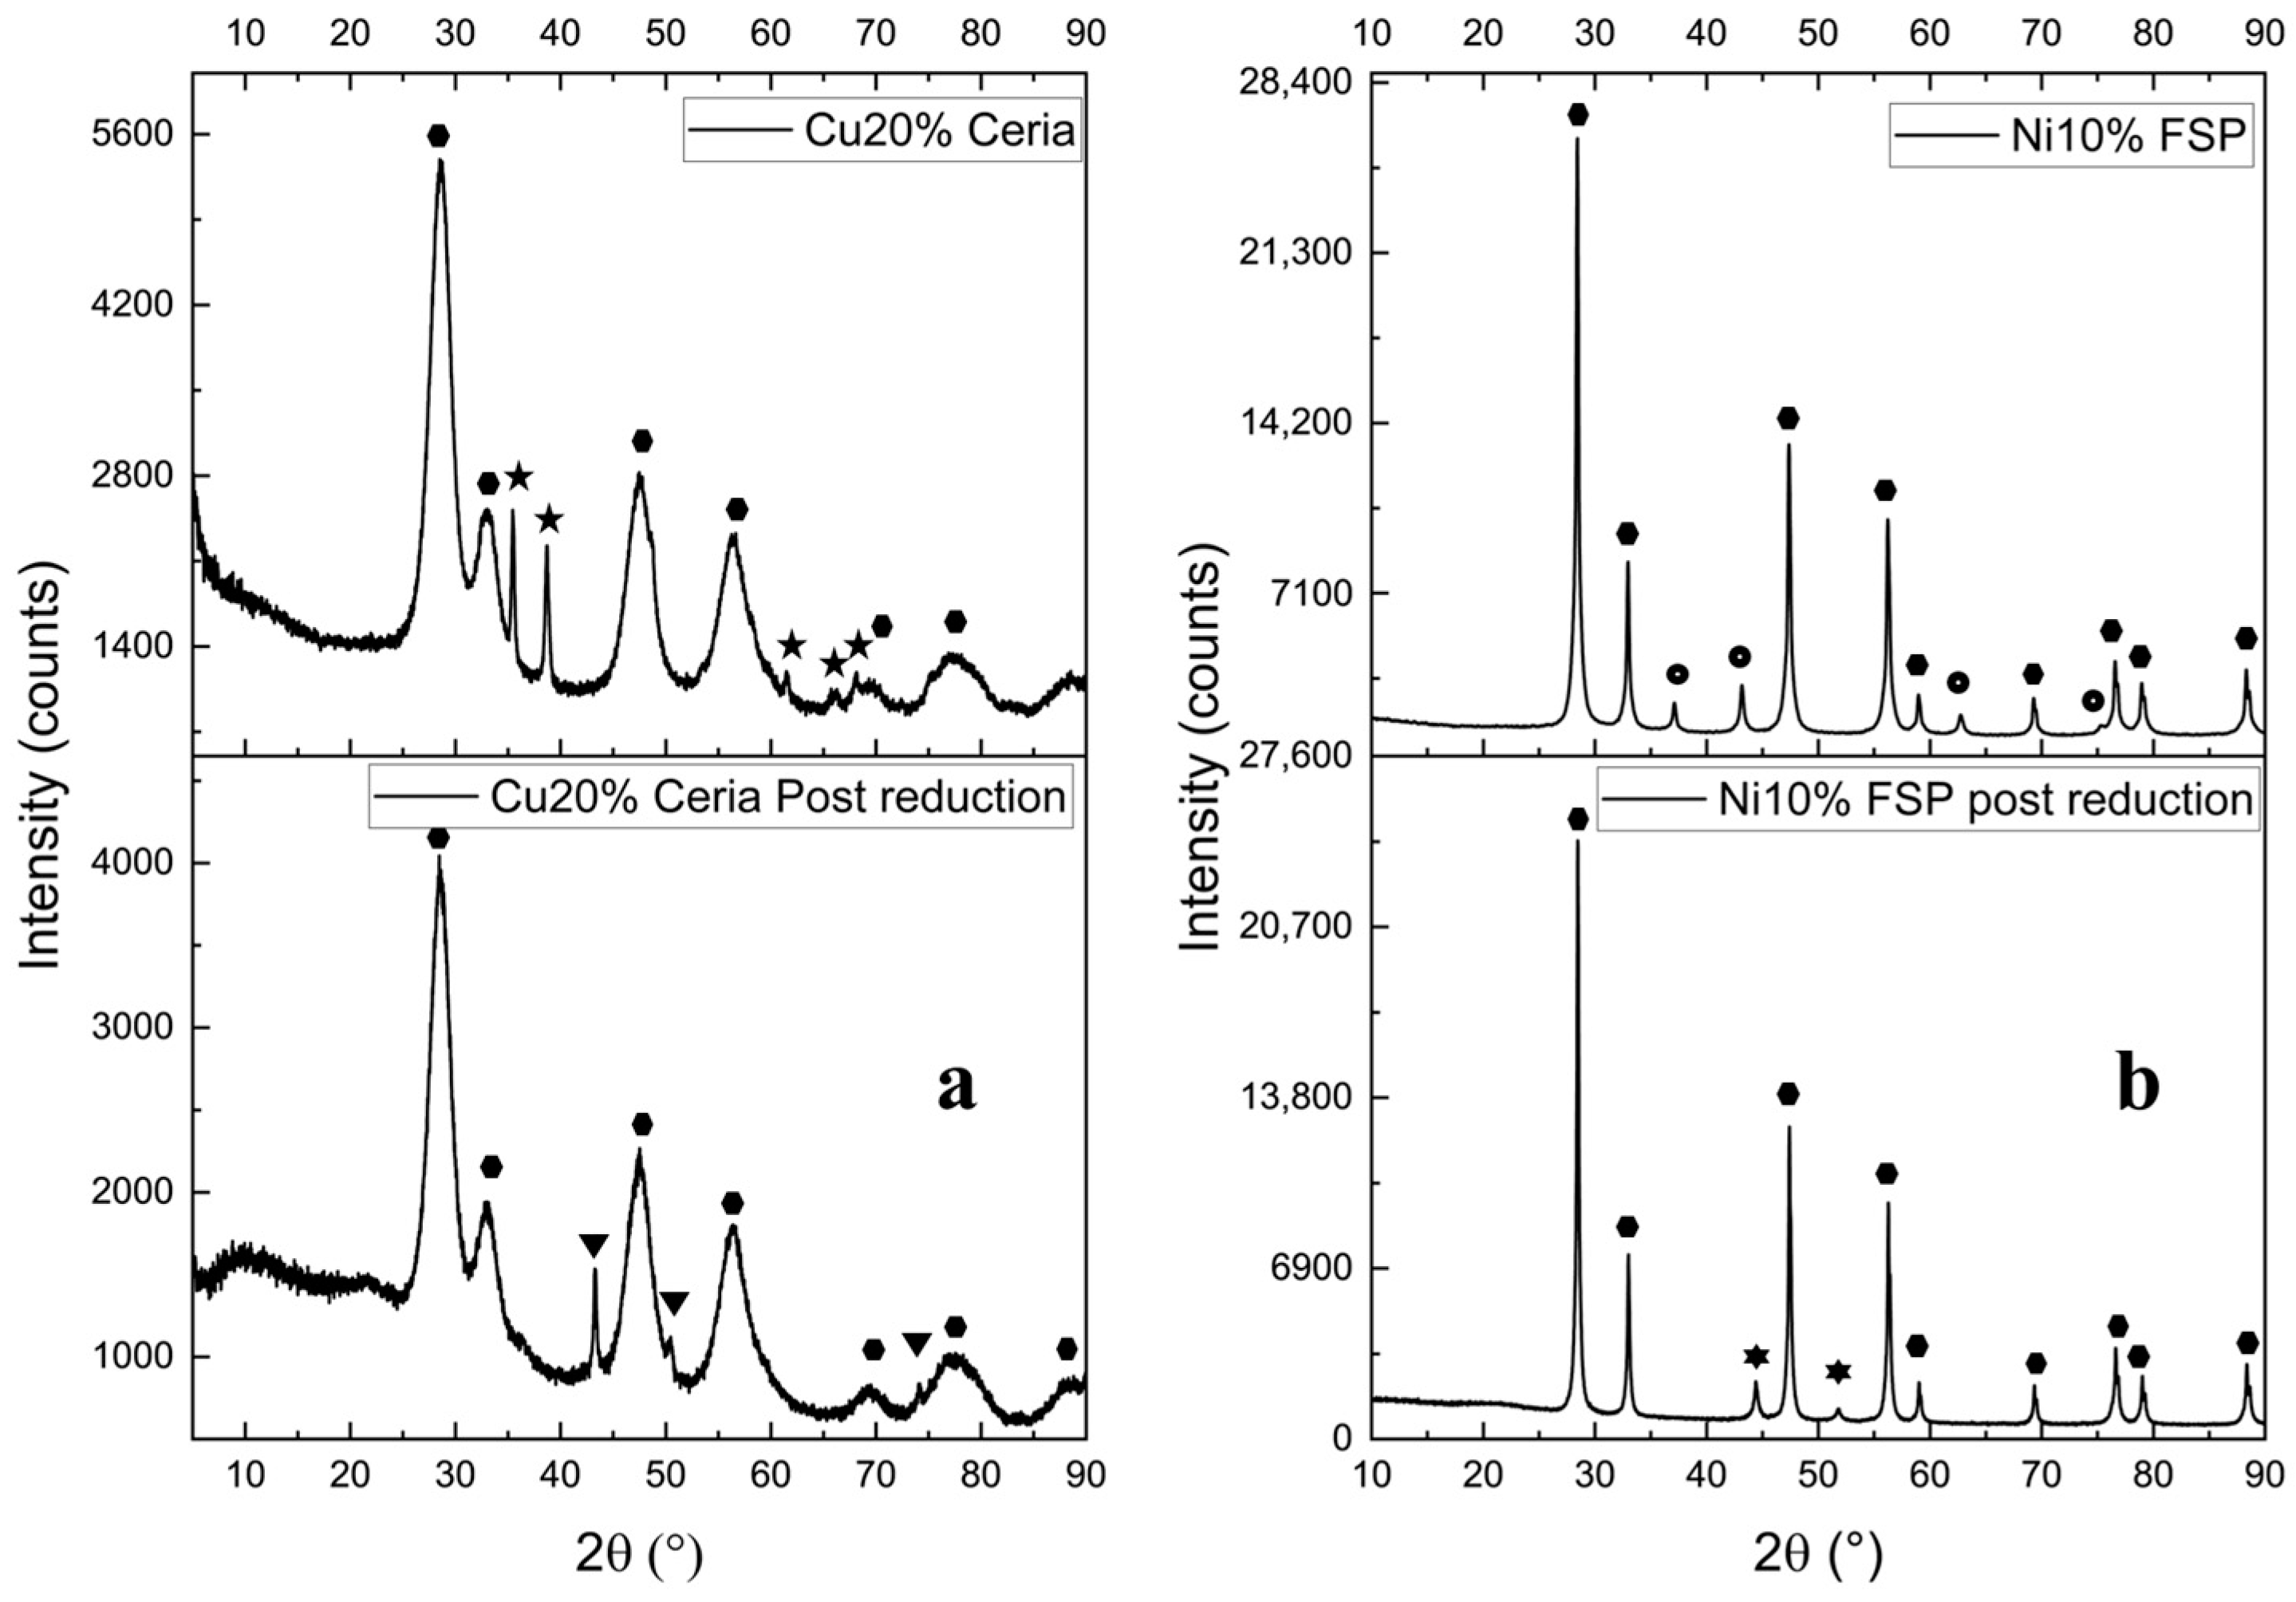


| Sample | Active Phase | Support (mol/mol) | Method |
|---|---|---|---|
| CU10%P-12 | Cu (10 wt%) | CeO2/Al2O3 (1:2) | Precipitation |
| CU20%P-12 1°G | Cu (20 wt%) | CeO2/Al2O3 (1:2) | Precipitation |
| CU20%P-12 | Cu (20 wt%) | CeO2/Al2O3 (1:2) | Precipitation |
| CU20%P-13 | Cu (20 wt%) | CeO2/Al2O3 (1:3) | Precipitation |
| CU20%CERIA | Cu (20 wt%) | CeO2 | Precipitation |
| CU40%CERIA | Cu (40 wt%) | CeO2 | Precipitation |
| CU20%WI-12 | Cu (20 wt%) | CeO2/Al2O3 (1:2) | Wet impregnation |
| CU40%WI-12 | Cu (40 wt%) | CeO2/Al2O3 (1:2) | Wet impregnation |
| CU20%WI-13 | Cu (20 wt%) | CeO2/Al2O3 (1:3) | Wet impregnation |
| NI10%WI | Ni (10 wt%) | CeO2 | Wet impregnation |
| NI10%FSP | Ni (10 wt%) | CeO2 | Flame spray pyrolysis |
| NI20%FSP | Ni (20 wt%) | CeO2 | Flame spray pyrolysis |
| Catalyst | SSABET (m2/g) | Metal Loading (wt%) * | Crystal Size (nm) ** |
|---|---|---|---|
| CU10%P-12 | 23 | 6.1 | 27 |
| CU20%P-12 1°G | 6.2 | 20.0 | 22 |
| CU20%P-12 | 49 | 26.7 | 27 |
| CU20%P-13 | 121 | 19.9 | 30 |
| CU20%WI-12 | 95 | 16.4 | 28 |
| CU40%WI-12 | 46 | 21.9 | 27 |
| CU20%WI-13 | 75 | 12.8 | 26 |
| CU20%CERIA | 121 | 16.9 | 20 a |
| CU40%CERIA | 44 | 23.7 | 17 |
| NI10%FSP | 9 | 9.5 | 17 b |
| NI20%FSP | 16 | 19.3 | 18 |
| NI10%WI | 164 | 12.5 | n.a. |
| T (°C) | MeOH Conversion | H2 Yield | CO2/COx Ratio | Impurity |
|---|---|---|---|---|
| 200 °C | 18.19% | / | / | CH3CHO |
| 230 °C | 36.55% | / | / | CH3CHO |
| 260 °C | 25.99% | / | / | / |
| 280 °C | 12.72% | 0.72% | 41.96–58.04% | / |
| 300 °C | 18.88% | 1.46% | 57.39–42.61% | / |
| 320 °C | 30.52% | 1.90% | 42.57–57.43% | CH3CHO + CH4 |
| 340 °C | 26.42% | 1.78% | 45.80–54.20% | CH3CHO |
| 360 °C | 30.07% | 2.47% | 47.23–52.77% | CH3CHO + CH4 |
| 390 °C | 30.63% | 2.97% | 47.75–52.25% | CH3CHO + CH4 |
| 410 °C | 31.19% | 3.24% | 46.14–53.86% | CH3CHO + CH4 |
| Catalyst | Prep. Method | SBET (m2/g) | Red. T (°C) | Red. Time (h) | GHSV (h−1) | T OSRM (°C) | CH3OH Conv. (%) | H2 Selectivity (%) |
|---|---|---|---|---|---|---|---|---|
| Cu (5)/CeO2/Al2O3 [8] | WI | 126 | 300 | 1 | 26,700 | 250 | 97.7 | 69.1 |
| Cu (20)/CeO2/Al2O3 [8] | WI | 101 | 300 | 1 | 26,700 | 250 | 99.6 | 68.2 |
| Cu (40)/CeO2/Al2O3 [8] | WI | 90 | 300 | 1 | 26,700 | 250 | 87.9 | 65.7 |
| Cu (60)/CeO2/Al2O3 [8] | WI | 30 | 300 | 1 | 26,700 | 250 | 9.6 | 28.5 |
| Ni (5)/CeO2/Al2O3 [53] | WI | 132 | 300 | 1 | 26,700 | 250 | 2 | 30.5 |
| Ni (20)/CeO2/Al2O3 [53] | WI | 128 | 300 | 1 | 26,700 | 250 | 31 | 33 |
| Ni (40)/CeO2/Al2O3 [53] | WI | 78 | 300 | 1 | 26,700 | 250 | 98 | 68.9 |
| Ni (60)/CeO2/Al2O3 [53] | WI | 133 | 300 | 1 | 26,700 | 250 | 77 | 58.2 |
| Ni (40)/CeO2 [53] | WI | 34 | 300 | 1 | 26,700 | 250 | 85 | 68.6 |
| Cu-Ni/ZrO2 [54] | DP | 35 | 300 | 1 | 30,000 | 250 | 55 | 60.0 |
| Cu (30%)-Ni(10%)/ZrO2/Al2O3 [55] | SIP | 119 | 300 | 1 | / | 200 | 87 | 69.49 |
| Cu (30%)-Ni(10%)/CeO2/Al2O3 [55] | SIP | 134 | 300 | 1 | / | 200 | 98 | 69.17 |
| Pd (0.5)-Ni (20)/ZnO/Al2O3 [56] | SIP | 106 | 300 | 1 | 26,700 | 300 | 99.0 | 73.0 |
| Au (1.0)-Cu (20)/MWCNTs [57] | DP | 272 | 300 | 1 | 26,700 | 300 | 83.0 | 73.0 |
| Au (1.0)-Ni (20)/MWCNTs [58] | DP | 311 | 300 | 1 | 26,700 | 300 | 99.8 | 70.4 |
| Au-Cu (Au/Cu = 3/1) (5%) /Ce0.75Zr0.25O2 [59] | CP | 143 | 300 | 1 | / | 350 | 99.6 | 62.4 |
| Cu (20%)/CeO2/Al2O3 (1:2) [This work] | WI | 95 | 300 | 1 | 23,500 | 340 | 100 | 74.5 |
| Cu (20%)/CeO2 [This work] | CP | 121 | 300 | 1 | 26,500 | 280 | 100 | 75.7 |
| Ni (10%)/CeO2 [This work] | FSP | 9 | 300 | 1 | 27,900 | 300 | 100 | 62.5 |
Disclaimer/Publisher’s Note: The statements, opinions and data contained in all publications are solely those of the individual author(s) and contributor(s) and not of MDPI and/or the editor(s). MDPI and/or the editor(s) disclaim responsibility for any injury to people or property resulting from any ideas, methods, instructions or products referred to in the content. |
© 2024 by the authors. Licensee MDPI, Basel, Switzerland. This article is an open access article distributed under the terms and conditions of the Creative Commons Attribution (CC BY) license (https://creativecommons.org/licenses/by/4.0/).
Share and Cite
Tommasi, M.; Ceriotti, D.; Gramegna, A.; Degerli, S.N.; Ramis, G.; Rossetti, I. Oxidative Steam Reforming of Methanol over Cu-Based Catalysts. Catalysts 2024, 14, 759. https://doi.org/10.3390/catal14110759
Tommasi M, Ceriotti D, Gramegna A, Degerli SN, Ramis G, Rossetti I. Oxidative Steam Reforming of Methanol over Cu-Based Catalysts. Catalysts. 2024; 14(11):759. https://doi.org/10.3390/catal14110759
Chicago/Turabian StyleTommasi, Matteo, Davide Ceriotti, Alice Gramegna, Simge Naz Degerli, Gianguido Ramis, and Ilenia Rossetti. 2024. "Oxidative Steam Reforming of Methanol over Cu-Based Catalysts" Catalysts 14, no. 11: 759. https://doi.org/10.3390/catal14110759
APA StyleTommasi, M., Ceriotti, D., Gramegna, A., Degerli, S. N., Ramis, G., & Rossetti, I. (2024). Oxidative Steam Reforming of Methanol over Cu-Based Catalysts. Catalysts, 14(11), 759. https://doi.org/10.3390/catal14110759