Article

The Effect of Precursor Concentration on the Crystallite Size of CeO2 to Enhance the Sulfur Resistance of Pt/CeO2 for Water Gas Shift

1
Department of Environmental and Energy Engineering, Yonsei University, 1 Yonseidae-gil, Wonju 26493, Republic of Korea
2
Department of Chemical Engineering, Keimyung University, 1095 Dalgubeol-daero, Dalseo-gu, Daegu 42601, Republic of Korea
*
Authors to whom correspondence should be addressed.
Catalysts 2024, 14(2), 99; https://doi.org/10.3390/catal14020099
Submission received: 29 December 2023 / Revised: 19 January 2024 / Accepted: 22 January 2024 / Published: 25 January 2024
(This article belongs to the Section Industrial Catalysis)

Abstract

:
To develop customized sulfur–resistant catalysts for the water gas shift (WGS) reaction in the waste–to–hydrogen process, the effects of changing the nucleation conditions of the CeO2 support on catalytic performance were investigated. Supersaturation is a critical kinetic parameter for nuclei formation. The degree of supersaturation of the CeO2 precipitation solution was controlled by varying the cerium precursor concentration from 0.02 to 0.20 M. Next, 2 wt.% of Pt was impregnated on those various CeO2 supports by the incipient wetness impregnation method. The prepared samples were then evaluated in a WGS reaction using waste–derived synthesis gas containing 500 ppm H2S. The Pt catalyst supported by CeO2 prepared at the highest precursor concentration of 0.20 M exhibited the best sulfur resistance and catalytic activity regeneration. The sulfur tolerance of the catalyst demonstrated a close correlation with its oxygen storage capacity and easier reducibility. The formation of oxygen vacancies in CeO2 supports is promoted by the formation of small crystals due to a high degree of supersaturation.

Graphical Abstract

1. Introduction

Waste generation and energy demand are increasing due to rapid technological advancements, urbanization, and global population growth [1,2]. Reports indicate that the annual growth rate of municipal solid waste (MSW) is 3.2–4.5% in developed countries and 2–3% in developing countries [2]. Notably, the recent global spread of COVID-19 has led to a substantial increase in the use of disposable products such as masks and gloves, further contributing to the increase in MSW generation [1,2]. Consequently, waste management has emerged as a paramount challenge in establishing a sustainable future society worldwide [3,4]. Traditionally, waste has primarily been managed through landfilling and incineration because of the simplicity and cost–effectiveness of these processes [2,4,5]. However, considering the socioeconomic impact of waste management, thermal technologies are gaining prominence as alternative processes, offering considerable potential for volume reduction and energy recovery [4,5]. Energy demand has so far been met by fossil fuels, but this has the problem of causing energy depletion and increased greenhouse gas emissions [5]. Hydrogen is garnering attention as a clean energy source with substantial potential to replace fossil fuels as a versatile industrial resource based on carbon-neutral production and sustainability [5,6,7]. Hydrogen can be produced from various feedstocks, and waste–to–hydrogen holds promise in addressing several challenges, including achieving “carbon-zero emissions” from feedstocks, promoting sustainable waste management, and facilitating clean fuel production [5,6,8]. Among the waste-to-energy thermal technologies, the gasification process is the most promising method for using waste as a feedstock [4,5,8]. In addition, the water–gas shift (WGS) reaction (CO + H2O ↔ H2 + CO2, ∆H = −41.2 kJ/mol) plays a pivotal role in various chemical and energy–related processes involving hydrogen usage or production, such as ammonia synthesis, hydrogenation reactions, and hydrogen fuel cells [1,6]. However, the synthesis gas generated during the waste gasification process contains a higher concentration of CO (~38 vol%) than the conventional natural gas reformed synthesis gas (~10 vol%) used in the WGS reaction [1]. In addition, MSW contains various impurities, with waste–derived synthesis gas being known to contain less than 0.1% sulfur, which can act as a catalyst poison [9]. Therefore, the primary consideration for operating the WGS process in the waste–to–hydrogen process is the development of a novel WGS catalyst that considers the characteristics of waste–derived synthesis gas, such as high CO concentrations and sulfur poisoning.
Our research team previously developed a Pt catalyst supported on CeO2 with sulfur tolerance for the WGS reaction using waste–derived synthesis gas [10,11,12,13,14,15]. The support plays a crucial role in determining the activity of the metal catalyst because it affects the electronic state of the active metal through the interaction between the active metal and the support. CeO2 is recognized as an attractive support because it can improve the reaction rate related to the redox mechanism in the WGS reaction due to its inherent oxygen release/uptake ability [7,16]. The quantity of this property by the Ce3+/Ce4+ redox couple, which can be reversibly converted in the fluorite structure of CeO2, is called the oxygen storage capacity (OSC). In our previous studies, we confirmed that the oxygen reverse spillover caused by the interaction between the active metal Pt and the CeO2 support and the excellent OSC of the CeO2 support positively influenced the catalyst activity and sulfur tolerance in the WGS reaction [11,12,13,14,15]. It is noteworthy that various preparation parameters, such as reaction temperature, reaction time, precursor concentration, solvent, and pH, can be used to modify the characteristics of nanomaterials, including OSC, active metal dispersion, and redox properties. Kim et al. strengthened the metal-support interaction and high oxygen vacancies in Pt-based catalysts by controlling the titration method and titration rate during the precipitation of CeO2 support [14]. Ouyang et al. demonstrated that the exposed facets of nanocrystals could be tuned by controlling the saturation degree of the solute in the crystal growth solution using α–Fe2O3 [17]. The various precipitants were applied to induce textural properties and thermal stability in nanostructured CeO2–ZrO2–based materials during the catalyst synthesis process by Deng et al. [18]. Ramachandran confirmed that the crystallite size could be controlled by changing the pH when preparing CeO2 nanoparticles using the precipitation method [19].
In classical nucleation theory, the formation of crystals involves two processes: nucleation and growth [20,21]. The control of nucleation and growth rates can determine the morphology of nanocrystals. In this study, the precursor concentration of the CeO2 support was changed as one method to control the formation of nuclei. And then, the effect of the synthesis concentration parameter on the catalytic activity and sulfur resistance of the Pt/CeO2 catalyst in the WGS reaction was investigated. The CeO2 supports synthesized at various cerium precursor concentrations (0.02, 0.05, 0.10, and 0.20 M) were labeled as follows: Ce–0.02 M, Ce–0.05 M, Ce–0.10 M, and Ce–0.20 M, respectively. The impregnated Pt catalysts were designated as PtCe (PtCe–0.02 M, PtCe–0.05 M, PtCe–0.10 M, and PtCe–0.20 M).

2. Results

2.1. Catalytic Activity

CeO2 supports synthesized at various cerium precursor concentrations were impregnated with 2 wt.% of Pt and then subjected to a WGS reaction using waste–derived synthesis gas to assess the performance of the catalyst. The catalytic performance of the catalysts was evaluated at three key stages: initial activity (~1.5 h), activity after the injection of 500 ppm H2S (~13 h), and activity after ceasing H2S injection (~18 h). Figure 1A illustrates the CO conversion over time for the prepared catalysts. Notably, all catalysts exhibited 100% CO2 selectivity during the reaction (Figure 1B), indicating the absence of methanation (CO + 3H2 → CH4 + H2O), a significant side reaction of the WGS process.
Figure 1C presents the CO conversion at each key stage (0, 13, and 18 h) to facilitate a comparison of the catalytic reaction results based on Figure 1A. The detailed outlet gas compositions are shown in Table S1. At first, all catalysts demonstrated similar catalytic activities, with CO conversions ranging from 92% to 95%. However, the differences became evident after H2S injection. The PtCe–0.02 M catalyst exhibited the steepest deactivation due to sulfur poisoning, and the CO conversion decreased by 35.8%. The PtCe–0.05 M catalyst showed better resistance to sulfur poisoning than the PtCe–0.02 M catalyst but still exhibited a nearly 30% reduction in CO conversion. In contrast, the CO conversion of the PtCe–0.10 M and PtCe–0.20 M catalysts decreased to less than 15%, indicating relatively high sulfur resistance. Notably, the PtCe–0.20 M catalyst exhibited the highest initial activity and maintained a CO conversion of over 80% even after sulfur poisoning, indicating excellent catalytic performance. Furthermore, while the PtCe–0.02 M and PtCe–0.05 M catalysts did not fully recover their catalytic activity, the PtCe–0.10 M and PtCe–0.20 M catalysts almost completely recovered their catalytic activity. Intriguingly, the catalyst synthesized with a high precursor concentration during the preparation of the CeO2 support exhibited enhanced sulfur resistance and regeneration rate.

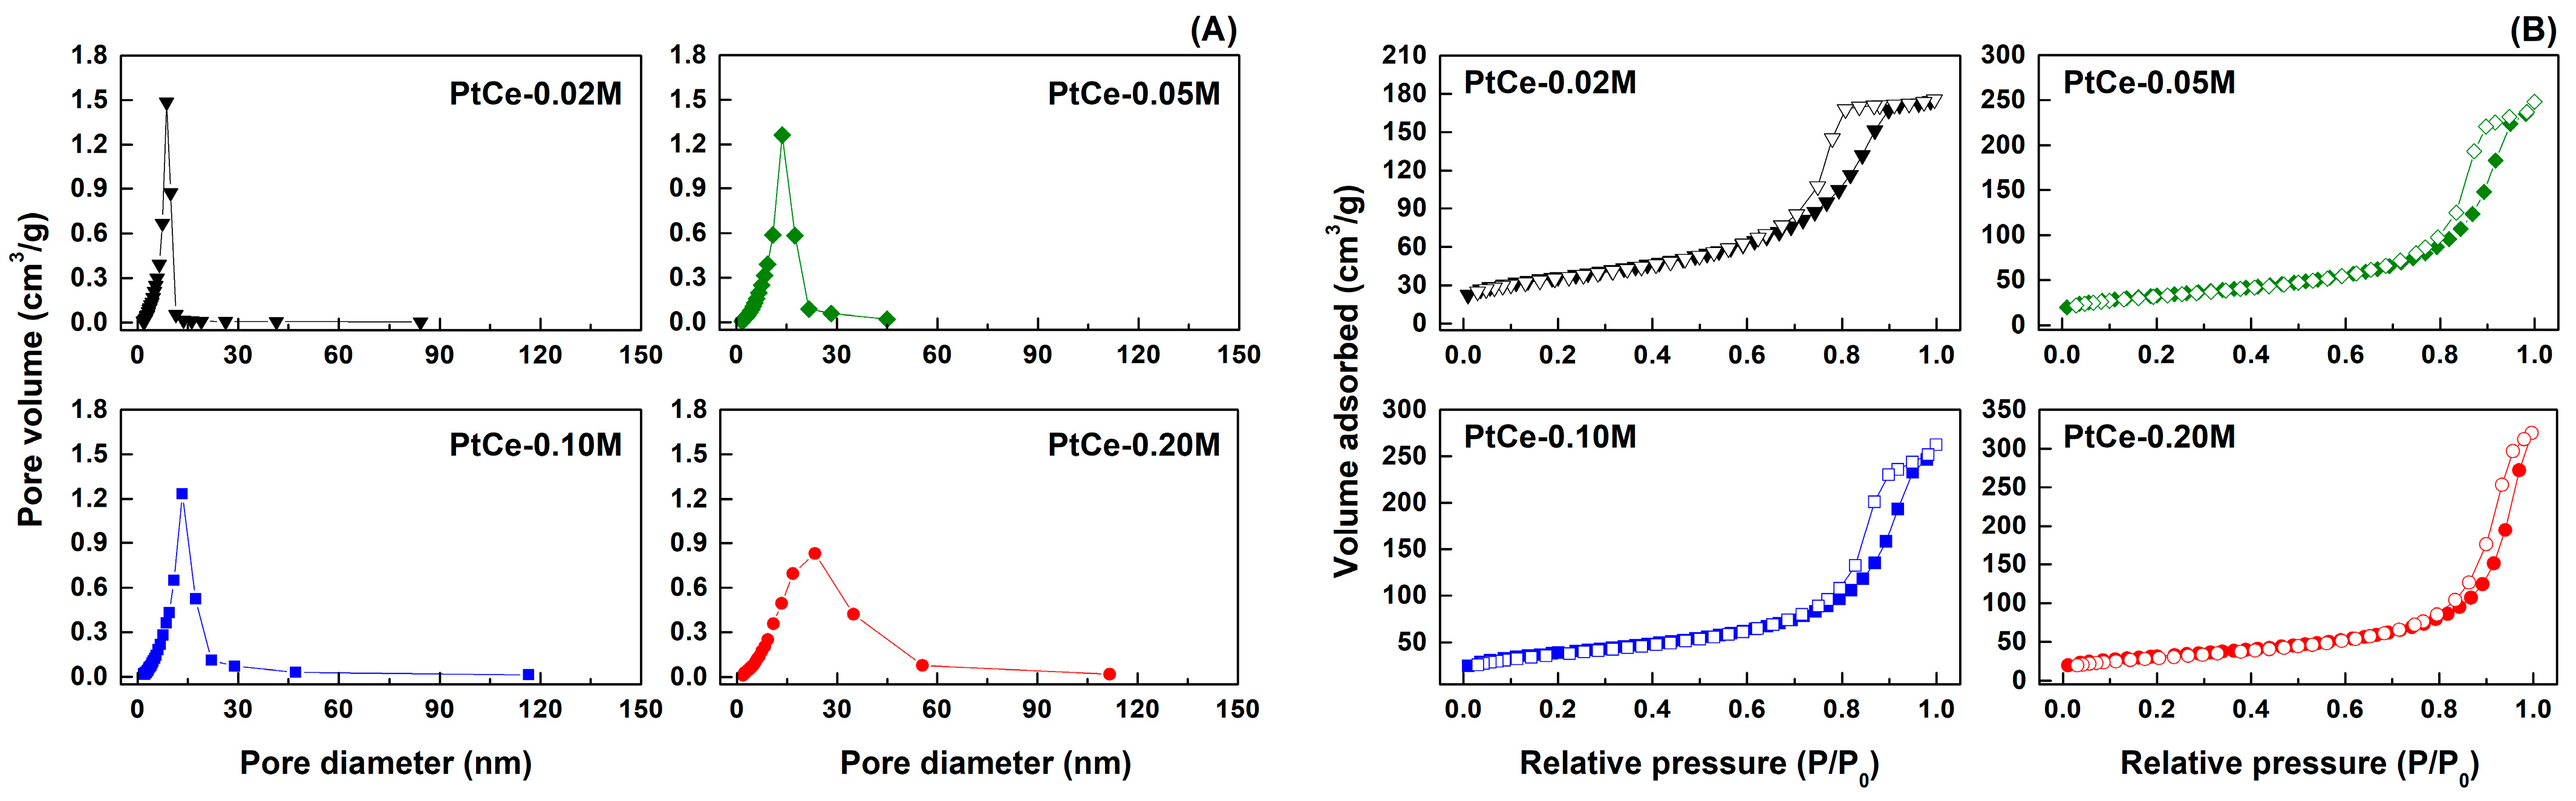
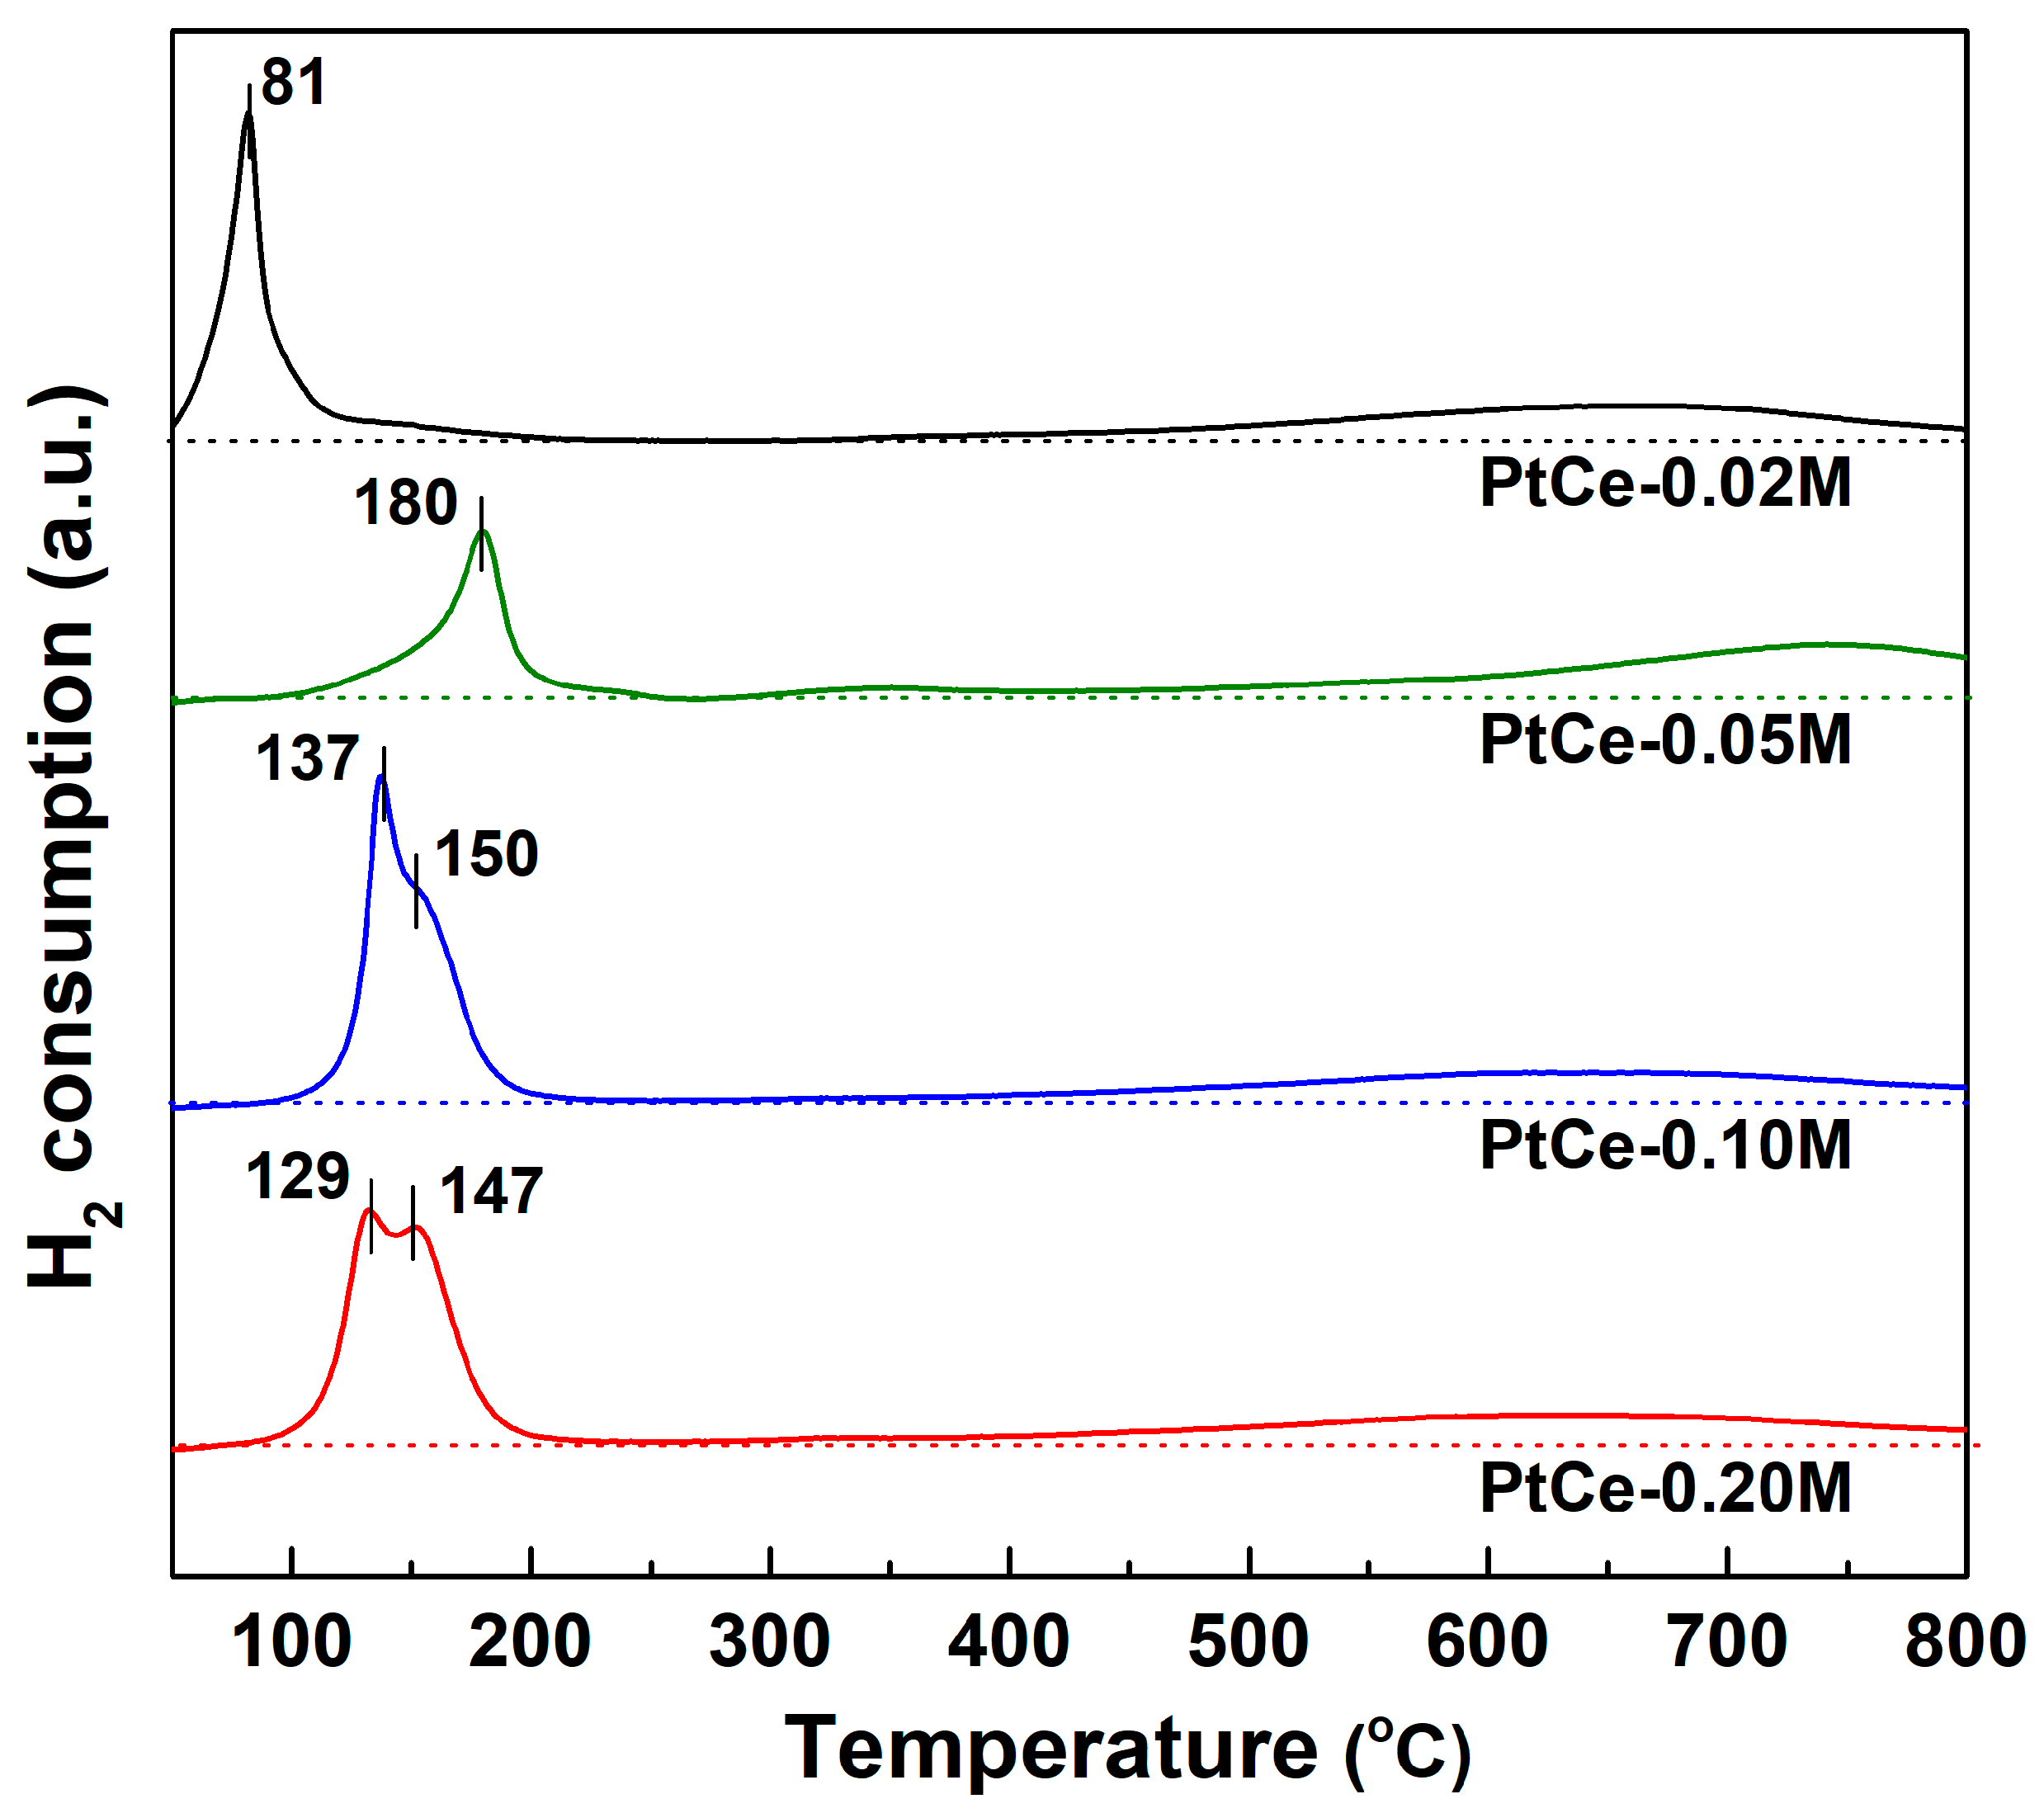
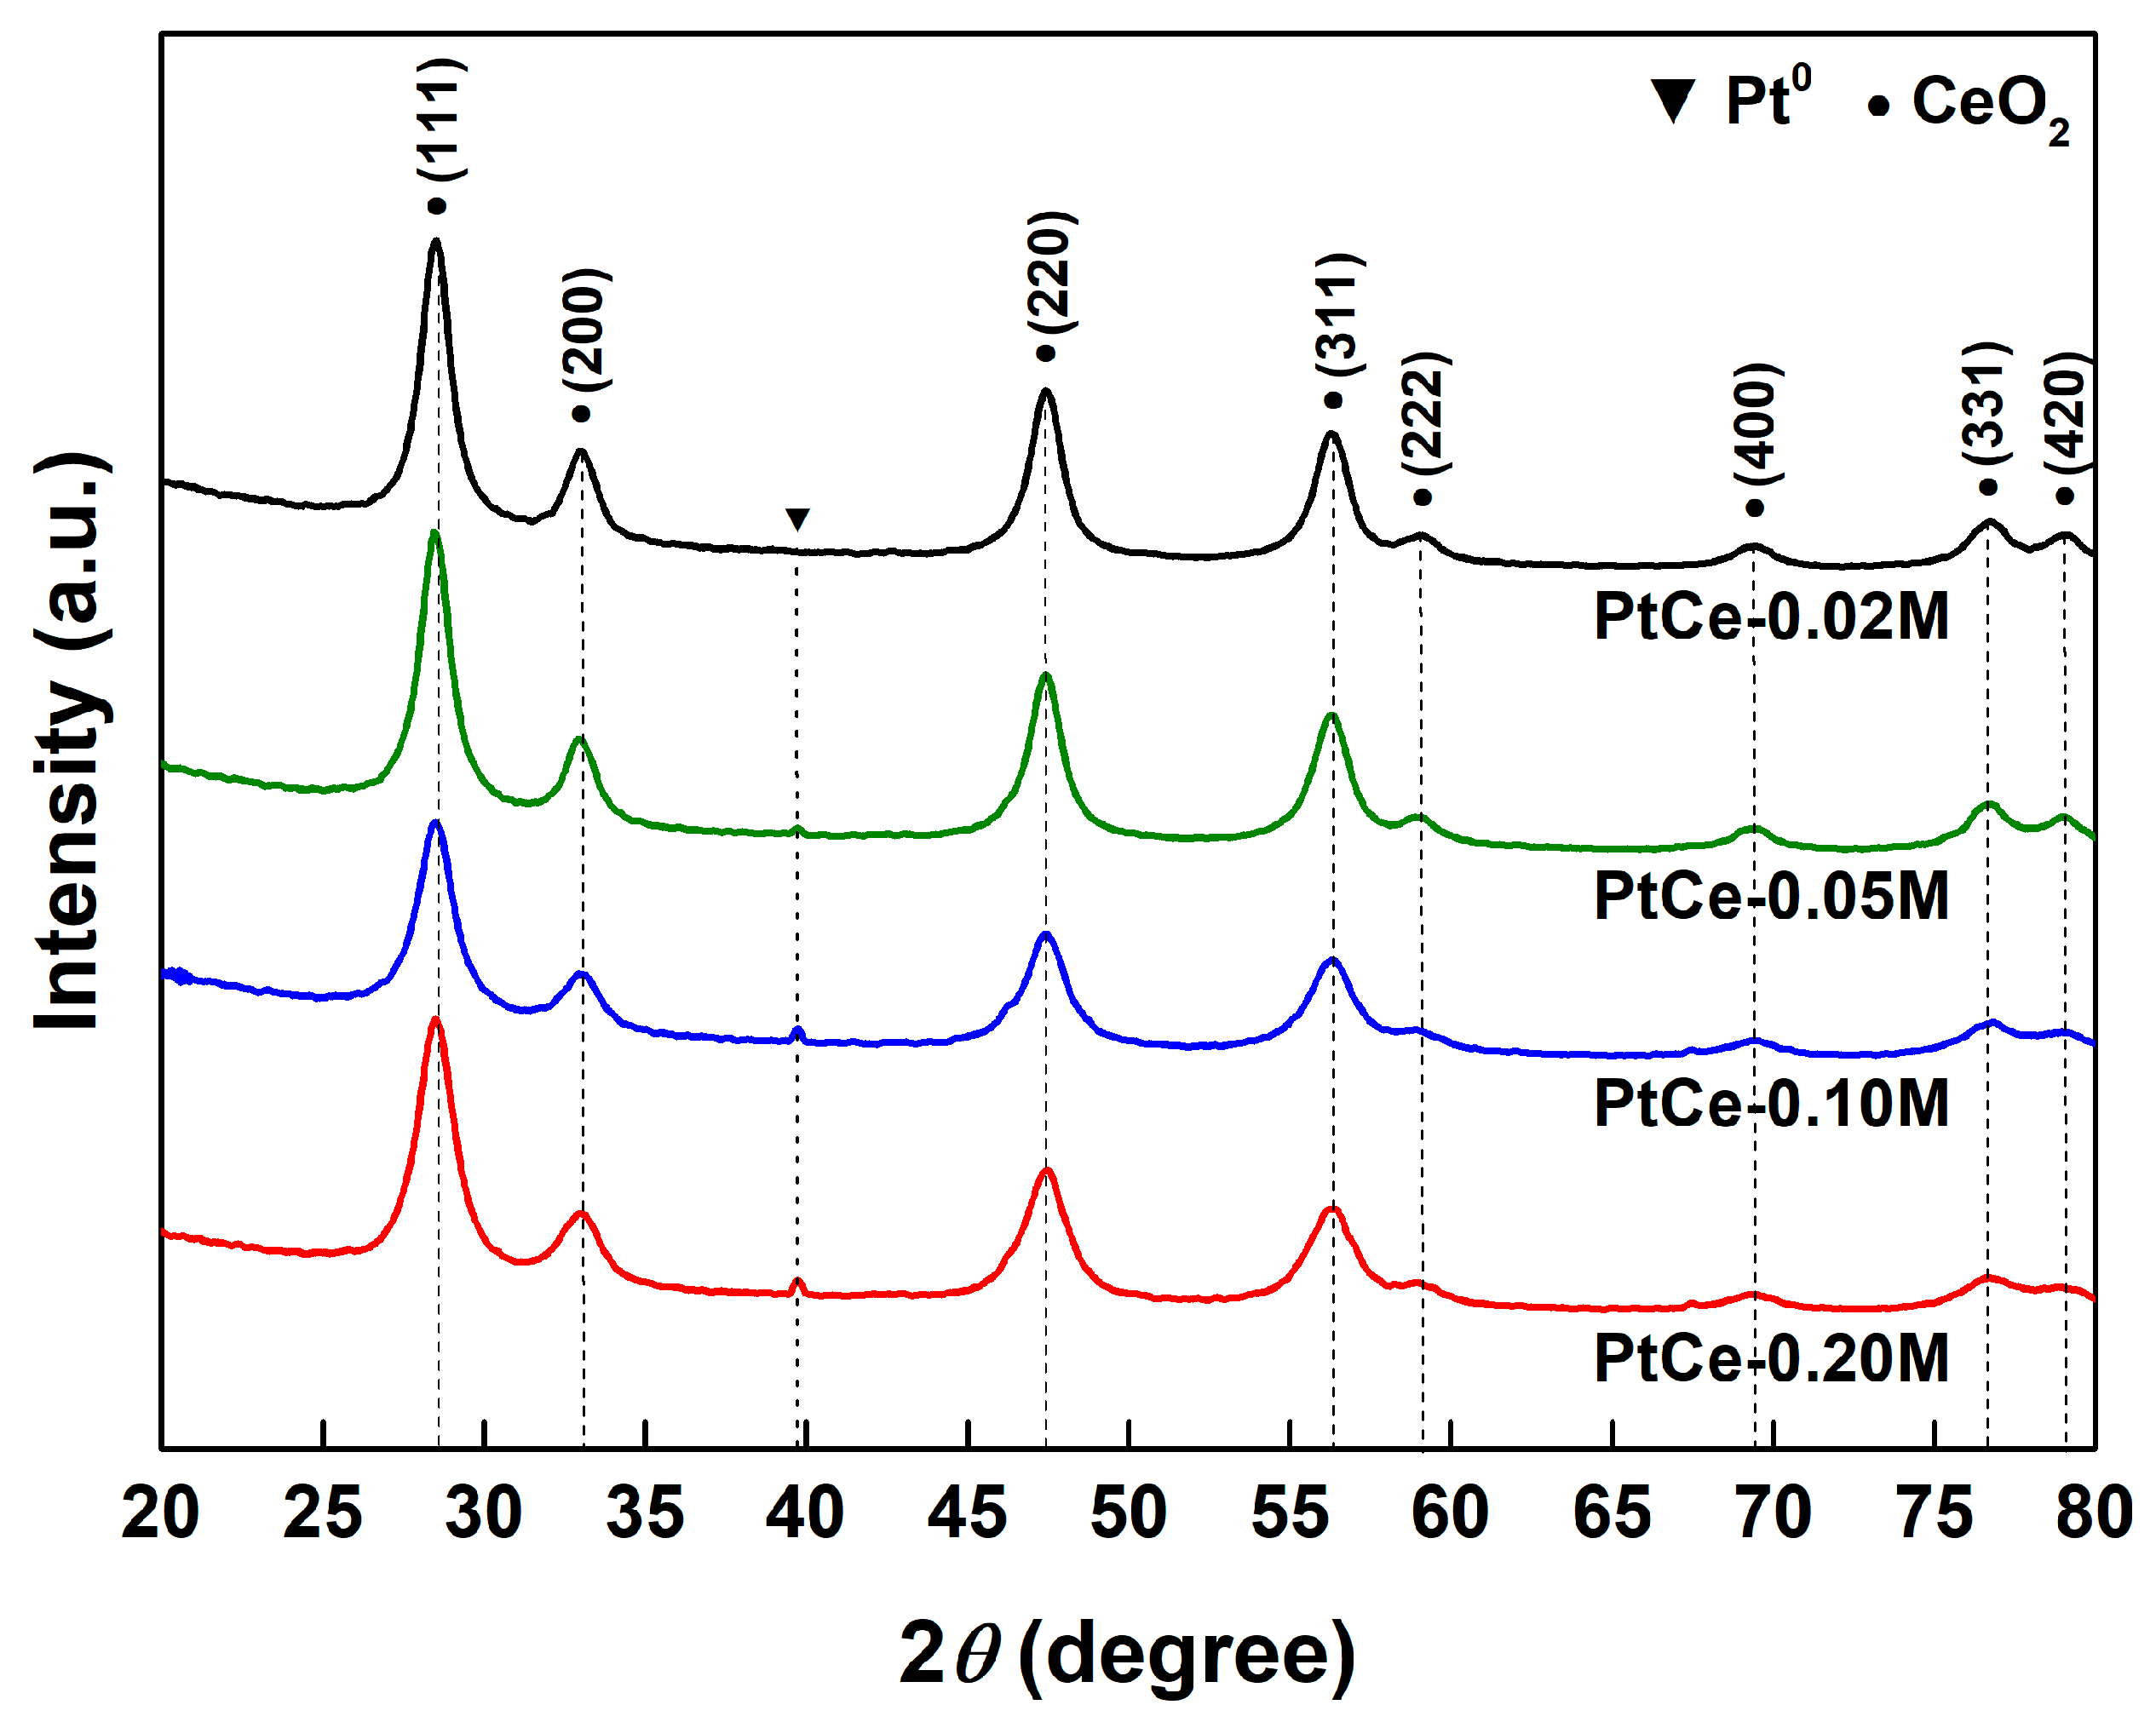
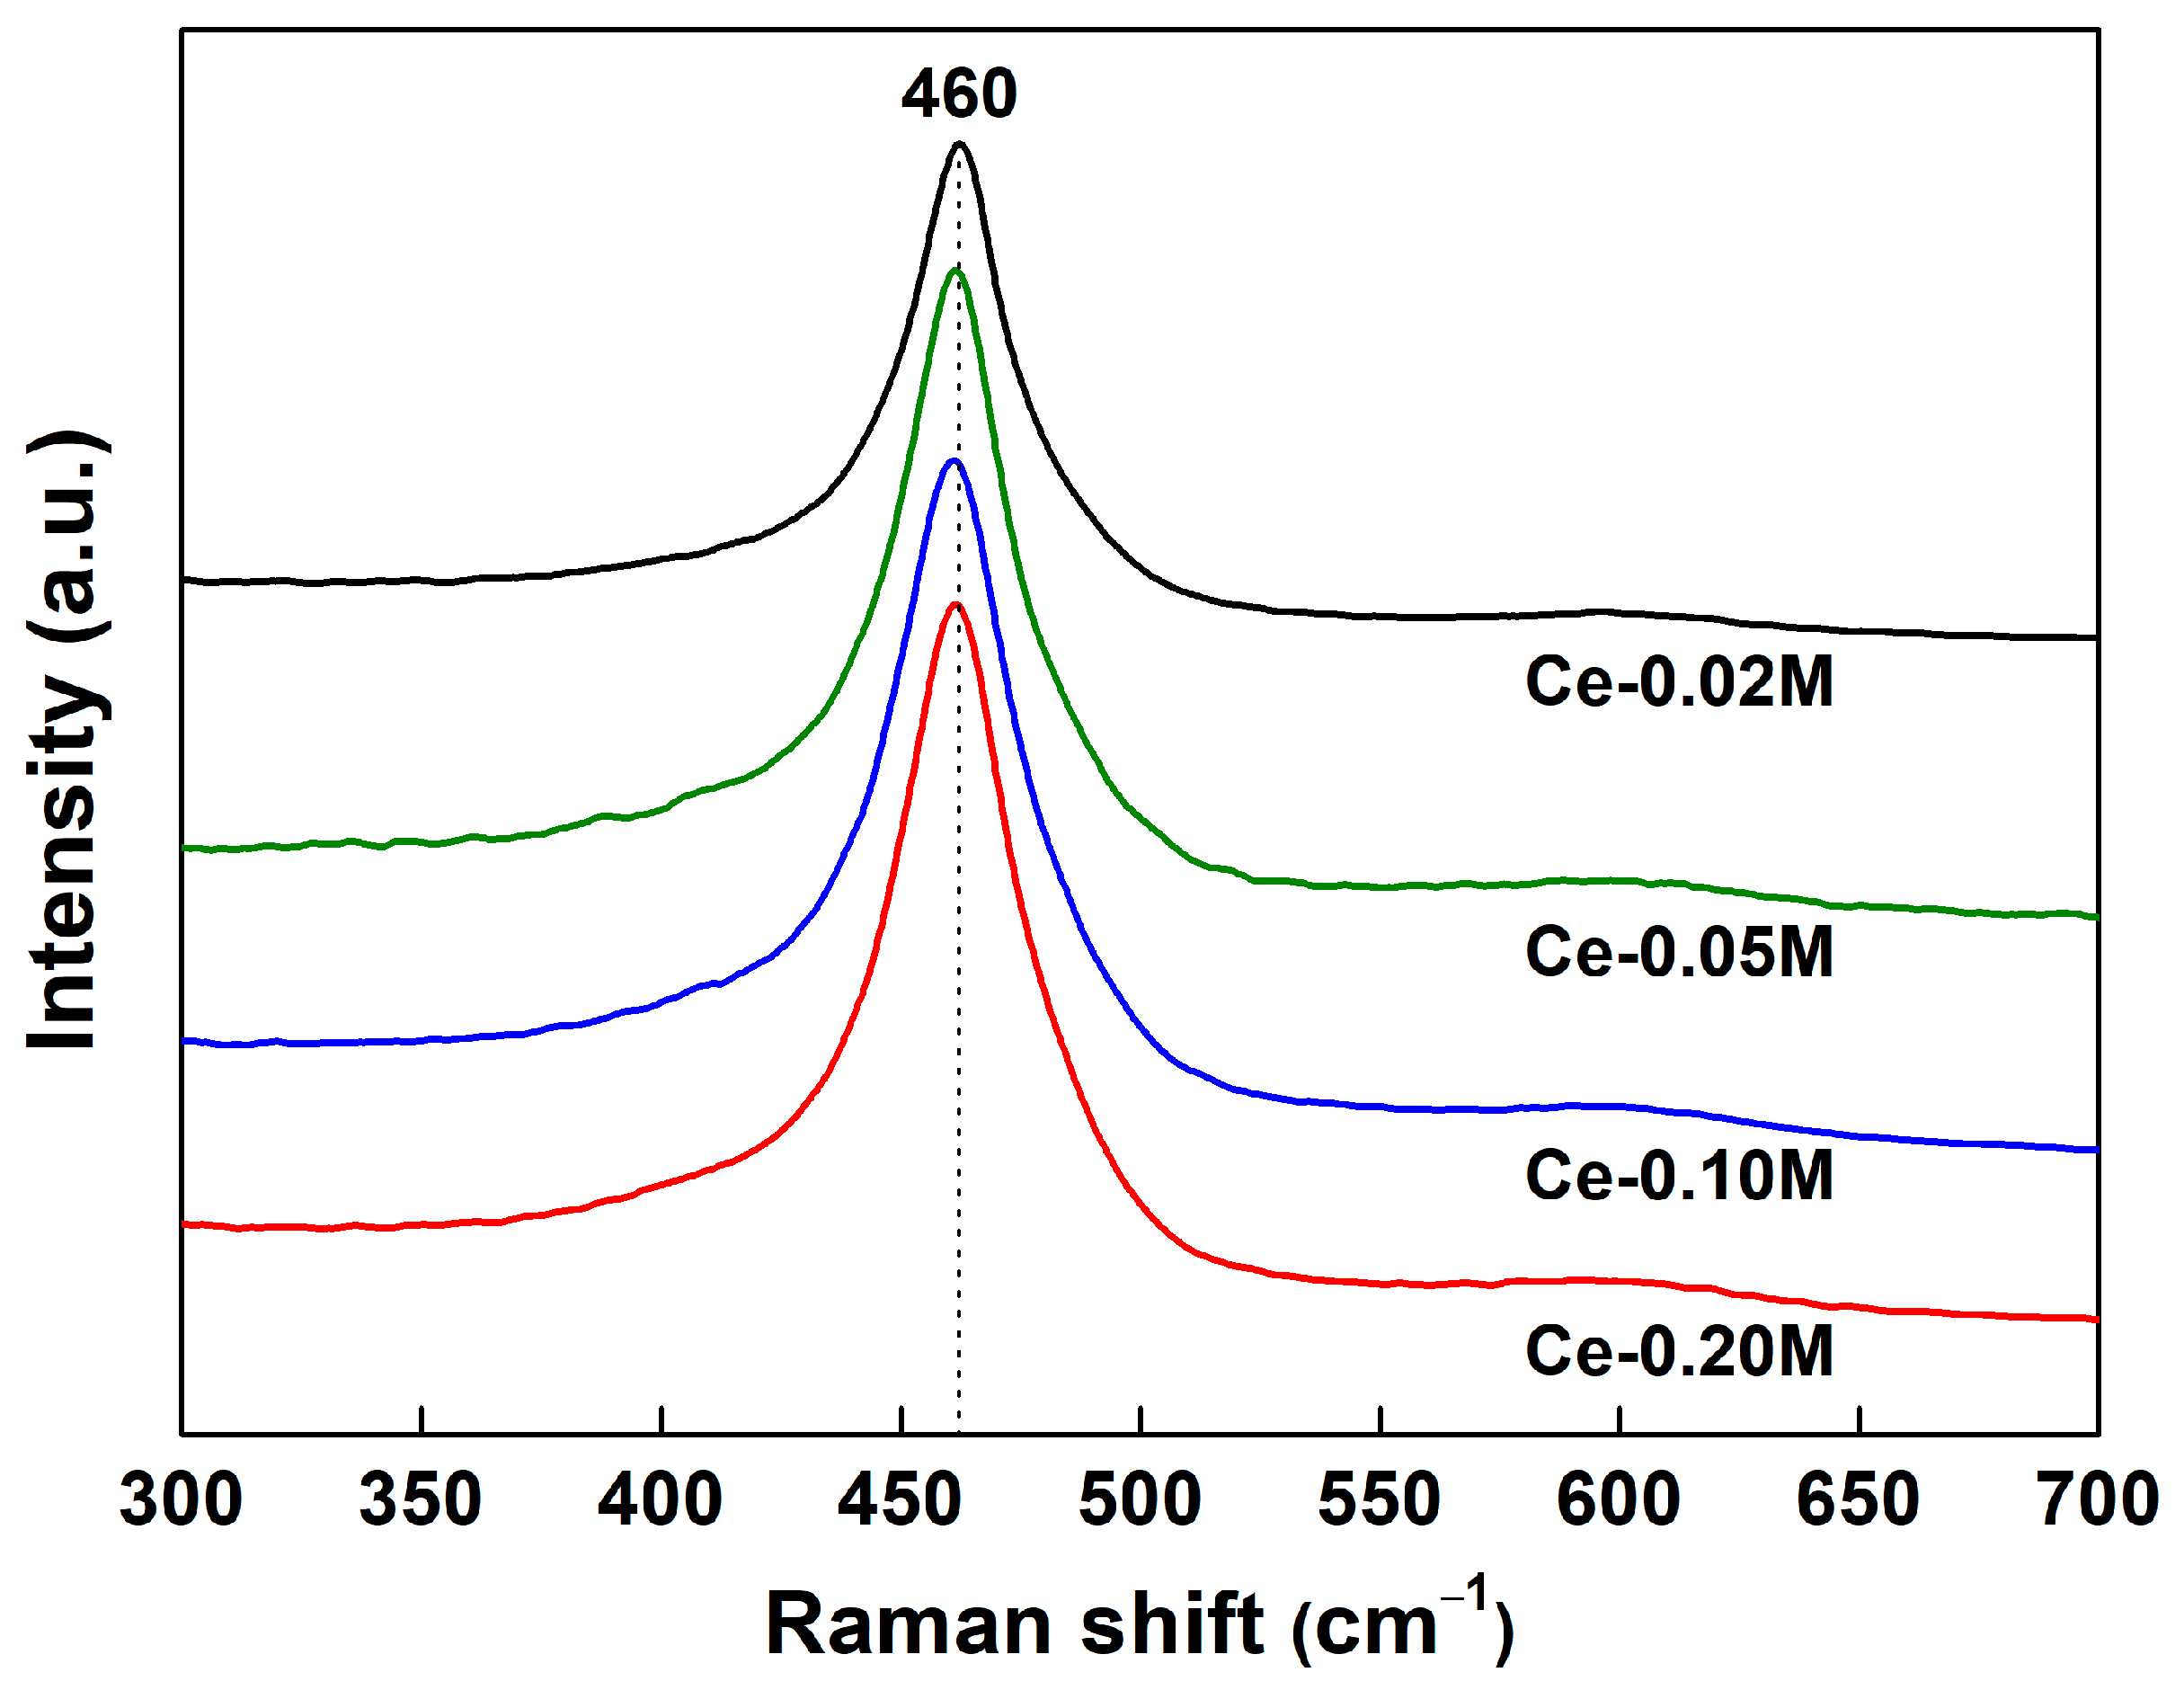
2.2. Catalyst Characterization Results

Table 1 presents the physicochemical properties of Pt catalysts supported on CeO2 prepared with varying cerium precursor concentrations. All catalysts exhibited a BET surface area ranging from 112 to 138 m2/g. Analysis of the pore size distribution, as shown in Figure 2A, revealed that all catalysts possessed mesopores of ~20 nm in size. The N2 adsorption–desorption isotherm of the prepared catalysts is illustrated in Figure 2B. In accordance with the IUPAC classification, all samples exhibited type IV isotherms with hysteresis loops, indicating mesoporous capillary condensation [22,23,24]. The PtCe–0.02 M catalyst displayed an H1 hysteresis, suggesting the presence of cylindrical pores of uniform size and shape [22,24]. PtCe–0.05 M, PtCe–0.10 M, and PtCe–0.20 M catalysts exhibited an H2 hysteresis loop, typically associated with powders composed of particles crossed by nearly cylindrical channels, aggregates (consolidated), or agglomerates (unconsolidated) of spherical particles [23,24].
To avoid overestimation of active metal dispersion through the CO pulse chemisorption method due to the CO–spillover phenomenon, the dispersion of active metals (Table 1) was measured using a modified CO pulse chemisorption method, as reported by Takeguchi et al. [25,26]. When dealing with noble metal catalysts supported on CeO2, accurately determining the metal dispersion can be challenging because CO can adsorb on the support itself. Specifically, in the case of Pt and CeO2–based catalysts, it is well established that the surface redox properties of the CeO2 support are enhanced due to the metal–support interaction [27]. The modified CO pulse chemisorption method leverages the fact that CO2 adsorbs more strongly than CO on the CeO2 surface [26]. Therefore, a CO2 pretreatment is conducted before CO pulse adsorption. During the CO2 pretreatment, CO2 is adsorbed on the CeO2 support surface, which allows subsequent selective adsorption of CO onto Pt. As a result of this analysis, it can be observed that the estimated Pt0 dispersion for all catalysts is uniformly distributed within the range of 59.0–62.5%.
The WGS reaction proceeds through a redox mechanism at high temperatures [28,29]. Therefore, the redox properties of a catalyst are known to be key properties that affect the performance of the catalyst [28,29,30]. The reduction behavior of the catalyst was evaluated using H2–temperature programmed reduction (H2–TPR), as shown in Figure 3. The observed peaks during the reduction process can be categorized into two groups: reduction peaks at temperatures below 200 °C and those at high temperatures exceeding 600 °C [27,31,32]. At temperatures below 200 °C, one or two peaks were observed for each catalyst. This low–temperature peak involves the reduction of oxidized Pt species, O species interacting between Pt nanoparticles and CeO2, and O species present on the CeO2 surface. In detail, the first low-temperature reduction peak includes not only the reduction of PtOx but also the partial reduction of O species on the surface of CeO2 [31]. The second low–temperature reduction peak is attributed to the reduction of Pt–O–Ce species, formed by the interaction between Pt and CeO2 [31]. And the peak observed at temperatures exceeding 600 °C arises from the reduction of bulk CeO2 [32]. The outstanding OSC of Pt–based catalysts supported by reducible oxides such as CeO2 is due to the high redox properties of the catalysts [30,33,34]. It has been reported in several studies that the partial reduction of CeO2 support at low temperatures is attributed to oxygen reverse spillover from CeO2 induced by Pt doping [34,35]. This oxygen reverse spillover leads to the creation of oxygen vacancies through the reversed migration of oxygen at the Pt–CeO2 interface, thereby enhancing the redox properties of the CeO2–supported Pt catalyst. The enhanced reducibility of the catalyst enables more efficient transportation of oxygen species throughout the redox cycle. In our previous study, we observed that the improved OSC resulting from enhanced reducibility not only accelerates the WGS reaction but also facilitates the desorption of sulfur that has been absorbed into active metals [10,13]. Except for the PtCe–0.02 M catalyst, Pt catalysts supported on CeO2, synthesized with high cerium precursor concentrations, showed reduction peaks at low temperatures.
The influence of precursor concentration on the crystal structure of the catalyst during precipitation was examined using X-ray diffraction (XRD) analysis. The XRD patterns of all prepared catalysts, as shown in Figure 4, have been assigned to the fluorite cubic structure of cerium oxide in accordance with the standard JCPDS card (No. 34–0394) [33,36]. Furthermore, a weak Pt (111) diffraction peak was observed at a 2θ of 39.8° (JCPDS No. 04–0802) [37]. The crystallite sizes of CeO2 for each sample were calculated from the (111) diffraction peaks using Scherrer’s equation and are provided in Table 1. The PtCe–0.20 M (5.56 nm) and PtCe–0.10 M (5.60 nm) catalysts, prepared with high cerium precursor concentrations, exhibited smaller sizes than the PtCe–0.05 M (6.51 nm) and PtCe–0.02 M (7.27 nm) catalysts. The lattice parameters of the prepared catalysts are also listed in Table 1. The lattice parameters of catalysts ranged from 5.420 to 5.423 Å, as determined from (111) diffraction peaks. These variations in the lattice parameter can be attributed to lattice distortion caused by changes in ionic radius (Ce4+ = 0.97 Å, Ce3+ = 1.28 Å, Pt4+ = 0.63 Å, Pt2+ = 0.80 Å) induced by Pt doping or the presence of oxygen defects in CeO2 [38]. The calculated lattice parameters of all catalysts were expanded compared with the typical lattice parameter value of 5.411 Å for CeO2 [39]. The increase in lattice parameters can be attributed to the lattice distortion of the catalytic structure due to the larger ionic radius of Ce3+ compared with that of Ce4+, indicating oxygen defects due to lattice distortion [40]. According to the Williamson–Hall approach, the diffraction line broadening is due to the contribution of crystallite size and strain [41]. The lattice strain–induced broadening in the samples, attributed to crystal imperfections and distortion, has been calculated and is presented in Table 1. Positive values of strain are related to tensile strain, and it should be recognized that tensile strain exists on the surface of nanomaterials [40]. Tensile strain results in a reduced bandwidth of the O 2p orbitals and decreased overlap between the O 2p and Ce 5d as well as the Ce 4f orbitals, weakening the Ce–O bond and leading to the formation of oxygen vacancies [40,42]. In summary, it is evident that changes in cerium precursor concentration have a noticeable impact on both the crystallite size and lattice distortion of CeO2.
The surface chemical states of Pt catalysts supported on CeO2 prepared with various cerium precursor concentrations were investigated using X-ray photoelectron spectroscopy (XPS) analysis. The Ce 3d and O 1s spectra of the catalysts were fitted by Lorentzian–Gaussian and are presented in Figure 5, with corresponding details listed in Table 2. In general, the Ce 3d spectrum can be deconvoluted into 10 peaks corresponding to five pairs of spin–orbit doublets that describe the Ce4+ ↔ Ce3+ electronic transitions (Figure 5A) [33]. The 3d5/2 and 3d3/2 spin–orbit components of Ce are designated as v and u, respectively. Among these peaks, v, v″, v‴, u, u″, and u‴ primarily correspond to Ce4+ species, while v0, v′, u0, and u′ arise from Ce3+ species [33,43]. Ce3+ species are formed due to the loss of oxygen atoms from the lattice, resulting from the reduction of CeO2. In other words, the presence of Ce3+ species serves as an indicator of mobile oxygen and oxygen vacancies within the catalyst. The relative proportions of Ce3+ species in the prepared catalysts were determined using Equation (1) and are summarized in Table 2.
Ce 3 +   ( % ) = { ( A v o + A v + A u o + A u ) / A i } × 100
where A i is the total area of the original XPS Ce 3d spectrum before deconvolution. The percentage of Ce3+ on the catalyst surface followed the trend: PtCe–0.20 M (38.6%) > PtCe–0.10 M (37.8%) > PtCe–0.05 M (35.9%) > PtCe–0.02 M (32.3%).
To gain deeper insights into the oxygen release/uptake behavior of the catalyst, the O 1s peak was deconvoluted (Figure 5B). The O 1s spectrum of the catalyst was resolved into three peaks centered at 529.4, 530, and 531.5 eV, corresponding to oxygen in the CeO2 lattice (OL), defective oxygen (OD), and surface–adsorbed oxygen (OA) [44]. The concentration of oxygen vacancies within the catalyst was inferred from the OD peak and is shown in Table 2. As a result, there is a consistent correlation between the trends in oxygen vacancy (OD) and Ce3+ concentration across all the prepared samples. Furthermore, it is evident that as the precursor concentration of the catalyst increases, so does the oxygen defect within the catalyst. Among the catalysts, the PtCe–0.20 M catalyst exhibited the highest values for both OD and Ce3+ concentrations, indicating excellent redox properties.
The results of the Raman spectrum, conducted to elucidate changes induced by defects in the local structure of CeO2 nanoparticles, are presented in Figure 6 [40]. All catalysts exhibited a peak related to the triply degenerate F2g mode of the CeO2 cubic fluorite crystal structure at ~460 cm−1 [16,40]. This mode represents a symmetrical stretching mode of eight oxygen atoms around a Ce4+ ion (O–Ce–O) and is highly sensitive to oxygen vibrations near the Ce ion [40,45]. This peak indicates changes in the Ce ion or oxygen lattice state due to nonstoichiometric disturbances arising from factors such as temperature, doping, or grain size [40]. It has been reported that oxygen vacancies form within CeO2 lattices when the average particle size is decreased to dimensions of the order of nanosize [40,46]. The oxygen vacancy concentration can be determined using the spatial correlation model based on the relationship between correlation length and grain size [16]. The calculated oxygen vacancy concentrations are listed in Table 2. Notably, the oxygen vacancy concentration followed the same trend as the quantity of surface defect oxygen (OD). Considering the XRD results, this consistency corroborates reports that the release of oxygen from the crystal surface becomes more facile as the crystallite size decreases [42,45].

3. Discussion

The redox mechanism that characterizes the WGS reaction is performed by repeating the following process: The reactant CO is adsorbed at the metal–support interface of the catalyst, subsequently receiving mobile oxygen from the adsorbed active metal and desorbed into CO2 [16,21]. The interaction between mobile oxygen and CO results in the formation of oxygen vacancies. These oxygen vacancies are then filled with oxygen generated from H2O dissociation. [16]. Consequently, a catalyst with a higher OSC facilitates the acceleration of the redox mechanism governing the WGS reaction [16,36]. Furthermore, previous studies have identified OSC as a key factor in the sulfur resistance of catalysts in the WGS reaction [11,13,14,15]. Specifically, sulfur adsorbed on the active metal of the Pt/CeO2 catalyst can react with mobile oxygen derived from the CeO2 support and subsequently be desorbed in the form of SO2 [11]. This is similar to the desorption of CO to CO2 within the redox mechanism of the WGS reaction.
The precipitation method is a traditional catalyst preparation technique known for producing nanoparticles with a narrow particle size distribution [47]. The characteristics of the resulting nanoparticles are primarily determined by a two–step precipitation kinetics process, which involves the primary process (nucleation and growth) and the secondary process (agglomeration, attrition, transformation, and ripening) [21]. Among these steps, primary nucleation, which is responsible for initiating the formation of new crystals, exerts a dominant influence on the properties of the final product [21]. The occurrence of the nucleation step depends on both the thermodynamic and kinetic parameters of the system. Kinetically, nanoparticles spontaneously nucleate under reactant supersaturation. Supersaturation serves as the driving force behind crystallization and can vary depending on factors such as supply concentration and flow rate [17,47,48]. When preparing the CeO2 support, the degree of supersaturation of the reactant was varied by adjusting the cerium precursor concentration.
Figure 7 summarizes the physicochemical properties and catalytic performance of Pt catalysts supported on CeO2 prepared at various cerium precursor concentrations. The results showed a significant correlation between the physicochemical properties of the catalyst and its performance. The XRD analysis results exhibited that as the precursor concentration increased, the crystallite size became smaller, and the lattice strain increased. According to the Gibbs–Thomson equation, the higher supersaturation would result in smaller crystallites during the nucleation process, which would gain a larger total surface energy [17,48]. In CeO2 nanoparticles, an increase in lattice strain may indicate oxygen vacancies [40,42]. H2–TPR, XPS, and Raman analysis results clearly show the effect of lattice distortion due to changes in crystal size depending on the degree of supersaturation. The lattice distortion-induced oxygen vacancies facilitate the movement of oxygen between the catalyst and reactants, thereby accelerating the WGS reaction and promoting the desorption of adsorbed sulfur [11]. As a result, the PtCe–0.20 M catalyst, prepared with the highest precursor concentration, exhibited the smallest crystallites and appeared to exhibit high catalytic activity and excellent sulfur tolerance due to its enhanced OSC and easier reducibility.

4. Materials and Methods

4.1. Catalyst Synthesis

CeO2 supports were synthesized by the classic precipitation method with varying cerium precursor concentrations (M = 0.02, 0.05, 0.10, and 0.20). Ce(NO3)3·6H2O (99%, Sigma Aldrich, St. Louis, MO, USA) served as the starting material and was used without additional purification. The cerium precursor was dissolved in 500 mL of distilled water at room temperature and then heated to 80 °C. Following this, the cerium aqueous solution was precipitated by injection of stoichiometrically calculated KOH (95%, Samchun Chemicals, Siheung, Republic of Korea) at a constant rate. Detailed procedures and information for the injection of precipitant have been provided in our previous work [14]. After precipitants were injected into each reactor, the pH levels ranged from 10.5 to 11.5. The resulting aqueous mixture underwent a 72 h aging period with continuous stirring at 80 °C. Subsequently, the formed cerium hydroxide precipitate was filtered and washed five times with distilled water. The produced precipitate was dried in the oven at 100 °C for 12 h, followed by calcined in air at 500 °C for 6 h to yield CeO2 powder.
The CeO2–supported Pt catalyst (2 wt.%) was prepared using the incipient wetness impregnation method. The [Pt(NH3)4](NO3)2 (50% Pt basis, Sigma Aldrich, St. Louis, MO, USA) was dissolved in 0.5 mL of distilled water. The mixed solution was impregnated onto the CeO2 support by dropping one or two drops. The obtained material was dried at 100 °C for 12 h and then calcined in an air atmosphere at 500 °C for 6 h.
As the reaction results (Figure 1) point out, it can be observed that higher precursor concentrations show superior catalytic performance. However, above a certain concentration, it was difficult to reproducibly prepare support showing certain physicochemical properties, as the stirring bar did not rotate properly due to excessive Ce(OH)x precipitates. In this study, the experiment was designed considering problems in actual experiments.

4.2. Characterization

The physicochemical properties of the Pt catalysts supported on CeO2 synthesized at various cerium precursor concentrations were investigated using XRD, Brunauer–Emmett–Teller (BET) analysis, CO–chemisorption, H2–TPR, XPS, and Raman spectroscopy. Before analysis (XRD and XPS), the samples were ex situ reduced under the same conditions as catalyst activation during the catalytic reaction (400 °C, 1 h in 5% H2/N2). For detailed procedures and additional information regarding these analyses, please refer to our previous study [10,13]. XRD patterns were acquired utilizing a Rigaku Ultima IV diffractometer operating at 40 kV and 40 mA, employing Cu–Kα radiation within a diffraction angle range of 2θ (20–80°). Debye Scherrer’s formula (Equation (2)) was used to calculate the average nanocrystallite size of Pt/CeO2 catalysts [40].
D = κ λ β c o s θ
where D is the size of the crystallite (nm), κ is the particle shape factor, λ is the X-ray wavelength of Cu Kα radiation, and β is the full width at half maximum of XRD diffraction peaks. The interplanar spacing was evaluated with Bragg’s law (Equation (3)) [49]. The lattice parameters and lattice strain are calculated using Equations (4) and (5), respectively [39,41,49]:
d = n λ 2 s i n θ
a = d · h 2 + k 2 + l 2
ε = β 4 t a n θ
where d denotes the interplanar spacing, a denotes the lattice parameter, h, k, and l denote the miller indices, and θ denotes the Bragg or diffraction angle.
The modified CO pulse chemisorption method includes an additional pretreatment step to prevent the overestimation of CO adsorption and metal dispersion on CeO2 [26]. The measurement of Pt0 dispersion was conducted using an Autochem 2920 instrument (Micromeritics) following these detailed steps: (i) treatment with 10% O2/He for 2 h at 500 °C. (ii) exposure to 10% H2/Ar for 1 h at 400 °C. (iii) sequential flow of He (5 min), 10% O2/He (5 min), 10% CO2/He (10 min), He (20 min), and 10% H2/Ar (5 min). (iv) pulsing of 10% CO/He until the intensity of the peak reaches a constant value.

4.3. Catalytic Reaction

To evaluate catalytic activity in the WGS reaction, the Pt catalysts supported on CeO2 synthesized at various cerium precursor concentrations were tested at 400 °C for 18 h under ambient pressure. During the reaction, 500 ppm of H2S was injected to evaluate the sulfur tolerance of the catalysts. Here, the prepared catalyst was loaded into a quartz tube (4 mm I.D.) and mounted in a fixed–bed flow reactor equipped with a programmable temperature control system. Before the tests, all catalysts were activated in 5% H2/N2 at 400 °C for 1 h. The WGS reaction was performed immediately thereafter. The initial 1.5 h of the WGS reaction were dedicated to assessing the intrinsic activity of each catalyst without sulfur injection. From 1.5 to 13 h, the resistance to sulfur and catalytic activity were evaluated by continuously injecting 500 ppm H2S. After 13 h, the injection of H2S gas was halted for 5 h and the regeneration rate of the prepared catalyst was recorded. The catalytic activity of the WGS reaction using waste–derived synthesis gas was tested with a simulated gas with the following compositions: CO (38.4 vol%), CO2 (21.8 vol%), CH4 (2.3 vol%), H2 (28.6 vol%), and N2 (8.9 vol%). To account for the sulfur compounds present in the waste–derived synthesis gas, the ratio of sulfur content in the total inlet gas was controlled using 1.0% H2S/Ar gas. Steam was injected at a H2O/(CH4 + CO + CO2) ratio of 2.0 using a syringe pump and then converted to steam through a preheater (180 °C). To efficiently assess the performance of the prepared catalyst, a higher gas hourly space velocity (45,498 h−1) was used compared with the commercial WGS reaction condition (∼4000 h−1) [1]. After the WGS reaction, residual sulfur compounds and water vapor in the outlet gas can cause corrosion in the column in micro–GC. To remove sulfur from the exhaust gas, a sulfur trapping apparatus containing an ethylenediaminetetraacetic acid (III) sodium salt (Sigma Aldrich) powder was installed. Afterward, a chiller and a desiccant (Drierite®, WA Hammond Drierite Co., Ltd., Xenia, OH, USA) were used to remove the unreacted water. The compositions of the outlet gas were monitored by a micro gas chromatograph (Micro–GC, Inficon, Bad Ragaz, Switzerland). The CO conversion rate (XCO) was calculated using Equation (6), and the selectivity of CO2 and CH4 was determined using Equations (7) and (8), respectively.
C O   c o n v e r s i o n   r a t e   % = C O i n C O o u t C O i n × 100
C O 2   s e l e c t i v i t y   % = C O 2 o u t C O 2 i n ( C H 4 o u t C H 4 i n ) + ( [ C O 2 ] o u t C O 2 i n ) × 100
C H 4   s e l e c t i v i t y   % = C H 4 o u t C H 4 i n ( C H 4 o u t C H 4 i n ) + ( [ C O 2 ] o u t C O 2 i n ) × 100

5. Conclusions

To enhance the catalytic performance of the Pt/CeO2 catalyst, which is known for its sulfur resistance in the WGS reaction, the degree of supersaturation was changed by varying the cerium precursor concentration (ranging from 0.02 to 0.20 M) during the preparation of the CeO2 support. In the WGS reaction using waste–derived synthesis gas, all Pt/CeO2 catalysts showed high catalytic activity of over 90%, but when 500 ppm H2S was injected, there was a distinct difference in catalyst performance. It was found that the sulfur tolerance of the catalyst mainly depends on the OSC and reducibility of the catalyst. In the precipitation method used to prepare CeO2, increasing the precursor concentration led to higher supersaturation levels, resulting in an increased concentration of oxygen vacancies and improved reducibility in the CeO2 support. Higher supersaturation during the nucleation process of CeO2 led to the formation of smaller crystallites, which facilitated lattice distortion and oxygen release. Among the prepared samples, the Pt catalyst supported on CeO2 prepared with the highest precursor concentration (PtCe–0.20 M) exhibited the best sulfur resistance and regeneration. The PtCe–0.20 M catalyst demonstrated the smallest crystallite size, the highest lattice strain, and the highest concentration of oxygen storage capacity-related species (OD, Ce3+ and oxygen vacancies). From these results, it was concluded that the improved OSC resulting from the smaller crystallite size of the catalyst is a key factor in conferring sulfur resistance to the catalyst in the waste–to–hydrogen process.

Supplementary Materials

The following supporting information can be downloaded at: https://www.mdpi.com/article/10.3390/catal14020099/s1, Table S1: Inlet and outlet gas compositions.

Author Contributions

Conceptualization, G.-R.H. and K.-J.K.; Data curation, G.-R.H., K.-J.K. and Y.-L.L.; Formal analysis, G.-R.H. and K.-J.K.; Funding acquisition, H.-S.R.; Investigation, G.-R.H.; Methodology, S.-Y.A., B.-J.K., B.-G.S. and M.-J.O.; Project administration, H.-S.R.; Resources, G.-R.H. and K.-J.K.; Supervision, Y.-L.L. and H.-S.R.; Validation, G.-R.H.; Visualization, G.-R.H.; Writing—original draft, G.-R.H.; Writing—review and editing, G.-R.H., K.-J.K., S.-Y.A., B.-J.K., B.-G.S. and M.-J.O. All authors have read and agreed to the published version of the manuscript.

Funding

This work was supported by the National Research Foundation of Korea (NRF) grant funded by the Korean government (MSIT) (No. 2023R1A2C2007671). Also, this research was supported by “Regional Innovation Strategy (RIS)” through the National Research Foundation of Korea (NRF), funded by the Ministry of Education (MOE) (2022RIS-005).

Data Availability Statement

Data are contained within the article.

Conflicts of Interest

The authors declare no conflicts of interest.

References

  1. Lee, Y.L.; Kim, K.J.; Hong, G.R.; Roh, H.S. Target-Oriented Water–Gas Shift Reactions with Customized Reaction Conditions and Catalysts. Chem. Eng. J. 2023, 458, 141422. [Google Scholar] [CrossRef]
  2. Nandhini, R.; Berslin, D.; Sivaprakash, B.; Rajamohan, N.; Vo, D.V.N. Thermochemical Conversion of Municipal Solid Waste into Energy and Hydrogen: A Review. Environ. Chem. Lett. 2022, 20, 1645–1669. [Google Scholar] [CrossRef]
  3. Ahn, S.Y.; Kim, K.J.; Kim, B.J.; Hong, G.R.; Jang, W.J.; Bae, J.W.; Park, Y.K.; Jeon, B.H.; Roh, H.S. From Gray to Blue Hydrogen: Trends and Forecasts of Catalysts and Sorbents for Unit Process. Renew. Sustain. Energy Rev. 2023, 186, 113635. [Google Scholar] [CrossRef]
  4. Sajid, M.; Raheem, A.; Ullah, N.; Asim, M.; Ur Rehman, M.S.; Ali, N. Gasification of Municipal Solid Waste: Progress, Challenges, and Prospects. Renew. Sustain. Energy Rev. 2022, 168, 112815. [Google Scholar] [CrossRef]
  5. Alaedini, A.H.; Tourani, H.K.; Saidi, M. A Review of Waste-to-Hydrogen Conversion Technologies for Solid Oxide Fuel Cell (SOFC) Applications: Aspect of Gasification Process and Catalyst Development. J. Environ. Manag. 2023, 329, 117077. [Google Scholar] [CrossRef]
  6. Rasul, M.G.; Hazrat, M.A.; Sattar, M.A.; Jahirul, M.I.; Shearer, M.J. The Future of Hydrogen: Challenges on Production, Storage and Applications. Energy Convers. Manag. 2022, 272, 116326. [Google Scholar] [CrossRef]
  7. Lee, Y.L.; Lee, K.; Hyun Ko, C.; Roh, H.S. Optimization of Nano-Catalysts for Application in Compact Reformers. Chem. Eng. J. 2022, 431, 134299. [Google Scholar] [CrossRef]
  8. Hakandai, C.; Sidik Pramono, H.; Aziz, M. Conversion of Municipal Solid Waste to Hydrogen and Its Storage to Methanol. Sustain. Energy Technol. Assess. 2022, 51, 101968. [Google Scholar] [CrossRef]
  9. Saravanakumar, A.; Chen, W.H.; Arunachalam, K.D.; Park, Y.K.; Chyuan Ong, H. Pilot-Scale Study on Downdraft Gasification of Municipal Solid Waste with Mass and Energy Balance Analysis. Fuel 2022, 315, 123287. [Google Scholar] [CrossRef]
  10. Lee, Y.L.; Kim, K.J.; Hong, G.R.; Ahn, S.Y.; Kim, B.J.; Shim, J.O.; Roh, H.S. Highly Sulfur Tolerant and Regenerable Pt/CeO2 Catalyst for Waste to Energy. Renew. Energy 2021, 178, 334–343. [Google Scholar] [CrossRef]
  11. Lee, Y.L.; Kim, K.J.; Hong, G.R.; Ahn, S.Y.; Kim, B.J.; Park, H.R.; Yun, S.J.; Bae, J.W.; Jeon, B.H.; Roh, H.S. Sulfur-Tolerant Pt/CeO2Catalyst with Enhanced Oxygen Storage Capacity by Controlling the Pt Content for the Waste-to-Hydrogen Processes. ACS Sustain. Chem. Eng. 2021, 9, 15287–15293. [Google Scholar] [CrossRef]
  12. Kim, K.J.; Jeon, K.W.; Hong, G.R.; Jeon, B.H.; Wook Bae, J.; Jang, W.J.; Lee, Y.L.; Roh, H.S. Elucidating the Effect of Ce/Zr Ratio on High Temperature Shift Activity with Sulfur Poisoning. J. Ind. Eng. Chem. 2022, 115, 537–543. [Google Scholar] [CrossRef]
  13. Hong, G.R.; Kim, K.J.; Ahn, S.Y.; Kim, B.J.; Park, H.R.; Lee, Y.L.; Lee, S.S.; Jeon, Y.; Roh, H.S. Sulfur-Resistant CeO2-Supported Pt Catalyst for Waste-to-Hydrogen: Effect of Catalyst Synthesis Method. Catalysts 2022, 12, 1670. [Google Scholar] [CrossRef]
  14. Kim, K.J.; Hong, G.R.; Ahn, S.Y.; Kim, B.J.; Lee, Y.L.; Roh, H.S. Effect of Precipitation Variables on the Performance of CeO2-Based Catalysts for Waste-to-Hydrogen. Catal. Today 2024, 425, 114336. [Google Scholar] [CrossRef]
  15. Kim, K.J.; Lee, Y.L.; Hong, G.R.; Ahn, S.Y.; Kim, B.J.; Lee, S.S.; Jeon, Y.; Roh, H.S. A Study on the Activity Recovery Behavior of Noble Metal Catalysts against Sulfur Poisoning. Catal. Today 2024, 425, 114361. [Google Scholar] [CrossRef]
  16. Ahn, S.Y.; Jang, W.J.; Shim, J.O.; Jeon, B.H.; Roh, H.S. CeO2-Based Oxygen Storage Capacity Materials in Environmental and Energy Catalysis for Carbon Neutrality: Extended Application and Key Catalytic Properties. Catal. Rev. Sci. Eng. 2023, 1–84. [Google Scholar] [CrossRef]
  17. Ouyang, J.; Pei, J.; Kuang, Q.; Xie, Z.; Zheng, L. Supersaturation-Controlled Shape Evolution of α-Fe2O 3 Nanocrystals and Their Facet-Dependent Catalytic and Sensing Properties. ACS Appl. Mater. Interfaces 2014, 6, 12505–12514. [Google Scholar] [CrossRef] [PubMed]
  18. Deng, J.; Li, S.; Xiong, L.; Jiao, Y.; Yuan, S.; Wang, J.; Chen, Y. Preparation of Nanostructured CeO2-ZrO2-Based Materials with Stabilized Surface Area and Their Catalysis in Soot Oxidation. Appl. Surf. Sci. 2020, 505, 144301. [Google Scholar] [CrossRef]
  19. Ramachandran, M.; Subadevi, R.; Sivakumar, M. Role of PH on Synthesis and Characterization of Cerium Oxide (CeO2) Nano Particles by Modified Co-Precipitation Method. Vacuum 2019, 161, 220–224. [Google Scholar] [CrossRef]
  20. Thanh, N.T.K.; Maclean, N.; Mahiddine, S. Mechanisms of Nucleation and Growth of Nanoparticles in Solution. Chem. Rev. 2014, 114, 7610–7630. [Google Scholar] [CrossRef] [PubMed]
  21. Roelands, C.P.M.; Ter Horst, J.H.; Kramer, H.J.M.; Jansens, P.J. Analysis of Nucleation Rate Measurements in Precipitation Processes. Cryst. Growth Des. 2006, 6, 1380–1392. [Google Scholar] [CrossRef]
  22. Papavasiliou, A.; Oliani, B.; Scanferla, M.; Sakellis, E.; Glisenti, A.; Canu, P.; Katsaros, F.K. Highly Homogeneous Multicomponent Mesoporous Catalysts: Defective Amorphous vs. Nanocrystalline CeO2 Structure towards CO-PROX Reaction. Int. J. Hydrogen Energy 2023, 48, 25044–25064. [Google Scholar] [CrossRef]
  23. Nematollahi, B.; Rezaei, M.; Lay, E.N. Preparation of Highly Active and Stable NiO-CeO2 Nanocatalysts for CO Selective Methanation. Int. J. Hydrogen Energy 2015, 40, 8539–8547. [Google Scholar] [CrossRef]
  24. Li, F.; Zou, L.; He, J.; Wu, Y.; Yang, L.; Liu, Q.; Wu, Q.; Yang, X. On the Correlation between Structure and Catalytic Activity of Mesoporous Ceria Nanoparticles. J. Catal. 2021, 402, 300–309. [Google Scholar] [CrossRef]
  25. Tanabe, T.; Nagai, Y.; Hirabayashi, T.; Takagi, N.; Dohmae, K.; Takahashi, N.; Matsumoto, S.; Shinjoh, H.; Kondo, J.N.; Schouten, J.C.; et al. Low Temperature CO Pulse Adsorption for the Determination of Pt Particle Size in a Pt/Cerium-Based Oxide Catalyst. Appl. Catal. A Gen. 2009, 370, 108–113. [Google Scholar] [CrossRef]
  26. Takeguchi, T.; Manabe, S.; Kikuchi, R.; Eguchi, K.; Kanazawa, T.; Matsumoto, S.; Ueda, W. Determination of Dispersion of Precious Metals on CeO2- Containing Supports. Appl. Catal. A Gen. 2005, 293, 91–96. [Google Scholar] [CrossRef]
  27. Lee, J.; Ryou, Y.; Kim, J.; Chan, X.; Kim, T.J.; Kim, D.H. Influence of the Defect Concentration of Ceria on the Pt Dispersion and the CO Oxidation Activity of Pt/CeO2. J. Phys. Chem. C 2018, 122, 4972–4983. [Google Scholar] [CrossRef]
  28. Baraj, E.; Ciahotný, K.; Hlinčík, T. The Water Gas Shift Reaction: Catalysts and Reaction Mechanism. Fuel 2021, 288, 119817. [Google Scholar] [CrossRef]
  29. Kalamaras, C.M.; Americanou, S.; Efstathiou, A.M. “Redox” vs “Associative Formate with -OH Group Regeneration” WGS Reaction Mechanism on Pt/CeO2: Effect of Platinum Particle Size. J. Catal. 2011, 279, 287–300. [Google Scholar] [CrossRef]
  30. Vecchietti, J.; Bonivardi, A.; Xu, W.; Stacchiola, D.; Delgado, J.J.; Calatayud, M.; Collins, S.E. Understanding the Role of Oxygen Vacancies in the Water Gas Shift Reaction on Ceria-Supported Platinum Catalysts. ACS Catal. 2014, 4, 2088–2096. [Google Scholar] [CrossRef]
  31. Wang, B.; Li, X.; Sun, Y.; Xiao, H.; Fu, M.; Li, S.; Liang, H.; Qiao, Z.; Ye, D. Unravelling the Correlation of Dielectric Barrier Discharge Power and Performance of Pt/CeO2 Catalysts for Toluene Oxidation. Catal. Sci. Technol. 2022, 13, 389–399. [Google Scholar] [CrossRef]
  32. Lee, J.; Ryou, Y.; Chan, X.; Kim, T.J.; Kim, D.H. How Pt Interacts with CeO2 under the Reducing and Oxidizing Environments at Elevated Temperature: The Origin of Improved Thermal Stability of Pt/CeO2 Compared to CeO2. J. Phys. Chem. C 2016, 120, 25870–25879. [Google Scholar] [CrossRef]
  33. Peng, R.; Li, S.; Sun, X.; Ren, Q.; Chen, L.; Fu, M.; Wu, J.; Ye, D. Size Effect of Pt Nanoparticles on the Catalytic Oxidation of Toluene over Pt/CeO2 Catalysts. Appl. Catal. B 2018, 220, 462–470. [Google Scholar] [CrossRef]
  34. Zhou, A.; Wang, J.; Wang, H.; Li, H.; Wang, J.; Shen, M. Effect of Active Oxygen on the Performance of Pt/CeO2 Catalysts for CO Oxidation. J. Rare Earths 2018, 36, 257–264. [Google Scholar] [CrossRef]
  35. Happel, M.; Mysliveček, J.; Johánek, V.; Dvořák, F.; Stetsovych, O.; Lykhach, Y.; Matolín, V.; Libuda, J. Adsorption Sites, Metal-Support Interactions, and Oxygen Spillover Identified by Vibrational Spectroscopy of Adsorbed CO: A Model Study on Pt/Ceria Catalysts. J. Catal. 2012, 289, 118–126. [Google Scholar] [CrossRef]
  36. Kuan, W.F.; Chung, C.H.; Lin, M.M.; Tu, F.Y.; Chen, Y.H.; Yu, W.Y. Activation of Carbon Dioxide with Surface Oxygen Vacancy of Ceria Catalyst: An Insight from in-Situ X-Ray Absorption near Edge Structure Analysis. Mater. Today Sustain. 2023, 23, 100425. [Google Scholar] [CrossRef]
  37. Zhang, Y.; Wu, C.; Wang, Z.; Ji, J.; Wan, H.; Zou, W.; Tong, Q.; Sun, J.; Dong, L.; Chen, Y.W. Enhanced Low-Temperature Catalytic Performance for Toluene Combustion of CeO2-Supported Pt-Ir Alloy Catalysts. Appl. Surf. Sci. 2022, 580, 152278. [Google Scholar] [CrossRef]
  38. Tan, W.; Xie, S.; Le, D.; Diao, W.; Wang, M.; Low, K.B.; Austin, D.; Hong, S.; Gao, F.; Dong, L.; et al. Fine-Tuned Local Coordination Environment of Pt Single Atoms on Ceria Controls Catalytic Reactivity. Nat. Commun. 2022, 13, 7070. [Google Scholar] [CrossRef]
  39. Rocha, L.S.R.; Aparecido Ciola Amoresi, R.; Duarte, T.M.; Marana, N.L.; Sambrano, J.R.; Aldao, C.M.; Simões, A.Z.; Ponce, M.A.; Longo, E. Experimental and Theoretical Interpretation of the Order/Disorder Clusters in CeO2:La. Appl. Surf. Sci. 2020, 510, 145216. [Google Scholar] [CrossRef]
  40. Soni, S.; Kumar, S.; Dalela, B.; Kumar, S.; Alvi, P.A.; Dalela, S. Defects and Oxygen Vacancies Tailored Structural and Optical Properties in CeO2 Nanoparticles Doped with Sm3+ Cation. J. Alloys. Compd. 2018, 752, 520–531. [Google Scholar] [CrossRef]
  41. Bindu, P.; Thomas, S. Estimation of Lattice Strain in ZnO Nanoparticles: X-ray Peak Profile Analysis. J. Theor. Appl. Phys. 2014, 8, 123–134. [Google Scholar] [CrossRef]
  42. Ma, D.; Lu, Z.; Tang, Y.; Li, T.; Tang, Z.; Yang, Z. Effect of Lattice Strain on the Oxygen Vacancy Formation and Hydrogen Adsorption at CeO2(111) Surface. Phys. Lett. A 2014, 378, 2570–2575. [Google Scholar] [CrossRef]
  43. Lee, Y.L.; Mnoyan, A.; Na, H.S.; Ahn, S.Y.; Kim, K.J.; Shim, J.O.; Lee, K.; Roh, H.S. Comparison of the Effects of the Catalyst Preparation Method and CeO2 morphology on the Catalytic Activity of Pt/CeO2 catalysts for the Water-Gas Shift Reaction. Catal. Sci. Technol. 2020, 10, 6299–6308. [Google Scholar] [CrossRef]
  44. Liu, H.; Dong, M.; Xiong, J.; Yang, J.; Ning, J.; Liang, Y.; Lu, J. CO2 Laser Promoted Oxygen Vacancy-Active Oxygen Cycle in DRM on Ni/CeO2. Energy Convers. Manag. 2023, 286, 117081. [Google Scholar] [CrossRef]
  45. Hernández, W.Y.; Laguna, O.H.; Centeno, M.A.; Odriozola, J.A. Structural and Catalytic Properties of Lanthanide (La, Eu, Gd) Doped Ceria. J. Solid State Chem. 2011, 184, 3014–3020. [Google Scholar] [CrossRef]
  46. Trogadas, P.; Parrondo, J.; Ramani, V. CeO2 Surface Oxygen Vacancy Concentration Governs in Situ Free Radical Scavenging Efficacy in Polymer Electrolytes. ACS Appl. Mater. Interfaces 2012, 4, 5098–5102. [Google Scholar] [CrossRef]
  47. Rahimi-Nasrabadi, M.; Pourmortazavi, S.M.; Davoudi-Dehaghani, A.A.; Hajimirsadeghi, S.S.; Zahedi, M.M. Synthesis and Characterization of Copper Oxalate and Copper Oxide Nanoparticles by Statistically Optimized Controlled Precipitation and Calcination of Precursor. CrystEngComm 2013, 15, 4077–4086. [Google Scholar] [CrossRef]
  48. Zhang, J.; Li, H.; Kuang, Q.; Xie, Z. Toward Rationally Designing Surface Structures of Micro- and Nanocrystallites: Role of Supersaturation. ACC Chem. Res. 2018, 51, 2880–2887. [Google Scholar] [CrossRef]
  49. Shittu, T.; Altarawneh, M. Investigative Properties of CeO2 doped with Niobium: A Combined Characterization and DFT Studies. Nanotechnol. Rev. 2021, 11, 191–203. [Google Scholar] [CrossRef]
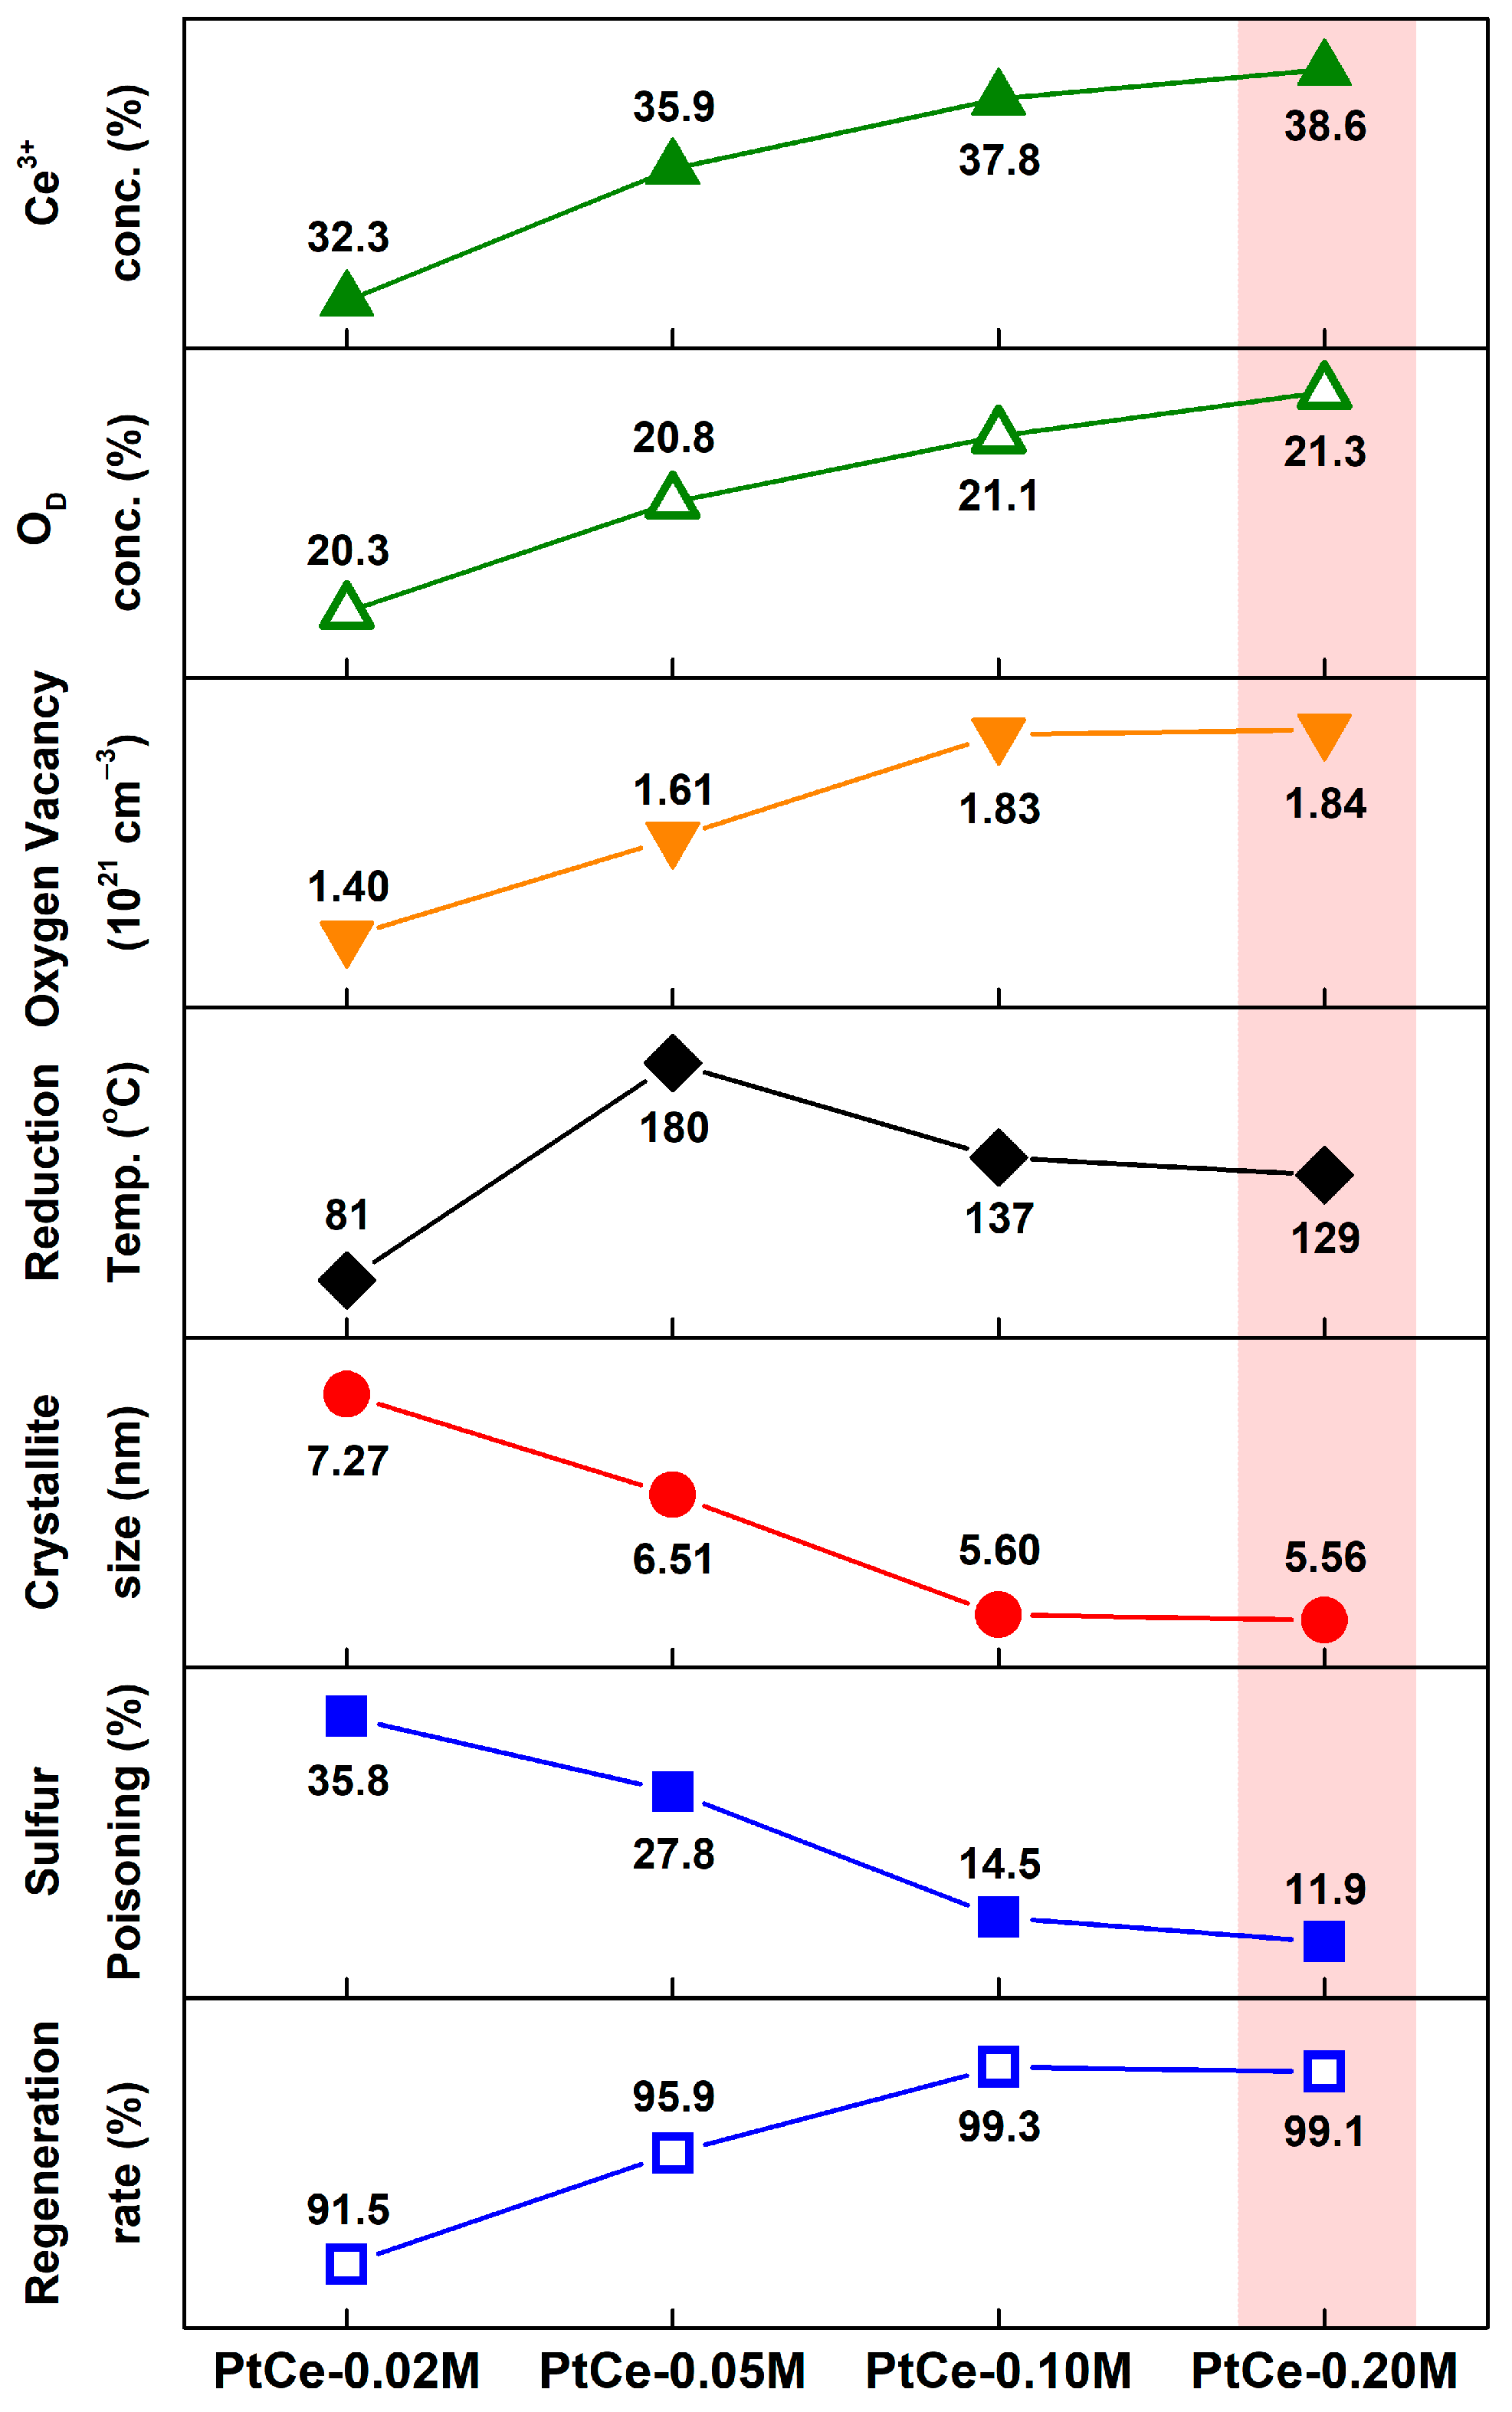
Figure 1. Catalytic activity of Pt catalysts supported on CeO2 synthesized at various cerium precursor concentrations (A) CO conversions as a function of time on stream; (B) CO2 and CH4 selectivity as a function of time on stream; (C) CO conversions at key stages (I: Initial, P: Poisoned, CO: R: Regenerated).
Catalysts 14 00099 g001
Figure 2. (A) Pore size distribution and (B) N2 adsorption–desorption isotherms of the Pt catalysts supported on CeO2 synthesized at various cerium precursor concentrations.
Catalysts 14 00099 g002
Figure 3. H2–TPR profiles of the Pt catalysts supported on CeO2 synthesized at various cerium precursor concentrations.
Catalysts 14 00099 g003
Figure 4. XRD patterns of the Pt catalysts supported on CeO2 synthesized at various cerium precursor concentrations.
Catalysts 14 00099 g004
Figure 5. XPS spectra of reduced Pt catalysts supported on CeO2 synthesized at various cerium precursor concentrations (A) Ce 3d, (B) O 1s.
Catalysts 14 00099 g005
Figure 6. Raman spectra of the CeO2 support synthesized at various cerium precursor concentrations.
Catalysts 14 00099 g006
Figure 7. Relationship between the physicochemical properties and the performance of the Pt catalysts supported on CeO2 synthesized at various cerium precursor concentrations.
Catalysts 14 00099 g007
Table 1. Physicochemical properties of Pt catalysts supported on CeO2 synthesized at various cerium precursor concentrations.
CatalystBET S.A.
(m2/g) a
Pore Volume
(cm3/g) a
Pt0 Dispersion
(%) b
Crystallite Size
(nm) c
Lattice Parameter
(Å) c
Lattice Strain
(10−2) c
PtCe–0.02 M1300.27259.07.275.4201.938
PtCe–0.05 M1180.38462.56.515.4232.163
PtCe–0.10 M1380.40659.05.605.4202.514
PtCe–0.20 M1120.49560.05.565.4212.532
a Estimated by N2–adsorption/desorption at −196 °C. b Estimated by modified CO–chemisorption. c Calculated from XRD patterns of CeO2 using the (111) diffraction peak.
Table 2. Oxygen storage capacity–related values of the Pt catalysts supported by CeO2 synthesized at various cerium precursor concentrations.
CatalystCe3+ (%) aOV (%) bSupportConcentration of Oxygen Vacancies (1021 cm−3) c
PtCe–0.02 M32.320.3Ce–0.02 M1.40
PtCe–0.05 M35.920.8Ce–0.05 M1.61
PtCe–0.10 M37.821.1Ce–0.10 M1.83
PtCe–0.20 M38.621.3Ce–0.20 M1.84
a Estimated from XPS Ce 3d spectra. b Estimated from XPS O 1s spectra. c Estimated from Raman spectra.
Disclaimer/Publisher’s Note: The statements, opinions and data contained in all publications are solely those of the individual author(s) and contributor(s) and not of MDPI and/or the editor(s). MDPI and/or the editor(s) disclaim responsibility for any injury to people or property resulting from any ideas, methods, instructions or products referred to in the content.

