Article

Impact of Metal Impregnation of Commercial Zeolites in the Catalytic Pyrolysis of Real Mixture of Post-Consumer Plastic Waste

by
Marco F. Paucar-Sánchez
,
Mónica Calero
,
Gabriel Blázquez
,
Rafael R. Solís
,
Mario J. Muñoz-Batista
* and
María Ángeles Martín-Lara
*
Department of Chemical Engineering, University of Granada, 18071 Granada, Spain
*
Authors to whom correspondence should be addressed.
Catalysts 2024, 14(3), 168; https://doi.org/10.3390/catal14030168
Submission received: 17 January 2024 / Revised: 16 February 2024 / Accepted: 20 February 2024 / Published: 24 February 2024
(This article belongs to the Section Catalytic Materials)

Abstract

:
This work reports the study of the catalytic pyrolysis of rejected plastic fractions collected from municipal solid waste whose mechanical recovery is not plausible due to technical or poor conservation issues. The chemical recycling using catalytic pyrolysis was carried out over commercial zeolites formulas, i.e., HY and HZSM-5, in which Ni or Co metals were deposited at two different loadings (1 and 5%, wt.). The presence of these transition metals on the zeolitic supports impacted the total production of compounds existing in the liquid oil. The samples were characterized in terms of structural, chemical, and morphologic properties, and the production of different fuel fractions (gasoline, light cycle oil, and heavy cycle oil) was correlated with a combined parameter defined as a ratio of Acidity/BET area.

1. Introduction

Plastics made from hydrocarbons have been the most manufactured material due to the shift from durable to single-use plastics since the 1950s [1]. Recent estimations have shown that only one-third of the collected plastic waste (10.2 Mt) is recycled. Still, around 6.9 Mt (23%) are sent to landfills [2], which generates another future problem like the plausible leaching of hazardous chemicals that could reach the soil and the water, along with microplastics generated in those that do not have adequate protection [3,4,5]. To solve this, a series of actions to reduce waste have been proposed, among which are expanding and improving separate collections, favoring the reuse and recycling of plastics in opposition to landfilling or incineration [6]. Although many classification processes have been optimized, the accumulation of large amounts of mixed dirty plastics is still high, and their separation, primarily via mechanical procedures, is not economically feasible [7].
Chemical recycling is a viable alternative for plastic waste processing because it allows for the handling of a more comprehensive range of plastic waste, including those that are difficult to recycle mechanically [8,9]. Among all the types of chemical recycling methods, pyrolysis (thermal cracking) is the preferred method for many industries. However, thermal cracking is an uncontrolled breakdown pathway in plastic waste process treatment to obtain an adequate feedstock to produce chemicals [10], but the presence of catalytic materials solves certain limitations concerning temperature dependence by including specific catalytic characteristics such as surface area, pore size distribution, and acidity [11]. Up to this point, several studies have researched the thermal degradation of different plastic waste over catalytic materials; some of them aimed at the production of aromatic hydrocarbons using commercial zeolites like HY and HZSM-5 [12,13,14,15,16,17,18], and others intended to compare the effect of contact mode on product distribution either operating under in situ or ex situ schemes [10,19,20], others focused on the production of hydrogen-rich syngas and carbon nanomaterials [13,21].
The generation of improved fuels and high-value chemicals in the liquid product from the pyrolysis of biomass and plastic waste can be improved using metallic catalysts. In the pyrolysis of different types of waste, including plastic waste, metals have been integrated into a diverse variety of catalytic support materials, mainly including activated carbons and zeolites [22,23,24]. For instance, non-noble metals such as Fe, Co, Zn, and Ni have been deposited onto the zeolite HZSM-5 to upgrade the liquid or oil product obtained from the co-pyrolysis of wheat straw and polystyrene [20]. The presence of metals was reported to increase selectivity towards monoaromatic hydrocarbons when the metals were added, e.g., when the PVC-containing waste-derived vapor was processed [25], as well as considerably reducing coke production in the hydrocracking of residues [26], over Co_HZSM-5; or producing ethylene by ethane dehydrogenation in CO2 presence [27]. Cobalt (Co) and nickel (Ni) have also been used to modify the zeolite ZSM-5 and applied to the in situ pyrolysis of biomass [28], as over alumina to convert furfural to ethanol at high pressure in a hydrogen environment [29]. The incorporation of Co or Ni limited the zeolite’s reactivity toward water production [23]. Finally, another example of in situ catalytic pyrolysis is upgrading pyrolysis oil from biomass using a modified HZSM-5 with P, Zn, and Ti. The addition of Zn to the zeolite aided in the formation of polyaromatic hydrocarbons, while Ti triggered the formation of monoaromatic and aliphatic hydrocarbons [30].
Since catalytic pyrolysis over real mixtures of post-consumer plastic waste destined for landfills has not been studied enough, this work aims to be one of the first approaches to the catalytic pyrolysis of mixed non-recyclable post-consumer plastic waste collected from municipal solid waste. Two commercial zeolites, HZSM and HY, were modified with two transition metals (Ni and Co). The presence of the metals was analyzed in terms of the effect produced by the product yields and, specifically, the composition of the liquid product.

2. Results and Discussion

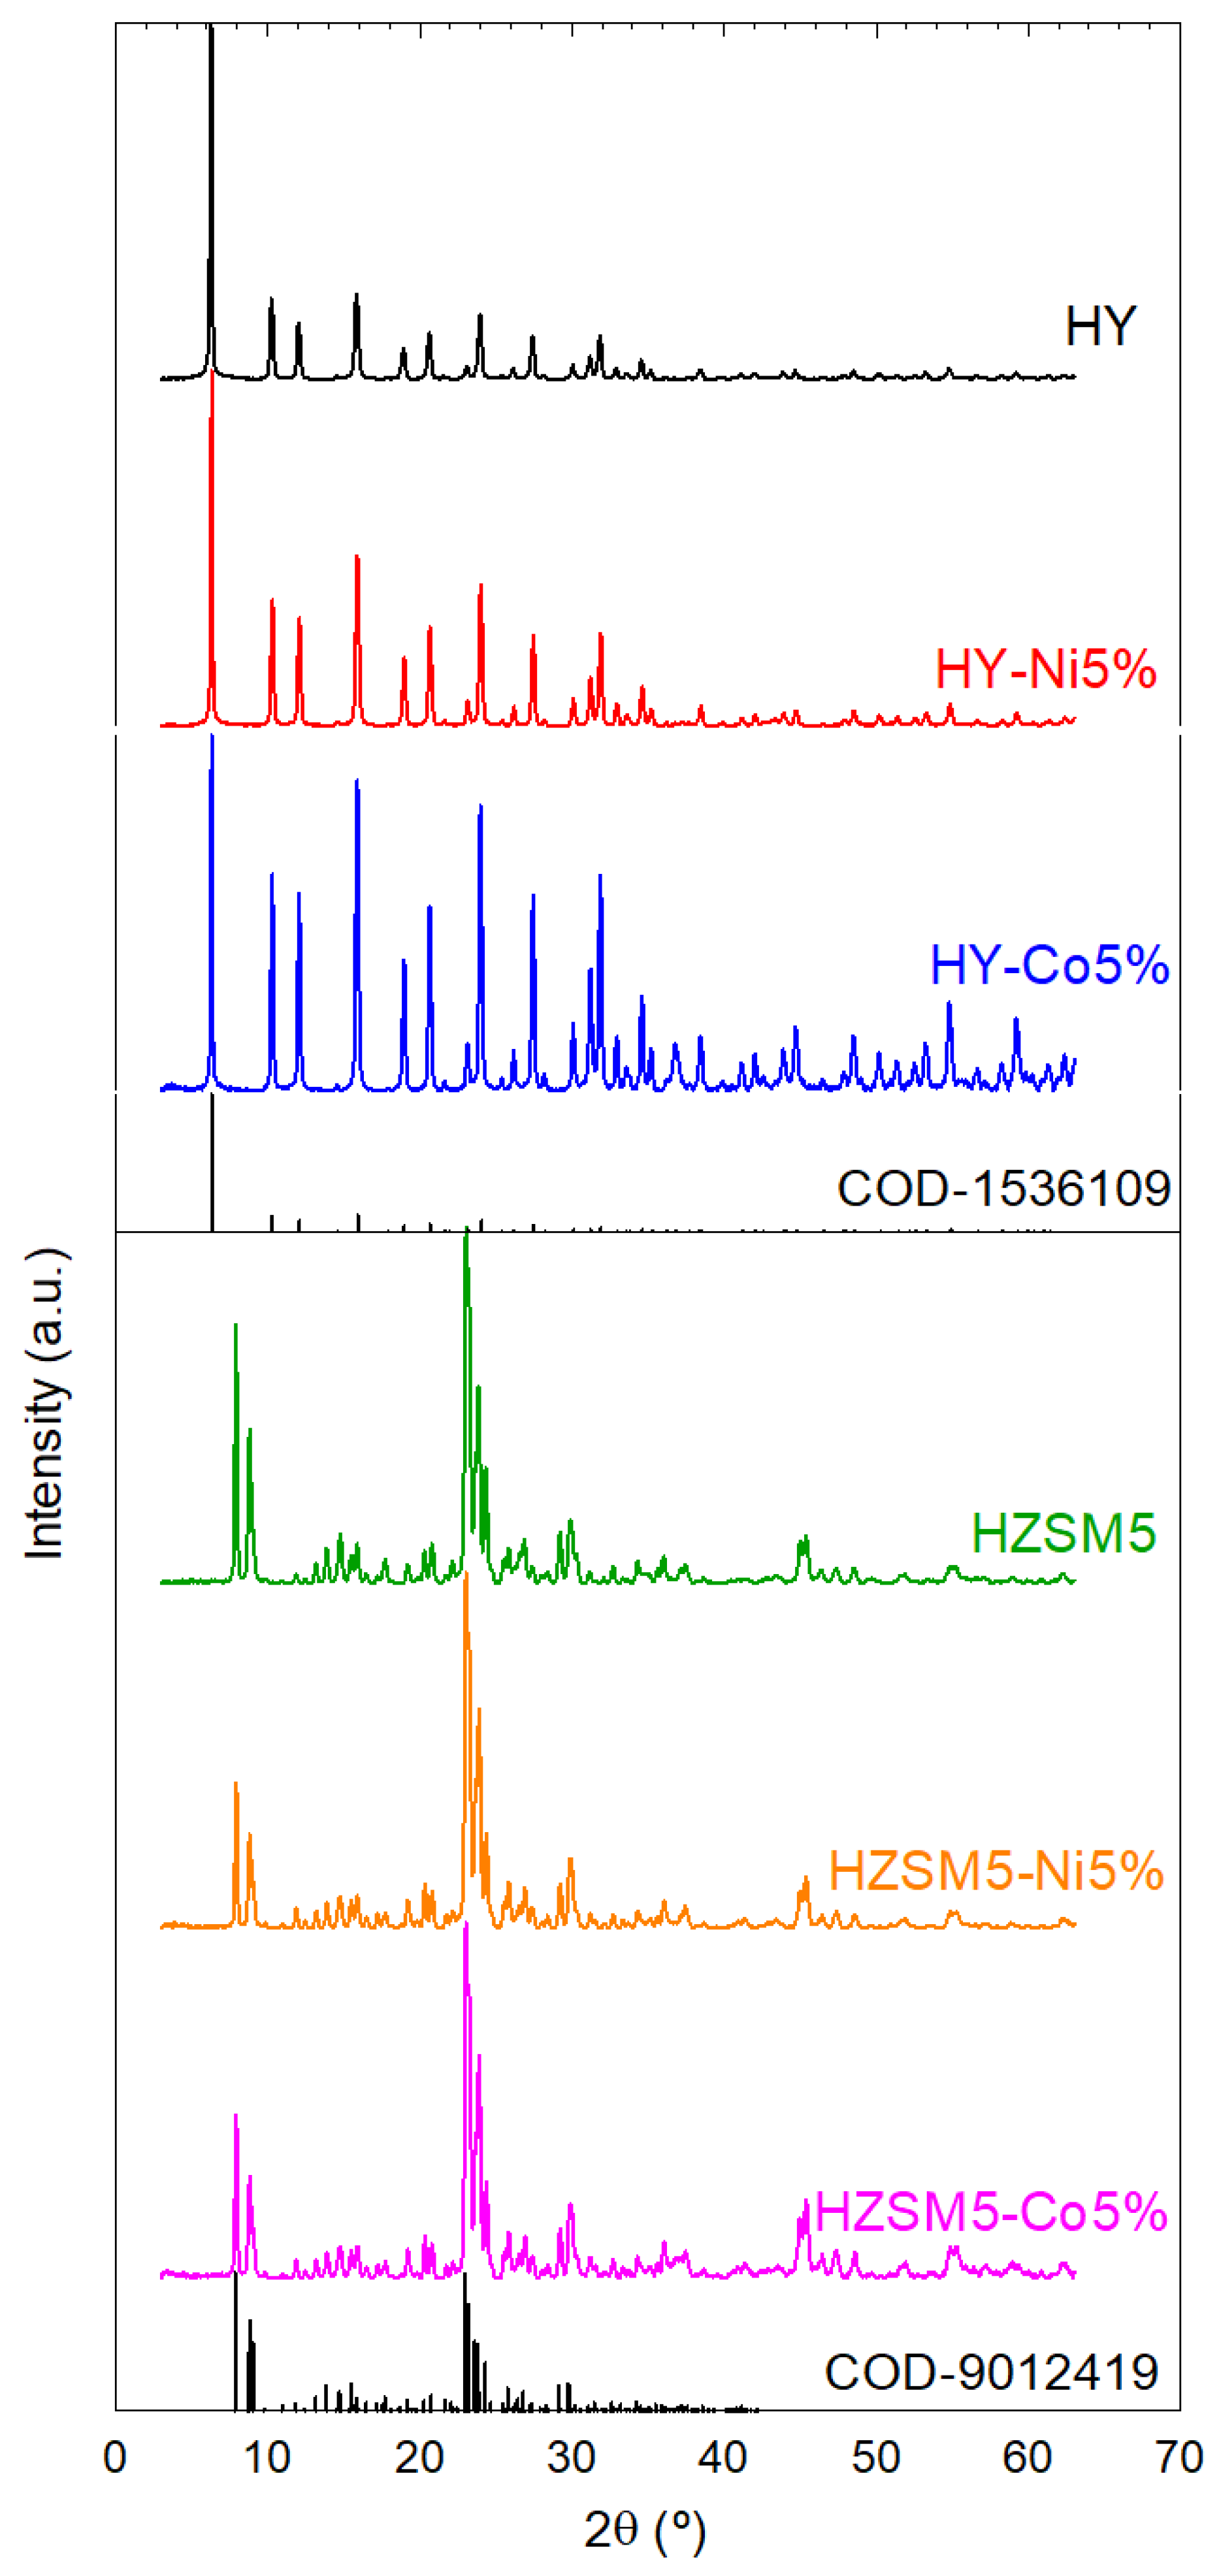
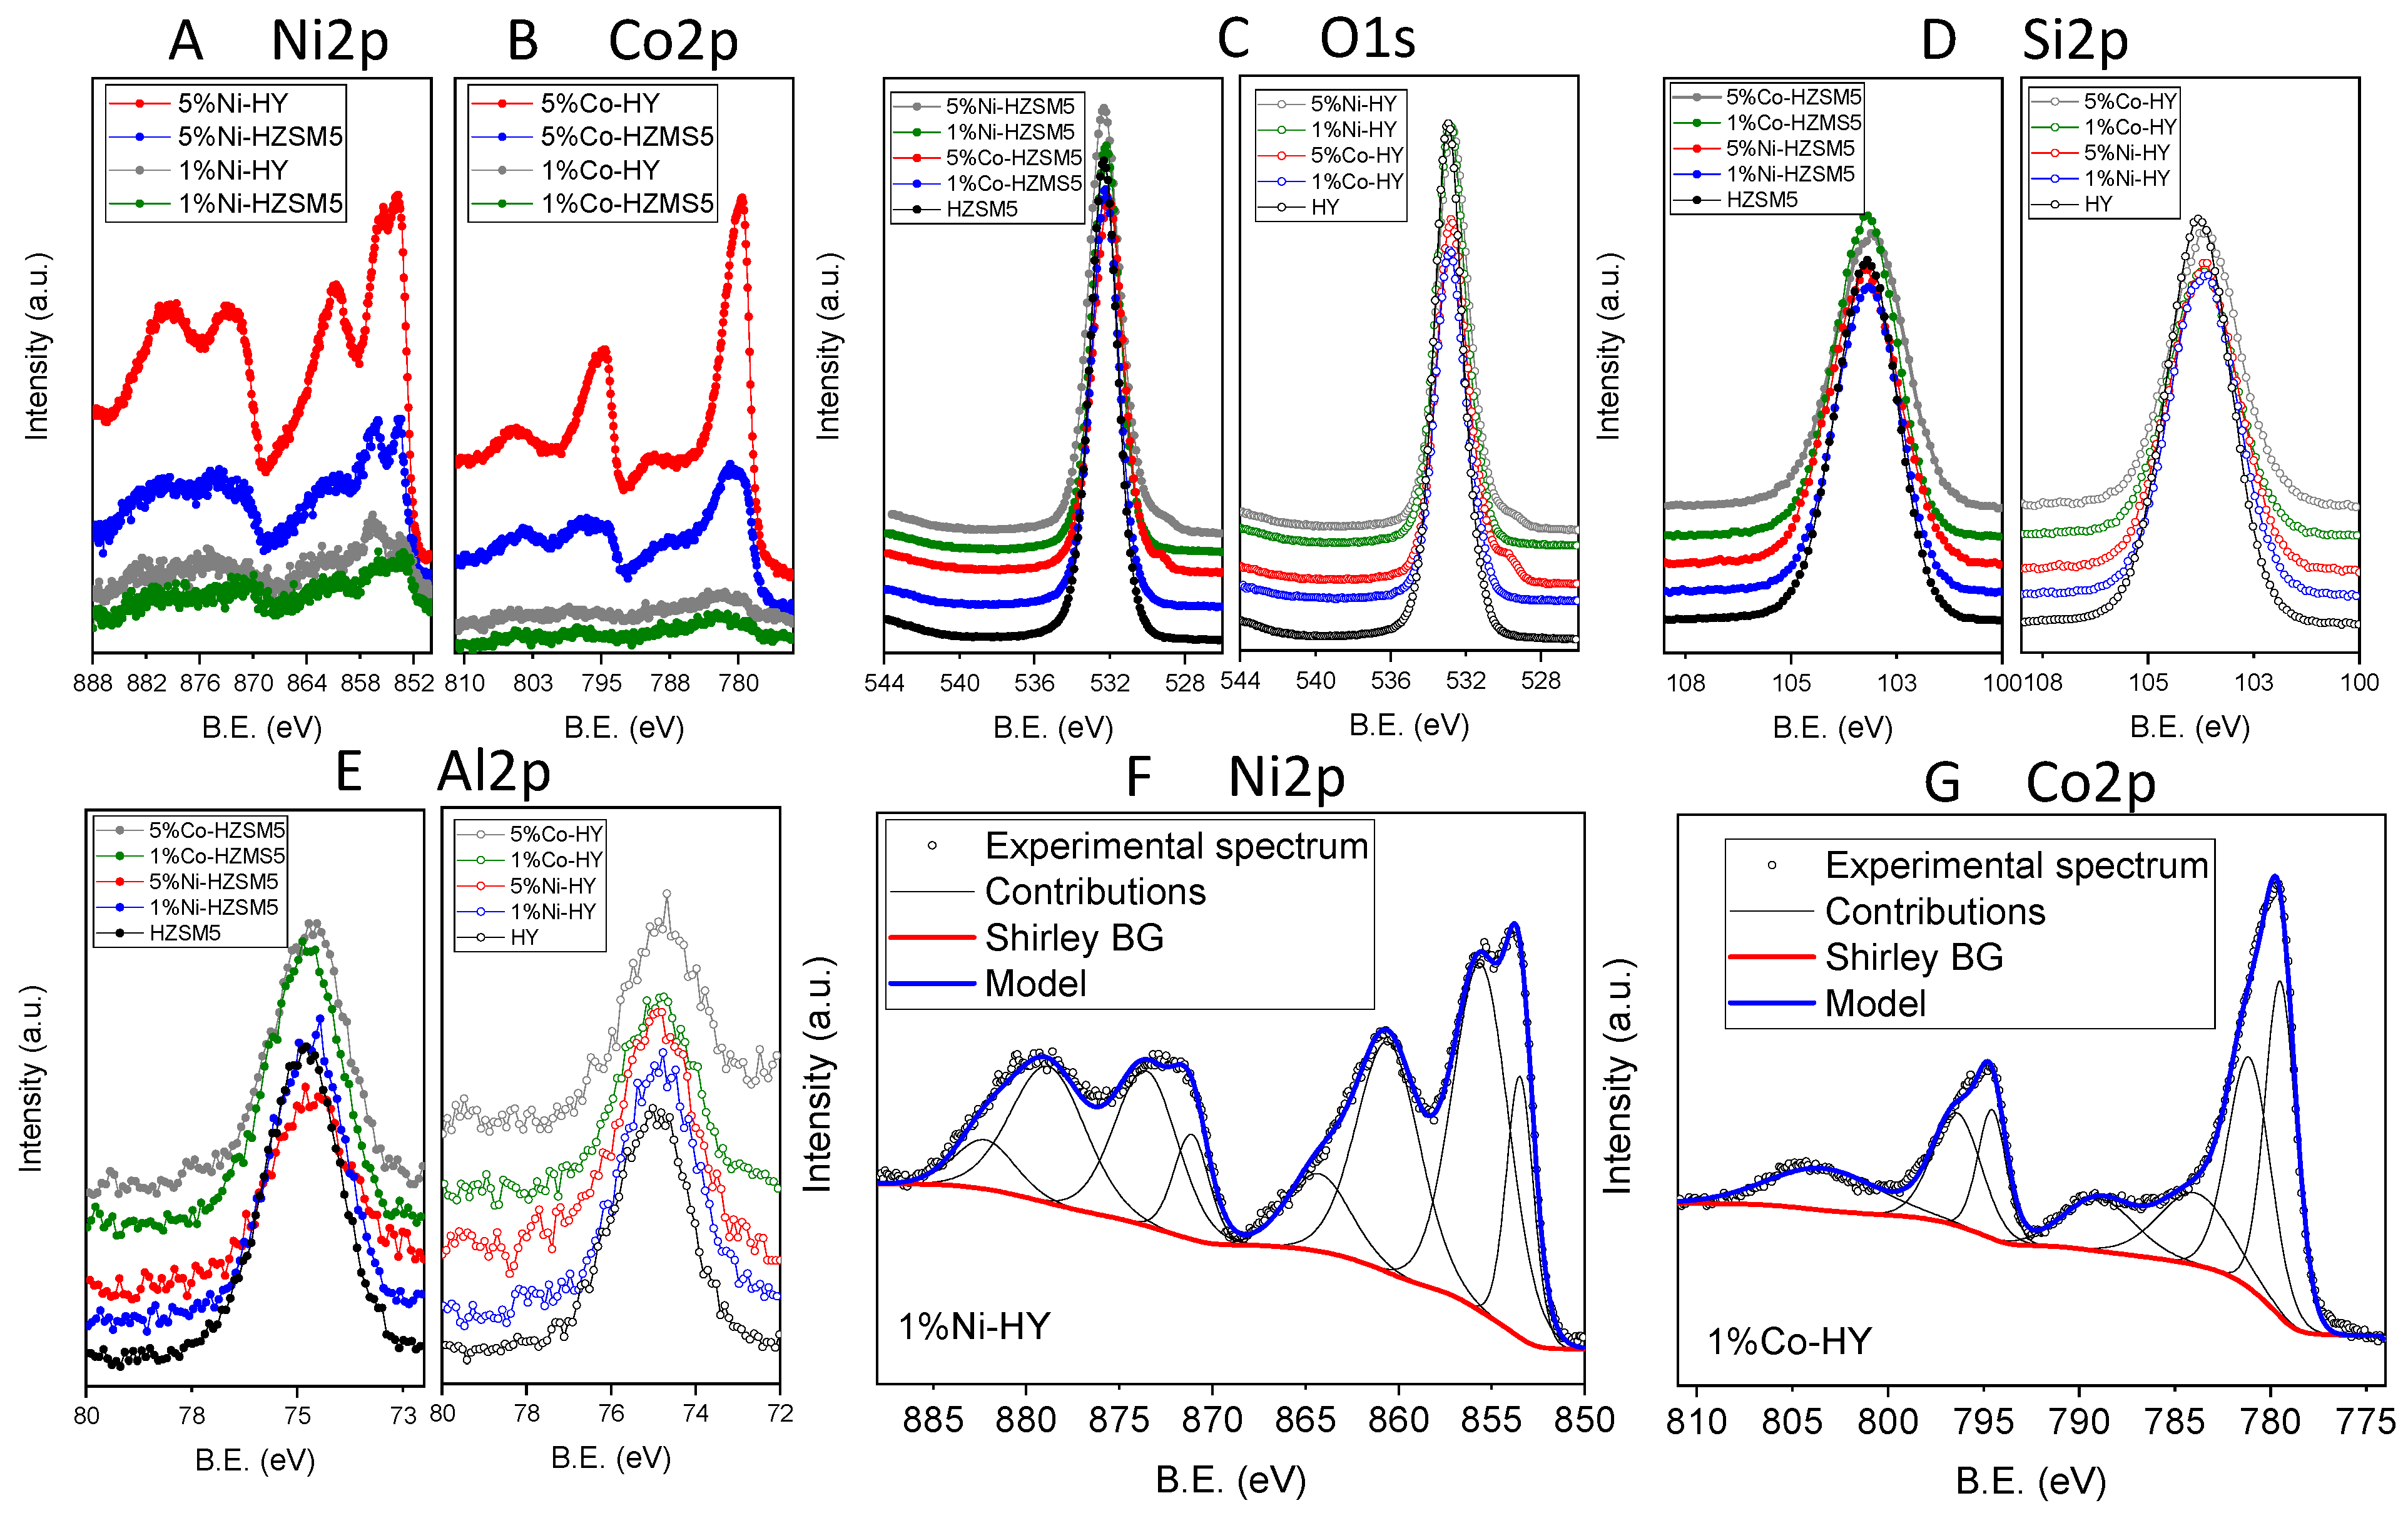
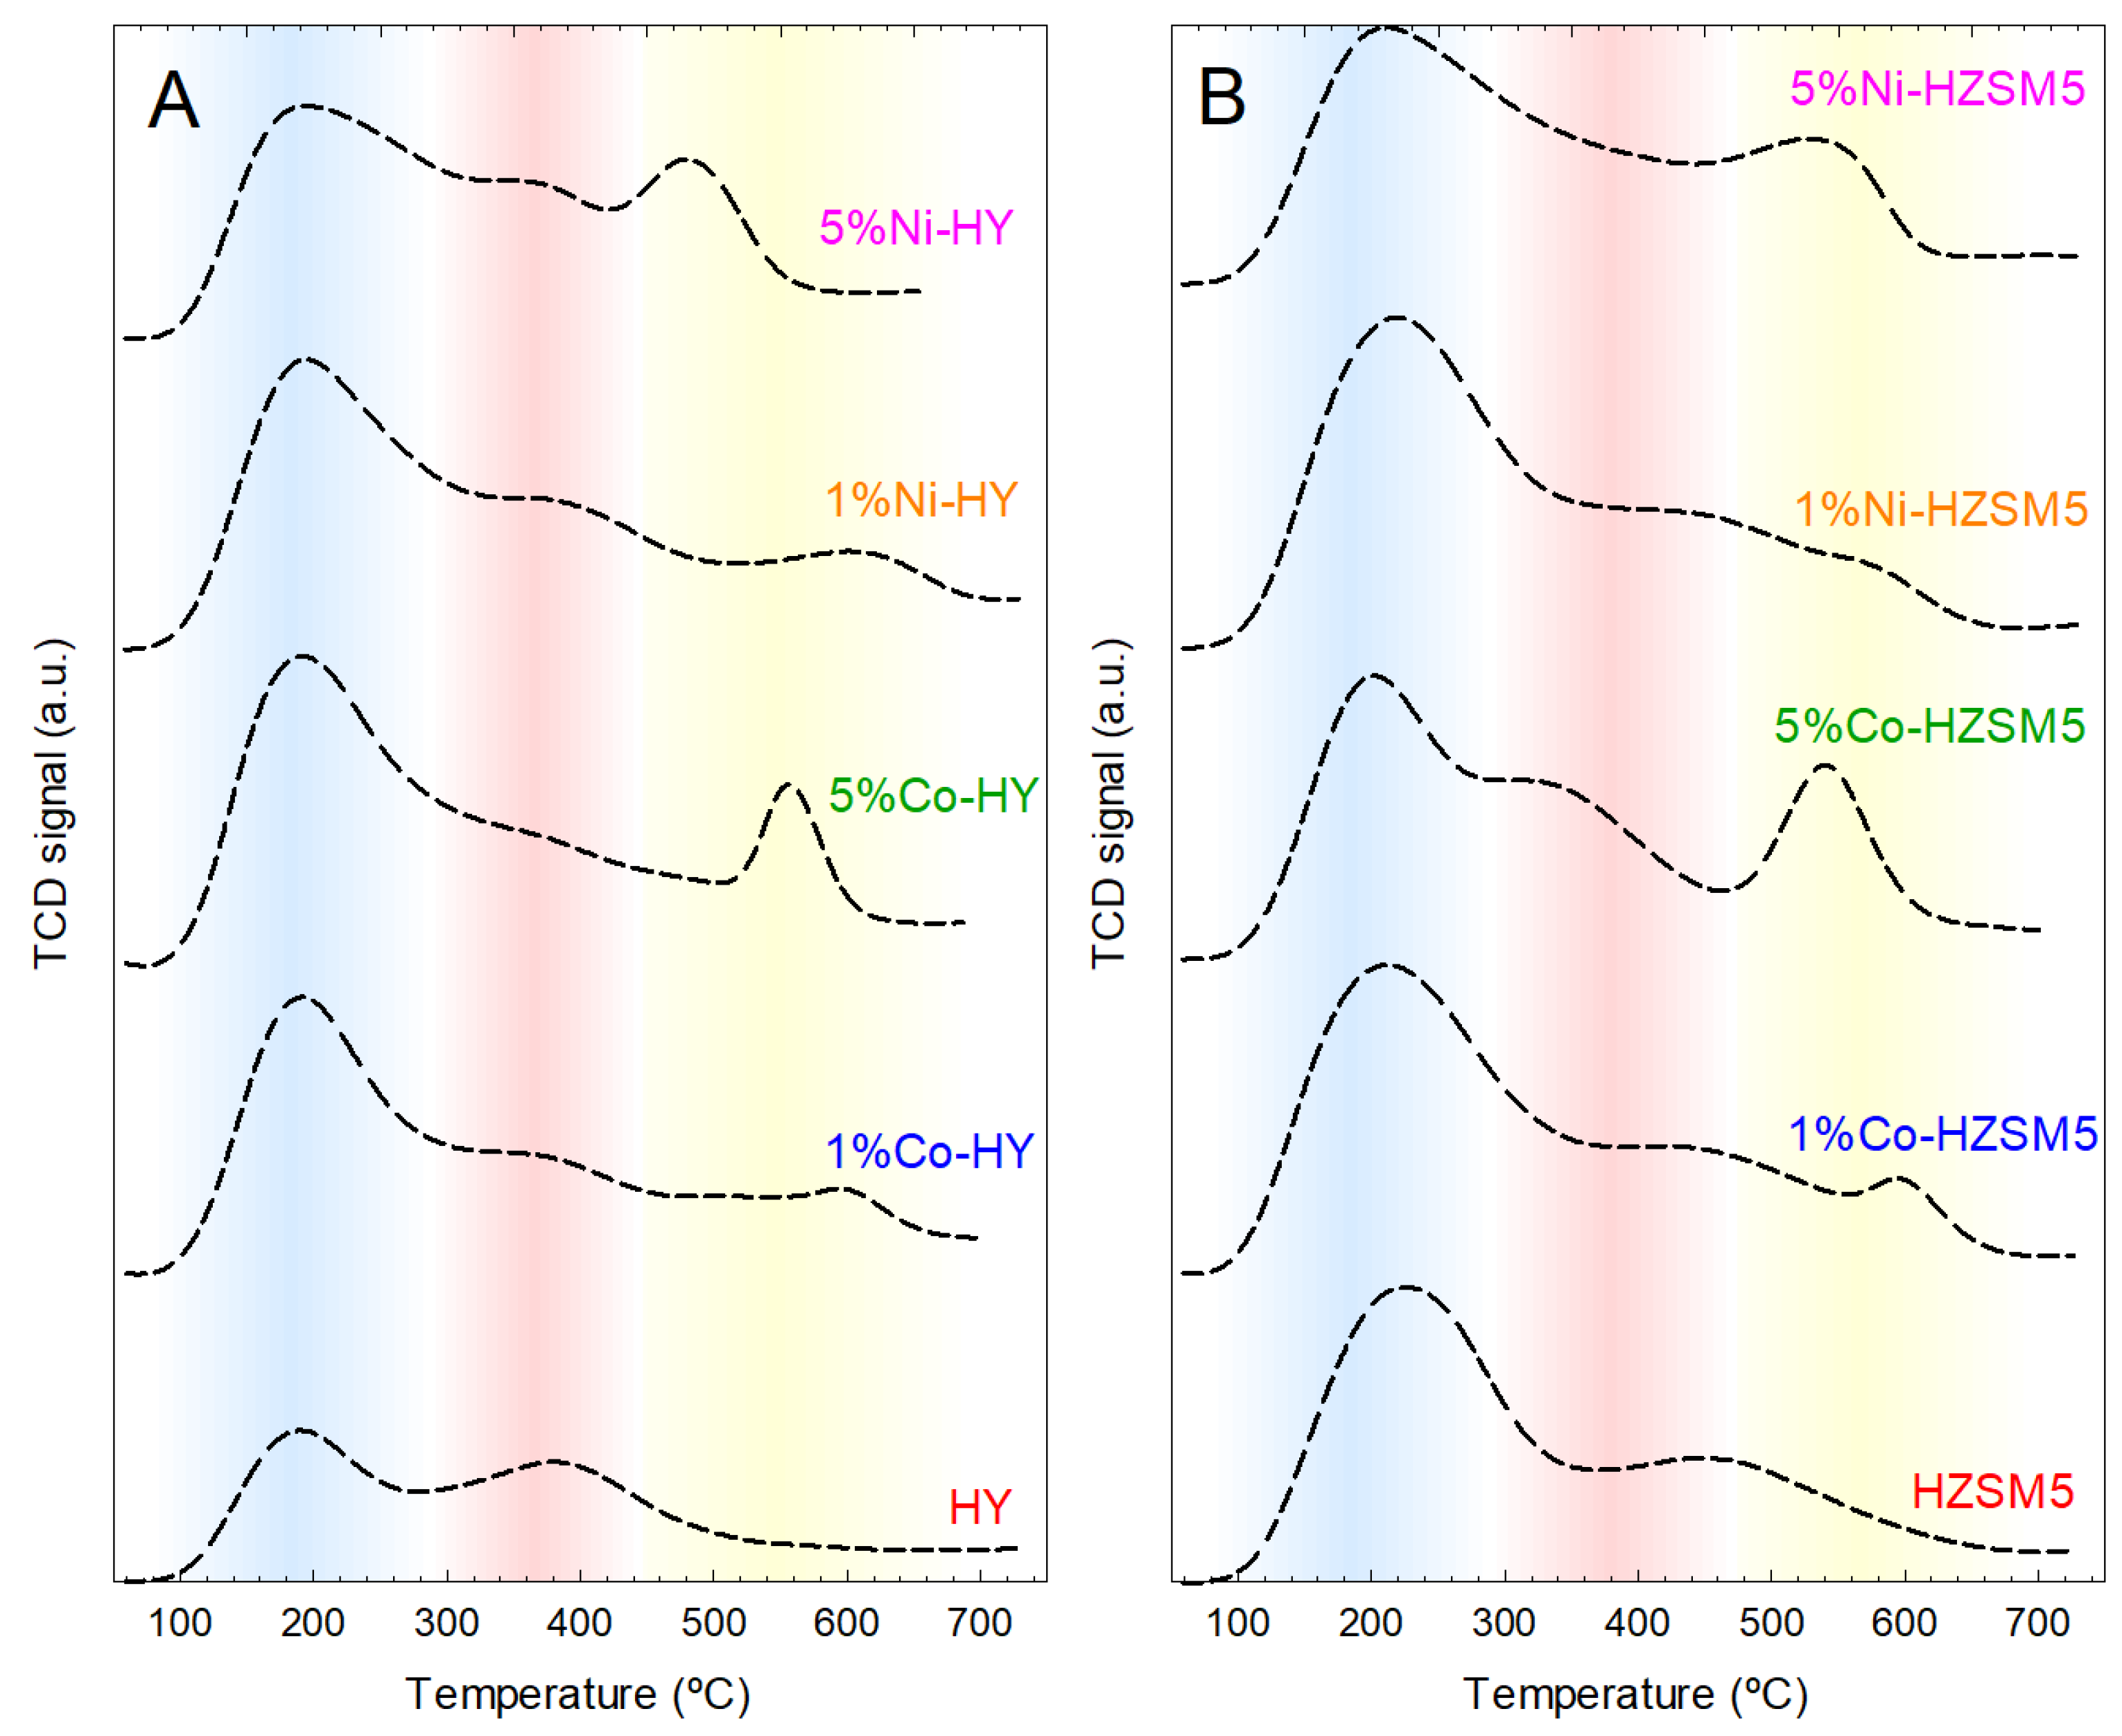
2.1. Characterization of the Catalytic Materials

Figure 1 illustrates the diffractograms of the thermally treated HY and HZSM-5 zeolites before and after the incorporation of Ni and Co oxides onto their surfaces. HY reference shows representative peaks at 2θ equal to 6.39°, 23.71° and 15.76° [31], which are also detected in both Co- and Ni-modified samples. On the other hand, the HZSM-5-samples (references and metal-containing structures) exhibit the typical diffraction peaks of ZSM-5 zeolite at 2θ equal to 7.9°, 8.8°, 23.1° and 23.8° [32]. Incorporating 5% of Ni or Co did not alter the diffraction pattern, which can be associated with the maintenance of the zeolitic structure after the incorporation of the metallic components. In the case of Ni addition, tiny peaks regarding the NiO refraction [33] were registered. Moreover, if the crystal size of the zeolites modified with Ni is analyzed, see values in Table 1, no change in the crystal size of the zeolites was achieved. Both evidence suggest Ni’s presence as bulk NiO deposited on the zeolite’s structure. However, a very different behavior was registered for the modification with Co. No contributions associated with the presence of oxidized Co species were detected. Considering the synthetic protocol used to prepare the metal-containing samples, it is expected that a significant number of Co-related species are forming Co2O3. However, despite the relatively low concentration of the minor metal oxide counterpart and its possible introduction in the porous structure of the support (HY and HZSM5) could be the main reason for the missing Co2O3 XRD contributions, the possibility that Co-entities may have been exchanged in certain positions of the zeolitic structure is not discarded [34,35]. Further, the crystal size was raised in the case of Co addition, see Table 1, supporting the plausible metal incorporation in the zeolitic lattice as reported in the literature [36].
A complete analysis of the chemical environment of the developed structures has been carried out using means of X-ray photoelectron spectroscopy. Figure 2A–G shows the Ni2p, Co2p, Si2p, Al2p, and O1s regions of both pure zeolites support (HY and HZSM5) and Co- and Ni-containing catalysts, respectively. Figure 2A shows typical spectra of well-studied NiO materials, with the Ni2p3/2 and Ni2p1/2 contributions (~854 eV and ~872 eV) and its satellites (862 eV and 879 eV) [37,38]. Although the electronic structure is complex (similar situation for Co-oxide) and a strict fit must include a multitude of contributions (i.e., form 3d8 multiplet structure), a minimum of four contributions for each 2p (3/2 and 1/2) should be used to reproduce the experimental spectrum (Figure 2F). Although the structure is analyzed in terms of simplified modeling, the analysis of Figure 2F allows the identification of the existence of NiO with a reference peak at ~854 eV (ascribed to local screening from lattice oxygen). The Co2p data of the catalytic samples describes spectra with profiles that have been previously associated with the presence of Co3O4 (Figure 2B). Although the variation in the position of the main contributions for the CoO and Co2O3 species is small, which makes it difficult to make a strict characterization of the structure, the existence of the regions associated with satellites (e.g., ~788 eV) with relatively lower intensity (as detected in the materials studied) is commonly related to the dominant existence of the Co2O3 structure [39,40], which is in addition favored by the synthesis conditions. On the other hand, although the O1s region is clearly dominated by the majority aluminium–silicate structure (~532.4 eV), in the samples with the highest concentration of metal oxides (5%Ni-samples and 5%Co-samples), a pronounced shoulder at lower binding energies (~530 eV) is detected, which are related with metal-O bonds [39]. The regions presented in Figure 2D,E, Si2p, and Al2p identify the zeolitic supports used [41].
Table 1 shows the characterization of the bare and metal-impregnated zeolites analyzed using N2 adsorption–desorption isotherms. Figure 2 depicts the isotherms obtained and the mesopore size distribution. Regarding the IUPAC classification of physisorption isotherms, the prepared materials could be classified as type IV with capillary condensation hysteresis loops of type H4 [42]. The micropore ratio, understood as micropore volume concerning the total volume (VMP/VT), was very similar in both zeolites before metal incorporation. Although incorporating metallic particles decreased the surface area, the VMP/VT was kept without significant alteration, ranging in values within 61–63%. Adding 5% of metal to HZSM-5 supposes an exception as a certain decrease in the microporosity was observed, i.e., VMP/VT~57%. Further, certain differences in pore distribution were observed concerning the base materials, as depicted in Figure 3B,D, probably due to a dealumination effect promoted by the thermal treatment after the impregnation step [43].
Figure 4 provides the NH3-TPD of the prepared material that was carried out to assess the total acidity and acid strength distribution of the bare and metal-impregnated zeolites. The metallic surface area and dispersion for those impregnated with metals are also shown. Compared to the native zeolites, the impregnation of the commercial zeolites had a low effect on the porosity properties of the materials. However, the incorporation of the metals implied some important modifications in the strength distribution of the acidity by adding a third peak. According to their TPD profiles, peaks among 434–481 °C and 535–600 °C would be considered strong acid centers accounting also for metal/zeolite interaction, while the lowest-temperature peaks (around 183–222 °C and 336–377 °C) can be labeled as weak and medium acidic sites [44,45].

2.2. Catalytic Performance of the Metal-Impregnated Zeolites

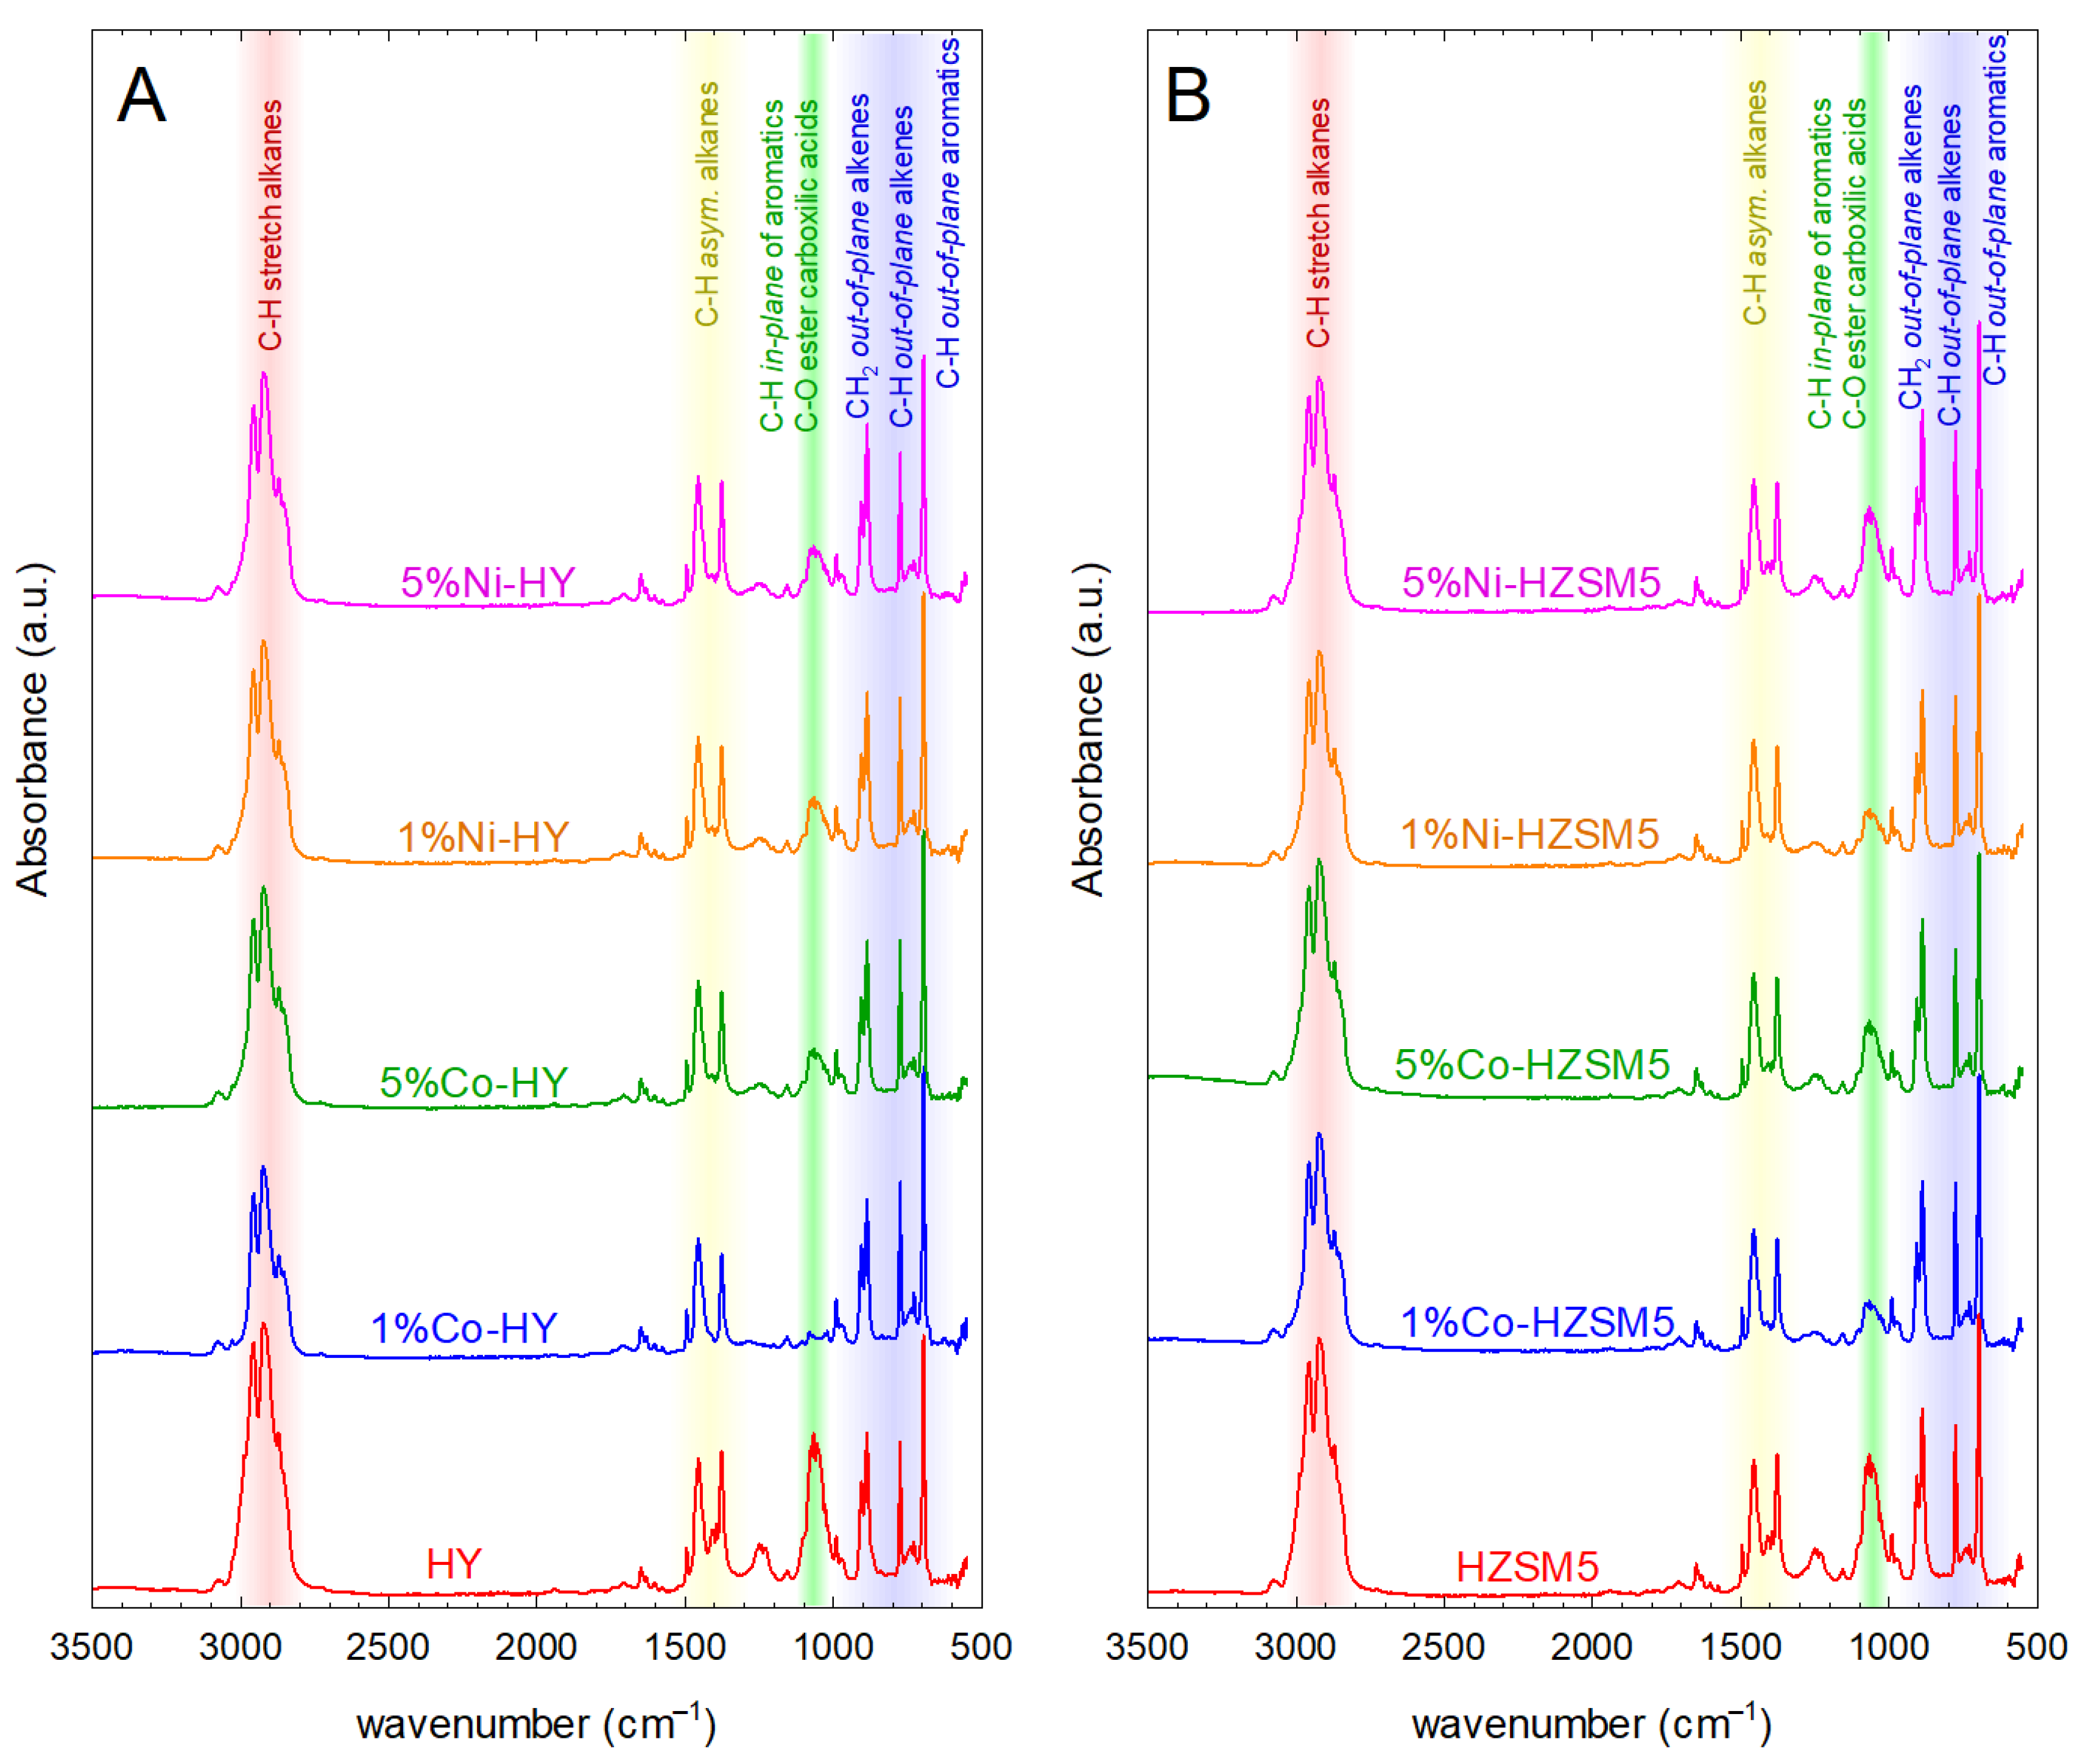
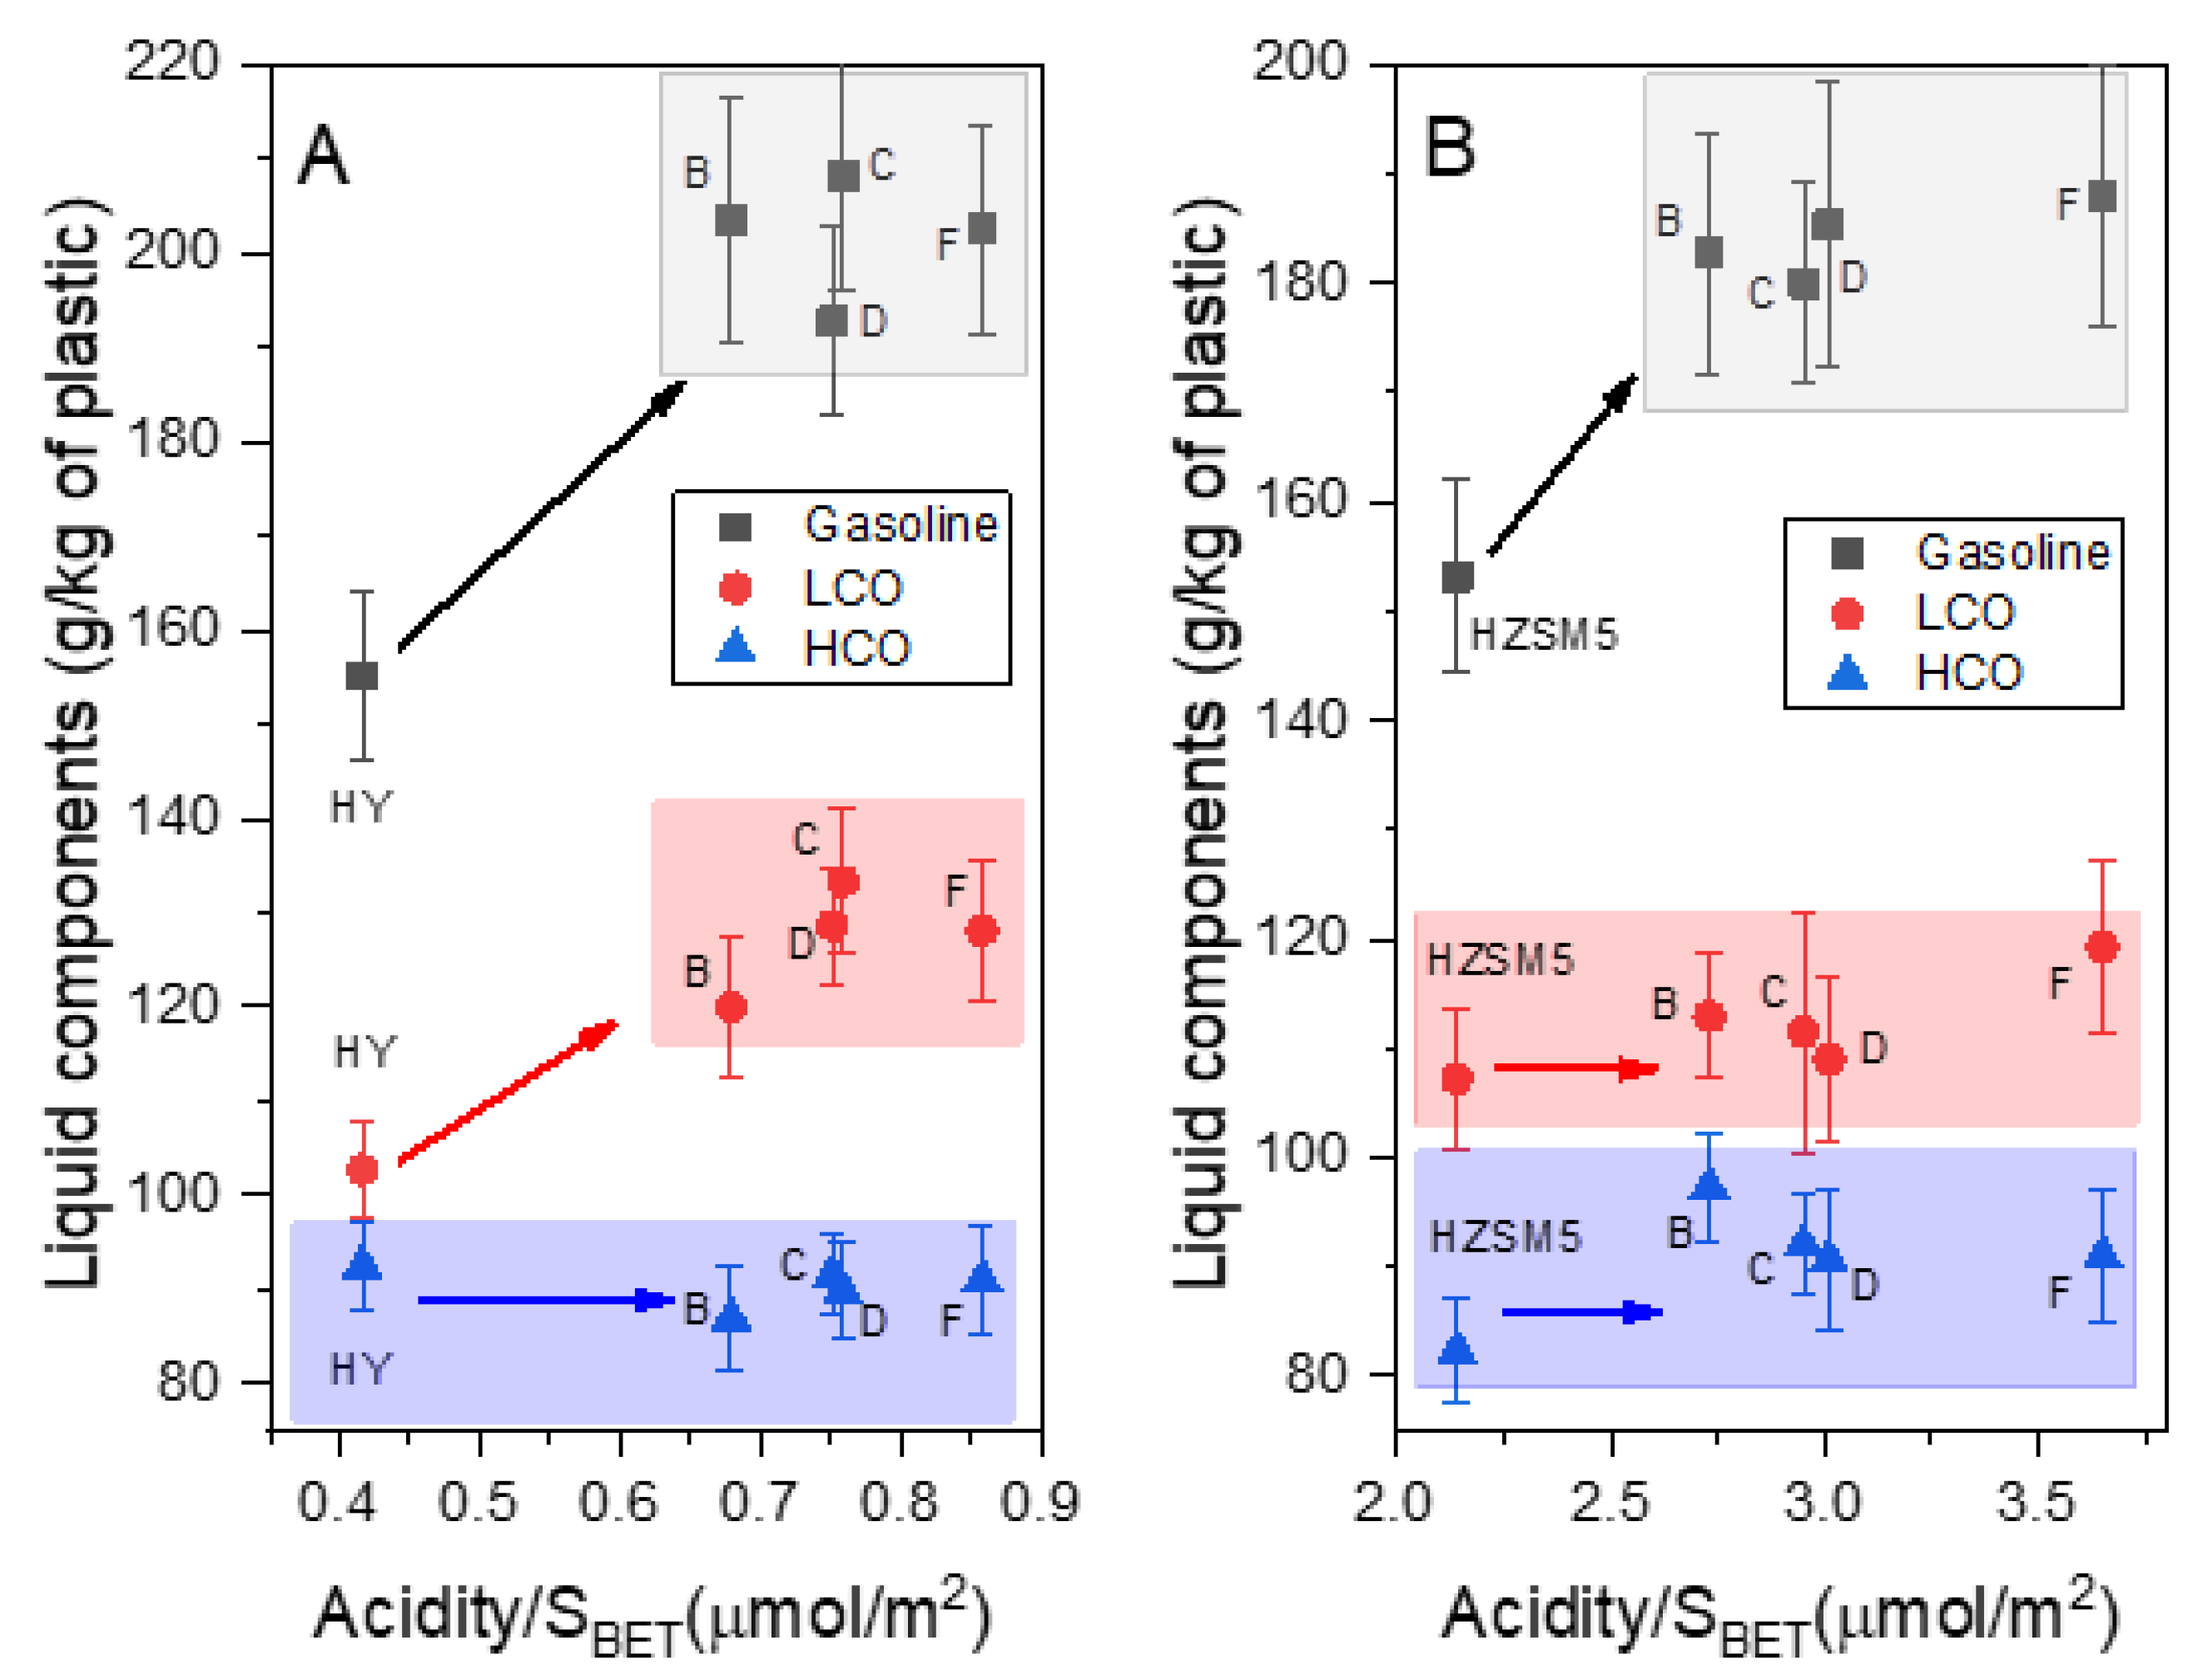
2.2.1. Effect on Product Yields and the Functional Groups of the Liquid Products

As can be seen in Table 2, the HY and HZSM5 provide a gas, liquid, and char fraction (%wt.) of 58.1 ± 2.2, 35.0 ± 2.2 and 6.9 ± 0.6, and 58.3 ± 2.7, 34.3 ± 2.7 and 7.5 ± 0.6, respectively. Compared to the native zeolites, the metal-impregnated zeolites showed a small decrease in gas production (~50%wt.) and increased liquid yield (42%wt.). This observation was especially evident for tests with metal-impregnated zeolite HY materials, which presented an average enhancement factor for the liquid fraction of 1.22. On the other hand, the gas fraction for metal-modified HY materials was 1.1. These factors were less pronounced for the samples that contain the HZMS5 support as the majority component, in which values of 1.1 (enhancement factor for the liquid fraction) and 1.05 (reduction factor for the gas fraction) were obtained. The char fraction showed negligible differences for zeolite references (HY and HZSM5) and metal-modified materials, with values ranging between 6.6 and 7.2 5%wt. The final Coke/Catalyst ratio, expressed also in %wt., was usually below 6.5% and 3% for HY- and HZSM5-related samples. Other researchers, such as Razzaq et al. (2019), previously informed us of their investigation of using metal-impregnated HZSM-5 in the co-pyrolysis of polystyrene and wheat straw [46]. Regarding the carbon deposition, expressed as the mass of coke relative to the total mass of the recovered catalyst after pyrolysis, no valuable influence was monitored. In most of the experiments, an increase was detected; in other cases, a small reduction was observed. Certain reactions between compounds of pyrolytic vapors, such as dehydrogenation or polymerization, can cause the deposition of coke, which causes the deactivation of catalysts [47,48].
By obtaining high liquid product yields in pyrolysis, a reduction in the dependency on fossil fuels can be achieved since the process can provide an alternative source of energy by converting plastic waste into valuable fuels obtained from pyrolysis oil, which can be used as a substitute for conventional fossil fuels. On the other hand, low liquid product yields may result in a less economically viable solution.
Other authors like Akubo et al. [49] or Razzaq et al. [46] reported similar results in their investigations about the catalytic pyrolysis of different types of plastics over metal-impregnated zeolite catalysts. For example, Akubo et al. [49] investigated the catalytic cracking of the vapors produced by the high-density polyethylene (HDPE) pyrolysis over Y zeolite impregnated with Ni at 600 °C for 30 min in a two stages reactor. The authors only reported small differences in oil and gas yields compared to the native Y zeolite. However, these researchers obtained a significant increase in carbon deposition on the metal-Y-zeolite catalyst. Additionally, Razzaq et al. [46] indicated increased liquid product yield when wheat straw and polystyrene (PS) were co-pyrolyzed in a fixed bed reactor using metal-impregnated HZSM5 zeolite.
Regarding the functional group analysis of the liquid products, Figure 5 shows the results of FTIR spectra of all liquid products. It is expected that the liquid fraction will be a heterogeneous mixture with a multitude of components, which makes its identification relatively complicated. In fact, the spectra obtained using FTIR showed no appreciable differences between samples. In general, it is possible to identify functional groups at 2850 and 3000 cm−1 which corresponds to C-H stretch of diverse saturated and unsaturated aliphatic and aromatic compounds; contribution around at 1650 cm−1, C=C stretch of alkenes; at 1495 cm−1, C=C stretch in the ring of aromatic compounds; at 1375 cm−1, C-H asymmetric of alkanes; at 1075, 1067 and 1056 cm−1. C-O bond stretch associated with the existence of carboxylic groups or esters and C-H in-plane of aromatics; at 885 and 775 cm−1, CH2 out-of-plane of alkenes and C-H out-of-plane of alkenes; and at 695 cm−1, C-H out-of-plane of aromatics were detected as well [50]. Differences between samples are discussed in terms of fuel fractions of interest (e.g., gasoline, LCO, etc.), where various component compounds are grouped using simulated distillation as described below. This chromatographic approach allows for effective identification with better applicability, considering that it identifies fuel fractions that dominate the current energy sector.

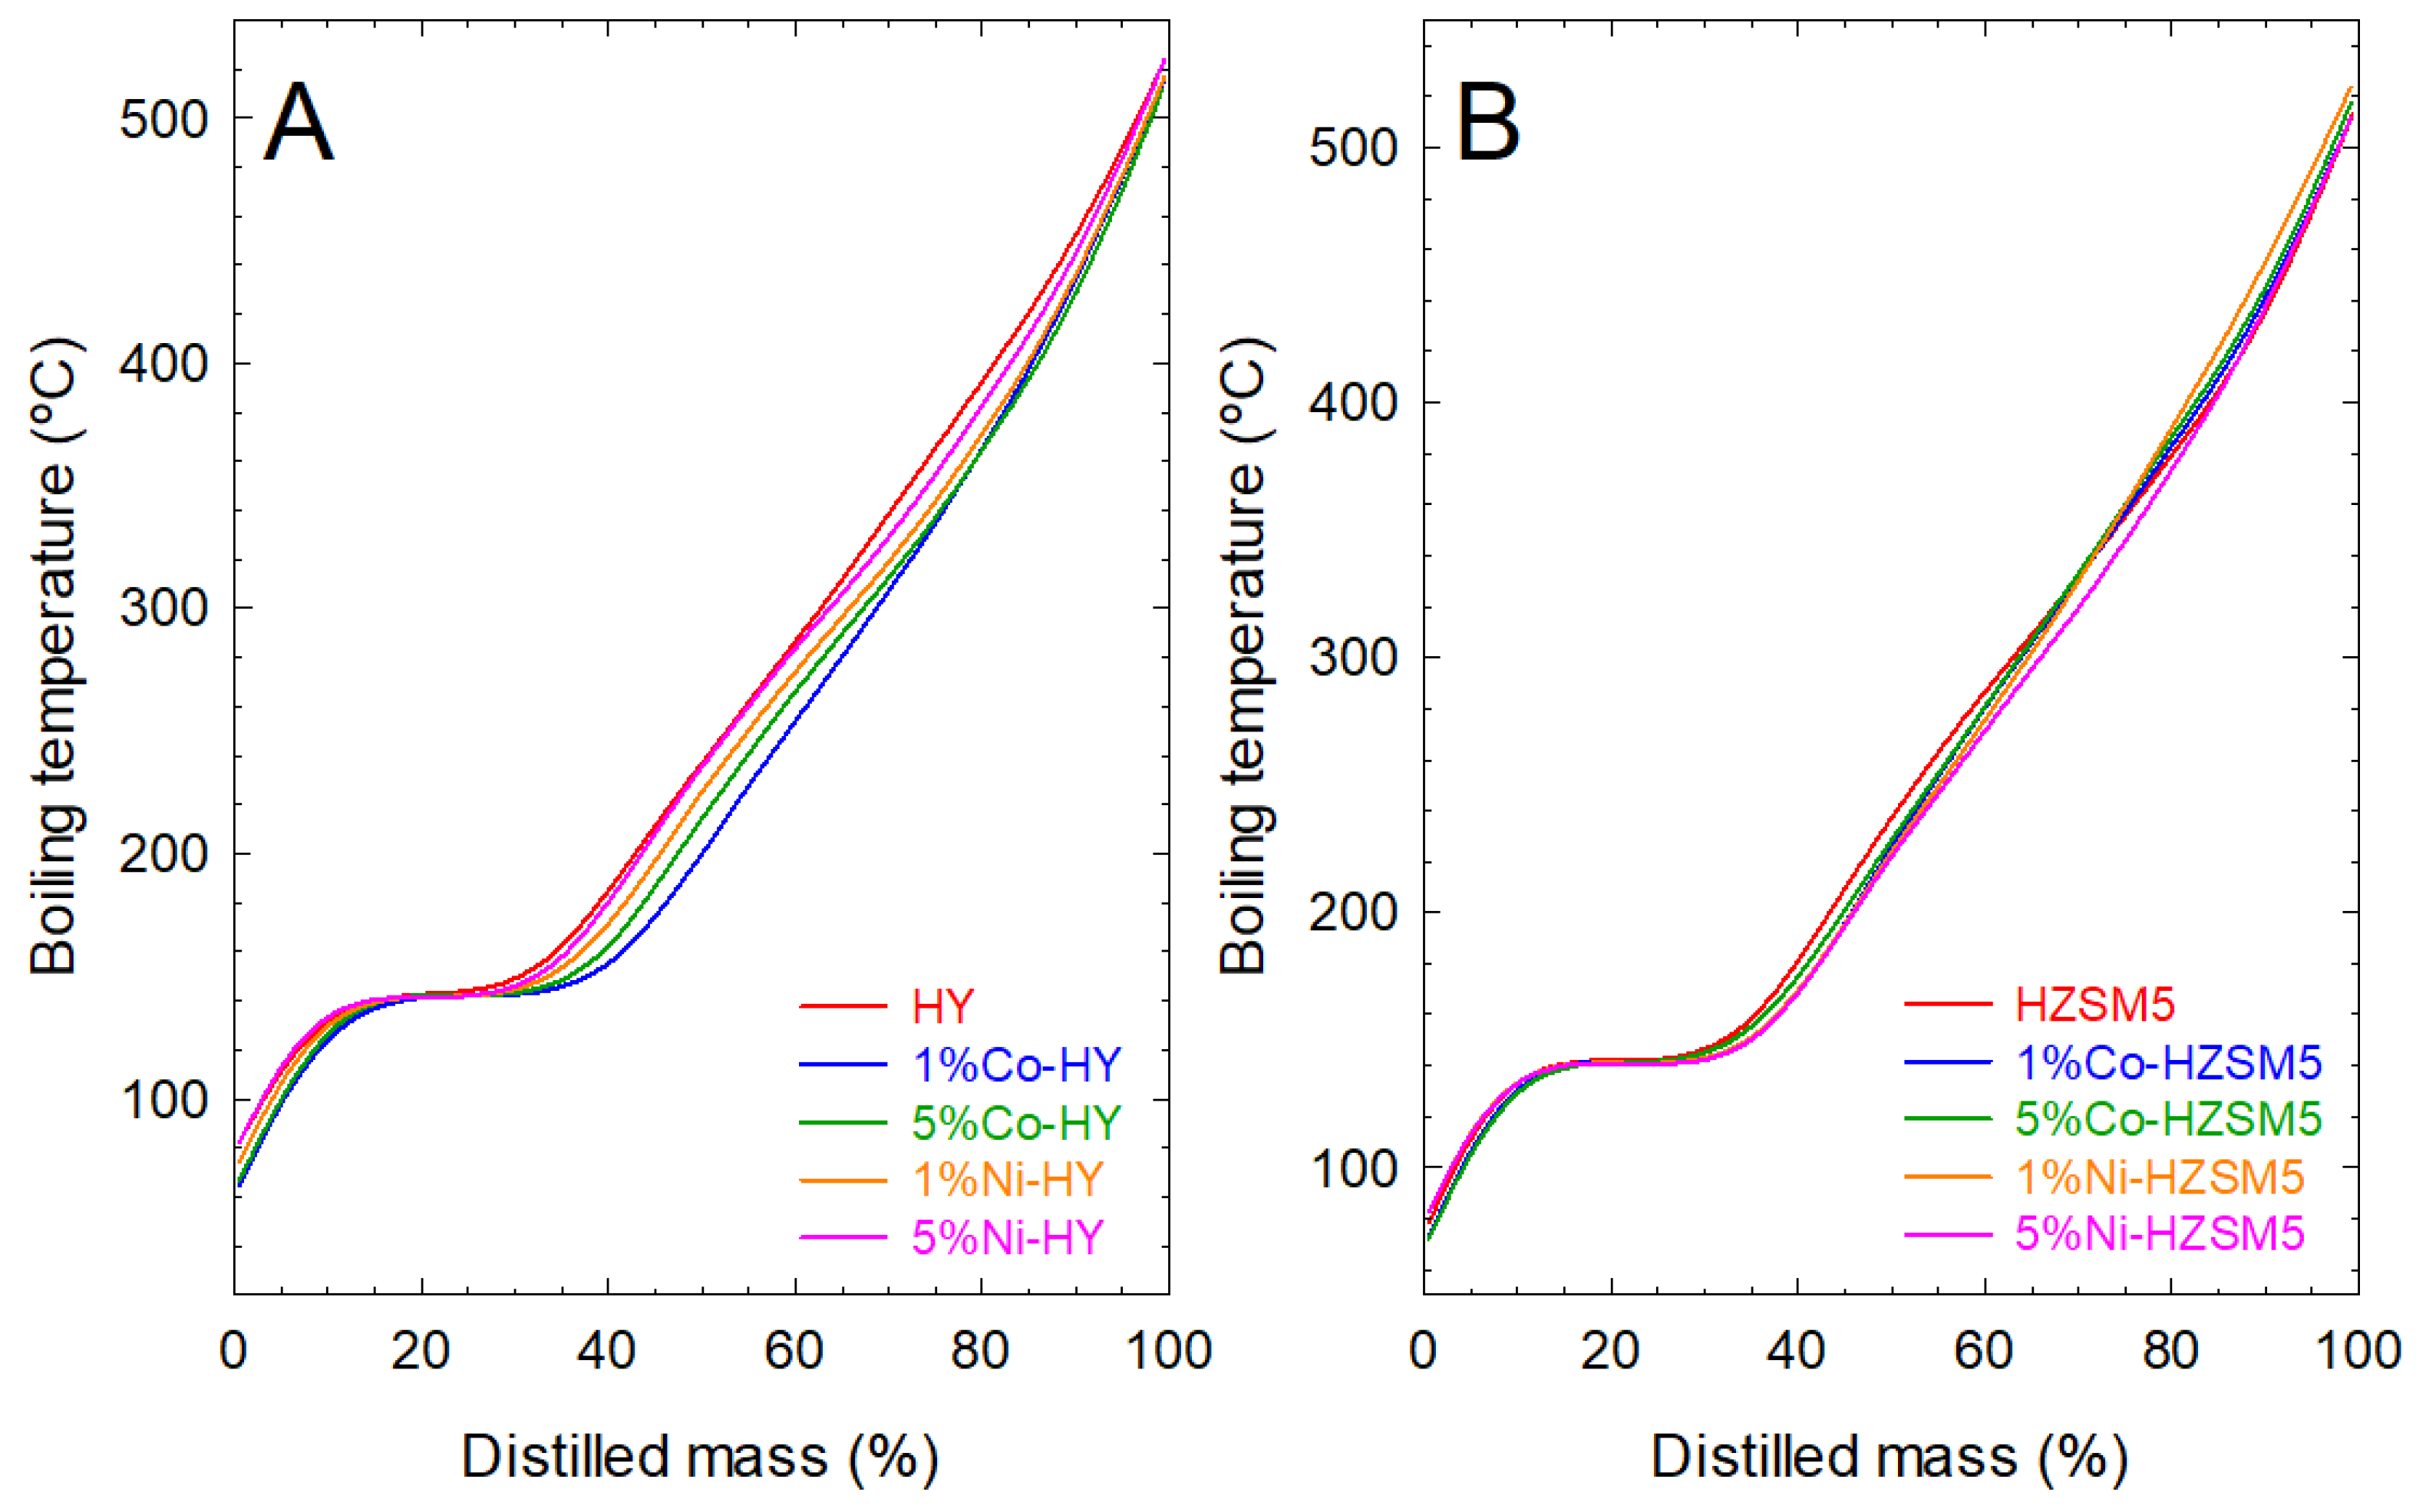
2.2.2. Effect on Simulated Distillation Boiling Points of the Liquid Products

The simulated distillation curves of the liquid product obtained from the thermal and catalytic pyrolysis of the mixture of post-consumer plastic waste are shown in Figure 6.
Although the differences between the curves are minimal, the detailed examination of Figure 6A suggests that impregnation with metals of HY zeolite generally reduced the boiling temperatures of the components of the liquid product compared to the catalytic pyrolysis over native zeolite. Conversely, no significant changes are observed in the boiling point distributions of liquids derived from native HZSM5 and metal-impregnated HZSM5 materials (Figure 6B).
Table 3 and Table 4 report the weight percentage of common fractions in pyrolysis oil obtained from catalytic pyrolysis over native and metal-impregnated zeolites. The predominant product of all liquids was the gasoline-range product, with total mass percentages between 44.28% and 50.29%. Additionally, most of the gasoline was mid-naphtha, with percentage values ranging from 30.75% to 36.36%. In our previous work [51], the oil liquid from the thermal pyrolysis (without any catalytic material) of the same mixture of plastic waste had a distribution of 47.7% gasoline, 22.1% LCO, and 30.2% HCO. In general, it is a more liquid product richer in heavy compounds, at least in HCO-range products.
The presence of cobalt in the HY catalyst seems to slightly increase the amount of light and mid-naphtha. On the contrary, impregnation with cobalt decreases the yield of products in the HCO range. The presence of Ni in the HY catalysts has a similar, but even less measurable, effect.
In the case of the HZSM5 catalyst, the presence of metals has practically no effect on the percentage of the fractions. The results of the simulation distillation curves obtained with the zeolite impregnated with metals are very similar to those found with the catalyst without metal, and variations can be attributed to the accuracy of determining such values.
However, although the composition of the liquid fraction obtained from the catalytic pyrolysis of the mixture of plastic waste did not show remarkable differences in the function of the zeolite used (native or metal-impregnated), the total production of liquid compounds changed due to the differences in liquid product yields obtained.
Table 5 reports the yields of the different types of products obtained from the catalytic pyrolysis over the different catalytic materials studied in this work, evaluated as g by kg of plastic waste. The major yield was observed for the gasoline-range product in oils from catalytic pyrolysis over metal-impregnated zeolites, with values ranging between 179.4 and 208.3 g by kg of plastic waste. Lower gasoline production, 155.1 and 153.2 g by kg of plastic, was observed in liquid oil from the catalytic pyrolysis over native zeolite HY and HZSM-5, respectively. If the results of Table 5 are compared to those of thermal pyrolysis (240.4 g by kg of plastic for gasoline, 111.4 g by kg of plastic for LCO-range product, and 152.2 g by kg of plastic for HCO-range product), a lower production of gasoline and HCO products was observed [51].
Figure 7 shows the relationship between gasoline, LCO, and HCO product yields (data in g by kg of plastics waste) and absolute acidity (Acidity/SBET, μmol NH3/m2) obtained from catalytic pyrolysis over native and metal-impregnated zeolites.
According to the obtained data, there is no clear relation between SBET and the obtained fraction (data not analyzed). However, the acidity properties seem to be relevant to producing liquid fractions, which can be grouped as fractions with LCO and/or gasoline properties. Further, such correlation is expressed as acidity normalized by the superficial area, providing the data presented in Figure 7, which considers that the interaction occurs on the active catalytic surface by interaction with the metal-support active sites. The observable (acidity/SBET) ratio allows for the analysis of both morphologic and acidity (two of the main properties of aluminum-silicate materials) as a combined factor and its influence on the catalytic response of the catalyst. With this approach, it is possible to identify the influence of the acidity normalized by the surface area (observable acidity/SBET), which is related to the availability of active sites for selective production of interest fractions like gasoline. Concerning the acidity/SBET ratio, the rise of metal concentration increased for HY and HZSM-5 zeolites; HY with Ni augmented from 80% up to 106% and with Co from 63% to 82% while HZSM5 with Ni rushed from 38% to 71% and 27% up to 41% with Co. An increase in gasoline production was observed when metal was introduced into the zeolites. The higher the amount of metal in the zeolite, the higher the absolute acidity and the higher the gasoline production. This result is less pronounced in the production of the LCO fraction, which increases to a lesser extent with the introduction of the metal and the increase in absolute acidity for the HY catalyst. In contrast, for the HZM-5 catalyst, there is practically no variation. Additionally, the data in Figure 7 suggests that no influence of impregnation with cobalt or nickel was detected in the production of HCO. In any case, and although understanding the behavior of catalysts under reaction conditions during the production of a specific fraction is complex, the data presented in Figure 7 suggest that the improvement in the lightest fractions (mainly gasoline) is associated with the increase in the value of the combined parameter here defined as Acidity/SBET.
The composition of the gasoline-like fractions of liquid products is summarized in Table 6. The gasoline fraction contained paraffins, naphthenics, and aromatic hydrocarbons. There were no considerable differences in the composition of the gasoline fraction obtained over several metal-impregnated zeolites. Only a slight increase in naphthenic content and a slight decrease in aromatics were noticed when metal-impregnated HZSM-5 zeolites were used as catalysts. Therefore, incorporating metal (cobalt or nickel) generated insignificant changes in the performance of commercial HY and HZSM-5 zeolites concerning gasoline liquid composition. Other authors studying the pyrolysis of plastics and biomass over different catalysts found similar results regarding the addition of promoter cobalt and nickel as promoter metals onto zeolite catalysts [49,52,53]. However, other researchers reported that loading a certain amount of metal onto the zeolites and activated carbons gave more aromatics content than metal-free catalysts [11,20,22,28].

3. Materials and Methods

3.1. Raw Material

The mixture of plastic waste used in this study came from the rejected plastic fraction obtained from the solid urban waste treatment plant in Granada (Spain). The average composition of the plastic mixture was as follows: 56.10% of polypropylene (PP), 10.05% of expanded polystyrene (EPS), 8.55% of high impact polystyrene (HIPS), 12.65% of polypropylene film (PP film), and 12.65% of films of different polymer materials (non-PP film). Detailed information about the raw material and its characterization can be found in our previous work [51].

3.2. Preparation and Characterization of the Catalysts

The commercial zeolites used in this work were HZSM-5 ammonium zeolite (SiO2/Al2O3 molar ratio, 30) and hydrogen Y-zeolite (SiO2/Al2O3 molar ratio, 5.2) provided using Alfa Aesar © (Ward Hill, MA, USA).
For mechanical properties stabilization, the generation of the active phase, and the definition of a pore distribution size [54], the purchased zeolites were first calcined for 3.5 h at 550 °C using a tubular furnace of Nabertherm (L 3/11/B180 Model, Nabertherm, Lilienthal, Alemania) under an air atmosphere. Then, the zeolites were impregnated using the incipient wetness method, which involves adding a liquid solution to the solid sample until the first signs of wetting are observed. We used aqueous solutions of Ni(NO3)2 and Co(NO3)2·6H2O salts to get a loading of 1% and 5% (wt.), typical concentration values of the minor components (metallic-related species) in the final catalyst. This method was chosen to achieve uniform distribution of the active component. Finally, to promote the formation of crystalline metal oxides, after the impregnation step, the catalytic materials were dried for 24 h at 80 °C and activated by calcination for 3.5 h at 550 °C under an air atmosphere [54].
The crystalline structure of the metal-impregnated zeolites was assessed using X-ray diffraction (XRD) technique in a Bruker D8 Discover device (Bruker, Massachusetts, Estados Unidos) equipped with a Pilatus3R 100K-A detector working with radiation of Cu Kα (λ = 1.5406 Å). The diffractograms were recorded in 2θ within 3 and 80° (0.02° per step, 30 s per step). The software QualX2.0® was used to process the diffractograms, and the estimation of the peak properties for the quantification of the crystal size was realized using the Scherrer equation [55]. The Crystal Open Database (COD) was used for the crystal phase identification of the zeolites.
X-ray Photoelectron Spectroscopy (XPS) was applied for the study of the surface of the materials in a Kratos AXIS UltraDLD device (Kratos Analytical, Manchester, UK) working with an X-ray source from Al Kα. CASAXPS (version 2.3.15) software was used for the analysis. The spectra were referenced to the C1s peak (284.6 eV).
The textural properties were analyzed using N2 physisorption. The N2 adsorption–desorption isotherms at −196 °C were conducted in an ASAP® 2429 instrument from Micromeritics® (Micromeritics Instrument Corporation, Norcross, GA, USA). Samples were previously outgassed at 150 °C under vacuum overnight. The total surface area (SBET) was determined using the standardized Brunauer-Emmett-Teller (BET) method. The total pore volume (VT) was calculated from the N2 adsorption uptake at p/p0~0.99. The t-plot method was used to quantify the contribution of micropores on the surface (SMP) and volume (VMP). The Barrett, Joyner, and Halenda (BJH) method was applied to obtain the pore width (Dp) distribution and the average 4V/A value (Dave) of mesopores.
The surface acidity was analyzed using chemisorption by ammonia Temperature Programmed Desorption (TPD) in an AutoChem II 2920 analyzer from Micromeritics®, equipped with Thermal Conductivity Detector (TCD). Before chemisorption, the samples were pretreated at 450 °C under He atmosphere for 1 h and cooled to room temperature. The NH3-TPD analysis was carried out using 50 mL min−1 of 10% of NH3 in He mixture from room temperature up to 800 °C with a rate of 30 °C min−1.

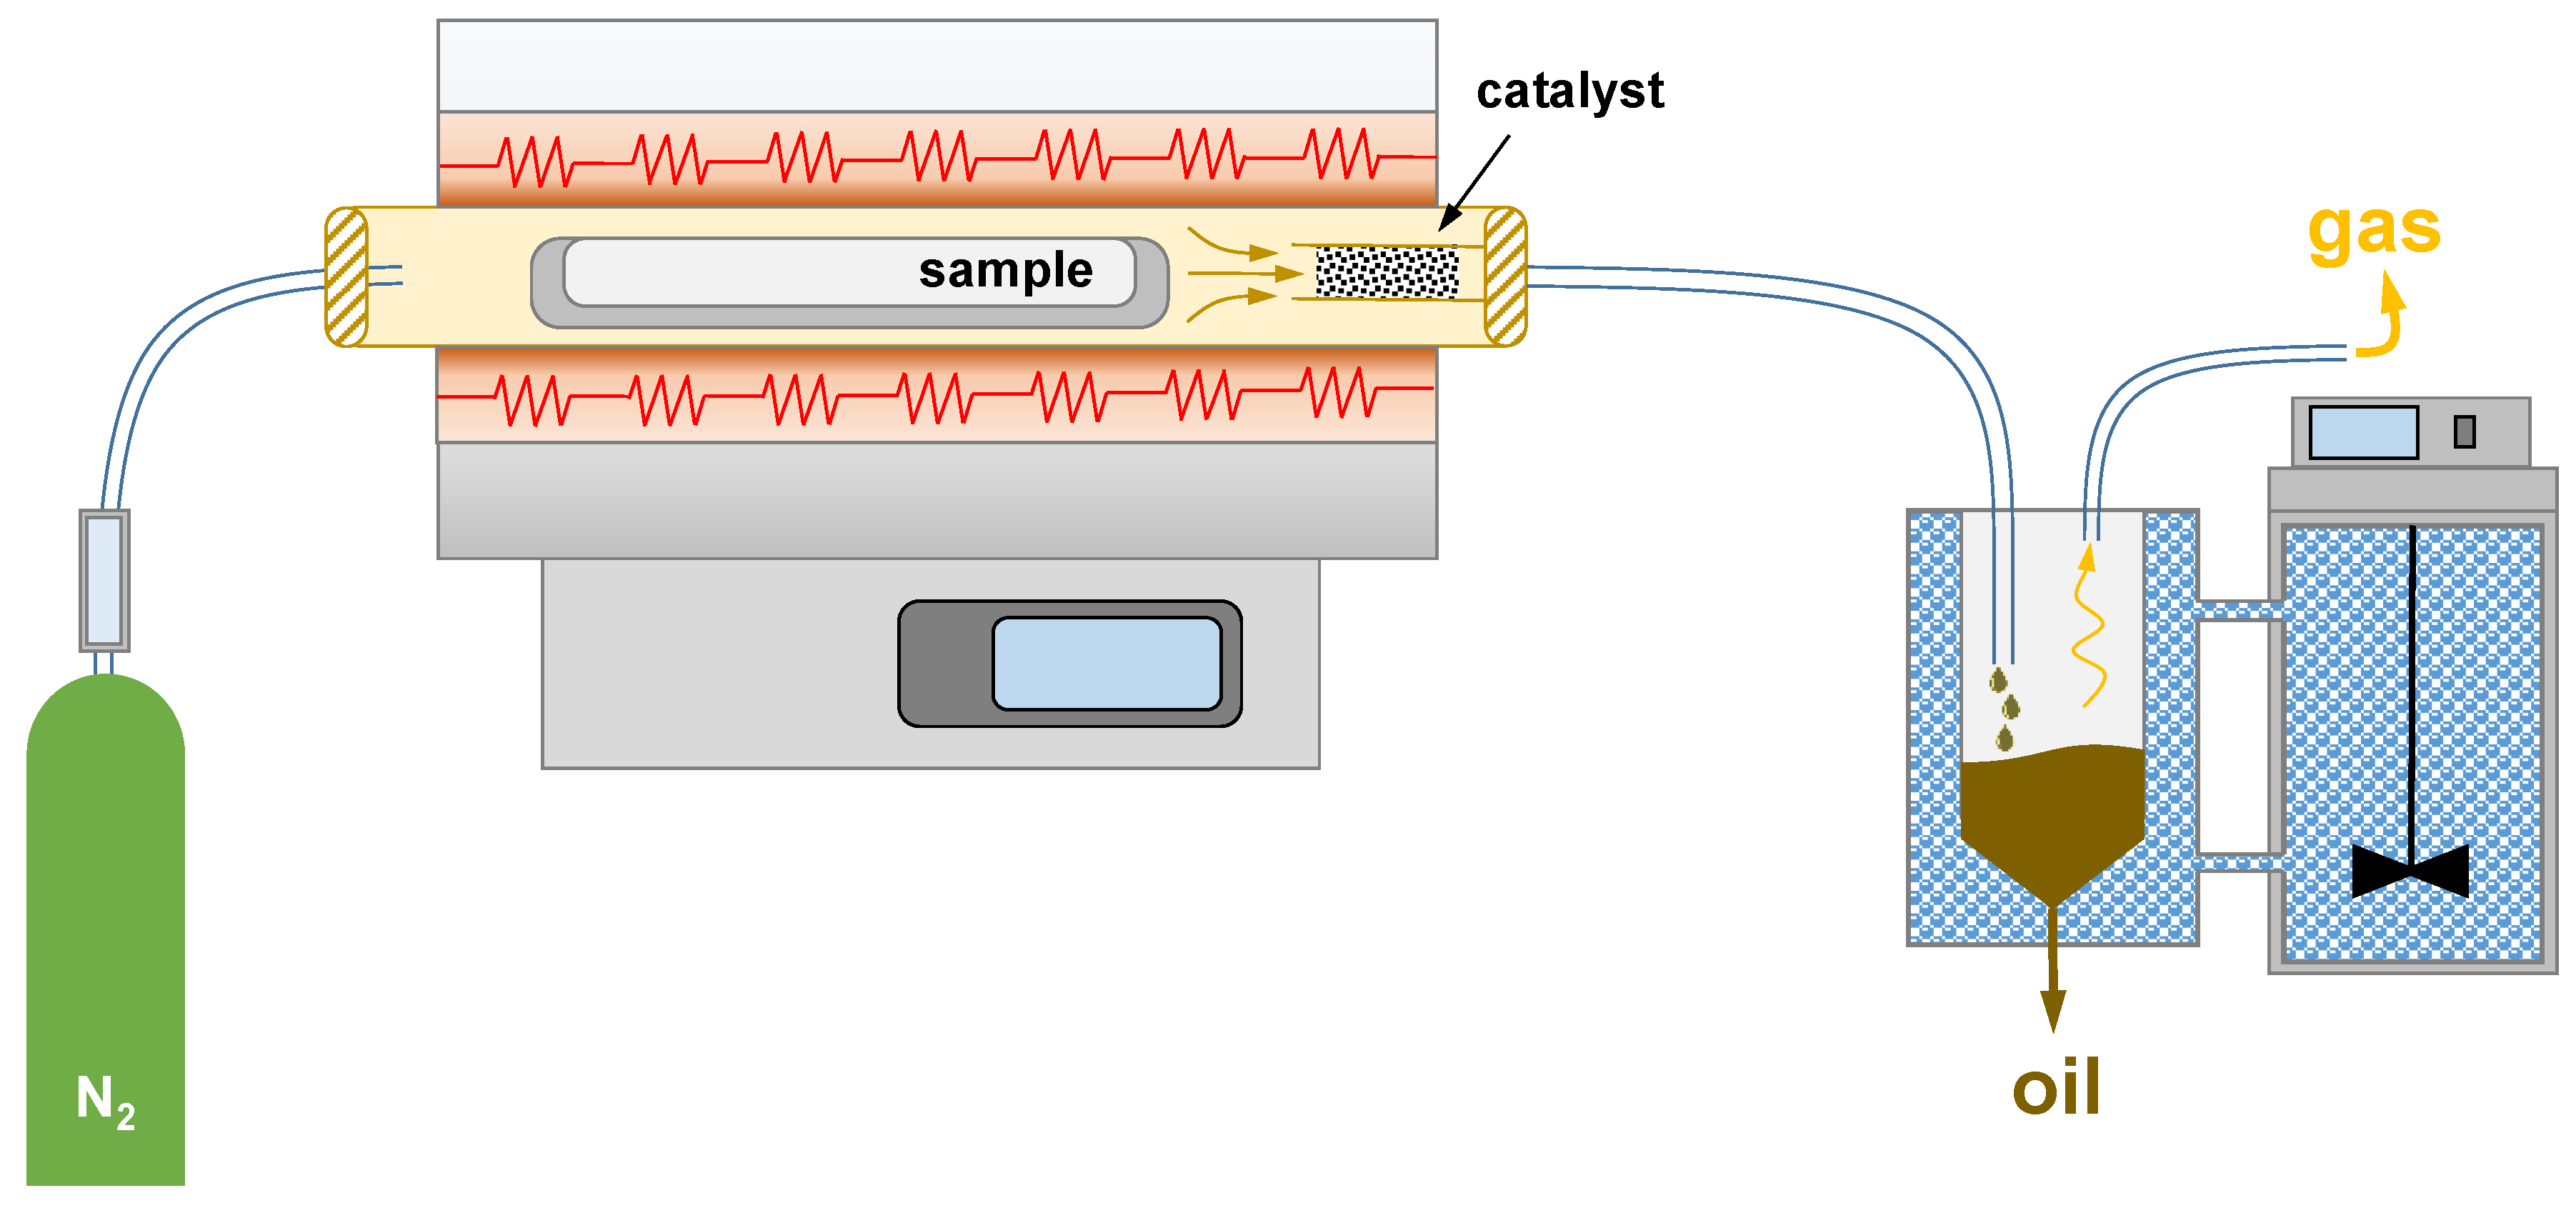
3.3. Pyrolysis Reactor and Pyrolysis Conditions

The pyrolysis experiments were carried out on a tubular horizontal reactor made of stainless steel 316 (internal diameter: 4 cm and length: 43.25 cm) inserted in a Nabertherm R 50/250/12 model furnace. A flowmeter and a chiller were integrated to regulate the nitrogen flow and condense the final vapors. Figure 8 provides a scheme of the experimental setup.
About 20 g of sample was placed in a closed tubular vessel (internal diameter: 27.25 mm and length: 30.6 cm) made of stainless steel and approximately 1 g of catalytic material into a basket at the radiant zone end of the reactor, then heated to up to 500 °C at a rate of 10 °C/min, optimum conditions for maximizing the liquid yield, according to previous work [56]. Finally, the temperature was maintained for 60 min with a constant flow of 0.8 L/min N2. After that, the furnace was cooled to room temperature under a permanent N2 purge of 0.2 L/min. The condensate product was collected in a glass vessel submerged in a cooling bath at −7 °C. The tubular vessel, basket, and condenser were weighed before and after each pyrolysis experiment.
The solid, liquid, and gas product yields were calculated according to the following equations:
η l = m l m m . 100
η s = m s m m . 100
η g = 100 η l + η s
where the weights are represented by mm, m l , and m s correspond to the mass of the total plastic sample, liquid, and solid products, respectively, and the yields of liquid, solid, and gas are indicated by η l , η s and η g , respectively. All experiments were carried out in triplicate, and a relative standard deviation was provided.
The determination of deposited carbon onto the catalysts, namely coke, was carried out from the recovered catalyst after the pyrolysis tests. A two-stage thermal decomposition was programmed over 20 mg of spent catalyst in a PerkinElmer TGA (Waltham, MA, USA) thermobalance (model STA6000). The first stage (stripping) was carried out under an N2 atmosphere with a constant flow of 20 mL/min, raising the temperature from 30 °C to 500 °C under a heating rate of 15 °C/min. The end temperature was maintained for 30 min, and then, in the second stage, the gas changed from N2 to O2, promoting fast combustion from 500 to 550 °C. The loss weight enabled the determination of the volatile fraction (first stage) while the non-volatile fraction, named carbon deposition or coke (second stage), was calculated as follows:
η c = w i w f w f . 100
the carbon deposition yield is represented by η c , while the sample weights at the start and end of the combustion stage are depicted by w i and w f .

3.4. Liquid Product Analysis

The nature of the oils was qualitatively analyzed using Fourier Transform InfraRed spectroscopy (FTIR) by identifying functional groups. A Perkin Elmer Spectrum 65 FTIR device was used to record the spectra between the frequency range of 4000 and 400 cm−1 under a resolution of 1 cm−1.
The identification of the gasoline chemical composition present in the oil samples was performed using gas chromatography coupled with Mass Spectrometry (GC-MS/MS) according to the ASTM D2789 method summing of characteristic mass fragments [57]. The separation of the analytes was performed in an 8860 Agilent GC system (Agilent Technologies, Santa Clara, CA, USA) equipped with a Phenomenex column of a nonpolar phase, i.e., ZB-5 ms (30 m long, 0.25 mm internal diameter, and 0.25 µm of fill thickness), and the mass of the ionized analytes was determined in a triple-quadrupole mass spectrometer detector (5977 model from Agilent, with ionization energy by the electronic impact of 70 eV and a scan speed of ≤20,000 Da/s. The oven was programmed with the same injection temperature (240 °C). The starting temperatures were 40 °C for 5 min, while the ending temperatures reached 240 °C by 6 min at 15 °C/min heating rates. The oil samples were diluted in 1 mL of chloroform and injected in split mode (5:1) with a constant flow of 1 mL/min of He.
A mixture of hydrocarbons encompassing the boiling range specified by the ATSM D 2887 [58] was used as a reference to identify gasoline’s retention times and the boiling temperature. Referential hydrocarbons were also confirmed using the NIST 08 mass spectrum library database from the National Institute of Standards and Technology (NIST).
The boiling points of each compound in the sample were calculated based on the retention times and boiling points of the standards according to the following linear interpolation:
B P x = B P 2 B P 1 R T 2 R T 1 R T x R T 1 + B P 1
where the boiling points and retention times of the standards are represented by B P 1 , B P 2 and R T 1 , R T 2 , while the retention times and boiling points of the sample compounds are represented by R T x and B P x .
The simulated distillation (SD) at high temperature by gas chromatography (GC) was used to characterize the boiling temperature distribution of the oils, setting the contribution of the light, medium, and heavy fractions. Determination of the distribution of the boiling range of the compounds identified in the chromatograms was performed according to the ASTM D2887 standard [58] using a PerkinElmer Clarus 590 Gas Chromatograph with a dimethylpolysiloxane ELITE 2887 capillary column of 10 m length and 0.53 of inner diameter and 2.65 μ m of film. Viscous samples were diluted with carbon disulfide.
The distribution of products was quantified in weight percent according to their boiling points. Compounds with boiling points between 35 °C and 205 °C were classified as gasoline-range products. Those with values ranging from 205 °C to 370 °C were labeled light cycle oil (LCO). Finally, those whose boiling temperature was over 370 °C were accounted for the heavy cycle oil (HCO) fraction. Table 7 summarizes the main products, the common fractions, and their nominal boiling points.

4. Conclusions

The contribution describes the development of new composite materials with potential applications as catalysts during the pyrolysis of real non-recyclable mixtures of post-consumer plastic waste. Two zeolitic materials, HY and HZSM-5, were modified, and a simple method was employed to deposit Ni and Co on their surfaces to improve the catalytic response toward obtaining fuel fractions of interest.
The catalytic materials, both references (HY and HZSM-5) and materials containing the precursor metals (Ni and Co modified samples) were characterized in terms of their structural, morphological, and chemical properties. The results show limited structural modifications according to XRD spectra results, where the most relevant results are associated with a lack of Co oxides, which could indicate that the Co minor phase may have been exchanged in certain positions of the zeolitic structure. More important were the detected modifications of acidity properties. A new third peak was recorded (compared to zeolites not modified with metals) in all samples containing the metallic-related element, which generated a clear increase in the total acidity of the sample. In addition, the modification of morphological properties by including metallic components on the surface of the active zeolitic supports was detected. The BET area and pore volume reduction detected can be associated with the accumulation of metallic components blocking certain pore channels of the zeolite.
In terms of activity, differences in the product amount of char, gas, and liquid are not relevant between samples modified with metals and the active supports HY and HZSM; however, a noticeable relationship has been detected between the quantity produced of a certain liquid fuel fraction (grouped as gasoline, light cycle oil, and heavy cycle oil) and a parameter defined in this work as Acidity/SBET, expressed in μmol NH3 per m2 of catalytic surface. In all cases, it was detected that the increase in the amount of gasoline fraction that can be extracted from the plastic waste is associated with this parameter, which relates to the morphological and chemical properties of the samples. Furthermore, considering the experimental error, it can also be concluded that for the HY-based materials, this combined parameter is also relevant to producing the light cycle oil fraction.
In an energy context still dominated by traditional fractions (gasoline, kerosene, etc.) obtained from oil refining processes, this work presents a relevant waste recovery alternative since it provides advances in producing fuels from plastic waste that could be used directly or with small treatments.
The analysis has demonstrated the potential value-added fuels that can be derived from the liquid oil product. However, it is crucial to investigate the environmental and economic feasibility of using pyrolysis oils as a renewable energy source on a larger scale and explore the potential of integrating pyrolysis technologies with existing industries. Additionally, a deep investigation of the potential of pyrolysis byproducts, such as char, in adsorption applications or carbon sequestration initiatives is needed. Therefore, further research and development in this field are of utmost importance to fully exploit the potential of the liquid oil product and minimize its environmental impacts.

Author Contributions

Conceptualization, M.C., G.B., M.J.M.-B. and M.Á.M.-L.; methodology, G.B., M.F.P.-S. and M.C.; validation, M.F.P.-S., G.B. and R.R.S.; formal analysis, M.F.P.-S. and G.B.; investigation, M.F.P.-S., M.C., G.B., R.R.S., M.J.M.-B. and M.Á.M.-L.; resources, M.C. and M.Á.M.-L.; data curation, R.R.S., M.J.M.-B. and M.Á.M.-L.; writing—original draft preparation, M.F.P.-S., M.Á.M.-L. and R.R.S.; writing—review and editing, M.J.M.-B. and M.Á.M.-L.; supervision, M.J.M.-B., M.Á.M.-L., M.C. and G.B.; project administration, M.Á.M.-L. and M.C.; funding acquisition, M.C. and M.Á.M.-L. All authors have read and agreed to the published version of the manuscript.

Funding

This research was funded by project PID2019-108826RB-I00/SRA (State Research Agency)/10.13039/501100011033.

Data Availability Statement

The data presented in this study are available.

Acknowledgments

The authors acknowledge the support provided by the external services of the University of Granada (“Centro de Instrumentación Científica”, CIC) for the support with the characterization of the catalysts.

Conflicts of Interest

The authors declare no conflicts of interest.

References

  1. United Nation Environment Programme. Single-Use Plastics: A Roadmap for Sustainability; Canno, T., Ed.; United Nations Environment Programe: Nairobi, Kenya, 2018. [Google Scholar]
  2. Plastics Europe. Plastics Europe Association of Plastics Manufacturers Plastics—The Facts 2021 An analysis of European Plastics Production, Demand and Waste Data. In Plastics-Facts 2021; Plastics Europe: Bruxelles, Belgium, 2021; p. 34. Available online: https://plasticseurope.org/knowledge-hub/plastics-the-facts-2021/ (accessed on 1 January 2024).
  3. Wan, Y.; Chen, X.; Liu, Q.; Hu, H.; Wu, C.; Xue, Q. Informal landfill contributes to the pollution of microplastics in the surrounding environment. Environ. Pollut. 2022, 293, 118586. [Google Scholar] [CrossRef] [PubMed]
  4. Su, Y.; Zhang, Z.; Wu, D.; Zhan, L.; Shi, H.; Xie, B. Occurrence of microplastics in landfill systems and their fate with landfill age. Water Res. 2019, 164, 114968. [Google Scholar] [CrossRef] [PubMed]
  5. Sun, J.; Zhu, Z.-R.; Li, W.-H.; Yan, X.; Wang, L.-K.; Zhang, L.; Jin, J.; Dai, X.; Ni, B.-J. Revisiting Microplastics in Landfill Leachate: Unnoticed Tiny Microplastics and Their Fate in Treatment Works. Water Res. 2020, 190, 116784. [Google Scholar] [CrossRef] [PubMed]
  6. European Commission. European Strategy for Plastics in a Circular Economy. EUR-Lex. 2018. Available online: https://eur-lex.europa.eu/legal-content/EN/ALL/?uri=CELEX%3A52018DC0028 (accessed on 23 November 2022).
  7. Scheirs, J.; Kaminsky, W. Feedstock Recycling and Pyrolysis of Waste Plastics: Converting Waste Plastics into Diesel and Other Fuels; John Wiley & Sons, Ltd.: West Sussex, UK, 2006. [Google Scholar]
  8. Kusenberg, M.; Eschenbacher, A.; Delva, L.; De Meester, S.; Delikonstantis, E.; Stefanidis, G.D.; Ragaert, K.; Van Geem, K.M. Towards high-quality petrochemical feedstocks from mixed plastic packaging waste via advanced recycling: The past, present and future. Fuel Process. Technol. 2022, 238, 107474. [Google Scholar] [CrossRef]
  9. Huysveld, S.; Ragaert, K.; Demets, R.; Nhu, T.; Civancik-Uslu, D.; Kusenberg, M.; Van Geem, K.; De Meester, S.; Dewulf, J. Technical and market substitutability of recycled materials: Calculating the environmental benefits of mechanical and chemical recycling of plastic packaging waste. Waste Manag. 2022, 152, 69–79. [Google Scholar] [CrossRef] [PubMed]
  10. Harscoet, E.; Chouvenc, S.; Faugeras, A.-C.; Ammenti-Deloitte, F. Chemical and Physico-Chemical Recycling of Plastic Waste; Final Report; Record: Villeurbanne, France, 2022; Available online: www.record-net.org (accessed on 1 January 2024).
  11. Peng, Y.; Wang, Y.; Ke, L.; Dai, L.; Wu, Q.; Cobb, K.; Zeng, Y.; Zou, R.; Liu, Y.; Ruan, R. A review on catalytic pyrolysis of plastic wastes to high-value products. Energy Convers. Manag. 2022, 254, 115243. [Google Scholar] [CrossRef]
  12. Verma, A.; Sharma, S.; Pramanik, H. Pyrolysis of waste expanded polystyrene and reduction of styrene via in-situ multiphase pyrolysis of product oil for the production of fuel range hydrocarbons. Waste Manag. 2021, 120, 330–339. [Google Scholar] [CrossRef]
  13. Wang, J.; Jiang, J.; Wang, X.; Wang, R.; Wang, K.; Pang, S.; Zhong, Z.; Sun, Y.; Ruan, R.; Ragauskas, A.J. Converting polycarbonate and polystyrene plastic wastes into aromatic hydrocarbons via catalytic fast co-pyrolysis. J. Hazard. Mater. 2020, 386, 121970. [Google Scholar] [CrossRef]
  14. Xue, Y.; Johnston, P.; Bai, X. Effect of catalyst contact mode and gas atmosphere during catalytic pyrolysis of waste plastics. Energy Convers. Manag. 2017, 142, 441–451. [Google Scholar] [CrossRef]
  15. Onwudili, J.A.; Muhammad, C.; Williams, P.T. Influence of catalyst bed temperature and properties of zeolite catalysts on pyrolysis-catalysis of a simulated mixed plastics sample for the production of upgraded fuels and chemicals. J. Energy Inst. 2019, 92, 1337–1347. [Google Scholar] [CrossRef]
  16. López, A.; de Marco, I.; Caballero, B.; Laresgoiti, M.; Adrados, A.; Torres, A. Pyrolysis of municipal plastic wastes II: Influence of raw material composition under catalytic conditions. Waste Manag. 2011, 31, 1973–1983. [Google Scholar] [CrossRef] [PubMed]
  17. Valizadeh, B.; Valizadeh, S.; Kim, H.; Choi, Y.J.; Seo, M.W.; Yoo, K.S.; Lin, K.-Y.A.; Hussain, M.; Park, Y.-K. Production of light olefins and monocyclic aromatic hydrocarbons from the pyrolysis of waste plastic straws over high-silica zeolite-based catalysts. Environ. Res. 2023, 245, 118076. [Google Scholar] [CrossRef] [PubMed]
  18. Yousef, S.; Eimontas, J.; Striūgas, N.; Abdelnaby, M.A. Synthesis of value-added aromatic chemicals from catalytic pyrolysis of waste wind turbine blades and their kinetic analysis using artificial neural network. J. Anal. Appl. Pyrolysis 2024, 177, 106330. [Google Scholar] [CrossRef]
  19. Muneer, B.; Zeeshan, M.; Qaisar, S.; Razzaq, M.; Iftikhar, H. Influence of in-situ and ex-situ HZSM-5 catalyst on co-pyrolysis of corn stalk and polystyrene with a focus on liquid yield and quality. J. Clean. Prod. 2019, 237, 117762. [Google Scholar] [CrossRef]
  20. Kartik, S.; Balsora, H.K.; Sharma, M.; Saptoro, A.; Jain, R.K.; Joshi, J.B.; Sharma, A. Valorization of plastic wastes for production of fuels and value-added chemicals through pyrolysis—A review. Therm. Sci. Eng. Prog. 2022, 32, 101316. [Google Scholar] [CrossRef]
  21. Zhang, X.; Jiang, Y.; Kong, G.; Liu, Q.; Zhang, G.; Wang, K.; Cao, T.; Cheng, Q.; Zhang, Z.; Ji, G.; et al. CO2-mediated catalytic upcycling of plastic waste for H2-rich syngas and carbon nanomaterials. J. Hazard. Mater. 2023, 460, 132500. [Google Scholar] [CrossRef] [PubMed]
  22. Uemichi, Y.; Makino, Y.; Kanazuka, T. Degradation of polyethylene to aromatic hydrocarbons over metal-supported activated carbon catalysts. J. Anal. Appl. Pyrolysis 1989, 14, 331–344. [Google Scholar] [CrossRef]
  23. Nishino, J.; Itoh, M.; Fujiyoshi, H.; Uemichi, Y. Catalytic degradation of plastic waste into petrochemicals using Ga-ZSM-5. Fuel 2008, 87, 3681–3686. [Google Scholar] [CrossRef]
  24. Pinto, F.; Costa, P.; Gulyurtlu, I.; Cabrita, I. Pyrolysis of plastic wastes: 2. Effect of catalyst on product yield. J. Anal. Appl. Pyrolysis 1999, 51, 57–71. [Google Scholar] [CrossRef]
  25. Kang, J.; Kim, J.Y.; Sung, S.; Lee, Y.; Gu, S.; Choi, J.-W.; Yoo, C.-J.; Suh, D.J.; Choi, J.; Ha, J.-M. Chemical upcycling of PVC-containing plastic wastes by thermal degradation and catalysis in a chlorine-rich environment. Environ. Pollut. 2024, 342, 123074. [Google Scholar] [CrossRef]
  26. Upare, D.P.; Park, S.; Kim, M.; Kim, J.; Lee, D.; Lee, J.; Chang, H.; Choi, W.; Choi, S.; Jeon, Y.-P.; et al. Cobalt promoted Mo/beta zeolite for selective hydrocracking of tetralin and pyrolysis fuel oil into monocyclic aromatic hydrocarbons. J. Ind. Eng. Chem. 2016, 35, 99–107. [Google Scholar] [CrossRef]
  27. Guo, H.; He, H.; Miao, C.; Hua, W.; Yue, Y.; Gao, Z. Ethane conversion in the presence of CO2 over Co-based ZSM-5 zeolite: Co species controlling the reaction pathway. Mol. Catal. 2022, 519, 112155. [Google Scholar] [CrossRef]
  28. Ewuzie, R.N.; Genza, J.R.; Abdullah, A.Z. Catalytic hydrogenolysis of lignin in isopropanol as hydrogen donor over nickel-cobalt supported on zeolite to produce aromatic and phenolic monomers. Appl. Catal. A Gen. 2023, 667, 119443. [Google Scholar] [CrossRef]
  29. Kurniawan, R.G.; Karanwal, N.; Park, J.; Verma, D.; Kwak, S.K.; Kim, S.K.; Kim, J. Direct conversion of furfural to 1,5-pentanediol over a nickel–cobalt oxide–alumina trimetallic catalyst. Appl. Catal. B Environ. 2023, 320, 121971. [Google Scholar] [CrossRef]
  30. Cai, Y.; Fan, Y.; Li, X.; Chen, L.; Wang, J. Preparation of refined bio-oil by catalytic transformation of vapors derived from vacuum pyrolysis of rape straw over modified HZSM-5. Energy 2016, 102, 95–105. [Google Scholar] [CrossRef]
  31. Pedrosa, A.M.G.; Souza, M.J.; Melo, D.M.; Araujo, A.S. Cobalt and nickel supported on HY zeolite: Synthesis, characterization and catalytic properties. Mater. Res. Bull. 2006, 41, 1105–1111. [Google Scholar] [CrossRef]
  32. Lai, S.; Meng, D.; Zhan, W.; Guo, Y.; Guo, Y.; Zhang, Z.; Lu, G. The promotional role of Ce in Cu/ZSM-5 and in situ surface reaction for selective catalytic reduction of NOx with NH3. RSC Adv. 2015, 5, 90235–90244. [Google Scholar] [CrossRef]
  33. Cairns, R.W.; Ott, E. X-Ray Studies of the System Nickel-Oxygen-Water. J. Am. Chem. Soc. 1933, 55, 527–533. [Google Scholar] [CrossRef]
  34. Chupin, C.; Vanveen, A.; Konduru, M.; Després, J.; Mirodatos, C. Identity and location of active species for NO reduction by CH4 over Co-ZSM-5. J. Catal. 2006, 241, 103–114. [Google Scholar] [CrossRef]
  35. Seo, S.M.; Lim, W.T.; Seff, K. Single-crystal structures of fully and partially dehydrated zeolite Y (FAU, Si/Al = 1.56) largely Co2+ exchanged at pH 5.1. Microporous Mesoporous Mater. 2013, 170, 67–74. [Google Scholar] [CrossRef]
  36. Núñez, F.; Chen, L.; Wang, J.A.; Flores, S.O.; Salmones, J.; Arellano, U.; Noreña, L.E.; Tzompantzi, F. Bifunctional Co3O4/ZSM-5 Mesoporous Catalysts for Biodiesel Production via Esterification of Unsaturated Omega-9 Oleic Acid. Catalysts 2022, 12, 900. [Google Scholar] [CrossRef]
  37. Biesinger, M.C.; Lau, L.W.M.; Gerson, A.R.; Smart, R.S.C. The role of the Auger parameter in XPS studies of nickel metal, halides and oxides. Phys. Chem. Chem. Phys. 2012, 14, 2434–2442. [Google Scholar] [CrossRef]
  38. Peck, M.A.; Langell, M.A. Comparison of Nanoscaled and Bulk NiO Structural and Environmental Characteristics by XRD, XAFS, and XPS. Chem. Mater. 2012, 24, 4483–4490. [Google Scholar] [CrossRef]
  39. Biesinger, M.C.; Payne, B.P.; Grosvenor, A.P.; Lau, L.W.M.; Gerson, A.R.; Smart, R.S.C. Resolving surface chemical states in XPS analysis of first row transition metals, oxides and hydroxides: Cr, Mn, Fe, Co and Ni. Appl. Surf. Sci. 2011, 257, 2717–2730. [Google Scholar] [CrossRef]
  40. Valero-Romero, M.J.; Sartipi, S.; Sun, X.; Rodríguez-Mirasol, J.; Cordero, T.; Kapteijn, F.; Gascon, J. Carbon/H-ZSM-5 composites as supports for bi-functional Fischer–Tropsch synthesis catalysts. Catal. Sci. Technol. 2016, 6, 2633–2646. [Google Scholar] [CrossRef]
  41. Vovchok, D.; Tata, J.; Orozco, I.; Zhang, F.; Palomino, R.M.; Xu, W.; Harper, L.; Khatib, S.J.; Rodriguez, J.A.; Senanayake, S.D. Location and chemical speciation of Cu in ZSM-5 during the water-gas shift reaction. Catal. Today 2019, 323, 216–224. [Google Scholar] [CrossRef]
  42. Thommes, M.; Kaneko, K.; Neimark, A.V.; Olivier, J.P.; Rodriguez-Reinoso, F.; Rouquerol, J.; Sing, K.S.W. Physisorption of gases, with special reference to the evaluation of surface area and pore size distribution (IUPAC Technical Report). Pure Appl. Chem. 2015, 87, 1051–1069. [Google Scholar] [CrossRef]
  43. Scherzer, J. Correlation between Catalyst Formulation and Catalytic Properties. In Fluid Catalytic Cracking: Science and Technology; Magee, J.S., Mitchell, M.M., Eds.; Elsevier: Amsterdam, The Netherlands, 1992; Volume 76, pp. 145–182. [Google Scholar]
  44. Reschetilowski, W.; Unger, B.; Wendlandt, K.-P. Study of the ammonia–zeolite interaction in modified ZSM-5 by temperature-programmed desorption of ammonia. J. Chem. Soc. Faraday Trans. 1 Phys. Chem. Condens. Phases 1989, 85, 2941–2944. [Google Scholar] [CrossRef]
  45. Karge, H.G.; Dondur, V. Investigation of the distribution of acidity in zeolites by temperature-programmed desorption of probe molecules. 2. Dealuminated Y-Type Zeolites. J. Phys. Chem. 1991, 95, 282–288. [Google Scholar] [CrossRef]
  46. Razzaq, M.; Zeeshan, M.; Qaisar, S.; Iftikhar, H.; Muneer, B. Investigating use of metal-modified HZSM-5 catalyst to upgrade liquid yield in co-pyrolysis of wheat straw and polystyrene. Fuel 2019, 257, 116119. [Google Scholar] [CrossRef]
  47. Veses, A.; Puértolas, B.; Callén, M.; García, T. Catalytic upgrading of biomass derived pyrolysis vapors over metal-loaded ZSM-5 zeolites: Effect of different metal cations on the bio-oil final properties. Microporous Mesoporous Mater. 2015, 209, 189–196. [Google Scholar] [CrossRef]
  48. Li, X.; Zhang, H.; Li, J.; Su, L.; Zuo, J.; Komarneni, S.; Wang, Y. Improving the aromatic production in catalytic fast pyrolysis of cellulose by co-feeding low-density polyethylene. Appl. Catal. A Gen. 2013, 455, 114–121. [Google Scholar] [CrossRef]
  49. Akubo, K.; Nahil, M.A.; Williams, P.T. Aromatic fuel oils produced from the pyrolysis-catalysis of polyethylene plastic with metal-impregnated zeolite catalysts. J. Energy Inst. 2019, 92, 195–202. [Google Scholar] [CrossRef]
  50. Calero, M.; Solís, R.R.; Muñoz-Batista, M.J.; Pérez, A.; Blázquez, G.; Martín-Lara, M. Oil and gas production from the pyrolytic transformation of recycled plastic waste: An integral study by polymer families. Chem. Eng. Sci. 2023, 271, 118569. [Google Scholar] [CrossRef]
  51. Paucar-Sánchez, M.F.; Calero, M.; Blázquez, G.; Solís, R.R.; Muñoz-Batista, M.J.; Martín-Lara, M.Á. Thermal and catalytic pyrolysis of a real mixture of post-consumer plastic waste: An analysis of the gasoline-range product. Process Saf. Environ. Prot. 2022, 168, 1201–1211. [Google Scholar] [CrossRef]
  52. Miskolczi, N.; Bartha, L.; Deák, G. Thermal degradation of polyethylene and polystyrene from the packaging industry over different catalysts into fuel-like feed stocks. Polym. Degrad. Stab. 2006, 91, 517–526. [Google Scholar] [CrossRef]
  53. Iliopoulou, E.; Stefanidis, S.; Kalogiannis, K.; Delimitis, A.; Lappas, A.; Triantafyllidis, K. Catalytic upgrading of biomass pyrolysis vapors using transition metal-modified ZSM-5 zeolite. Appl. Catal. B Environ. 2012, 127, 281–290. [Google Scholar] [CrossRef]
  54. Richardson, J.T. Principles of Catalyst Development, 2nd ed.; Springer Science: New York, NY, USA, 1992. [Google Scholar]
  55. Altomare, A.; Corriero, N.; Cuocci, C.; Falcicchio, A.; Moliterni, A.; Rizzi, R. QUALX2.0: A qualitative phase analysis software using the freely available database POW_COD. J. Appl. Crystallogr. 2015, 48, 598–603. [Google Scholar] [CrossRef]
  56. Paucar-Sánchez, M.F.; Calero, M.; Blázquez, G.; Muñoz-Batista, M.J.; Martín-Lara, M.A. Characterization of liquid fraction obtained from pyrolysis of post-consumer mixed plastic waste: A comparing between measured and calculated parameters. Process Saf. Environ. Prot. 2022, 159, 1053–1063. [Google Scholar] [CrossRef]
  57. ASTM D2789-95; Standard Test Method for Hydrocarbon Types in Low Olefinic Gasoline by Mass Spectrometry. American Society for Testing and Materials, ASTM International: West Conshohocken, PA, USA, 2016; pp. 1–7.
  58. MNL10902M; Standard Test Method for Boiling Range Distribution of Petroleum Fractions by Gas Chromatography. ASTM International: West Conshohocken, PA, USA, 2008; pp. 444–454. [CrossRef]
Figure 1. XRD patterns of the bare and metal-impregnated zeolites.
Catalysts 14 00168 g001
Figure 2. XPS spectra of references and metal-containing catalytic samples. (A) Ni2p region, (B) Co2p region, (C) O1s, (D) Si2p, (E) Al2p, (F) curve-resolved XPS Ni2p region, and (G) Co2p regions for 5%-metal and HY zeolite support.
Catalysts 14 00168 g002
Figure 3. N2 adsorption–desorption isotherms of impregnated HY (A) and HZSM5 (C) catalysts and the pore width distribution of metal-impregnated zeolites HY (B) and HZSM5 (D).
Catalysts 14 00168 g003
Figure 4. Thermal Programmed Desorption (TPD) of metal impregnated onto zeolites HY (A) and HZSM5 (B).
Catalysts 14 00168 g004
Figure 5. FTIR spectra of the liquid products obtained from catalytic pyrolysis of the mixture of post-consumer plastic waste using metal-impregnated HY (A) and HZSM5 (B) catalysts.
Catalysts 14 00168 g005
Figure 6. Simulated distillation curves of the liquid fraction obtained from the catalytic pyrolysis of a mixture of plastic waste with metal-impregnated onto zeolites HY (A) and HZSM5 (B).
Catalysts 14 00168 g006
Figure 7. Relationship between gasoline, LCO, and HCO products yields (data in g by kg of plastics waste) and Acidity/SBET (μmol/m2) obtained from catalytic pyrolysis over native and metal-impregnated zeolites. (A) HY- and (B) HZS5-related samples. Inside the figures, data B to F make references to metal-containing samples; B: 1%Co-HY or 1Co-HZSM5, C: 1%Ni-HY or 1%Ni-HZSM5, D: 5%Co-HY or 5%Co-HZSM5 and F: 5%Ni-HY or 5%Ni-HZSM5.
Catalysts 14 00168 g007
Figure 8. Graphical representation of the experimental equipment used for the catalytic pyrolysis tests.
Catalysts 14 00168 g008
Table 1. Textural characteristics of the native and metal-impregnated zeolite catalysts.
CatalystL (nm)SBET
(m2/g)
SMP (m2/g)VT (cm3/g)VMP (cm3/g)VMP/VT
(%)
Dave
(Å)
Total Acidity (μmol/g)
HY51.91138412740.7050.43261.350.5576
1%Co-HY-10449610.5210.32662.655.5709
5%Co-HY59.389598840.4760.30063.054.9728
1%Ni-HY-10229430.5110.32062.656.6768
5%Ni-HY51.919748930.4940.30461.554.0836
HZSM547.034884400.2410.14961.831.41045
1%Co-HZSM5-4724230.2300.14362.240.21300
5%Co-HZSM552.904323880.2300.13156.941.01302
1%Ni-HZSM5-4694220.2300.14261.732.71383
5%Ni-HZSM547.024133680.2150.12457.736.41509
L: crystal size obtained from the highest XRD peak with Scherrer equation; SBET: total specific surface area using BET method; SMP: micropore surface area using t-plot method; VT: total pore volume from N2 uptake at p/p~0.99; VMP: volume of micropores from t-plot method; Dave average mesopore width using BJH method.
Table 2. Product distribution expressed as %wt. and carbon deposition (coke development) on the catalytic pyrolysis of a real mixture of post-consumer plastic waste.
CatalystCoke/Catalyst
(%wt.)
Gas
(%wt.)
Liquid
(%wt.)
Char
(%wt.)
HY4.4 ± 0.458.1 ± 1.835.0 ± 2.26.9 ± 0.6
1%Co-HY6.2 ± 0.650.9 ± 2.641.0 ± 2.66.6 ± 0.5
5%Co-HY4.1 ± 0.550.2 ± 2.543.1 ± 2.56.6 ± 0.6
1%Ni-HY4.2 ± 0.451.9 ± 2.041.3 ± 2.06.8 ± 0.5
5%Ni-HY4.1 ± 0.449.6 ± 2.443.2 ± 2.47.2 ± 0.7
HZSM51.3 ± 0.358.3 ± 2.734.3 ± 2.07.5 ± 0.6
1%Co-HZSM52.0 ± 0.453.6 ± 2.039.3 ± 2.07.2 ± 0.7
5%Co-HZSM52.0 ± 0.457.1 ± 2.638.5 ± 2.66.9 ± 0.5
1%Ni-HZSM52.2 ± 0.557.2 ± 1.838.3 ± 1.86.7 ± 0.5
5%Ni-HZSM51.5 ± 0.253.2 ± 2.639.8 ± 2.67.0 ± 0.7
Table 3. Weight percentage of common fractions in pyrolysis oil obtained from catalytic pyrolysis over native and metal-impregnated HY zeolite.
ProductsFractionHY1%Co-HY5%Co-HY1%Ni-HY5%Ni-HY
GasolineLight Naphtha1.7 ± 0.43.4 ± 0.23.1 ± 0.32.5 ± 0.21.7 ± 0 4
Mid Naphtha30.8 ± 2.536.4 ± 2.034.5 ± 2.333.1 ± 2.532.3 ± 2.0
Heavy Naphtha11.8 ± 0.910.6 ± 1.010.6 ± 0.811.1 ± 1.111.2 ± 1.0
Total44.3 ± 2.550.3 ± 2.048.3 ± 2.346.7 ± 2.545.2 ± 2.0
LCOLight Gas Oil9.8 ± 0.79.6 ± 0.69.8 ± 0.59.9 ± 0.99.8 ± 0.8
Mid Gas Oil9.2 ± 0.49.2 ± 0.79.9 ± 0.59.9 ± 0.79.6 ± 0.7
Heavy Gas Oil10.3 ± 0.89.5 ± 0.611.2 ± 1.111.3 ± 1.411.2 ± 0.9
Total29.3 ± 0.828.2 ± 0.730.9 ± 1.131.1 ± 1.430.6 ± 0.9
HCOLight Vacuum Gas Oil12.0 ± 0.99.3 ± 0.510.1 ± 0.810.8 ± 0.811.9 ± 1.0
Mid Vacuum Gas Oil7.2 ± 0.55.7 ± 0.65.2 ± 0.35.5 ± 0.56.1 ± 0.5
Heavy Vacuum Gas Oil7.2 ± 0.36.5 ± 0.45.6 ± 0.45.9 ± 0.56.2 ± 0.3
Total26.4 ± 0.921.5 ± 0.620.8 ± 0.822.2 ± 0.824.2 ± 1.0
Table 4. Weight percentage of common fractions in pyrolysis oil obtained from catalytic pyrolysis over native and metal-impregnated HZSM5 zeolite.
ProductsFractionHZSM51%Co-HZSM55%Co-HZSM51%Ni-HZSM55%Ni-HZSM5
GasolineLight Naphtha2.0 ± 0.42.5 ± 0.32.9 ± 0.31.7 ± 0.21.7 ± 0.3
Mid Naphtha31.9 ± 2.334.0 ± 2.734.7 ± 2.634.8 ± 2.434.9 ± 2.2
Heavy Naphtha10.8 ± 0.910.0 ± 1.010.6 ± 1.110.6 ± 0.810.6 ± 0.7
Total44.7 ± 2.346.5 ± 2.748.2 ± 2.647.1 ± 2.447.2 ± 2.2
LCOLight Gas Oil9.5 ± 0.79.0 ± 0.79.0 ± 0.99.3 ± 0.79.6 ± 0.9
Mid Gas Oil9.6 ± 0.88.9 ± 0.69.0 ± 0.88.7 ± 0.69.5 ± 0.7
Heavy Gas Oil12.2 ± 1.110.8 ± 0.910.3 ± 0.89.4 ± 0.910.8 ± 0.8
Total31.3 ± 1.128.7 ± 0.928.3 ± 0.927.4 ± 0.929.9 ± 0.9
HCOLight Vacuum Gas Oil12.8 ± 1.212.2 ± 1.111.7 ± 0.910.9 ± 1.110.9 ± 0.6
Mid Vacuum Gas Oil5.6 ± 0.46.4 ± 0.55.8 ± 0.67.1 ± 0.45.8 ± 0.6
Heavy Vacuum Gas Oil5.6 ± 0.36.2 ± 0.46.0 ± 0.57.5 ± 0.86.1 ± 0.7
Total24.0 ± 1.224.8 ± 1.123.5 ± 0.925.5 ± 1.122.9 ± 0.7
Table 5. Gasoline, LCO, and HCO product yields (data in g by kg of plastics waste) obtained from catalytic pyrolysis over native and metal-impregnated zeolites.
CatalystGasolineLCOHCO
HY155.1 ± 8.8102.7 ± 5.392.5 ± 4.8
1%Co-HY203.4 ± 13.0120.0 ± 7.686.9 ± 5.5
5%Co-HY208.2 ± 12.0133.3 ± 7.789.8 ± 5.2
1%Ni-HY192.8 ± 10.0128.6 ± 6.291.6 ± 4.4
5%Ni-HY202.5 ± 11.0132.1 ± 7.397.8 ± 5.4
HZSM5153.2 ± 8.9107.2 ± 6.382.3 ± 4.8
1%Co-HZSM5182.7 ± 11.0112.9 ± 5.797.3 ± 5.0
5%Co-HZSM5185.4 ± 13.0109.0 ± 7.490.6 ± 6.1
1%Ni-HZSM5180.0 ± 9.2111.5 ± 5.292.0 ± 4.3
5%Ni-HZSM5188.0 ± 12.0119.3 ± 7.891.0 ± 6.0
Table 6. Composition of the gasoline product obtained from catalytic pyrolysis over native and metal-impregnated zeolites.
CatalystParaffins, %Naphthenics, %Aromatics, %
MonocycloparaffinsDicycloparaffinsTotalAlkylbenzenesIndan or TetralinsNaphthalenesTotal
HY19.2 ± 1.219.9 ± 1.229.1 ± 2.449.3 ± 2.422.1 ± 1.67.8 ± 1.41.6 ± 0.531.5 ± 1.6
1%Co-HY18.1 ± 2.019.7 ± 1.730.0 ± 1.949.7 ± 1.922.3 ± 2.28.1 ± 1.01.8 ± 1.032.2 ± 2.2
5%Co-HY19.8 ± 1.918.8 ± 1.425.8 ± 1.944.6 ± 1.924.0 ± 2.010.2 ± 0.81.4 ± 0.435.6 ± 2.0
1%Ni-HY19.2 ± 1.220.1 ± 0.930.0 ± 2.150.1 ± 2.120.7 ± 1.58.2 ± 1.21.8 ± 0.630.7 ± 1.5
5%Ni-HY19.4 ± 2.420.5 ± 2.027.5 ± 1.448.0 ± 2.023.2 ± 1.68.01 ± 0.61.4 ± 0.532.6 ± 1.6
HZSM519.4 ± 2.120.4 ± 2.225.3 ± 2.345.6 ± 2.326.3 ± 1.08.2 ± 1.10.5 ± 0.235.0 ± 1.1
1%Co-HZSM520.5 ± 1.519.8 ± 3.127.0 ± 1.946.8 ± 3.122.5 ± 3.48.8 ± 0.61.3 ± 0.532.7 ± 3.4
5%Co-HZSM520.3 ± 2.521.1 ± 1.830.0 ± 3.451.2 ± 3.420.3 ± 1.97.2 ± 0.71.1 ± 0.428.6 ± 1.9
1%Ni-HZSM519.2 ± 3.020.9 ± 2.929.6 ± 4.450.5 ± 4.420.9 ± 2.37.8 ± 0.81.7 ± 0.630.3 ± 2.3
5%Ni-HZSM518.7 ± 1.920.8 ± 1.029.1 ± 1.649.9 ± 1.622.1 ± 3.18.1 ± 1.21.3 ± 0.331.4 ± 3.1
Table 7. Common fractions in pyrolysis oil and their nominal boiling points.
ProductsFractionBoiling Point (°C)
GasolineLight Naphtha36–90
Mid Naphtha90–160
Heavy Naphtha160–205
LCOLight Gas Oil205–260
Mid Gas Oil260–315
Heavy Gas Oil315–370
HCOLight Vacuum Gas Oil370–430
Mid Vacuum Gas Oil430–480
Heavy Vacuum Gas Oil480–565
Disclaimer/Publisher’s Note: The statements, opinions and data contained in all publications are solely those of the individual author(s) and contributor(s) and not of MDPI and/or the editor(s). MDPI and/or the editor(s) disclaim responsibility for any injury to people or property resulting from any ideas, methods, instructions or products referred to in the content.

