Article

The Influence of Acetone on the Kinetics of Water Electrolysis Examined at Polycrystalline Pt Electrode in Alkaline Solution

by
Aleksandra Adamicka
,
Tomasz Mikołajczyk
,
Mateusz Kuczyński
and
Bogusław Pierożyński
*
Department of Chemistry, Faculty of Agriculture and Forestry, University of Warmia and Mazury in Olsztyn, Łódzki Square 4, 10-727 Olsztyn, Poland
*
Author to whom correspondence should be addressed.
Catalysts 2024, 14(8), 488; https://doi.org/10.3390/catal14080488
Submission received: 14 July 2024 / Revised: 26 July 2024 / Accepted: 26 July 2024 / Published: 30 July 2024
(This article belongs to the Section Electrocatalysis)

Abstract

:
This study investigated the impact of acetone on the electrochemical behavior of polycrystalline platinum electrodes in 0.1 M NaOH solution, with respect to the kinetics of hydrogen and oxygen evolution reactions (HER and OER) and indirectly to the underpotential deposition of hydrogen (UPDH). Cyclic voltammetry (CV) and electrochemical impedance spectroscopy (EIS) techniques were employed to analyze these processes for acetone concentrations ranging from 1.0 × 10⁻⁶ to 1.0 × 10⁻³ M. The addition of (CH3)2C=O enhanced the catalytic efficiency of alkaline water splitting, which was believed to be a result of a significant reduction in the surface tension phenomenon (due to mutual interaction of acetone and water molecules), thus considerably facilitating hydrogen bubble detachment from the Pt electrode. Key findings in this work are described with respect to facilitation of both the HER and the OER reactions’ kinetics by the presence of acetone (also undergoing Pt electroreduction over the potential range for UPDH) in the working solution, without an electrode surface poisoning effect. The latter implies significant opportunities for traces of organic additives into alkaline electrolyte to improve the industrial alkaline water electrolysis process.

1. Introduction

Electrochemical processes, such as water electrolysis, are critical for low-impact energy solutions, especially for green hydrogen production by utilization of renewable energy sources. The above is essential to energy sustainability and the carbon-free world’s future. As the production of hydrogen via water electrolysis is quite energy demanding, of special importance become new methods for the construction of highly efficient and relatively unexpensive electrode catalysts [1,2,3]. Interestingly, the kinetics of hydrogen evolution reaction (HER) and oxygen evolution reaction (OER) could significantly be influenced by the presence of various organic additives in the working electrolyte. These species might affect an overall efficiency and performance of the electrochemical system, which might be governed by a variety of nanoscale-type reaction mechanisms [4,5,6].
Platinum-based electrodes are especially widely used in various electrochemical research activities, due to their superior and consistent electrocatalytic properties. They are also highly susceptible to various (cationic, anionic, and organic) surface contaminants. Numerous organic chemicals (e.g., alcohols, ketones, acids, and other compounds) may become adsorbed on the Pt electrode surface in addition to further undergoing potential-dependent surface electroreduction and/or electrooxidation processes [7,8,9,10,11,12,13], thus possibly influencing the rates of the water splitting process. In fact, proper understanding of how to use certain organic electrolyte additives could lead to facilitated reaction rates and better performance of the green hydrogen production process, especially when realized via alkaline water electrolysis. For example, acetone, a common organic solvent, was shown to significantly reduce the electrolyte surface tension through fundamental strengthening of hydrogen bonding interactions when mixed with water molecules [14,15,16]. On the other hand, recently undertaken studies by Pierożyński et al. at this laboratory have proven [17,18] that the resorcinol ion could have a significant influence on the kinetics of alkaline water electrolysis on the surface of polycrystalline and Pt(111) single-crystal electrodes.
This work aimed to investigate the effect of acetone on the electrochemical HER and OER behavior on polycrystalline Pt electrode in 0.1 M NaOH solution. By examining cyclic voltammetry (CV) and electrochemical impedance spectroscopy (EIS) characteristics, we sought to elucidate how acetone concentrations, ranging from 1.0 × 10⁻⁶ to 1.0 × 10⁻³ M, could impact the kinetics of the HER, OER, and UPDH processes. The results are expected to contribute to a deeper understanding of acetone’s role in enhancing electrochemical reaction efficiencies, paving the way for improved industrial applications within the alkaline water electrolysis technology.

2. Results and Discussion

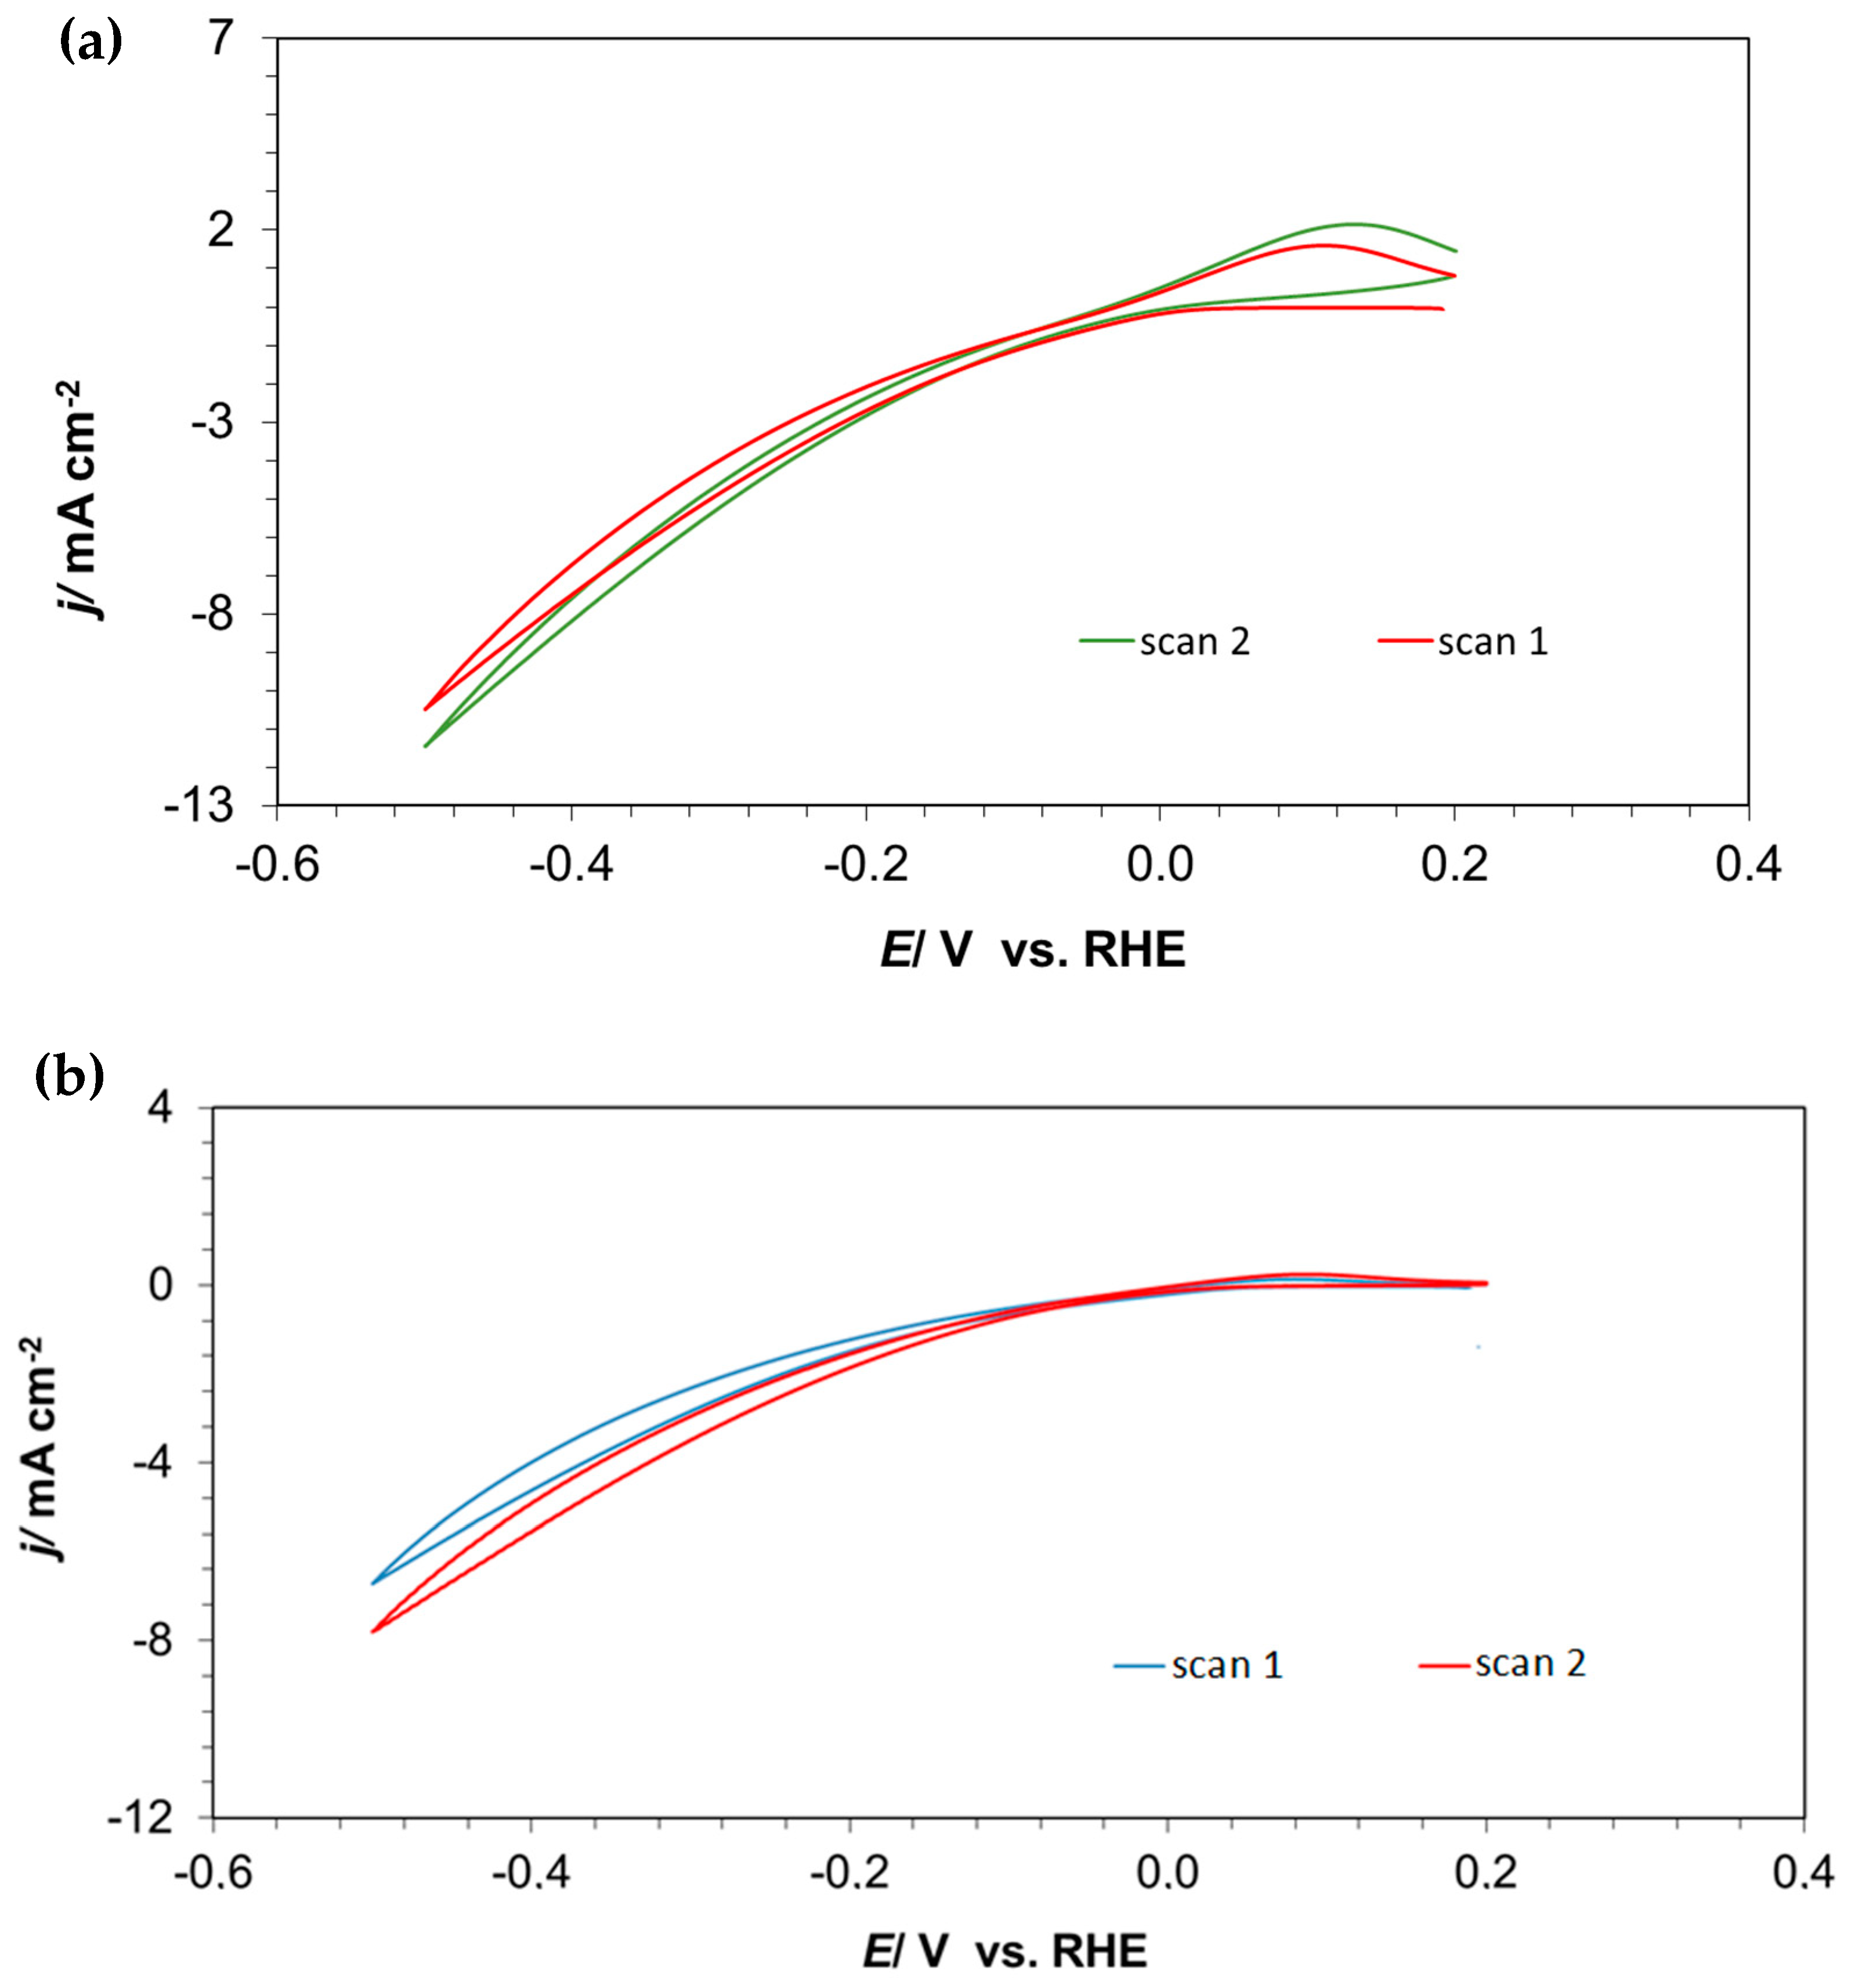
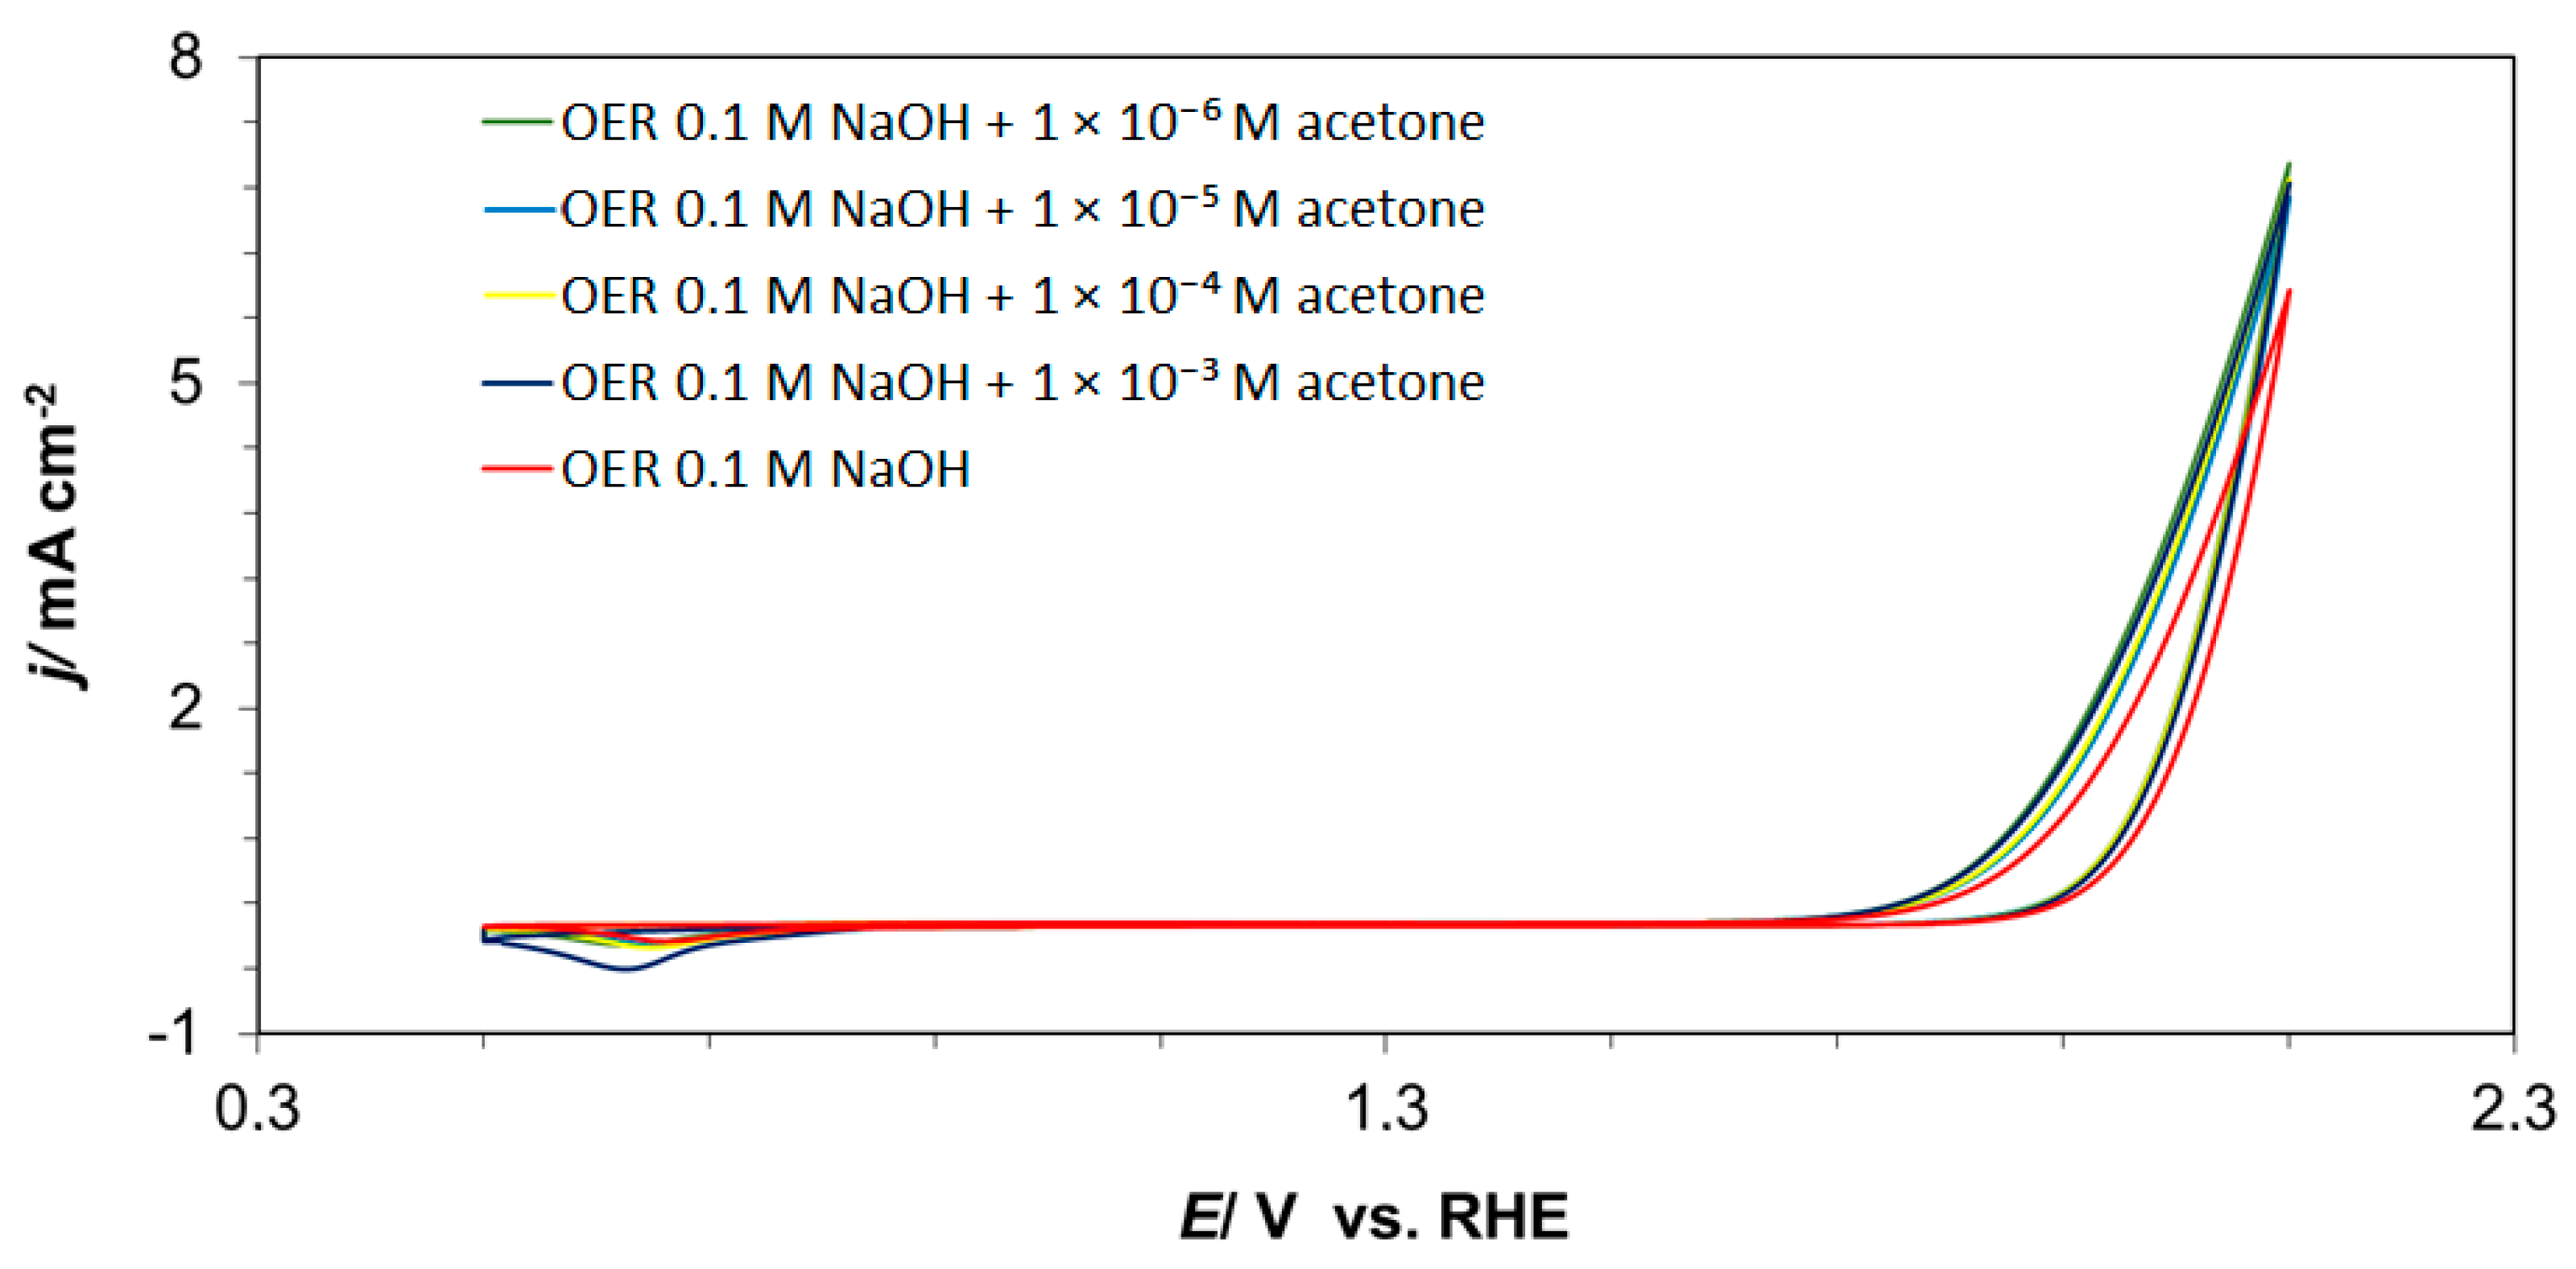
2.1. Cyclic Voltammetry

The behavior of the polycrystalline platinum electrode in 0.1 M NaOH solution in the absence and presence of acetone, at concentrations of 1.0 × 10⁻⁶, 1.0 × 10⁻⁵, 1.0 × 10⁻⁴, and 1.0 × 10⁻³ M, is shown in Figure 1, Figure 2, Figure 3, Figure 4, Figure 5, Figure 6, Figure 7 and Figure 8. The cyclic voltammogram for the platinum electrode in the potential range characteristic for the UPDH (0.05–0.80 V/RHE) showed two adsorption states (Figure 1a). Thus, a reversible peak centered on 0.26 V could be attributed to hydrogen reversible adsorption on the Pt(110) plane. The second, less reversible anodic peak appeared at approximately 0.40 V and corresponded to hydrogen desorption on the (100) plane, also in reference to the cathodic H adsorption peak centered at ca. 0.35 V [17].
Subsequently, with the addition of increasing amounts of acetone, a gradual shift in the anodic oxidation peaks toward more negative potentials from 0.26 to 0.23 V (for less anodic hydrogen peak) and from 0.40 to 0.36 V (for more anodic H peak) for the concentration of acetone at 1.0 × 10⁻³ M, compared with an unmodified sodium hydroxide solution, could be observed. Also, as later seen in Figure 2a,b, subsequent CV cycles did not cause a reduction in the current density of the characteristic peaks for the UPDH process, both in the presence and in the absence of acetone, which may indicate the lack of Pt catalyst poisoning effect. However, in the presence of dimethyl ketone, another characteristic feature emerged on the cathodic voltammetric scan over the potential range ca. 0.15–0.20 V/RHE. This behavior could be attributed to the electroreduction of acetone to isopropanol via active UPD hydrogen radicals adsorbed on the Pt surface, as illustrated in Scheme 1 [9,10,11,19]. Furthermore, this process became radically more pronounced at the concentration of 0.5 M acetone (Figure 1b), reaching a peak current density of about 130 µA cm−2. Nevertheless, the product of this reduction did not exhibit any poisoning effect on the electrode surface.
Then, the voltammograms recorded for the HER in the potential range from −0.50 to 0.20 V are shown in Figure 3. Except for a typical Faradaic region of hydrogen evolution reaction, they also featured a characteristic oxidation peak (centered at ca. 0.10 V), corresponding to the phenomenon of hydrogen oxidation (HOR: hydrogen oxidation reaction) on the Pt electrode surface. Hence, the current density recorded at the potential of −0.50 V for the unmodified sodium hydroxide solution came to −7.8 mA cm−2 (red plot in Figure 3). Then, upon increasing concentrations of acetone in the electrolyte, a gradual increase in the respective current density parameter was observed, reaching about −11.4 mA cm−2 for the highest acetone concentration (ca. 1.5× increase). This suggested that significantly more hydrogen was actually generated, as compared with the acetone-free solution. The latter could respectively be confirmed by a 9.3× increased peak current density value (from 0.23 to 2.13 mA cm−2 at the electrode potential of 0.08 V).
A comparison of two consecutive scans during a single measurement is presented in Figure 4a,b. Again, irrespectively of the absence or presence of acetone in the supporting solution, the second voltammetric scan was characterized by significantly higher current density values, thus indicating that initial CV sweeps did not lead to the working electrode contamination. Furthermore, an apparent facilitation of the HER rates (as shown in Figure 3) was most likely due to a significant reduction in the surface tension parameter, caused by acetone-to-water strong hydrogen bonding interactions [15,16]. Under such circumstances, larger amounts of hydrogen bubbles are being formed, which then tend to detach from the Pt surface at smaller radii, thus reducing an overall reaction overpotential (Scheme 2).
The oxygen evolution reaction was studied in the potential range from 0.50 to 2.10 V (Figure 5). Hence, upon cycling in the unmodified 0.1 M NaOH solution, a cathodic peak observed at the potential of about 0.65 V with a current density of approximately −0.1 mA cm−2 corresponded to the reduction in platinum oxides [20,21]. When the cycling was extended anodically beyond the potential range 1.80–1.90 V, a sharply rising anodic feature appeared in the voltammetric profile, which related to Pt surface oxidation along with an onset of oxygen evolution process. The recorded current density around the electrode potential of 2.10 V came to about 5.8 mA cm−2. Then, the introduction of acetone resulted in a noticeable rise in the recorded voltammetric current density values to reach ca. 6.7 and 7.0 mA cm−2, correspondingly at the acetone concentrations of 1.0 × 10⁻⁶ and 1.0 × 10⁻⁵ M, with no significant differences observed upon further acetone addition.
Furthermore, the first CV cycle exhibited the highest current density features, where their subsequent reduction upon consecutive scanning indicated possible contamination of the electrode. However, the latter also occurred upon the CV scans carried out in the unmodified NaOH solution, so one could most likely exclude possible Pt pollution by the surface adsorption of acetone or its contaminants (Figure 6a,b). Also, no peaks were observed at any acetone concentration that could be associated with acetone oxidation [22], indicating that acetone did not undergo significant oxidation under the experimental conditions.

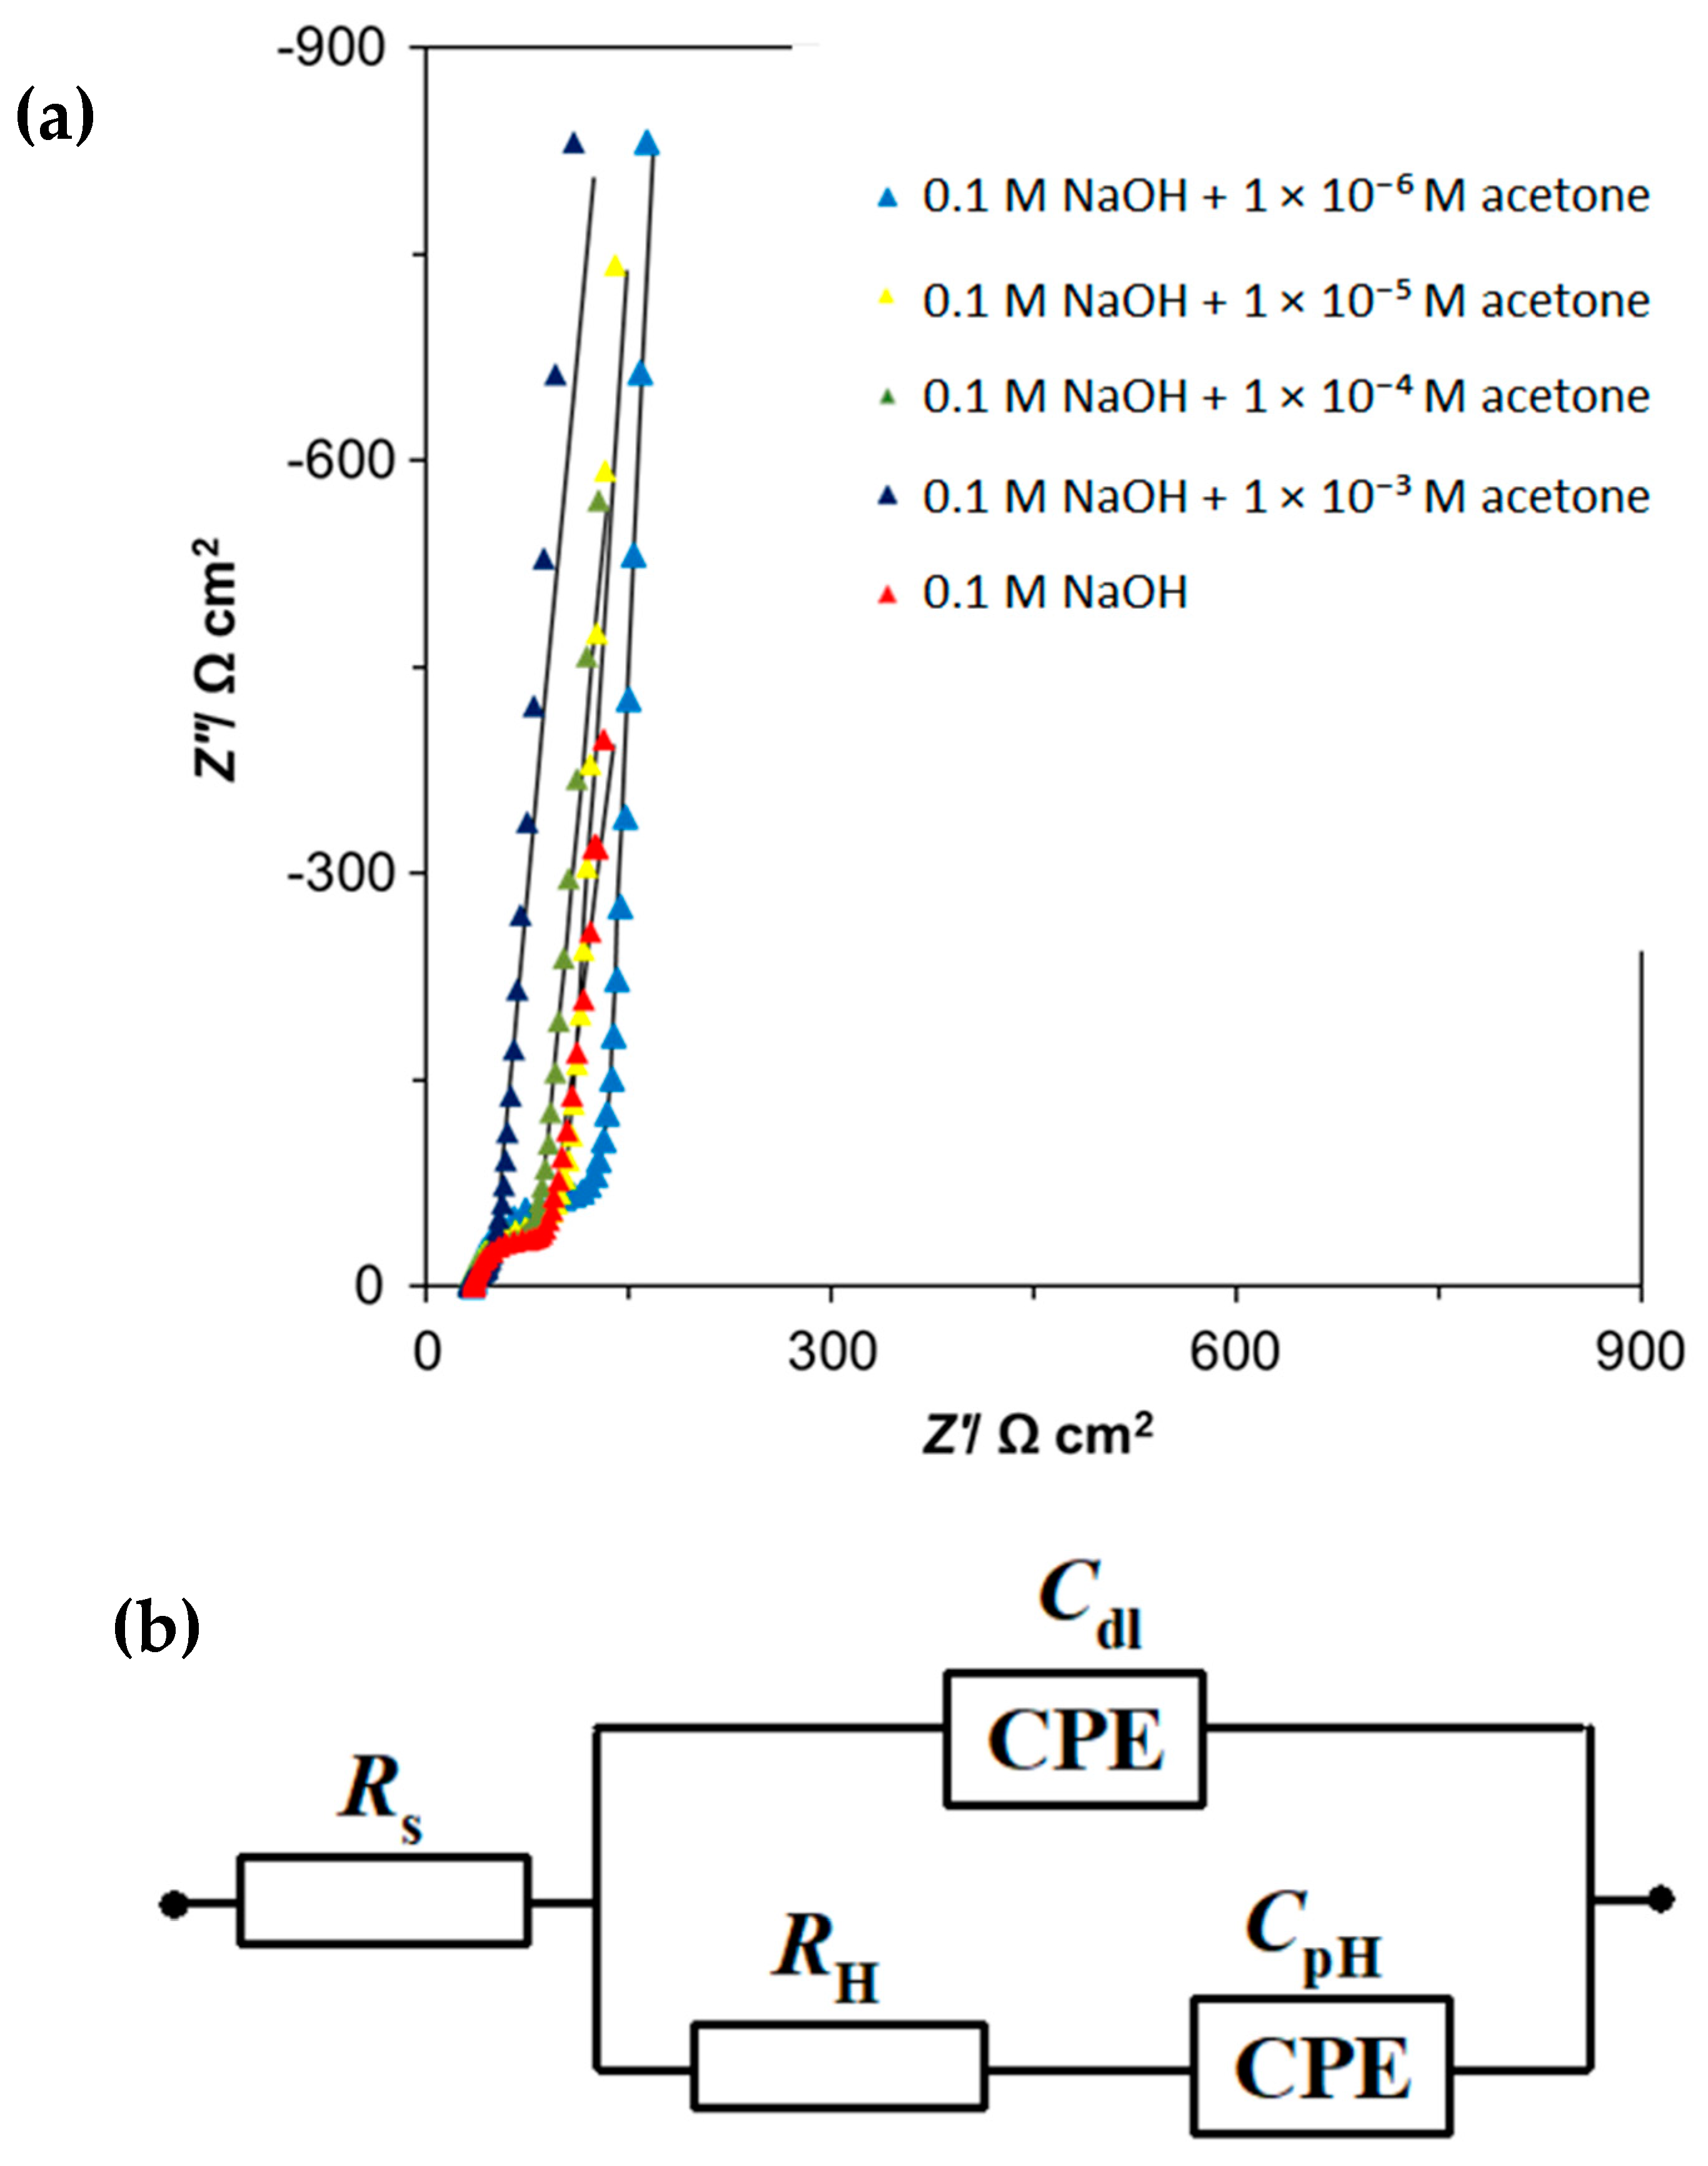
2.2. Ac. Impedance Spectroscopy

The electrochemical ac. impedance behavior of the polycrystalline platinum electrode in 0.1 M NaOH solution, in the absence and presence of acetone, at the concentrations of 1.0 × 10⁻⁶, 1.0 × 10⁻⁵, 1.0 × 10⁻⁴, and 1.0 × 10⁻³ M, over the potential ranges characteristic for UPDH, HER, and OER processes, is shown in Nyquist impedance plots (Figure 7, Figure 8 and Figure 9) and Table 1, Table 2 and Table 3.
The Nyquist impedance plots for the UPDH are characterized by a semicircle present over high and intermediate frequencies throughout the entire studied potential range (from 100 to 350 mV), followed by a vertical line (but deviating from a 90-degree angle), caused by the so-called capacitance dispersion response, related to the electrode surface roughness and inhomogeneity (see, e.g., ref. [18] for details). The results presented in Table 1 for the UPDH kinetics in the pure 0.1 M NaOH solution were close to those of the literature data (see ref. [17]).
Hence, the charge transfer resistance, RH, parameter was related to the inverse of the UPDH exchange rate and oscillated between 60 (at 100 mV) and 213 Ω cm2 (at 250 mV), reaching 4294 Ω cm2 at the electrode potential of 350 mV, where hydrogen adsorption on the working electrode surface became radically depleted. The recorded double-layer capacitance, the Cdl, parameter values ranged from 23.2 to 76.2 μF cm−2, respectively.
Then, the introduction of acetone, at sequentially increasing concentrations, caused a gradual reduction in the RH parameter (practically indiscernible for the concentration of 1.0 × 10⁻⁶ M), whereas the corresponding capacitance parameters (both Cdl and CpH) remained relatively consistent with those of the unmodified supporting solution. Hence, for the highest acetone concentration of 1.0 × 10⁻³ M, the recorded RH parameter values reached 14.5 and 506.0 Ω cm2 for the electrode potentials of 100 and 350 mV vs. RHE, respectively. The latter could be translated to a radical, about 4.1× and 8.5× reduction in the Faradaic charge transfer resistance, at the corresponding electrode potentials.
With respect to the investigation of the hydrogen evolution reaction, a single (somewhat depressed) semicircle characteristic of hydrogen evolution on the Pt electrode surface was observed in the Nyquist impedance plots (Figure 8). The impedance measurements were conducted over the potential range from −100 to −500 mV vs. RHE. Hence, for the unmodified sodium hydroxide solution, the recorded charge transfer resistance, Rct, values decreased from 104.2 Ω cm2 at an overpotential (η) of 100 mV to 20.2 Ω cm2 at η = 500 mV. The double-layer capacitance, Cdl, parameter values ranged from 42.1 to 54.4 μF cm⁻2, correspondingly (Table 2).
Then, the introduction of acetone into the supporting solution resulted in a gradual reduction in the Rct parameter, where for the highest acetone concentration of 1.0 × 10⁻³ M, the recorded resistance values of 91.1 Ω cm2 (at −100 mV) and 16.3 Ω cm2 (at −500 mV) demonstrated 1.1× and 1.2× Rct reductions, respectively. This behavior was strongly believed to result from the reduction in the solution’s surface tension due to increased H bonding interactions between acetone and water molecules. The above would facilitate the process of gas bubbles’ detachment from the electrode surface (Scheme 2), thus increasing the electrochemically accessible electrode surface area. The latter may be supported by increasing Cdl values upon rising acetone concentrations at all electrode potentials (see Table 2 for details).
For the oxygen evolution reaction, the impedance measurements were conducted over the potential range from 1600 to 2000 mV vs. RHE. Similarly to the HER, the recorded Nyquist impedance plots represented single and distorted semicircles (Figure 9). Hence, for the unmodified NaOH electrolyte, the charge transfer resistance, Rct, parameter reduced from 16,976 Ω cm2 (at 1600 mV) to 14 Ω cm2 (at 2000 mV). Again, the introduction of acetone resulted in a significant reduction in the Rct, reaching 12,266 Ω cm2 (at 1600 mV) and 11 Ω cm2 (at 2000 mV) at 1.0 × 10⁻³ M acetone concentration in the working solution (Table 3). The latter translated to the Rct reduction by ca. 1.4× and 1.3×, correspondingly. In addition, the Cdl parameter remained approximately invariant (oscillating between 23 and 30 μF cm−2) for all conducted OER measurements.

3. Materials and Methods

The 0.1 M NaOH supporting solution was prepared using superior quality sodium hydroxide pellets provided by MERCK and ultrapure water produced by the Millipore Direct-Q3 UV (Darmstadt, Germany) water purification system with 18.2 MΩ cm water resistivity. The concentration of acetone (Sigma-Aldrich, >99%, Poznań, Poland) in the electrolyte ranged from 1.0 × 10⁻⁶ to 1.0 × 10⁻³ M.
All electrochemical experiments were performed in a typical three-electrode cell, consisting of a polycrystalline Pt working electrode (WE) with a surface area of 1.12 cm2, a Pd reversible hydrogen electrode (RHE) as a reference electrode (1.0 mm diameter Pd wire, 99.99% purity, Sigma-Aldrich), and a coiled Pt wire as the counter electrode (CE). All platinum electrodes were made from 1.0 mm diameter 99.9998% purity Pt wire obtained from Johnson Matthey, Inc. (Chicago, IL, USA). The Pt working electrode was subjected to a typical flame-annealing procedure, followed by quenching in ultrapure water before every new measurement.
All electrochemical tests were carried out at room temperature using a Biologic SP-240 Electrochemical System (Biologic, Seyssinet-Pariset, France). Both cyclic voltammetry (CV) and electrochemical impedance spectroscopy (EIS) experiments were conducted. The EIS spectra were recorded for the frequency ranges of 60 kHz to 1 Hz, 200 kHz to 0.2 Hz, and 100 kHz to 1 Hz for the HER, OER, and UPDH processes, respectively, with an output ac. signal set at 5 mV for all examined processes. The instrument was controlled by EC-Lab® 10.4 version software. The EIS measurements were conducted in three repetitions at each electrode potential value. The reproducibility of the results was typically below 10%. Data analysis was performed by means of ZView 3.5 (Corrview 3.5) software package for Windows, where the impedance spectra were fitted using a complex, non-linear, least-squares immittance fitting program, LEVM 6 [23].

4. Conclusions

The introduction of acetone over the concentration range from 1.0 × 10⁻⁶ to 1.0 × 10⁻³ M into 0.1 M NaOH supporting solution resulted in significant facilitation of the kinetics of UPDH, HER, and OER processes. This effect was strongly believed to result from a radical reduction in the surface tension parameter due to mutual H-bonding interactions of acetone and water molecules. The latter was suggested to considerably facilitate hydrogen bubble (most likely also oxygen species) detachment from the platinum electrode. In addition, over the potential range adjacent to the hydrogen reversible potential, acetone underwent significant surface reduction to form isopropanol. Interestingly, acetone (or its reactivity product) at the examined concentration range was found not to have any significant impact on the repeatability of the voltammetric scans and thus exhibited no visible surface poisoning on the polycrystalline Pt electrode.
The obtained results suggest that such simple organic molecules as acetone could find technologically important application in facilitation of the process of alkaline water electrolysis. However, in order to fully evaluate (and understand) the impact of acetone on the course of alkaline water splitting, further studies, including long-term and temperature-based measurements, would be required. Future research activities should consider not only optimization of its concentration but also the use of other, technologically viable catalyst materials, particularly those based on nickel nanoparticles and its alloys, as those are the most commonly used catalysts in industrial alkaline water electrolyzers.

Author Contributions

Conceptualization, T.M. and B.P.; methodology, T.M.; software, A.A. and M.K.; validation, T.M. and B.P.; formal analysis, A.A.; investigation, T.M.; resources, A.A.; data curation, A.A. and M.K.; writing—original draft preparation, T.M.; writing—review and editing, B.P.; visualization, T.M.; supervision, T.M.; project administration, T.M.; funding acquisition, B.P. All authors have read and agreed to the published version of the manuscript.

Funding

This work was primarily financed by the internal research grant no. 30.610.001-110, provided by The University of Warmia and Mazury in Olsztyn.

Data Availability Statement

Data supporting the reported results will be available upon request.

Conflicts of Interest

The authors declare no conflicts of interest.

References

  1. Xu, X.; Shao, Z.; Jiang, S.P. High-Entropy Materials for Water Electrolysis. Energy Technol. 2022, 10, 2200573. [Google Scholar] [CrossRef]
  2. Xu, X.; Sun, H.; Jiang, S.P.; Shao, Z. Modulating Metal-organic Frameworks for Catalyzing Acidic Oxygen Evolution for Proton Exchange Membrane Water Electrolysis. SusMat 2021, 1, 460–481. [Google Scholar] [CrossRef]
  3. Guan, D.; Wang, B.; Zhang, J.; Shi, R.; Jiao, K.; Li, L.; Wang, Y.; Xie, B.; Zhang, Q.; Yu, J.; et al. Hydrogen Society: From Present to Future. Energy Environ. Sci. 2023, 16, 4926–4943. [Google Scholar] [CrossRef]
  4. Becker, H.; Murawski, J.; Shinde, D.V.; Stephens, L.I.E.; Hinds, G.; Smith, G. Impact of Impurities on Water Electrolysis: A Review. Sustain. Energy Fuels 2023, 7, 1565–1603. [Google Scholar] [CrossRef]
  5. Barwe, S.; Mei, B.; Masa, J.; Schuhmann, W.; Ventosa, E. Overcoming Cathode Poisoning from Electrolyte Impurities in Alkaline Electrolysis by Means of Self-Healing Electrocatalyst Films. Nano Energy 2018, 53, 763–768. [Google Scholar] [CrossRef]
  6. Chauhan, D.; Ahn, Y.H. Alkaline Electrolysis of Wastewater and Low-Quality Water. J. Clean. Prod. 2023, 397, 136613. [Google Scholar] [CrossRef]
  7. Vigier, F.; Coutanceau, C.; Hahn, F.; Belgsir, E.M.; Lamy, C. On the Mechanism of Ethanol Electro-oxidation on Pt and PtSn Catalysts: Electrochemical and in situ IR Reflectance Spectroscopy Studies. J. Electroanal. Chem. 2004, 563, 81–89. [Google Scholar] [CrossRef]
  8. Rizo, R.; Ferre-Vilaplana, A.; Herrero, E.; Feliu, J.M. Ethanol Electro-oxidation Reaction Selectivity on Platinum in Aqueous Media. ACS Sustain. Chem. Eng. 2023, 11, 4960–4968. [Google Scholar] [CrossRef]
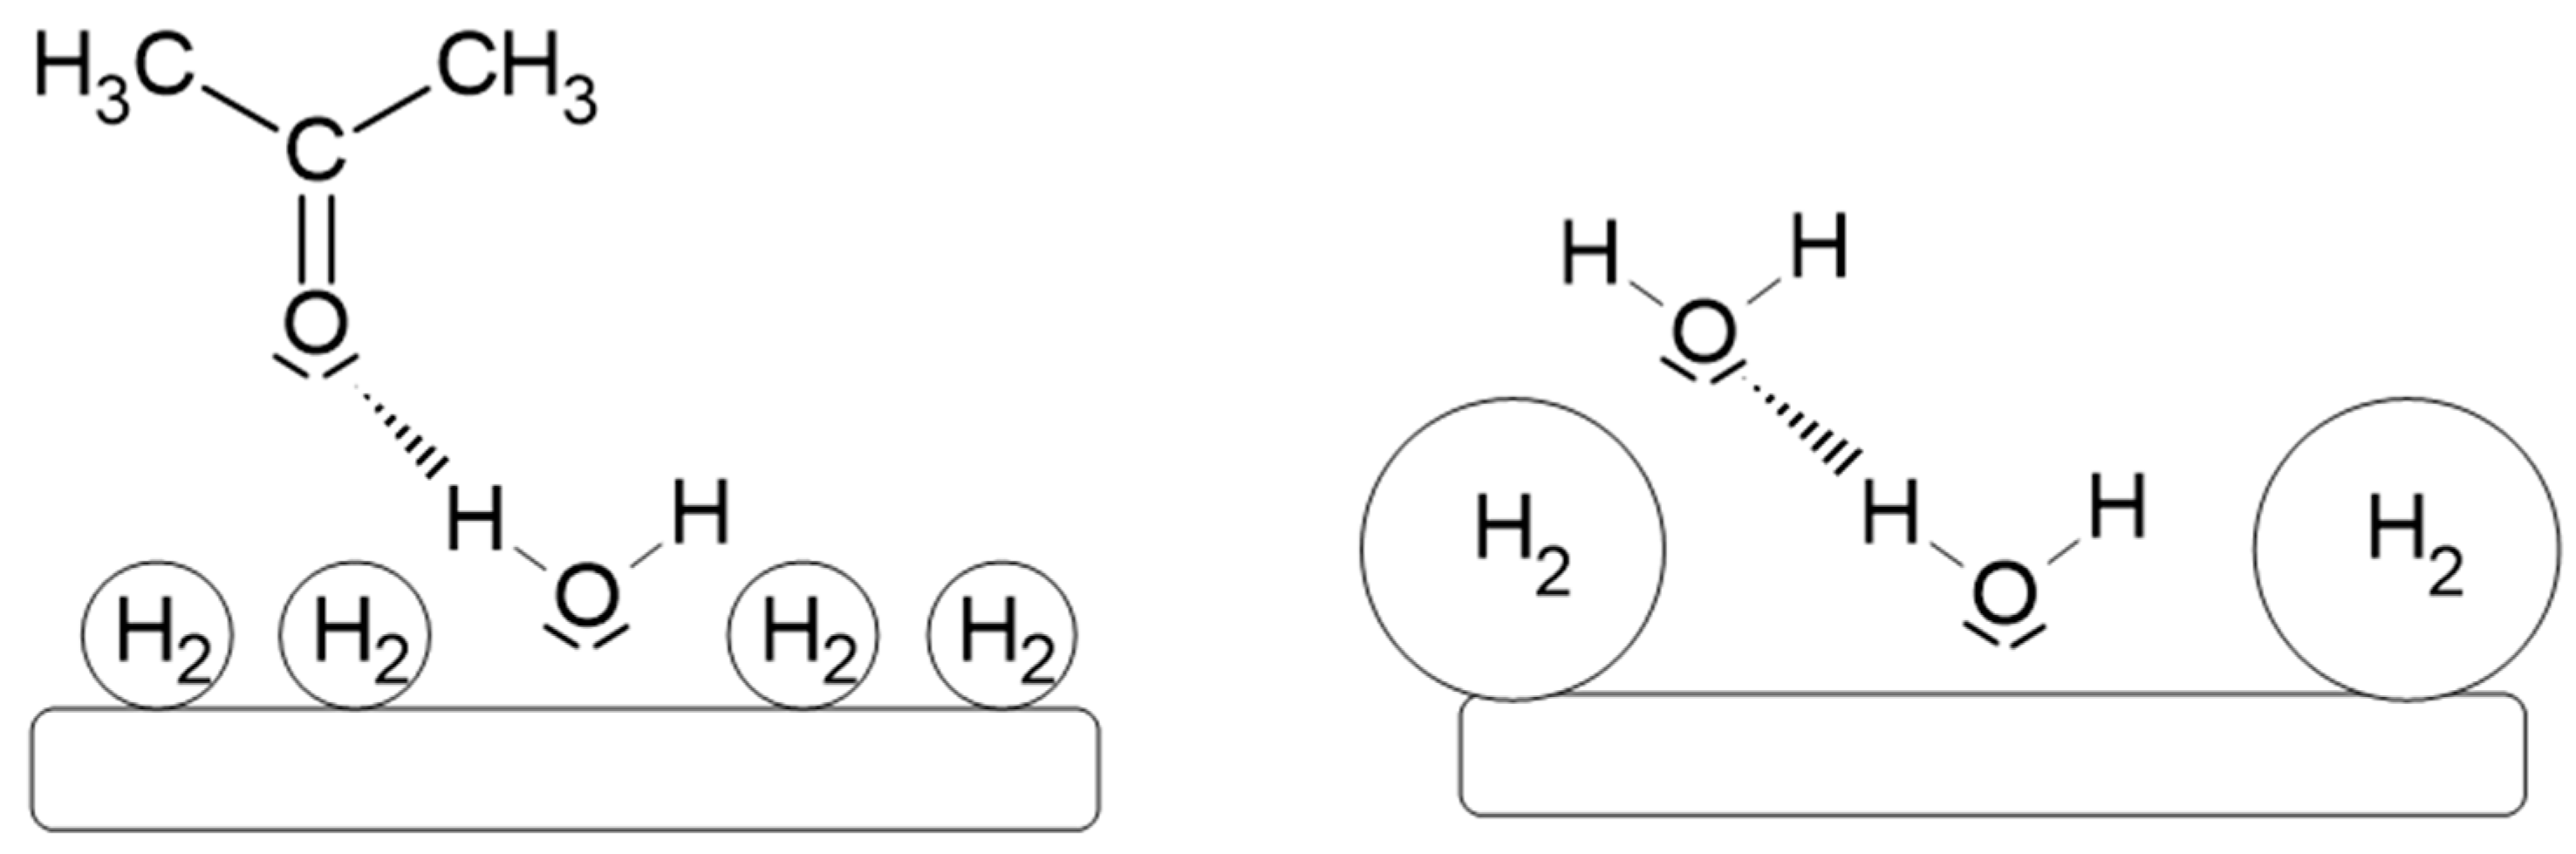
  9. Mekazni, D.S.; Arán-Ais, R.M.; Feliu, J.M.; Herrero, E. Understanding the Electrochemical Hydrogenation of Acetone on Pt Single Crystal Electrodes. J. Electroanal. Chem. 2022, 922, 116697. [Google Scholar] [CrossRef]
  10. Bondue, C.J.; Calle-Vallejo, F.; Figueiredo, M.C.; Koper, M.T.M. Structural Principles to Steer the Selectivity of the Electrocatalytic Reduction of Aliphatic Ketones on Platinum. Nat. Catal. 2019, 2, 243–250. [Google Scholar] [CrossRef]
  11. Bondue, C.J.; Koper, M.T.M. Electrochemical Reduction of the Carbonyl Functional Group: The Importance of Adsorption Geometry, Molecular Structure, and Electrode Surface Structure. J. Am. Chem. Soc. 2019, 141, 12071–12078. [Google Scholar] [CrossRef]
  12. Mrozek, M.F.; Luo, H.; Weaver, M.J. Formic Acid Electrooxidation on Platinum Group Metals: Is Adsorbed Carbon Monoxide Solely a Catalytic Poison. Langmuir 2000, 16, 8463–8469. [Google Scholar] [CrossRef]
  13. Pierozynski, B. Electrochemical Reactivity of Urea at Pt(100) Surface in 0.5 M H2SO4 by AC Impedance Spectroscopy. J. Solid State Electrochem. 2013, 17, 889–893. [Google Scholar] [CrossRef] [PubMed]
  14. Enders, S.; Kahl, H.; Winkelmann, J. Surface Tension of the Ternary System Water + Acetone + Toluene. J. Chem. Eng. Data 2007, 52, 1072–1079. [Google Scholar] [CrossRef]
  15. Howard, K.S.; McAllister, R.A. Surface Tension of Acetone-water Solutions up to Their Normal Boiling Points. AIChE. J. 1957, 3, 325–329. [Google Scholar] [CrossRef]
  16. Wu, N.; Li, X.; Liu, S.; Zhang, M.; Ouyang, S. Effect of Hydrogen Bonding on the Surface Tension Properties of Binary Mixture (Acetone-Water) by Raman Spectroscopy. Appl. Sci. 2019, 9, 1235. [Google Scholar] [CrossRef]
  17. Kuczyński, M.; Łuba, M.; Mikołajczyk, T.; Pierożyński, B. The Influence of Resorcinol on the Kinetics of Underpotentially Deposited Hydrogen, Cathodic Hydrogen and Anodic Oxygen Evolution Reactions, Examined at Polycrystalline Pt Electrode in 0.1 M NaOH Solution. Int. J. Hydrogen Energy 2023, 48, 10755–10764. [Google Scholar] [CrossRef]
  18. Pierożyński, B.; Kuczyński, M.; Mikołajczyk, T. Electro-Reactivity of Resorcinol on Pt(111) Single-Crystal Plane and Its Influence on the Kinetics of Underpotentially Deposited Hydrogen and Hydrogen Evolution Reaction Processes in 0.1 M NaOH Solution. Crystals 2024, 14, 545. [Google Scholar] [CrossRef]
  19. Li, C.; Sallee, A.M.; Zhang, X.; Kumar, S. Electrochemical Hydrogenation of Acetone to Produce Isopropanol Using a Polymer Electrolyte Membrane Reactor. Energies 2018, 11, 2691. [Google Scholar] [CrossRef]
  20. Jaksic, M.M.; Johansen, B.; Tunold, R. Electrochemical Behaviour of Platinum in Alkaline and Acidic Solutions of Heavy and Regular Water. Int. J. Hydrogen Energy 1993, 18, 817–837. [Google Scholar] [CrossRef]
  21. Birss, V.I.; Damjanovic, A. Oxygen Evolution at Platinum Electrodes in Alkaline Solutions: I. Dependence on Solution pH and Oxide Film Thickness. J. Electrochem. Soc. 1987, 134, 113. [Google Scholar] [CrossRef]
  22. Modestov, A.D.; Tarasevich, M.R.; Pu, H. Study of 2-Propanol, 1-Propanol, and Acetone Electrochemical Oxidation on Pt in Gelled Phosphoric Acid at 170 °C. Electrocatalysis 2016, 7, 42–49. [Google Scholar] [CrossRef]
  23. Macdonald, J.R. Impedance Spectroscopy, Emphasizing Solid Materials and Systems; John Wiley & Sons: New York, NY, USA, 1987; pp. 1–368. ISBN 0-471-83122-0. [Google Scholar]
Scheme 1. The most probable reaction pathways for acetone reduction to isopropanol at the Pt electrode [10,19].
Catalysts 14 00488 sch001
Figure 1. (a) The cyclic voltammograms recorded on the surface of the polycrystalline Pt electrode (for the second cycle) within the potential range for UPDH in 0.1 M NaOH electrolyte with acetone concentrations of 1.0 × 10⁻⁶, 1.0 × 10⁻⁵, 1.0 × 10⁻⁴, and 1.0 × 10⁻³ M. (b) As above but for highly increased acetone concentration of 0.5 M.
Catalysts 14 00488 g001
Figure 2. The cyclic voltammograms recorded on the surface of the polycrystalline Pt electrode, within the potential range for UPDH in 0.1 M NaOH electrolyte, showing the lack of surface contamination, in the presence of 1.0 × 10⁻³ M acetone (a) and in the absence of acetone (b).
Catalysts 14 00488 g002
Scheme 2. Facilitation of hydrogen bubble detachment from Pt electrode surface through intensified H bonding interactions between acetone and water molecules.
Catalysts 14 00488 sch002
Figure 3. The cyclic voltammograms recorded on the surface of the polycrystalline Pt electrode (on the second cycle), within the potential range for HER and HOR in 0.1 M NaOH electrolyte, in the absence and presence of acetone, at the indicated concentrations.
Catalysts 14 00488 g003
Figure 4. The cyclic voltammograms recorded on the surface of the polycrystalline Pt electrode, within the potential range for HER and HOR in 0.1 M NaOH electrolyte, in the presence of 1.0 × 10⁻³ M acetone (a) and in the absence of acetone (b).
Catalysts 14 00488 g004
Figure 5. The cyclic voltammograms recorded on the surface of the polycrystalline Pt electrode (on the second cycle), showing the potential range for OER in 0.1 M NaOH electrolyte in the absence and presence of acetone, at the indicated concentrations.
Catalysts 14 00488 g005
Figure 6. The cyclic voltammograms recorded on the surface of the polycrystalline Pt electrode, showing the potential range for OER in 0.1 M NaOH electrolyte, in the presence of acetone at the concentration of 1.0 × 10⁻³ M (a) and in the absence of acetone (b).
Catalysts 14 00488 g006
Figure 7. (a) The Nyquist impedance plots for UPDH, conducted on the surface of the polycrystalline Pt electrode at 200 mV vs. RHE in the base electrolyte of 0.1 M NaOH and in the presence of acetone, at the indicated concentrations. (b) Equivalent circuit used to fit the UPDH process, where CpH is Faradaic pseudocapacitance, RH is Faradaic resistance, and Cdl is double-layer capacitance (both capacitance parameters are CPEs-modified), connected in series with uncompensated solution resistance Rs.
Catalysts 14 00488 g007
Figure 8. (a) The Nyquist impedance plots for HER conducted on the surface of polycrystalline platinum electrode at −300 mV vs. RHE in 0.1 M NaOH in the absence and presence of acetone, at the indicated concentrations. (b) Equivalent circuit used to fit the data for HER and OER processes, where Rct is charge transfer resistance and Cdl, and Rs correspond to the elements from Figure 7b.
Catalysts 14 00488 g008
Figure 9. The Nyquist impedance plots for OER conducted on the surface of the polycrystalline platinum electrode at 1700 mV vs. RHE in 0.1 M NaOH, in the absence and presence of acetone at the indicated concentrations.
Catalysts 14 00488 g009
Table 1. The resistance and capacitance parameters for the process of UPDH on the polycrystalline Pt electrode surface in 0.1 M NaOH solution, recorded in the absence and presence of various concentrations of acetone, obtained by fitting the equivalent circuit (Figure 7b) to the recorded impedance data (the values of dimensionless φ parameter for the CPE circuits fluctuated between 0.93 and 0.96; χ2 = 2 × 10⁻⁵–3 × 10⁻³).
0.1 M NaOH
E/mVRH/Ω cm2Cdl/μF cm−2CpH/μF cm−2
10060.0 ± 1.623.2 ± 0.7164 ± 4
15082.6 ± 3.926.4 ± 4.6182 ± 7
20067.2 ± 1.943.8 ± 1.2427 ± 14
250212.9 ± 13.959.1 ± 1.2209 ± 10
300696.0 ± 73.661.2 ± 4.3291 ± 31
3504294.0 ± 112.076.2 ± 0.9344 ± 19
0.1 M NaOH + 1.0 × 10⁻⁶ M acetone
10052.9 ± 1.933.6 ± 1.6172 ± 3
15088.6 ± 3.432.6 ± 1.2141 ± 6
200138.0 ± 5.339.7 ± 1.2163 ± 8
25091.6 ± 3.973.3 ± 2.7458 ± 28
300224.0 ± 19.078.3 ± 2.2231 ± 22
3501050.0 ± 57.376.8 ± 1.3352 ± 23
0.1 M NaOH + 1.0 × 10⁻⁵ M acetone
10041.3 ± 2.238.5 ± 2.5186 ± 8
15062.6 ± 2.937.2 ± 1.8152 ± 7
20098.4 ± 4.345.9 ± 1.7188 ± 10
25077.6 ± 3.777.8 ± 3.2 449 ± 27
300274.0 ± 25.475.1 ± 2.0523 ± 31
3501029.0 ± 59.987.5 ± 1.5 411 ± 12
0.1 M NaOH + 1.0 × 10⁻⁴ M acetone
10030.3 ± 1.834.5 ± 2.7197 ± 9
15067.4 ± 3.246.9 ± 2.1266 ± 13
20075.0 ± 2.145.5 ± 4.4175 ± 9
25091.1 ± 5.364.6 ± 2.5421 ± 26
300349.0 ± 25.950.3 ± 1.2487 ± 17
350855.0 ± 50.2115.0 ± 2.2352 ± 19
0.1 M NaOH + 1.0 × 10⁻³ M acetone
10014.5 ± 1.446.6 ± 6.9187 ± 10
15019.3 ± 1.643.6 ± 5.1162 ± 8
20025.0 ± 2.145.5 ± 4.4175 ± 9
25061.5 ± 5.443.6 ± 2.5178 ± 10
300189.0 ± 13.939.7 ± 1.2200 ± 13
350506.0 ± 27.351.6 ± 1.1143 ± 5
Table 2. The resistance and capacitance parameters for the process of HER on polycrystalline Pt electrode surface in 0.1 M NaOH solution, recorded in the absence and presence of acetone at the indicated concentrations, obtained by fitting the equivalent circuit (Figure 8b) to the recorded impedance data (values of dimensionless φ parameter for the CPE circuit fluctuated around 0.85; χ2 = 3 × 10⁻⁵–5 × 10⁻³).
0.1 M NaOH
E/mVRct/Ω cm2Cdl/μF cm−2
−100104.2 ± 1.142.1 ± 0.9
−15072.8 ± 1.043.5 ± 1.3
−20052.2 ± 0.744.9 ± 1.6
−30034.1 ± 0.648.1 ± 2.3
−40025.2 ± 0.551.5 ± 3.1
−50020.2 ± 0.554.4 ± 4.1
0.1 M NaOH + 1.0 × 10⁻⁴ M acetone
−100102.7 ± 1.144.7 ± 1.0
−15078.5 ± 0.945.5 ± 1.2
−20052.1 ± 0.747.5 ± 1.6
−30031.2 ± 0.651.2 ± 2.6
−40022.3 ± 0.555.3 ± 3.6
−50017.9 ± 0.558.7 ± 4.6
0.1 M NaOH + 1.0 × 10⁻³ M acetone
−10091.1 ± 1.1949.5 ± 1.3
−15073.2 ± 1.049.8 ± 1.5
−20049.6 ± 0.751.9 ± 1.9
−30029.0 ± 0.656.2 ± 3.1
−40020.5 ± 0.560.9 ± 4.4
−50016.3 ± 0.565.2 ± 5.7
Table 3. The resistance and capacitance parameters for the process of OER on the polycrystalline Pt electrode surface in 0.1 M NaOH solution, in the absence and presence of acetone at the indicated concentrations, obtained by fitting the equivalent circuit (Figure 8b) to the recorded impedance data (values of dimensionless φ parameter for the CPE circuit fluctuated around 0.94; χ2 = 3 × 10⁻⁵–2 × 10⁻³).
0.1 M NaOH
E/mVRct/Ω cm2Cdl/μF cm−2
160016,976 ± 164523.3 ± 1.2
17001644 ± 2022.9 ± 0.3
1800260 ± 225.7 ± 0.6
190045 ± 124.3 ± 1.5
200014 ± 024.3 ± 2.6
0.1 M NaOH + 1.0 × 10⁻⁶ M acetone
160014,805 ± 16924.4 ± 0.2
17001446 ± 924.5 ± 0.3
180099 ± 130.0 ± 0.8
190045 ± 027.6 ± 1.4
200014 ± 023.8 ± 2.3
0.1 M NaOH + 1.0 × 10⁻³ M acetone
160012,266 ± 12623.9 ± 0.2
17001157 ± 523.7 ± 0.3
1800161 ± 128.0 ± 0.6
190030 ± 026.0 ± 1.8
200011 ± 027.6 ± 3.0
Disclaimer/Publisher’s Note: The statements, opinions and data contained in all publications are solely those of the individual author(s) and contributor(s) and not of MDPI and/or the editor(s). MDPI and/or the editor(s) disclaim responsibility for any injury to people or property resulting from any ideas, methods, instructions or products referred to in the content.

