Article

Enhanced Catalytic Synthesis of Flavonoid by UV-B Radiation in Artemisia argyi

1
Institute of Radiation Technology, Beijing Academy of Science and Technology, Beijing 100875, China
2
College of Life Science and Technology, Beijing University of Chemical Technology, Beijing 100029, China
3
School of Biomedicine, Beijing City University, Beijing 100094, China
4
School of International Education, Beijing University of Chemical Technology, Beijing 100029, China
5
National Natural History Museum of China, Beijing 100050, China
*
Authors to whom correspondence should be addressed.
These authors contributed equally.
Catalysts 2024, 14(8), 504; https://doi.org/10.3390/catal14080504
Submission received: 12 July 2024 / Revised: 29 July 2024 / Accepted: 2 August 2024 / Published: 5 August 2024
(This article belongs to the Special Issue Recent Advances in Biocatalysis and Enzyme Engineering)

Abstract

:
Enzymatic synthesis of specific active substances is an important foundation for biological adaptations to various stresses. In this study, we investigated the metabolic response of the medicinal herb Artemisia argyi to UV-B radiation through transcriptome and metabolome analysis. In all tested samples, there were 544 shared differentially expressed genes, most of which were linked to the metabolism of flavonoids and fatty acids. A total of 283 differential metabolites were identified and classified into 10 categories, with flavonoids being the largest category. Through an integrated analysis of genes and metabolites involved in flavonoid biosynthesis, flavonoids were predicted to be critical for the adaptation of A. argyi to UV radiation. The increased plant hormones methyl jasmonate and salicylic acid were considered as key regulatory approaches for catalyzing the large-scale synthesis of flavonoids. We explored this by investigating the flavonoid production of A. argyi grown at different altitudes. It showed that total flavonoid content of A. argyi planted in high-altitude areas was 45% higher than that in low-altitude areas. These findings not only deepen our understanding of flavonoid anabolism and its regulation but also provide a reliable strategy for improving flavonoid content in the genus Artemisia.

1. Introduction

Artemisia argyi, a perennial herb of the Asteraceae family, is widely distributed in Asia, Europe, and North America [1]. A. argyi is rich in active ingredients, including flavonoids, phenolic acids, coumarins, terpenoids, lignans, alkaloids, tannins, and organic acids [2,3]. These active constituents not only protect plants from biotic and abiotic stresses but also serve as anthelmintic, antibacterial, antirheumatic, and antispasmodic agents for the treatment of diseases such as malaria and hepatitis [4,5,6].
Among the active ingredients in A. argyi, flavonoids are polyphenolic secondary metabolites with highly variable structures. Based on structural differences, flavonoids can be classified into various categories, including flavones, anthocyanins, isoflavones, flavonols, chalcones, flavanols, flavanones, and flavanonols [7,8]. Flavonoids possess multiple physiological functions in plants. As antioxidants, they can resist ultraviolet (UV) damage and oxidative stress through several mechanisms: (i) they can chelate transition metal ions, thus reducing the level of reactive oxygen species; (ii) they can stabilize unpaired electrons; and (iii) they are highly reactive as hydrogen or electron donors [9]. Anthocyanins can accumulate in plant cells under UV stress and are believed to play a key role in UV radiation resistance [10,11]. In most cases, the anabolism of flavonoids in plants is inhibited by biotic stresses such as pathogens and pests. However, some flavonoid metabolites, like catechins, quercetin, and rutin, are synthesized in large quantities to combat pathogens and pests [12,13,14]. In addition, flavonoids promote the accumulation of auxin by inhibiting polar auxin transport under stress, thereby regulating plant growth and enhancing stress resistance [15,16].
Flavonoid synthesis in plants is characterized by three modules. The first module, known as the phenylpropanoid pathway, is responsible for synthesizing the precursor molecule p-coumaroyl-CoA [17]. The conversion of phenylalanine to p-coumaroyl-CoA involves the sequential actions of phenylalanine ammonia-lyase (PAL, EC 4.3.1.5), cinnamate4-hydroxylase (C4H, EC 1.14.13.11), and 4-coumarate-CoA ligase (4CL, EC 6.2.1.12). The second module focuses on the generation of flavonoids. Chalcone synthase (CHS, EC 2.3.1.74) catalyzes the condensation between p-coumaroyl-CoA and three malonyl-CoA molecules to form chalcone. This intermediate is then isomerized into naringenin by chalcone isomerase (CHI, EC 5.5.1.6) [18]. Naringenin and chalcone serve as vital intermediates from which various other flavonoids are produced [19,20]. The third module involves the modification of flavonoids through glycosylation or methylation. This requires the introduction of hydroxy groups followed by the action of glucosyl or methyltransferases, leading to the formation of flavonoid glycosides and methyl flavonoids, respectively [21,22]. These modifications are often specific. For example, uridine diphosphate glycosyltransferase adds mono- or disaccharides to specific positions, mainly the 3-O and 7-O positions, of the flavonoid backbone to create a diverse range of flavonoid glycosides [21,23]. The synthesis of flavonoids is modulated by intracellular and extracellular factors. Various transcription factors, such as MYBs and WD40s, positively or negatively control genes involved in the flavonoid synthesis pathway [24,25,26]. The promoters of these genes typically contain a specific regulatory element called the secondary wall MYB representative element, which can be recognized and bound by MYBs. Multiple environmental factors, such as light, water, and temperature, as well as interactions with endophytic or surface fungi, can also affect the synthesis of flavonoids in plants [27,28,29].
With the aim of better understanding the catalytic synthesis mechanism of flavonoids, we conducted multiomic investigations on A. argyi under UV-B radiation. This work revealed more details about the promotion of flavonoid biosynthesis by UV-B radiation and provided valuable guidance for improving the cultivation of this economically important plant.

2. Results and Discussion

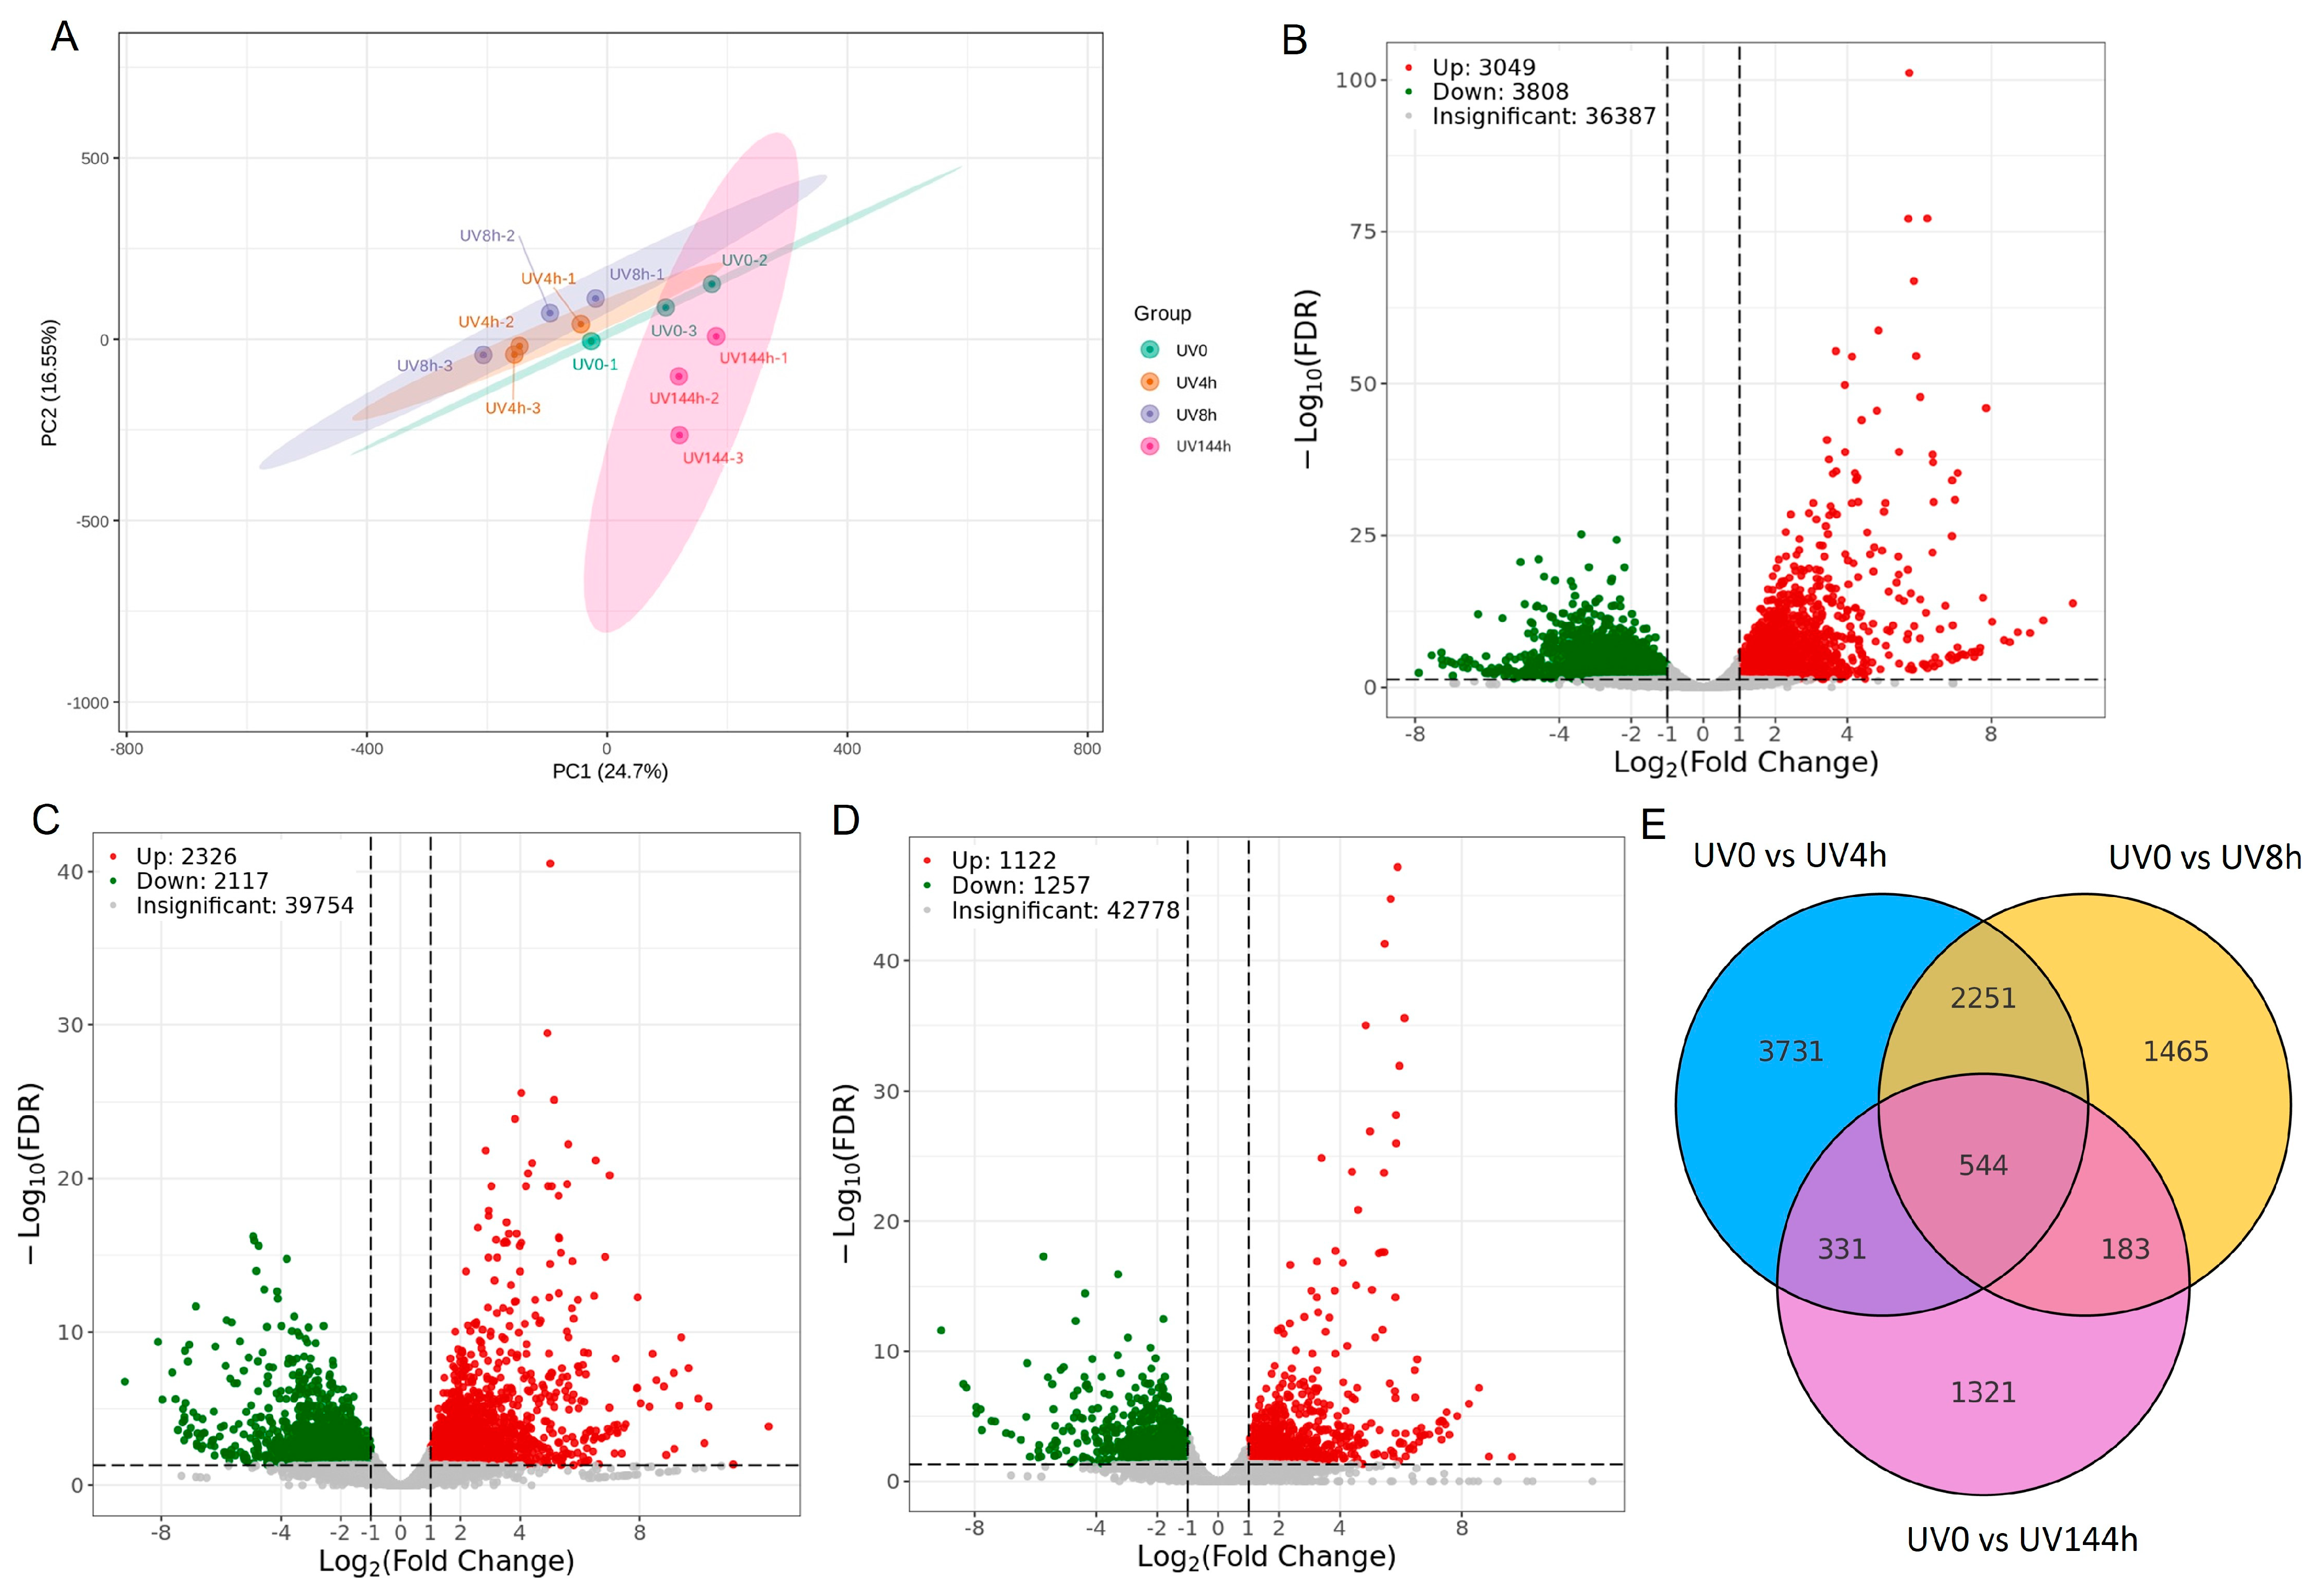
2.1. Illumina Sequencing and DEG Analysis

To reveal the potential resistance mechanisms of A. argyi against UV irradiation, RNA-Seq analysis was carried out on samples treated with UV-B irradiation for 0 h (control), 4 h, 8 h, and 144 h. A total of 12 cDNA libraries were obtained. The test results indicated that the data were of a suitable quality for further analysis (Table S1). Unigenes were assembled and used to search in the KOG, GO, KEGG, NR, Pfam, Tremble, and Swiss-Prot databases, resulting in the annotation of 68,776, 59,854, 74,488, 79,682, 65,307, 79,382, and 59,521 unigenes, respectively (Table S2). Principle component analysis (PCA) of the individual samples showed that PC1, which accounts for 24.7% of the variation in gene expression, could separate samples treated with UV for 4 and 8 h from the controls, while PC2, which accounts for 16.6% of the variance, discriminated between the 144 h UV-treated samples and the other samples (Figure 1A).
Different comparisons (UV0 vs. UV4h, UV0 vs. UV8h, and UV0 vs. UV144h) were conducted to identify the differentially expressed genes (DEGs) based on the value of log2 (fold change) and the p-value. In the pairwise comparisons, the upregulated DEGs were 3049, 2326, and 1122, and the downregulated reached 3808, 2117, and 1257, respectively (Figure 1B–D). The number of DEGs significantly decreased with increasing UV irradiation time, indicating that A. argyi gradually adapted to this stress. The large number of DEGs identified in this study may reflect the complexity of the A. argyi genome, which has undergone a recent whole-genome duplication and features 62,000 genes [3,30]. Venn plot analysis revealed that 2795 DEGs were shared by two comparison groups, UV0 versus UV4h and UV0 versus UV8h (Figure 1E). The shared DEGs might be correlated with the susceptibility of A. argyi to UV-B irradiation. In addition, 875 DEGs were found between the comparison of UV0 versus UV4h and UV0 versus UV144h, while only 727 DEGs were obtained between the comparison of UV0 versus UV8h and UV0 versus UV144h. In the above three comparisons, there were 544 shared DEGs, which might play a vital role in A. argyi’s resistance to UV radiation.

2.2. Metabolic Pathway Enrichment Analysis for DEGs

By harnessing bioinformatic databases such as GO and KEGG, the most relevant biological pathways for the DEGs were obtained. GO enrichment analysis uncovered that the DEGs were enriched for the terms “ribosomal subunit”, “unsaturated fatty acid”, “oxidoreductase activity”, “aromatic amino acid metabolism”, “chloroplast inner membrane”, and “flavonoid biosynthetic process” (Figure S1). The KEGG enrichment analysis demonstrated that “biosynthesis of secondary metabolites” and “metabolic pathways” were the most significantly enriched pathways in all three comparisons (Figure 2A–C). Furthermore, “phenylpropanoid biosynthesis”, “alpha-linolenic acid metabolism”, “stilbenoid, diarylheptanoid, and gingerol biosynthesis”, “phenylalanine, tyrosine, and tryptophan biosynthesis”, and “phenylalanine metabolism” were highly enriched in the UV4h and UV8h DEGs, suggesting that these metabolic pathways might be conducive to the early adaption of A. argyi to UV radiation [31,32]. Compared to UV0 versus UV4h DEGs (Figure 2A), five significantly enriched pathways were uniquely found in the UV0 versus UV8h group, namely “cysteine and methionine metabolism”, “lysine biosynthesis”, “brassinosteroid biosynthesis”, “C5-branched dibasic acid metabolism”, and “photosynthesis antenna proteins” (Figure 2B). These pathways might be related to the recovery of photosynthesis and cell resistance to stress. The profile of enriched KEGG pathways for UV144h and UV8h DEGs was similar (Figure 2C). The UV4h, UV8h, and UV144h DEGs shared enrichment for “biosynthesis of secondary metabolites”, “flavonoid biosynthesis”, “flavone and flavonol biosynthesis”, and “fatty acid metabolism”. Further analysis showed that the majority of DEGs enriched in “flavonoid biosynthesis” and “flavone and flavonol biosynthesis” pathways were upregulated (Figure 2D). In contrast, most of the enriched DEGs in “fatty acid metabolism” pathways were downregulated. Hence, it can be inferred that the DEGs involved in “flavonoid biosynthesis” and “flavone and flavonol biosynthesis” might be more closely related to the resistance of A. argyi against UV radiation [33].
Most secondary metabolites, such as flavonoids, phenolic acids, alkaloids, terpenes, etc., are synthesized through the phenylpropanoid pathway to defend against multiple stresses [34,35]. The enrichment of phenylpropanoid-pathway-related DEGs at UV4h and UV8h support this viewpoint (Figure 2A,B). Our findings suggest that exposure to high levels of UV induced major changes in fatty acid metabolism. This is consistent with a previous work, which showed that rapid changes in membrane lipids, especially unsaturated fatty acids, are essential for cells to cope with various environmental stresses [36]. In summary, our transcriptome data indicate that alterations in flavonoid biosynthesis and fatty acid metabolism play major roles in the adaptation of A. argyi to UV stress.

2.3. Metabolomic Analysis

To verify the results of transcriptome analysis, a widely targeted metabolome analysis was carried out on samples collected at 0 h and 144 h after UV radiation. A total of 1033 metabolites were obtained in all samples. In the PCA plot, the UV0 and UV144h samples were grouped separately (Figure 3A). Using a fold change threshold (|log2(fold change)| ≥ 1 and FDR < 0.05), a total of 283 differentially accumulated metabolites (DAMs) were found in the comparison between UV0 and UV144h, of which 196 metabolites were upregulated and 87 metabolites were downregulated (Figure 3B). A heatmap of DAMs displayed varying degrees of differences in metabolome among the test samples (Figure 3C).
The 283 DAMs in A. argyi leaves in response to UV radiation could be divided into the following ten subgroups: flavonoids (100), phenolic acids (49), amino acids and derivatives (24), lignans and coumarins (19), lipids (18), alkaloids (17), nucleotides and derivatives (16), terpenoids (15), organic acids (13), and others (12) (Figure 3D). Hence, the DAMs were predominantly secondary metabolites. These compounds are known to play significant roles as signaling and structural molecules in plant defense and development [35].

2.4. Candidate DAMs with Potential Roles in UV-B Resistance

The largest group of DAMs identified by KEGG enrichment analysis was “biosynthesis of secondary metabolites”, which is consistent with our transcriptome analysis (Figure 2A–C). This was followed by “biosynthesis of amino acids”, “flavone and flavonol biosynthesis”, “aminoacyl-tRNA biosynthesis”, and “ABC transporters” (Figure 4A).
The compounds showing the greatest upregulation in terms of fold change were four flavonoids (sinensetin, 6-C-methylquercetin-3-O-rutinoside, taxifolin-3′-O-glucoside, and isosinensetin), two terpenoids (ridentin and geniposidic acid), one lignan and coumarin (daphnetin), one alkaloid (N-cinnamoyl serotonin), one amino acid (L-cysteine), and one fatty acid (eicosenoic acid) (Figure 4B). The most downregulated DAMs were two flavonoids (isoluteolin and tamarixetin), three amino acids and derivatives (L-histidine, L-ornithine, and N-ethylmaleimide), one organic acid (2,2-dimethyl succinic acid), one lipid (1-stearidonoyl-glycerol), one lignan and coumarin (dimethyl wedelolactone), one phenolic acid (trans-5-O-p-coumaroyl shikimate), and one solatriose. The top 10 upregulated DAMs possess strong antioxidant capacity, which presumably serve to alleviate the increased intracellular reactive oxygen species (ROS) derived from UV radiation. Similar responses were reported for other abiotic stresses. For example, flavonoids are considered to play key roles in the resistance of Atriplex canescens to salt stress, in Hordeum vulgare L., qingke to drought stress, and in Liriope spicata to cold stress [37,38]. Similarly, the content of flavonoids is significantly increased in rust-infected symptomatic leaves of Malus [13].
Among the DAMs, the largest category was flavonoids, with 90 of them being upregulated and 10 downregulated (Figure 3D). The 100 flavonoid DAMs responding to UV-B can be classified into eight subgroups: flavonols (45), flavones (31), flavanones (10), isoflavones (6), chalcones (3), flavanols (2), flavanonols (2), and flavonoid carbonoside (1) (Figure 4C, Table S3). Flavonols, flavones, and flavanones comprised the majority (86%) of the flavonoid DAMs, indicating their importance in the resistance of A. argyi to UV radiation. Interestingly, flavones and flavonols were found to be associated with the resistance of Z. bungeanum to stem canker, indicating a general role for these compounds in stress tolerance [39]. Indeed, flavonoids are the most extensively studied secondary metabolites in the plant defense system against abiotic and biotic stress [40]. The accumulation of flavonoids in the surface cells of leaves under UV-B can effectively absorb UV-B radiation energy, thereby protecting plant photosynthetic tissues from damage [41,42]. In addition, flavonoids can decrease the ROS generated by the dissipation of the electron transport chain (mitochondria and/or chloroplasts) and directly reduce oxidative damage caused by UV-B [43]. Therefore, the antioxidant properties of flavonoids, rather than their role as photosorbents, may largely explain their contribution to UV-B stress tolerance.

2.5. Integrated Analysis of Genes and Metabolites Involved in Flavonoid Biosynthesis

Through transcriptome and metabolome analysis, it was found that flavonoids, particularly flavones and flavonols, were enhanced in A. argyi leaves after exposure to UV radiation. Hence, the biosynthesis of flavones and flavonols in response to UV radiation was analyzed in detail. An examination of the genes encoding the enzymes that catalyze the generation of the flavonoid precursors cinnamic acid and coumaroyl-CoA showed that the levels of PAL and C4H transcripts were significantly upregulated at all three time points, while 4CL expression was significantly upregulated only at 4 h and 8 h (Figure 5). No products of these reactions were detected in the present work, suggesting that these intermediates are rapidly consumed. An examination of downstream genes encoding CHS, CHI, flavone synthase (FNS, EC 1.14.20.5), naringenin 3-dioxygenase (F3H, EC1.14.11.9), flavanoid 3′,5′-hydroxylase (F3′5′H, EC 1.14.14.81), and flavonoid 3′-monooxygenase (F3′M, EC 1.14.14.82) showed that these genes were upregulated under UV radiation, consistent with the observed increase in the level of flavones. Also upregulated was the gene encoding flavonol synthase (FLS, EC 1.14.20.6), which catalyzes the production of kaempferol from dihydrokaempferol, thereby initiating the synthesis of flavonols. In addition, downstream genes encoding F3′M—flavonol 3-O-glucosyltransferase (GT1, EC 2.4.1.240) and flavonoids 3-O-glucoside L-rhamnose transferase (FGT, EC 2.4.1.159)—were upregulated, which is reflected in the observed increase in the flavonols isoquercetrin and rutin that they produce, while the expression of the gene encoding quercetin-6-hydroxylase (Q6H) and the levels of its products were decreased. To further verify the expression levels of genes involved in flavonoid synthesis, nine genes (including PAL, 4CL, C4H, CHI, CHS, FNS, FLS, GT1, and F3H) were measured with qRT-PCR. The results of qRT-PCR were consistent with the results of RNA-seq (Figure S2), indicating the reliability of the RNA-seq data.
The expression of isoflavone and flavanol biosynthetic genes also showed increased expression, matching the observed increase in the levels of these compounds. Interestingly, most of the flavonoid compounds that were found to accumulate under UV radiation were glycosylated, which may reflect the improved solubility and stability of glycosylated flavonoids relative to their corresponding aglycones [44].
Our accumulated knowledge of the biochemical, genetic, and molecular aspects of flavonoid metabolism in plants has made it practical to harness flavonoid metabolism to control plant resistance to biotic and abiotic stresses. Co-expression of CHS, CHI, and dihydroflavonol 4-reductase (DFR) led to a notable increase in flavonoids and enhanced the resistance of flax to the Fusarium oxysporum infection [45]. Hence, our identification of specific flavonoid biosynthetic genes induced by UV-B stress provides important guidance for engineering stress-resistant plants in the future.

2.6. The Potential Regulation of Flavonoids by Salicylic Acid and Jasmonic Acid

Plant hormones play an important regulatory role in the growth, development, and physiological processes of plants. Among the detected plant hormones, only methyl jasmonate (methyl-JA) and salicylic acid were upregulated in the current study at UV144h (Figure S3). Therefore, the biosynthesis of methyl-JA and salicylic acid in response to UV radiation was analyzed. The detection of the genes encoding fatty acid desaturase that catalyze the synthesis of the jasmonate precursor linolenic acid, showed that the level of FAD3 and FAD6 were significantly upregulated only at 4 h and 8 h, while FAD4 expression was significantly upregulated at all three time points (Figure 6A). Though the expression of enzymes such as allene oxide synthase (AOS) and allene oxide cyclase (AOC, EC 5.3.99.6) that catalyze intermediate steps was not significantly upregulated, the significant upregulation of jasmonic acid carboxyl methyltransferase (JMT, EC 2.1.1.141) transcripts at all three time points could explain the increase in methyl-JA content. The synthesis of salicylic acid in plants is mainly carried out through the isochorismate synthase (ICS, EC 5.4.4.2) pathway rather than the phenylalanine ammonia lyase (PAL) pathway [46,47]. Chorismate is an important product of the shikimate pathway and precursor for the synthesis of aromatic amino acids [46]. The upregulated or/and significantly upregulated expression of key genes in the shikimate pathway and ICS pathway not only explained the significant increase in the level of salicylic acid but also provided a basis for the enhanced synthesis of flavonoids (Figure 6B).
Increased levels of salicylic acid and methyl-JA may lead to the observed increase in the expression of PAL, 4CL, FNS, and other genes by transcription factors MYB, bHLH, or WD40, thereby enhancing the synthesis of secondary metabolites to help A. argyi adapt to the UV stress [48,49,50]. Based on the above results, we proposed a metabolic model of flavonoids in A. argyi responding to UV radiation (Figure 6C), in which flavonoids might play a central role.

2.7. Verification of Enhanced Flavonoid Synthesis by UV Radiation

Our results show that UV exposure is associated with the accumulation of flavonoids in A. argyi. However, the highly controlled growth environment and artificial UV-B source used may not accurately reflect natural conditions. UV exposure increases with altitude, with UV levels increasing by approximately 10 per cent for every 1000 m increase in altitude. Thus, to assess whether this phenomenon also occurs in nature, we compared the flavonoid content of A. argyi planted in Nanyang (Henan province, 120 m above sea level) and Qushui (Tibet, about 4000 m above sea level). We found that the total flavonoid content of A. argyi planted in Qushui was 45% higher than for the plants grown in Nanyang (Figure 7). This demonstrates that A. argyi grown at a high altitude will produce a higher content of flavonoids than those grown in low-lying areas. Notably, the level achieved was even higher than the one obtained through exposure to strong UV radiation. Although we cannot rule out the contribution of other factors that may differ between the sites, such as low temperature or exposure to biotic stresses, it seems likely that this difference can at least be partly accounted for by the increased levels of UV exposure at a high altitude.

3. Materials and Methods

3.1. Plant Material and Cultivation Method

The A. argyi H. Lév. and Vaniot cultivar NYYY used in this study was originally provided by Guoyizhongjing Wormwood Industry Company (Nanyang, China) and subsequently propagated in our laboratory [3]. The NYYY plants were grown in soil at 25 °C under a 16/8 h light/dark photoperiod with a light intensity of 100 μmol m−2 s−1 for 2 months; then, they were transferred to 24 h light for 10 days. Afterwards, the plants were treated with UV-B radiation (2.5 μmol m−2 s−1, Huizhou Kedao Technology Co., Ltd., Huizhou, China), and leaves were harvested at 0 h, 4 h, 8 h, and 144 h, respectively. The collected leaf samples were immediately frozen in liquid nitrogen and stored at −80 °C for further analysis.

3.2. RNA Isolation and Transcriptome Sequencing

RNA was isolated from all samples and quality checked as previously described [4]; then, it used for cDNA library construction and sequencing, which was performed by Metware Biotechnology Corporation (Wuhan, China). Trinity version 2.13.2 (Broad Institute, Cambridge, MA, USA, 2023) was applied to assemble the clean reads from all samples [3]. The unigene assembly was annotated by harnessing seven major databases: the Kyoto Encyclopedia of Genes and Genomes (KEGG) database, the National Center for Biotechnology Information (NCBI) non-redundant (NR) protein database, Swiss-Prot (a manually annotated and reviewed protein sequence database), Tremble, EuKaryotic Orthologous Groups (KOG), the Gene Ontology (GO) database, and the Protein Family (Pfam) database. DEGs between different groups were screened by harnessing DESeq2 (D2iQ Co., San Francisco, CA, USA, 2013) with thresholds of |log2(fold change) | ≥ 1 and p-value < 0.01. To identify the function of DEGs, GO enrichment analysis was carried out using top GO and KEGG pathways, and ClusterProfiler version 4.0 (Yu lab, Nanjing University, China, 2021) was employed for enrichment analysis. Samples taken at 0 h were applied as the control.

3.3. Metabolite Extraction and Widely Targeted Metabolome Analysis

Leaves collected at 0 h and 144 h were freeze-dried in a Scientz-100F freeze dryer (Scientz Biotechnology Corporation, Ningbo, China). After a treatment with a mixer mill MM400 (Retsch Technology, German) with a zirconia bead at 30 Hz for 1.5 min, 100 mg of powder was dissolved in 1.2 mL of 70% methanol solution (v/v) and vortexed for 30 s every 30 min a total of 6 times. The mixtures were incubated at 4 °C overnight. Subsequently, the samples were centrifuged at 12,000× g for 10 min, and the supernatants were filtered with a 0.22 μm SCAA-104 filter (ANPEL, Shanghai, China) before widely targeted metabolome analysis (WTMA). WTMA was performed by Metware Biotechnology Corporation (Wuhan, China), as previously reported [51]. Metabolites with thresholds of |log2(fold change)| ≥ 1 and FDR < 0.05 were identified as DAMs.

3.4. Quantitative Real-Time PCR

To verify the reliability of the transcriptome results, qRT-PCR was carried out on a subset of genes. Total mRNA was extracted from samples by using a Plant RNA Kit (Omega, Norcross, GA, USA) and then used as a template to synthesize cDNA through reverse transcription reaction by employing a UEIris II RT-PCR Kit (Novoprotein, Suzhou, China). The resultant cDNA was used for qRT-PCR analysis using the NovoStart SYBR qPCR SuperMix Plus system (Novoprotein, China). The primers used for qPCR analysis are listed in Table S4. All manipulations were implemented in accordance with the manufacturer’s instructions. The 2−ΔΔCt method was used to calculate the expression levels of target genes [52], with the A. argyi gene coding for actin used as the internal standard.

3.5. Quantitation of Total Flavonoids in A. argyi Leaves

Fresh leaves were taken from the middle of A. argyi plants growing in Nanyang (Henan province) and Qushui (Tibet, China) with permission and stored at −80 °C. The extraction of total flavonoids from A. argyi leaves was carried out according to the following protocol. The leaves were dried to a constant weight and then crushed, and 100 mg of the resulting powder was mixed with 1 mL of 60% methanol (v/v). The samples were then subjected to an ultrasonic disruption, as follows: ultrasonic power of 300 W, temperature of 60 °C, and extraction time of 30 min. The samples were then centrifuged at 12,000 rpm for 10 min, and the supernatant was used for testing.
A Plant Flavonoid Assay kit (Solarbio Technology Corporation, Beijing, China) was used to measure the flavonoid content according to the manufacturer’s instructions, with slight modifications [53]. First, 50 µL of sample extract was mixed with 50 µL of 5% NaNO2 (wt/v) and incubated at 25 °C for 5 min. Then, 50 µL of 10% Al(NO3)3 (wt/v) was added to the reaction and incubated at 25 °C for 5 min. Finally, 400 µL of 4% NaOH (wt/v) was supplemented to the reaction system, and the mixture was diluted with 60% methanol (v/v) to a final volume of 1 mL. After incubation at 37 °C for 45 min, the mixture was centrifuged at 10,000× g for 10 min, and the supernatant’s absorbance at 470 nm was measured. A calibration curve (y = 0.8649X + 0.0131, R2 = 0.9996) was created for rutin using final concentrations of 0.02, 0.04, 0.08, 0.16, 0.32, and 0.64 mg/mL. Flavonoid content was expressed as mg/g dry weight.

3.6. Statistical Analysis

Three biological replicates were used for all treatments, and data variance was calculated as the mean ± standard deviation (SD). Statistical significance was considered at a p-value of < 0.05 using a t-test.

4. Conclusions

In this study, we characterized the key metabolites and genes encoding enzymes of A. argyi in response to UV-B radiation using transcriptome and metabolomic analysis. Most of the 544 DEGs and 283 DAMs detected were linked to the metabolism of flavonoids. Based on our comprehensive analysis, a metabolic model of A. argyi responding to UV-B radiation was proposed, in which flavonoids were considered as a central component. We further demonstrated that A. argyi planted in high-altitude areas with increased UV exposure accumulated higher levels of flavonoids. This work not only provides valuable information on the enhanced catalytic synthesis of flavonoid by UV radiation but also provides a practicable planting approach for improving flavonoid content in the genus Artemisia.

Supplementary Materials

The following supporting information can be downloaded at: https://www.mdpi.com/article/10.3390/catal14080504/s1, Figure S1: GO enrichment of DEGs in the comparisons of UV0 versus UV4h (A), UV0 versus UV8h (B), and UV0 versus UV6d (C).; Figure S2: Validation of genes related to flavonoid biosynthesis by qRT-PCR. Nine genes were selected: PAL, 4CL, C4H, CHI, CHS, FNS, FLS, GT1, and F3H. Actin was used as control; Figure S3: Changes in plant hormones levels in the comparison of UV0 versus UV6d; Table S1: RNA-Seq data statistics of A. argyi; Table S2: Unigenes annotation of A. argyi; Table S3: Flavonoid DAMs in A. argyi leaves in the comparison of UV0 and UV6d; Table S4: Primers for qRT-PCR analysis.

Author Contributions

Conceptualization, H.G., M.S. and J.L.; investigation, H.G., S.L., G.L., L.H., T.S., M.S. and J.L.; resources, H.G.; validation, S.L. and M.S.; supervision, M.S. and J.L.; writing—original draft preparation and revision, M.S. and J.L. All authors have read and agreed to the published version of the manuscript.

Funding

This research was financially supported by grants from the Reform and Development Program of Beijing Academy of Science and Technology (Grant No. 13001–2101 and 13001–2020-03) and the National Nature Science Foundation of China (Grant No. 22078013).

Data Availability Statement

The data presented in this study are available upon request from the corresponding author.

Acknowledgments

The authors are grateful for the support of the Reform and Development Program of Beijing Academy of Science and Technology and the National Nature Science Foundation of China. We thank the reviewers and editors for their careful review of this manuscript.

Conflicts of Interest

The authors declare that they have no known competing financial interests or personal relationships that could have appeared to influence the work reported in this paper.

References

  1. Bora, K.S.; Sharma, A. The genus Artemisia: A comprehensive review. Pharm. Biol. 2011, 49, 101–109. [Google Scholar] [CrossRef] [PubMed]
  2. Song, X.; Wen, X.; He, J.; Zhao, H.; Li, S.; Wang, M. Phytochemical components and biological activities of Artemisia argyi. J. Funct. Foods 2019, 52, 648–662. [Google Scholar] [CrossRef]
  3. Qiao, Y.; Wu, L.; Yang, S.; Wang, Q.; Gu, H.; Wei, L.; Liu, G.; Zhou, S.; Wang, P.; Song, M. Metabolomic and transcriptomic analyses provide insights into variations in flavonoids contents between two Artemisia cultivars. BMC Plant Biol. 2023, 23, 288. [Google Scholar] [CrossRef]
  4. Rashid, M.U.; Alamzeb, M.; Ali, A.; Ullah, Z.; Shah, Z.A.; Naz, I.; Khan, M.R. The chemistry and pharmacology of alkaloids and allied nitrogen compounds from Artemisia species: A review. Phytother. Res. 2019, 33, 2661–2684. [Google Scholar] [CrossRef] [PubMed]
  5. Panahirad, S.; Morshedloo, M.R.; Ali, S.; Hano, C.; Kulak, M. Secondary metabolites and their potential roles in plant tolerance against abiotic and biotic stress. Plant Stress 2023, 10, 100292. [Google Scholar] [CrossRef]
  6. Nigam, M.; Atanassova, M.; Mishra, A.P.; Pezzani, R.; Devkota, H.P.; Plygun, S.; Salehi, B.; Setzer, W.N.; Sharifi-Rad, J. Bioactive compounds and health benefits of Artemisia species. Nat. Prod. Commun. 2019, 14, 1934578X19850354. [Google Scholar]
  7. Nabavi, S.M.; Samec, D.; Tomczyk, M.; Milella, L.; Russo, D.; Habtemariam, S.; Suntar, I.; Rastrelli, L.; Daglia, M.; Xiao, J.; et al. Flavonoid biosynthetic pathways in plants: Versatile targets for metabolic engineering. Biotechnol. Adv. 2020, 38, 107316. [Google Scholar] [CrossRef] [PubMed]
  8. Tuenter, E.; Creylman, J.; Verheyen, G.; Pieters, L.; Van Miert, S. Development of a classification model for the antigenotoxic activity of flavonoids. Bioorg. Chem. 2020, 98, 103705. [Google Scholar] [CrossRef] [PubMed]
  9. Marone, D.; Mastrangelo, A.M.; Borrelli, G.M.; Mores, A.; Laido, G.; Russo, M.A.; Ficco, D.B.M. Specialized metabolites: Physiological and biochemical role in stress resistance, strategies to improve their accumulation, and new applications in crop breeding and management. Plant Physiol. Biochem. 2022, 172, 48–55. [Google Scholar] [CrossRef]
  10. DiBiase, C.; Godtfredsen, E.; Dahl, J.; Shapiro, A.; Brown, K.; Martin, A.; Wermuth, A.; Heschel, M.S. Maternal flower color, ultraviolet protection, and germination in Ipomopsis aggregate (Polemoniaceae). Popul. Ecol. 2022, 64, 176–187. [Google Scholar] [CrossRef]
  11. Wang, F.; Xu, Z.; Fan, X.; Zhou, Q.; Cao, J.; Ji, G.; Jing, S.; Feng, B.; Wang, T. Transcriptome analysis reveals complex molecular mechanisms underlying UV tolerance of wheat (Triticum aestivum, L.). J. Agric. Food Chem. 2019, 67, 563–577. [Google Scholar] [CrossRef] [PubMed]
  12. Gómez, J.D.; Vital, C.E.; Oliveira, M.G.A.; Ramos, H.J.O. Broad range flavonoid profiling by LC/MS of soybean genotypes contrasting for resistance to Anticarsia gemmatalis (Lepidoptera: Noctuidae). PLoS ONE 2018, 13, e0205010. [Google Scholar] [CrossRef] [PubMed]
  13. Lu, Y.; Chen, Q.; Bu, Y.; Luo, R.; Hao, S.; Zhang, J.; Tian, J.; Yao, Y. Flavonoid accumulation plays an important role in the rust resistance of Malus plant leaves. Front. Plant Sci. 2017, 8, 1286. [Google Scholar] [CrossRef] [PubMed]
  14. Yang, W.; Xu, X.; Li, Y.; Wang, Y.; Li, M.; Wang, Y.; Ding, X.; Chu, Z. Rutin-mediated priming of plant resistance to three bacterial pathogens initiating the early SA signal pathway. PLoS ONE 2016, 11, e0146910. [Google Scholar] [CrossRef] [PubMed]
  15. Marhava, P. Recent developments in the understanding of PIN polarity. New Phytologist. 2022, 233, 624–630. [Google Scholar] [CrossRef] [PubMed]
  16. Kacprzyk, J.; Burke, R.; Schwarze, J.; McCabe, P.F. Plant programmed cell death meets auxin signaling. FEBS J. 2022, 289, 1731–1745. [Google Scholar] [CrossRef]
  17. Liu, X.; Cheng, J.; Zhang, G.; Ding, W.; Duan, L.; Yang, J.; Kui, L.; Cheng, X.; Ruan, J.; Fan, W.; et al. Engineering yeast for the production of breviscapine by genomic analysis and synthetic biology approaches. Nat. Commun. 2018, 9, 448. [Google Scholar] [CrossRef]
  18. Waki, T.; Takahashi, S.; Nakayama, T. Managing enzyme promiscuity in plant specialized metabolism: A lesson from flavonoid biosynthesis. BioEssays 2021, 43, 2000164. [Google Scholar] [CrossRef]
  19. Zhang, F.; Ma, Z.; Qiao, Y.; Wang, Z.; Chen, W.; Zheng, S.; Yu, C.; Song, L.; Lou, H.; Wu, J. Transcriptome sequencing and metabolomics analyses provide insights into the flavonoid biosynthesis in Torreya grandis kernels. Food Chem. 2022, 16, 131558. [Google Scholar] [CrossRef]
  20. Zhao, C.; Wang, F.; Lian, Y.; Xiao, H.; Zheng, J. Biosynthesis of citrus flavonoids and their health effects. Crit. Rev. Food Sci. Nutr. 2020, 60, 566–583. [Google Scholar] [CrossRef]
  21. Gu, N.; Liu, S.M.; Qiu, C.; Zhao, L.G.; Pei, J.J. Biosynthesis of 3′-O-methylisoorientin from luteolin by selecting O-methylation/C-glycosylation motif. Enzyme Microb. Technol. 2021, 150, 109862. [Google Scholar] [CrossRef] [PubMed]
  22. Lyu, Y.B.; Liu, S.K.; Gao, S.; Zhou, J.W. Identification and characterization of three flavonoid 3-O-glycosyltransferases from Epimedium koreanum Nakai. Biochem. Eng. J. 2020, 163, 107759. [Google Scholar] [CrossRef]
  23. Jan, R.; Asaf, S.; Paudel, S.; Lubna; Lee, S.; Kim, K.M. Discovery and validation of a novel step catalyzed by OsF3H in the flavonoid biosynthesis pathway. Biology 2021, 10, 32. [Google Scholar] [CrossRef] [PubMed]
  24. Meng, J.X.; Gao, Y.; Han, M.L.; Liu, P.Y.; Yang, C.; Shen, T.; Li, H.H. In vitro anthocyanin induction and metabolite analysis in Malus spectabilis leaves under low nitrogen conditions. Hortic. Plant J. 2020, 6, 284–292. [Google Scholar] [CrossRef]
  25. William, R.; Chezem, A.M.; Li, F.S.; Weng, J.K.; Nicole, K.C. SG2-Type R2R3-MYB transcription factor MYB15 controls defense-induced lignification and basal immunity in Arabidopsis. Plant Cell. 2017, 17, 1907–1926. [Google Scholar]
  26. Xu, W.; Dubos, C.; Lepiniec, L. Transcriptional control of flavonoid biosynthesis by MYB-bHLH-WDR complexes. Trends Plant Sci. 2015, 20, 176–185. [Google Scholar] [CrossRef] [PubMed]
  27. Neugart, S.; Krumbein, A.; Zrenner, R. Influence of light and temperature on gene expression leading to accumulation of specific flavonol glycosides and hydroxycinnamic acid derivatives in kale (Brassica oleracea var. sabellica). Front. Plant Sci. 2016, 7, 326. [Google Scholar] [CrossRef] [PubMed]
  28. Yang, L.L.; Yang, L.; Yang, X.; Zhang, T.; Lan, Y.M.; Zhao, Y.; Han, M.; Yang, L.M. Drought stress induces biosynthesis of flavonoids in leaves and saikosaponins in roots of Bupleurum chinense DC. Phytochemistry 2020, 177, 112434. [Google Scholar] [CrossRef] [PubMed]
  29. Wu, F.L.; Li, Y.; Tian, W.; Sun, Y.; Chen, F.; Zhang, Y.; Zhai, Y.; Zhang, J.; Su, H.; Wang, L. A novel dark septate fungal endophyte positively affected blueberry growth and changed the expression of plant genes involved in phytohormone and flavonoid biosynthesis. Tree Physiol. 2020, 40, 1080–1094. [Google Scholar] [CrossRef]
  30. Chen, H.; Guo, M.; Dong, S.; Wu, X.; Zhang, G.; He, L.; Jiao, Y.; Chen, S.; Li, L.; Luo, H. A chromosome-scale genome assembly of Artemisia argyi reveals unbiased subgenome evolution and key contributions of gene duplication to volatile terpenoid diversity. Plant Commun. 2023, 4, 100516. [Google Scholar] [CrossRef]
  31. Saradhi, P.P.; Alia, A.S.; Prasad, K.V. Proline accumulates in plants exposed to UV radiation and protects them against UV induced peroxidation. Biochem. Biophys. Res. Commun. 1995, 209, 1–5. [Google Scholar] [CrossRef] [PubMed]
  32. Zhou, J.; Huang, J.; Tian, X.; Zheng, J.; He, X. Transcriptome analysis reveals dynamic changes in the salt stress response in Salix. J. For. Res. 2020, 31, 12. [Google Scholar] [CrossRef]
  33. Ferreyra, M.L.F.; Serra, P.; Casati, P. Recent advances on the roles of flavonoids as plant protective molecules after UV and high light exposure. Physiol. Plant. 2021, 173, 736–749. [Google Scholar] [CrossRef]
  34. Yadav, V.; Wang, Z.; Wei, C.; Amo, A.; Ahmed, B.; Yang, X.; Zhang, X. Phenylpropanoid pathway engineering: An emerging approach towards plant defense. Pathogens 2020, 9, 312. [Google Scholar] [CrossRef] [PubMed]
  35. Ahuja, I.; Kissen, R.; Bones, A.M. Phytoalexins in defense against pathogens. Trends Plant Sci. 2012, 17, 73–90. [Google Scholar] [CrossRef] [PubMed]
  36. Yang, C.; Dong, A.; Deng, L.; Wang, F.; Liu, J. Deciphering the change pattern of lipid metabolism in Saccharomyces cerevisiae responding to low temperature. Biochem. Eng. J. 2023, 194, 108884. [Google Scholar] [CrossRef]
  37. Feng, S.; Yao, Y.T.; Wang, B.B.; Li, Y.M.; Li, L.; Bao, A.K. Flavonoids are involved in salt tolerance through ROS scavenging in the halophyte Atriplex canescens. Plant Cell Rep. 2024, 43, 5. [Google Scholar] [CrossRef] [PubMed]
  38. Xu, C.; Wei, L.; Huang, S.; Yang, C.; Wang, Y.; Yuan, H.; Xu, Q.; Zhang, W.; Wang, M.; Zeng, X.; et al. Drought resistance in Qingke involves a reprogramming of the phenylpropanoid pathway and UDP-glucosyltransferase regulation of abiotic stress tolerance targeting flavonoid biosynthesis. J. Agric. Food Chem. 2021, 69, 3992–4005. [Google Scholar] [CrossRef]
  39. Li, P.; Ruan, Z.; Fei, Z.; Yan, J.; Tang, G. Integrated transcriptome and metabolome analysis revealed that flavonoid biosynthesis may dominate the resistance of Zanthoxylum bungeanum against stem canker. J. Agric. Food Chem. 2021, 69, 6360–6378. [Google Scholar] [CrossRef]
  40. Górniak, I.; Bartoszewski, R.; Króliczewski, J. Comprehensive review of antimicrobial activities of plant flavonoids. Phytochem. Rev. 2018, 18, 241–272. [Google Scholar] [CrossRef]
  41. Olsson, L.C.; Veit, M.; Weissenböck, G.; Bornman, J.F. Differential flavonoid response to enhanced UV-B radiation in Brassica napus. Phytochemistry 1998, 49, 1021–1028. [Google Scholar] [CrossRef]
  42. Schnitzler, J.P.; Jungblut, T.P.; Heller, W.; Koferlein, M.; Hutzler, P.; Heinzmann, U.; Schmelzer, E.; Ernst, D.; Langebartels, C.; Sandermann, H. Tissue localization of u.v.-B-screening pigments and of chalcone synthase mRNA in needles of Scots pine seedlings. New Phytol. 1996, 132, 247–258. [Google Scholar] [CrossRef]
  43. Fini, A.; Brunetti, C.; Di Ferdinando, M.; Ferrini, F.; Tattini, M. Stress-induced flavonoid biosynthesis and the antioxidant machinery of plants. Plant Signal. Behav. 2011, 6, 709–711. [Google Scholar] [CrossRef] [PubMed]
  44. Qin, Z.; Wang, X.; Gao, S.; Li, D.; Zhou, J. Production of natural pigments using microorganisms. J. Agric. Food Chem. 2023, 71, 9243–9254. [Google Scholar] [CrossRef] [PubMed]
  45. Lorenc-Kukuła, K.; Wróbel-Kwiatkowska, M.; Starzycki, M.; Szopa, J. Engineering flax with increased flavonoid content and thus Fusarium resistance. Physiol. Mol. Plant Pathol. 2007, 70, 38–48. [Google Scholar] [CrossRef]
  46. Torrens-Spence, M.P.; Bobokalonova, A.; Carballo, V.; Glinkerman, C.M.; Weng, J.K. Pbs3 and eps1 complete salicylic acid biosynthesis from isochorismate in Arabidopsis. Mol. Plant. 2019, 12, 10. [Google Scholar] [CrossRef] [PubMed]
  47. Wu, J.; Zhu, W.T.; Zhao, Q. Salicylic acid biosynthesis is not from phenylalanine in Arabidopsis. J. Integr. Plant Biol. 2023, 65, 881–887. [Google Scholar] [CrossRef]
  48. Hu, Z.; Zhong, X.; Zhang, H.; Luo, X.; Wang, Y.; Wang, Y.; Liu, T.; Zhang, Y.; Wang, X.; An, H.; et al. GhMYB18 confers Aphis gossypii glover resistance through regulating the synthesis of salicylic acid and flavonoids in cotton plants. Plant Cell Rep. 2023, 42, 355–369. [Google Scholar] [CrossRef]
  49. Zhao, M.; Li, J.; Zhu, L.; Chang, P.; Li, L.; Zhang, L. Identification and characterization of MYB-bHLH-WD40 regulatory complex members controlling anthocyanidin biosynthesis in blueberry fruits development. Genes 2019, 10, 496. [Google Scholar] [CrossRef]
  50. Li, Y.; Chen, X.; Wang, J.; Zou, G.; Wang, L.; Li, X. Two responses to MeJA induction of R2R3-MYB transcription factors regulate flavonoid accumulation in Glycyrrhiza uralensis Fisch. PLoS ONE 2020, 15, e0236565. [Google Scholar] [CrossRef]
  51. Li, W.; Wen, L.; Chen, Z.; Zhang, Z.; Pang, X.; Deng, Z.; Liu, T.; Guo, Y.F. Study on metabolic variation in whole grains of four proso millet varieties reveals metabolites important for antioxidant properties and quality traits. Food Chem. 2021, 357, 129791. [Google Scholar] [CrossRef] [PubMed]
  52. Sun, L.; Yu, D.; Wu, Z.; Wang, C.; Yu, L.; Wei, A.; Wang, D. Comparative transcriptome analysis and expression of genes reveal the biosynthesis and accumulation patterns of key flavonoids in different varieties of Zanthoxylum bungeanum leaves. J. Agric. Food Chem. 2019, 67, 13258–13268. [Google Scholar] [CrossRef] [PubMed]
  53. Wang, C.; Chen, Y.; Chen, S.; Min, Y.; Tang, Y.; Ma, X.; Li, H.; Li, J.; Liu, Z. Spraying chitosan on cassava roots reduces postharvest deterioration by promoting wound healing and inducing disease resistance. Carbohydr. Polym. 2023, 318, 121133. [Google Scholar] [CrossRef] [PubMed]
Figure 1. Overview of transcriptome analysis of A. argyi responsive to UV-B irradiation. (A) PCA analysis of samples taken at 0 h, 4 h, 8 h, and 144 h. Volcano map of DEGs from the pairwise comparisons of UV0 vs. UV4h (B), UV0 vs. UV8h (C), and UV0 vs. UV144h (D). (E) Venn graph for up- and downregulated DEGs from the pairwise comparisons of UV0 vs. UV4h, UV0 vs. UV8h, and UV0 vs. UV144h.
Catalysts 14 00504 g001
Figure 2. Top 20 enriched KEGG pathways of DEGs and possible metabolic pathways in A. argyi defense against UV irradiation. (A) UV0 vs. UV4h. (B) UV0 vs. UV8h. (C) UV0 vs. UV144h. (D) DEGs in flavonoid and lipid pathways that respond to UV. The color and size of the solid circles represent the significant value of the enrichment factor and the number of transcripts involved in the certain pathway, respectively. All phenylpropanoids related pathways are highlighted by black lines, and all lipid related pathways are highlighted by green lines.
Catalysts 14 00504 g002
Figure 3. Overview of the metabolic changes in A. argyi leaves in response to UV-B radiation. (A) PCA of metabolites. (B) Volcano plot of metabolites. (C) Heatmap of DAMs. Ten colored bars on the left represent different classes of metabolites. Green and brown bars at the top represent UV0 and UV144h groups, respectively. Different colored bars in the center represent the Z-score of a DAM. (D) Category and number of DAMs. The blue star highlights flavonoid DAMs.
Catalysts 14 00504 g003
Figure 4. Analysis of DAMs indicates a role for flavonoids in UV-B resistance. (A) KEGG enrichment analysis of DAMs. The blue arrows indicate the pathways related to flavonoid metabolism. (B) Top 10 up- and downregulated DAMs. (C) Numbers of upregulated and downregulated DAMs belonging to various flavonoid classes. “Insig” means “metabolites with insignificant differences”.
Catalysts 14 00504 g004
Figure 5. Expression of genes and metabolites involved in flavonoid metabolism in A. argyi leaves exposed to UV radiation. The three squares marked with different colors represent gene expression levels at 4 h, 8 h, and 144 h from left to right, respectively. Red characters indicate the upregulated metabolites. Blue characters indicate the downregulated metabolites. Black characters indicate no differential enrichment.
Catalysts 14 00504 g005
Figure 6. The role of methyl-JA and salicylic acid in flavonoid metabolism. Expression of genes and metabolites involved in methyl-JA (A) and salicylic acid (B) metabolism in A. argyi leaves exposed to UV radiation. The three squares marked with different colors represent gene expression levels at 4 h, 8 h, and 144 h from left to right, respectively. Red characters indicate the upregulated metabolites. Blue characters indicate the downregulated metabolites. Black characters indicate no differential enrichment. FAD3, omega-3 fatty acid desaturase; AOS, allene oxide synthase; AOC, allene oxide cyclase; OPR, 12-oxophytodienoate reductase; JMT, jasmonic acid carboxyl methyltransferase; methyl-JA, methyl jasmonic acid; FAD4, fatty acid desaturase 4; FAD6, omega-6 fatty acid desaturase; LOX2, lipoxygenase 2; E-4-P, erythritol 4-phosphate; PEP, phosphoenolpyruvate; DS, DAHP synthase; DAS, 3-dehydroquinic acid synthase; DAD, 3-dehydroquinic acid dehydratase; SDH, shikimate dehydrogenase; SK, shikimate kinase; ES, EPSP synthase; BAS, branched acid synthase; ICS, isochorismate synthase; PBS3, avrPphB susceptible 3. (C) A regulation model of flavonoid metabolism. UFA, unsaturated fatty acid.
Catalysts 14 00504 g006
Figure 7. The flavonoid content of A. argyi planted in Nanyang and Qushui.
Catalysts 14 00504 g007
Disclaimer/Publisher’s Note: The statements, opinions and data contained in all publications are solely those of the individual author(s) and contributor(s) and not of MDPI and/or the editor(s). MDPI and/or the editor(s) disclaim responsibility for any injury to people or property resulting from any ideas, methods, instructions or products referred to in the content.

