Article

Design and Performance of CuNi-rGO and Ag-CuNi-rGO Composite Electrodes for Use in Fuel Cells

1
Department of Physics, Faculty of Science, Islamic University of Madinah, Madinah 42351, Saudi Arabia
2
Nanophotonics and Applications Lab, Physics Department, Faculty of Science, Beni-Suef University, Beni-Suef 62514, Egypt
3
Biochemistry Department, Faculty of Science, Beni-Suef University, Beni-Suef 62521, Egypt
4
Department of Chemical Engineering, Faculty of Engineering, Islamic University of Madinah, P.O. Box 170, Madinah 41411, Saudi Arabia
*
Author to whom correspondence should be addressed.
Catalysts 2024, 14(8), 551; https://doi.org/10.3390/catal14080551
Submission received: 11 July 2024 / Revised: 15 August 2024 / Accepted: 19 August 2024 / Published: 22 August 2024
(This article belongs to the Section Nanostructured Catalysts)

Abstract

:
This work developed new electrocatalysts for direct alcohol oxidation fuel cells (DAFCs) by using graphene and reduced graphene oxides (GO and rGO) as supporting nanomaterials for copper–nickel (CuNi) nanocomposites. The manufacture of CuNi, CuNi-GO, and CuNi-rGO nanocomposites was realized through the adaptation of Hummer’s method and hydrothermal techniques, with subsequent analysis using a range of analytical tools. The electrocatalytic behavior of these materials in DAFCs, with methanol and ethanol as the fuels, was scrutinized through various methods, including cyclic voltammetry, linear sweep, chronoamperometry, and electrochemical impedance spectroscopy. This investigation also assessed the stability and charge transfer dynamics. The rGO-based CuNi nanocomposite demonstrated a remarkable performance boost, showing increases of approximately 319.6% for methanol and 252.6% for ethanol oxidation compared to bare CuNi. The integration of silver nanoparticles into the Ag-CuNi-rGO electrode led to a current density surge to 679.3 mA/g, which signifies enhancements of 254.2% and 812.6% relative to the CuNi-rGO and CuNi electrodes, respectively. These enhancements are ascribed to the augmented densities of hot sites and the synergistic interactions within the nanocatalysts. The findings underscore the potential of Ag and rGO as effective supports for CuNi nanocomposites, amplifying their catalytic efficiency in DAFC applications.

1. Introduction

Human survival and economic prosperity depend on energy resources. The rapid growth of industry and technology, along with the expanding global population, needs a substantial amount of energy to sustain a developed civilization. Fossil fuels are utilized to meet the growing energy demand. However, it is important to note that fossil fuels are also the primary contributors to emissions of CO2, NO2, and other hazardous air pollutants, which are responsible for acidic rain, Ozone layer erosion, and weather changes [1]. Conversely, renewable energy sources have the potential to be a viable choice, but they may not be sufficient to meet the increasing need for energy. Consequently, there is an increasing emphasis on discovering renewable energy sources.
In recent times, there has been a growing fascination with fuel cells (FCs) as substitutes for traditional fuels and a promising means of generating environmentally friendly energy [2]. FCs can be categorized into various categories depending on the fuels and membranes employed. These types include solid oxides, phosphoric acid electrolytes, polymer electrolytic membranes, liquefied carbonates, and basic and direct alcohol cells [3]. The main goal of creating electrocatalysts is to facilitate the electrooxidation process in direct alcohol fuel cells (DAFCs). These DAFCs have the potential to be a valuable energy source because of the substantial energy densities of the alcohol utilized, like methanol and ethanol. DAFCs offer several benefits to the power sector, including exceptional efficiency, convenient liquid fuel transportation and storage, little noise, and straightforward maintenance [4]. However, the anode catalyst’s expensive price and restricted electrocatalytic efficacy are major concerns [5]. Consequently, significant attention has been given to the advancement of anodic electrocatalysts and the structural design to create an electrocatalyst that exhibits superior electrocatalytic activity, stability, and cost-effectiveness.
Undoubtedly, Pt has been acknowledged as a very efficient electrocatalyst for alcohol oxidation processes. Nonetheless, its applications have been hampered due to its prohibitive expense, the rarity of precious metals, and the performance degradation resulting from the contamination of active intermediates [6,7]. Consequently, to tackle these problems, various combinations of Pt with alloys of Sn, Pd, and Ru are employed to boost the catalytic potential and cut costs. Nevertheless, these alloys are significantly affected by severe aggregation [8,9]. To tackle this problem, Ni has been widely applied as an anodic electrocatalyst due to its cost-effectiveness, notable catalytic efficacy, and selectivity. Nonetheless, the prolonged usage of Ni catalysts often leads to their inactivity, primarily due to the accumulation of carbon and the process of sintering. Such procedures could potentially result in diminished DAFC performance [10,11]. Introducing humidity into the feed streams helps alleviate the limitation caused by carbon deposition. However, it has been noted that to prevent the buildup of carbon, a steam-to-carbon ratio that is very high is required. A rise in the steam proportion could potentially lead to a decline in the efficiency of cells, cause fuel dilution, and result in the oxidation of the Ni catalyst.
Boosting the electrocatalytic performance of various metal-based catalysts, such as Cu-Ni alloys, can lead to improved catalytic stability and a reduction in coke formation at the anodes of DAFCs [12]. Cu and Ni are metals with FCC structures and similar lattice properties (α = 3.616 and 3.523 Å, respectively). As a result, Cu-Ni alloys can be created with a wide variety of structures. Several published papers have extensively discussed the characteristics of Cu-Ni alloys. Khulbe et al. [13] investigated the performance of Ni-Cu alloys during the hydrogenation process, which was very commendable. Furthermore, Cu-Ni alloys have shown remarkable resilience against corrosion and biofouling, coupled with noteworthy conductivities of both heat and electricity [14]. Nevertheless, Ni-Cu alloys encounter limitations that must be resolved: they lack durability and have inadequate hardness. Despite the limited study of Cu-Ni, studies have shown that materials with nano-reinforcement may greatly enhance mechanical properties like robustness, rigidity, and abrasion resistance [15]. Two types of nanoscale materials, namely, Carbon Nanotubes (CNTs) and graphene oxide (GO), have attracted significant attention owing to their exceptional properties [16].
GO is a modified version of graphene that contains functional groups including oxygen. It is often produced by using powerful oxidizing agents like HNO3 or KMnO4 for graphite oxidation. The material that is produced exhibits a layered structure, with functional groups on the surface that integrate oxygen. This characteristic bestows upon the material hydrophilic qualities, making it readily soluble in water. The material’s appealing features, including its exceptional mechanical robustness, electrical conductance, and molecular barrier capabilities, along with other remarkable properties, have drawn attention from various scientific disciplines [17,18,19]. GO is structured as a solitary layer of carbon atoms that are arranged in hexagons. These carbon atoms possess π-electron clouds and C-C bonds via sp2 hybridization. Single-layer graphene and comparably slender fragments made up of a limited number of carbon atoms exhibit fascinating physical properties. These attributes potentially render them beneficial across a range of tech-related fields. Due to these factors, several research endeavors have aimed to integrate graphene into composites. A CuNiGO nanocatalyst was developed via electrodeposition for methanol electrooxidation [20]. The resulting electrocatalyst exhibited a notable current density of 28.6 mA/cm2. Nevertheless, more modification was required to enhance the efficiency and durability of the nanocatalyst. Wala et al. [21] reached 10 mA/cm2 utilizing CuNiGO at a potential of 0.693 V in a urea/KOH electrolyte. Nevertheless, the nanocomposite electrocatalyst exhibited a higher yield of nitrite and ammonia ions during the process of urea electrooxidation, as validated by reaction products. Furthermore, B. M. Thamer and colleagues [22] documented a remarkable value of 140 mA/cm2 at 340 mV, achieved through the use of a porous CuNi@C-sheet nanocatalyst. Gupta and De, in their research, found that the 20Ni/C nanocatalyst outperformed the Cu/C, Ni/C, Co/C, and Fe/C nanocomposite electrocatalysts in terms of the (CH2OH)2 electrooxidation current density (11 mA/cm2@1 V in an alkaline environment) and the durability of the structure [23]. Their findings were substantiated via a comprehensive examination of the electrocatalysts. However, the study did not take into account other fuel types like methanol or ethanol, and it failed to achieve a current density that would be viable for commercial use. Zhang et al. [24] offered valuable information on binary metal oxides, including TiO2, WO3, MoO3, RuO2, SnO2, CeO2, and MnO, as well as multi-component perovskite oxides. These materials function as separate electrocatalysts, co-catalysts, and supports for different processes involving the oxidation of anodes and the reduction of cathodes in proton exchange membrane FCs. Another study was carried out by Tucker and Ying on solid oxide FCs that were metal-supported and had catalysts permeating the anode/cathode ends [25]. Various techniques have been used to create mixed metal oxide systems, like the hydrothermal method, sol–gel technique, coprecipitation, and the polymeric precursor approach [26].
Based on several sources, rGO is the preferred nanomaterial compared to graphene, graphite, and GO [27]. rGO exhibits greater solvent stability compared to both graphene and graphite. In addition, it does not aggregate and can be kept for long periods. Furthermore, rGO exhibits much better conductivity and durability compared to GO [28]. Lately, it has been employed as an electrocatalyst-supporting nanomaterial in FCs [29,30,31]. GO and rGO are distinct variations of graphene with distinct properties and potential applications in various fields. Although both materials have their own sets of benefits and drawbacks, they provide a potential field of study for creating innovative nanomaterials with unique features and uses. Hence, the use of graphene sheets in conjunction with other nanometallic structures may provide improved efficiency and cost-effective nanocatalysts [32]. Rahmani and Habibi showed that the NiCo/N-rGO/C nanoceramic electrode displayed superior and consistent electrooxidation performance (~64 and 88 mA/cm2 for ethanol and methanol, respectively). This superior performance was caused by the combined performance of NiCo and N-rGO, which work together synergistically [33]. The major contribution of this study lies in the employment of a straightforward and economical approach to catalyst preparation. However, a notable drawback is the absence of a comparative analysis with other derived carbon substances, like CNTs or carbon blacks. Table S1 (Supplementary Materials) presents a compilation of CuNi nanocomposite-based electrocatalysts that have been proposed in earlier studies for methanol electrooxidation. The table also includes the corresponding values of their key performance metrics, as referenced by publications [34,35,36,37,38,39].
This research aims to develop and demonstrate a new electrocatalyst that is more efficient and cost-effective by utilizing Cu-Ni, Ag nanoparticles, and GO or rGO as alternatives to Pt. In this study, we hydrothermally produced CuNi, CuNi-GO, and CuNi-rGO composites. These nanocomposites were then analyzed and studied for their performance as nanocatalysts in the electrooxidizing process of alcohols within a basic environment. The purpose of this investigation was to determine the function of GO and rGO as supporting nanomaterials for the CuNi nanocomposite. The electrocatalysts proposed were evaluated concerning the impacts of ionic concentrations, scanning speeds, and electrooxidation intervals. Furthermore, the performance and stability of the electrodes were assessed via cyclic voltammetry (CV), linear sweep (LS), chronoamperometry (CAM), and electrochemical impedance (ECI) spectroscopies. The integration of silver nanoparticles into the Ag-CuNi-rGO electrode is expected to significantly boost the current density, demonstrating notable improvements over CuNi-rGO and CuNi electrodes. This enhancement is due to the synergistic interactions and increased densities of hot sites within the nanocatalysts. Consequently, our approach can present a promising alternative to platinum-based catalysts for fuel-cell production.

2. Results and Discussion

2.1. Analysis of the Nanocomposite Properties

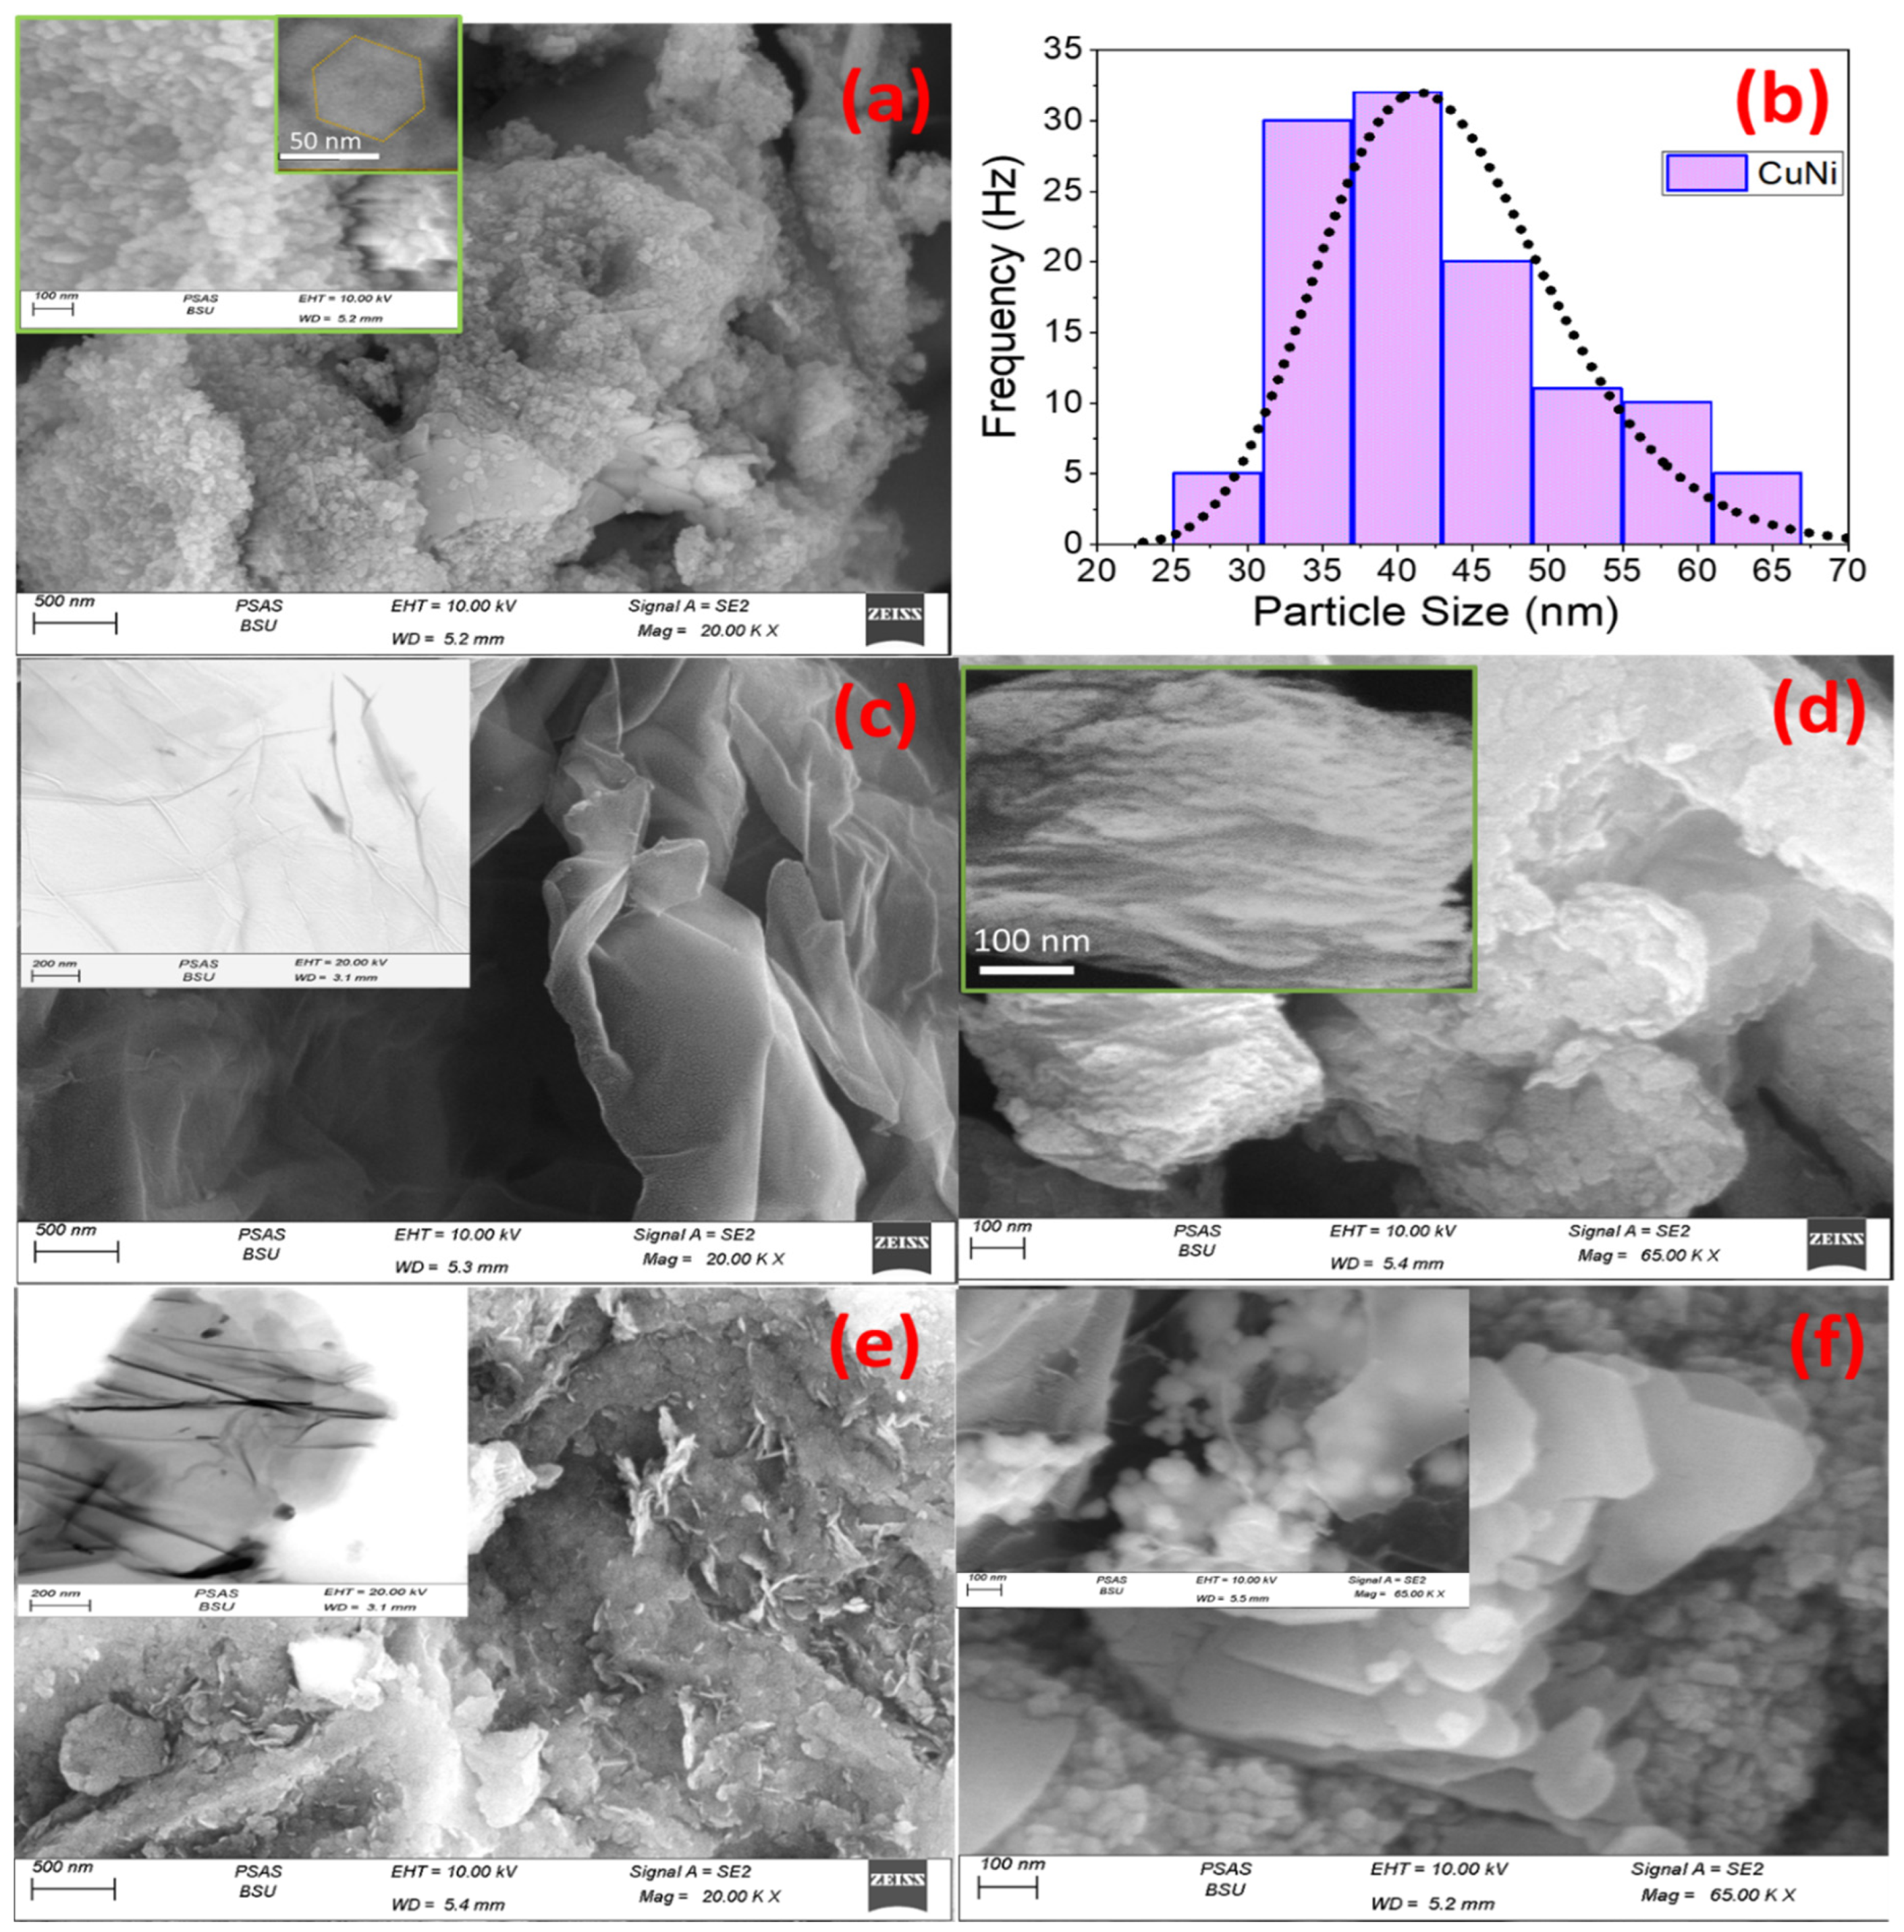
2.1.1. Nano-Morphological Analysis

Figure 1 displays SEM illustrations of the composites under investigation, as well as the distribution of the CuNi nanoparticles’ (NPs’) sizes. The SEM images of CuNi nanoparticles in Figure 1a demonstrate hexagonal structures, as illustrated in the insets, with the existence of nanospherical particles. Figure 1b illustrates the presence of particles with a concentrated distribution and a slim size range, having a mean diameter of 41.7 ± 8.9 nm, as determined using ImageJ software (version 1.53t) without applying thresholding and plotted by OriginPro 2018 software. Figure 1c displays an SEM image that exhibits exfoliated GO layers. This image shows ultrathin, bendable, and wrinkly nanosheets that are consistent with the conclusions obtained by Shojaeenezhad et al. [40] utilizing an adapted version of Hummer’s technique. Notably, the inset in Figure 1c shows a TEM image for the GO nanolayers.
Figure 1d depicts the hydrothermal impact on GO nanosheets and CuNi NPs that are embedded in the GO nanosheets. This results in the creation of a dense/stratified composite nanomaterial, as seen in the embedded illustration. Therefore, the morphological investigation demonstrates that the GO nanosheets have rough nanotextures, which are attributed to the accumulation of CuNi NPs. Figure 1e displays the SEM image of rGO nanolayers. These nanolayers were generated by reducing GO nanosheets employing hydrazine hydrate during the hydrothermal treatment. The SEM depiction shows extensively exfoliated nanosheets of rGO with a coarse texture, similar to scales, as confirmed by the enclosed TEM image. Figure 1f exhibits an SEM illustration of a composite made up of rGO and CuNi NPs. The SEM visualization displays tightly arranged structures and nanolayers, identifiable by their spherical and polygonal configurations. This indicates that the CuNi nanoparticles are encased within layers of rGO, as illustrated in the inserted SEM and TEM images. The average particle size is estimated to be 50.6 ± 10.6 nm. Figure S2a (Supplementary Materials) shows a TEM image of the Ag-CuNi-rGO nanocomposite, showcasing a uniform dispersion of nanoparticles. The image reveals an irregular sheet-like morphology with nanoparticles, each less than 50 nm in diameter, evenly distributed across the rGO sheet. This homogeneous distribution suggests strong interactions between the rGO, Ag, and CuNi nanoparticles, preventing agglomeration and promoting the formation of a uniform composite. Such a well-dispersed structure is indicative of potentially enhanced electrochemical properties.

2.1.2. Elemental Structure and Functional Entities

EDX analysis of the pristine rGO, as shown in Figure S1a (Supplementary Materials), and the CuNi-rGO composite, as depicted in Figure S1b (Supplementary Materials), has yielded insightful data on their chemical makeup. The rGO nanosheets were found to have impressive dispersibility and a carbon atomic percentage of 72.7%, complemented by an oxygen atomic percentage of 27.3%. These percentages are largely due to the carboxylate functional groups. Such features are beneficial for a range of uses and promote the creation of nanocomposites with different metal ions, highlighting their advantageous elemental and nanostructural attributes.
In addition, the chemical composition of the CuNi-rGO nanocomposite showed a decrease in the atomic C% to 18.48%, while the atomic O% rose to 77.81%. This alteration verifies the association between the coordination behavior of metallic ions and the attachment of O, with Ni and Cu having weight percentages of 9.92% and 3.22%, respectively, and being deposited on the rGO nanosheets’ surface. A notable peak corresponding to carbon was observed at approximately 1 keV, and two overlapping peaks are associated with Ni and Cu at 0.85 and 0.93 keV, respectively. This suggests the formation of a CuNi- rGO composite containing a Cu/Ni ratio of 1:3. Moreover, the detection of a K signal in the EDX spectrum is linked to the KOH used in the hydrothermal treatment, while the Au signal is due to the gold NPs applied during the nanocomposite’s examination.
The infrared spectra depicted in Figure 2a,b elucidate the functional groups existing in the GO, rGO, and CuNi nanopowders. The spectra displayed in (a) for CuNi-GO and (b) for CuNi-rGO nanocomposites span a wavenumber spectral range of 4000–400 cm−1, as determined utilizing the KBr pellet method.
Figure 2a reveals prominent absorption bands at ~3400, 3434, and 3638 cm−1. These modes are associated with the O-H stretching vibrations within the carboxylic groups of GO/rGO, as well as the F-H vibrations in the hydroxides formed by nickel and copper in the CuNi composite. In GO and rGO nanopowders, the modes at 2930 and 2854 cm−1 are indicative of the asymmetric stretching vibrational mode of C-H in an alkane. However, this is notably more pronounced in rGO, which validates the reduction of GO. The GO nanopowder exhibits modes at 1616.9, 1413.4, and 1103.9 cm−1, which could indicate the presence of C=O, C=C, and C-H vibrations, respectively. The rGO nanopowder displays prominent and sharp modes at ~1715, 1630, 1578, 1453, 1388, and 1016 cm−1. These modes could signify C=O stretching vibrations, C=C stretching vibrations due to SP2 hybridization in rGO, the C-H bending mode in an alkane, the robust O-H bending mode in carboxylic groups, and the strong C-O bending mode, respectively. In Figure 2a, the CuNi powder’s spectrum reveals distinct modes at ~1637 and 1403 cm−1, suggesting the presence of O-H bending vibrations. Additionally, the modes at 997 and 827 cm−1 correspond to Ni-O and Cu-O bonding. The lower-frequency domain, ranging from 800 cm−1 to 200 cm−1, showcases a complex array of broad bands for the GO, rGO, and CuNi powders, commonly known as the fingerprint region due to its unique spectral features. In comparing the Cu-Ni sample to the GO and rGO samples, a significant shift in O-H stretching is observed. In the Cu-Ni sample, metal hydroxides primarily form on the surfaces of Cu and Ni particles, impacting the O-H stretching behavior. However, in the case of GO or rGO, O-H groups interact with functional groups on the GO or rGO surfaces that bind oxygen. This interaction alters the electronic environment around the O-H bonds, resulting in a change in the O-H bond stretching frequency [41].
Figure 2b presents the FTIR spectra of the CuNi-GO and CuNi-rGO composites. Both spectra share certain characteristics, with slight variations. In terms of O-H vibrations, the composites show modes at ~3760 and 3756 cm−1, respectively. Notably, the CuNi-GO nanocomposite exhibits a more pronounced peak, which is associated with the increased OH-group concentration within the GO layers. Modes that are located at wavenumbers ≤ 3000 cm−1 for the CuNi-GO and CuNi-rGO composites are associated with C-H alkane stretching. The modes at 2367.8 and 2303 cm−1 represent the stretching mode of the C≡C bond in the GO composite, and there is a single mode at 2372.8 cm−1 in the rGO composite. This suggests a distinct difference in the type of C≡C of the alkyne present in the NiCu-GO composite compared to that in the NiCu-rGO composite. The existence of these compounds is not seen in the pure GO and rGO samples mentioned before, suggesting the formation of the bimetallic NiCu-GO and NiCu-rGO nanocomposites. The CuNi-rGO composite is characterized by its distinct spectral signature, displaying subtle, broad, and overlapping modes at specific wavenumbers. The 1638, 1556, and 1464 cm−1 modes are indicative of C=C stretching vibrations, potentially related to conjugated alkenes or the O-H bending modes. The modes observed suggest the existence of SP2 hybridization in rGO, along with the detection of stretching vibrations for C=O or C=C in a cyclic alkene. A notable mode at 1063 cm−1 indicates an intense O-H bending mode in carboxylic groups and a pronounced C-O bending mode. Conversely, the CuNi-GO composite displays prominent modes at ~1550, 1384, 1215, and 1089 cm−1. These bands are indicative of the bending vibrations of C=O, C=C, C-H, and O-H and possible interactions between Ni-O and Cu-O bonds. An examination of the spectrum uncovers essential molecular features of the CuNi-GO and CuNi-rGO composites, offering a deeper understanding of the stretching and bending modes for different functional groups in these materials. Within a wavenumber range from 800 to 200 cm−1, the CuNi-GO and CuNi-rGO composites display intricate spectra characterized by unique bands. The FTIR spectrum of the Ag-CuNi-GO nanocomposite (Figure S2b) shows peaks at 3761.49 cm−1 and 3413.39 cm−1, which are indicative of O-H stretching vibrations. These multiple peaks likely result from the interaction of O-H groups with different metal ions (Ag, Cu, Ni) in the composite, leading to chelation [41,42,43]. The higher-wavenumber peak could also be an overtone. The peak at 3133.97 cm−1 may correspond to aromatic C-H bond stretching in GO layers. The weak peak at 2376.95 cm−1 is attributed to C≡C stretching, while the peak at 1563.63 cm−1 is due to C=C-group stretching. The peaks at 1399.81, 1221.95, 1160.05, and 1039.39 cm−1 correspond to aromatic C=C bending, phenolic C-O stretching, epoxy C-O-C stretching, and O-H bending, respectively, and may also indicate stretching and bending vibrations of C-O functional groups. The peaks at 740.29, 615.37, and 493.88 cm−1 in the fingerprint region are likely due to Ag-O, Ni-O, and Cu-O interactions [41].
Figure 2c illustrates the findings from Raman spectroscopy, highlighting the relative intensities of ID (defect band)/IG (graphitic band) for the CuNi-GO and CuNi-rGO composites. For carbon nanomaterials, the D band and G band exhibit broad profiles and often overlap. The D band at 1755 cm−1 is a result of the oscillation mode of phonons exhibiting A1g symmetry, located near the boundary of the K zone, indicative of disordered carbon regions [44]. Groups containing oxygen or lattice imperfections play a role in its manifestation. Conversely, the G vibrational mode, observed at 1771 cm−1, is a consequence of in-plane sp2 carbon vibrations and is associated with a doubly produced symmetric phonon mode (E2g). More precisely, the G band reflects the stretching mode of sp2 carbon hybridization within the graphene layers. These Raman bands offer significant insight into the structural features and imperfections present in carbon materials, as elucidated by Hu et al. [45]. The ID/IG band ratio is ~1.02 for CuNi-GO and ~1.06 for CuNi-rGO composites, where sp2/sp3 is proportional to IG/ID. The D mode is produced by C atoms that are restricted by O-containing groups. As a result, the remaining O-containing groups, such as H2O molecules that vaporize at a low temperature and oxygen-containing groups that are eliminated at a high temperature, influence the value of ID [46]. The growth in ID/IG when using rGO instead of GO suggests that the mean nanosize of sp2 domains and the crystallinity of the nano-graphitic material diminished throughout the thermal/chemical processes. The monoclinic CuO structure exhibits three distinct optical Raman bands at specific wavenumbers: Ag mode at 278 cm−1, B1g mode at 360 cm−1, and B2g mode at 634 cm−1. These bands correspond to vibrational modes within the crystal lattice. The Ag mode involves the transfer of O atoms along the b-orientation, and the B1g mode represents the perpendicular motion of O atoms relative to the b-orientation of the monoclinic CuO phase [47]. The mode around 170 cm−1 is attributed to the zone-boundary phonon modes [48]. This low-frequency Raman signal at 170 cm−1 has been observed in CuNi-GO and CuNi-rGO nanocomposites, corresponding to the layer-breathing modes of bilayer graphene [49,50]. This peak has a higher intensity for CuNi-GO compared to CuNi-rGO. Hembram et al. [51] attributed the prominent mode at 170 cm−1 in curved graphene to the localized radial breathing mode (l-RBM). The other assigned modes in Figure 2c are attributed to one-phonon (1P) and two-phonon (2P) modes of cubic NiO [52,53]. The XPS spectral analysis of CuNi, CuNi-GO, and Cu-Ni-rGO composites revealed the surface ions and corresponding groups, detailing their binding energies and electronic structures [44,54,55,56,57]. For the CuNi nanocomposite, a peak at around 855 eV indicates Ni2+ ions, while another at about 932 eV corresponds to Cu2+ ions [44,54,55,56,57]. A peak at roughly 531 eV is linked to oxygen atoms, and one at around 284 eV indicates carbon atoms [44,55,57]. In the CuNi-GO nanocomposite, certain peaks shift compared to pure CuNi, with the mode near 855 eV moving to higher binding energy, indicating more oxygen atoms on the surface [56,57]. Similarly, the mode at 932 eV shifts slightly, suggesting increased carbon attachment to the GO nanolayer, while the mode at 531 eV remains stable, indicating no significant changes in oxygen content [56,57]. The CuNi-rGO composite shows a similar pattern to CuNi-GO, with some peak position variations. The mode near 855 eV shifts further, indicating more oxygen atoms on the rGO nanolayer sides, and the mode at 932 eV shifts more, suggesting greater carbon attachment to the rGO nanolayer sides [54,55,56,57]. The mode at 531 eV remains stable, indicating unchanged oxygen content [56,57,58]. The XPS chart for the Ag-CuNi-rGO composite shows peaks at approximately 932 eV (Cu2p3/2) and 952 eV (Cu2p1/2), indicating Cu2+ ions, while the peak at around 855 eV corresponds to Ni2p, suggesting nickel ions. The peak near 368 eV is associated with Ag3d, confirming silver’s presence. Additionally, the peak at approximately 531 eV represents oxygen atoms, likely as part of oxide layers or bound to graphene oxide, and the peak around 284 eV corresponds to carbon atoms, confirming rGO’s presence. The successful incorporation of Ag, Cu, and Ni into the rGO matrix forms a homogeneous composite with potentially enhanced electrochemical properties, suggesting that using rGO as a supporting matrix boosts the quantity and dispersion of hot spots on Ag-CuNi nanocatalysts, thereby potentially elevating their electrocatalytic efficacy for DAFCs by improving electro-stability and catalytic performance.

2.1.3. Structural Properties

Figure 2d, which shows the XRD analysis, reveals the crystalline architecture of the CuNi, CuNi-GO, and CuNi-rGO nanocomposites. The hydrothermal method alters the additives, resulting in nanostructures of Ni(OH)2 and CuO [59,60]. The diffractions at 2θ of 19.1, 38.7, and 52.2° are indicative of the (001), (011), and (012) planes of β-Ni(OH)2, as per JCPDS 14-0117 [61]. The diffractions at 2θ of 35.4, 38.8, 48.7, 61.5, 66.4, and 68.1° match the (002), (200), (−202), (−113), (022), and (220) planes of the monoclinic CuO structure, which belongs to the C2/c space groups, as referenced in JCPDS 45−937 [62]. Additional peaks correspond to α-Ni(OH)2, with significant diffractions at 33.1°, 35.4°, and 59.1°, aligning with the established literature (JCPDS 41-1424, 38-0715) [63,64,65]. The phase purity of the samples is confirmed by the absence of extraneous peaks from KOH, NiCl2, or CuCl2.
In spectrum 2d(ii), diffraction peaks at 2θ of 19.4, 25.7, 36.5, 38.7, 42.5, 43.6, 52.5, 59.4, 61.7, 73.6, and 74.4° are noted. The pronounced peak at 36.5° suggests enhanced Ni(OH)2/CuO nanocrystallinity on GO layers. The broad peaks at 19.4 and 25.7° may represent the GO nanosheets [66]. In Figure 2d(iii), these diffractions consolidate into a singular diffraction at 24.9°, signifying the reduction of GO to rGO in the CuNi-rGO nanocomposite, evidenced by the peak shift from 19.4° to 24.9° following hydrazine hydrothermal reduction at 200 °C [67].
The Debye–Scherrer equation, Equation (1), is utilized to find the crystallite sizes, Ds, using the following formula [66,68]:
Ds = 0.94 λ/β cosθ
where θ is the diffraction angle, λ = 1.54056 Å, and β (rad) is the full width at half maximum. The computed average crystallite sizes for CuNi, CuNi-GO, and CuNi-rGO are 27.8, 21.7, and 8.9 nm, respectively. The decrease in Ds upon integration with rGO and GO suggests an increase in area per unit mass (APM). Also, the crystallite sizes determined from XRD are smaller than the particle sizes observed in the SEM/TEM images in Figure 1. This indicates that each nanoparticle may consist of multiple crystallites. The minimum dislocation densities, calculated as 1/Ds2, are found to be 1.88 × 10⁻³, 18.59 × 10⁻³, and 31.4 × 10⁻³ dislocations/nm2 for CuNi, CuNi-GO, and CuNi-rGO, respectively [69]. The APM, a crucial structural metric, is determined by the formula APM = 6000/(Ds × ρ), where ρ denotes the NP density [57,70]. The relative APM ratios for CuNi-rGO and CuNi-GO, in comparison to CuNi, are ~4.0 and 1.9, respectively. As a result, it is anticipated that the CuNi-rGO nanocomposite will exhibit greater catalytic efficiency than the unmodified CuNi.
To summarize, the synergistic integration of CuNi nanoparticles with rGO as a support medium unveils promising avenues for eco-friendly energy technologies. This encompasses compact nanostructures with unique morphologies, augmented sites of activity, the optimized distribution of these sites, diminished energy gaps, decreased sizes of crystallites, and an expanded specific surface area. Consequently, these configurations hold potential as effective materials for applications such as fuel cells, the photoelectrochemical production of hydrogen, and the photodegradation of organic contaminants in wastewater.

2.1.4. Optical Band Gap

The UV-Vis spectrophotometry technique was employed to analyze the absorbance and optical band gaps of CuNi, rGO, and the CuNi-rGO and CuNi-GO composites. As depicted in Figure 3a, the absorption spectra span from 190 nm to 1000 nm at ambient temperature (AT = 20 °C). A notable decline in absorption is observed with increasing wavelengths. For rGO in Figure 3a, two distinct absorption peaks are evident. A pronounced band at 260 nm (π-π* electronic transition) and a secondary, less intense peak at 375 nm (n-π* electronic transition) are present in rGO. For CuNi, the intensities of visible-light absorption are significant, resulting from robust electronic transitions between the 2p O−2 valence band to the 3d/4s metallic conduction band [71]. Regarding CuNi-rGO, as illustrated in Figure 3a, subtle absorption peaks at 267 nm and 357 nm are noted. This observation aligns closely with the data described by Abid et al. [72].
The determination of the optical band gap (Eg), which pertains to the directly permitted transition within the fabricated samples, was conducted by applying Tauc’s relation (Equation (2)):
α = ( h ν E g ) 1 2 / h ν = 2.303 × 10 3 A β / l C
where α , h ,   and   ν   refer to the absorbance coefficient, Planck’s constant, and the light frequency, respectively [73]. A, β ,   l ,   and   C are the optical absorbance, nanomaterial density, optical path length, and suspended mass of the nanomaterial, respectively. Figure 3b presents the graphical relationship between ( α hv)2 and hv for the samples under study. The linear segments of these plots were extrapolated to determine the bandgap energies. The CuNi composite is noted to have an Eg of 2.52 eV, whereas the rGO band gaps are 2.31 eV and 3.57 eV. When rGO is utilized as the substrate for CuNi in place of GO, the band gap diminishes from 2.95 eV to 2.75 eV, as depicted in Figure 3b. This reduction is attributed to the O-containing functional groups in rGO, which contribute to the band gap’s constriction [74]. Nanomaterials characterized by a smaller band gap facilitate easier transitions of electrons between the valence and conduction bands, implying enhanced electrical conductivity and a higher electron density in the CuNi-rGO composite [75].

2.2. Electrooxidation Properties

2.2.1. Effect of Electrolytic and Sample Composition

Figure 4 delineates the impact of the sample composition on the electrocatalytic oxidation of 0.5 M ethanol and 2 M methanol in a 1M KOH solution, conducted at 20 °C with a scanning rate of 100 mV.s−1. The concentrations of ethanol and methanol were optimized to 0.5 M and 2 M, respectively, as demonstrated in the figure. Specifically, in 0.5M ethanol (Figure 4a–c), the introduction of rGO to the CuNi nanocomposite elevates the peak current density (Jp) from 96.8 mA/g to 244.5 mA/g, signifying a substantial enhancement in electrocatalytic activity. Conversely, GO incorporation marginally increases the Jp from 96.8 mA/g to 101.2 mA/g. For 2 M methanol (Figure 4d–f), the utilization of GO or rGO as the supporting nanomaterial boosts the Jp of the CuNi nanocomposite from 83.6 mA/g to 112.8 mA/g and 267.2 mA/g, respectively, marking a significant improvement in electrocatalytic performance. The integration of GO increases the oxidation peak current density from 39 mA/g at 0.63 V to 105 mA/g at 0.79 V. The inclusion of rGO further amplifies this current density to 212 mA/g at 0.83 V. Consequently, the CuNi-rGO nanocomposite exhibits a higher oxidation current density compared to its counterparts, with an enhancement of 319.6% relative to the pristine CuNi composite. This augmentation is linked to the upgrading of electrical conductance, electron mobility, and the effective area, which are amplified during the rGO reduction process [76]. Similar findings were reported by Noor et al. [34] and Al-Enizi et al. [77] for rGO-MOFs nanocomposites, although the enhancements were less pronounced than those observed in this study. Incorporating silver nanoparticles into the Ag-CuNi-rGO electrode fabrication process resulted in a significant elevation in the current density, reaching 679.3 mA/g. This represents substantial 254.2% and 812.6% enhancements when compared to the CuNi-rGO and CuNi electrodes, respectively. The observed enhancement is ascribed to the plasmonic resonance of the silver nanoparticles, which promotes more efficient transfer and mobility of charge carriers. Additionally, the presence of silver nanoparticles can lead to increased electrocatalytic activity and a larger surface area, providing more hot spots for reactions. The synergistic effects between the copper, nickel, and silver components may also contribute to improved electrochemical performance, including better stability and conductivity.
The electrooxidation of methanol/ethanol involves electron transfer from these alcohols to the electrocatalyst electrode. The interaction between alcohol molecules and the catalyst’s surface, known as the adsorption mechanism, influences the reaction’s rate and selectivity. Adsorption is categorized into physisorption, involving weak van der Waals bonds, and chemisorption, characterized by powerful covalent bonds [78]. The adsorption energy reflects the bond strength joining the adsorbate and the adsorbent surface, calculated by the energy difference before and after adsorption. It is also indicative of the adsorption stability [79]. CuNi bimetallic alloys are applicable nanocatalysts for methanol/ethanol electrooxidation due to the synergistic effect of Ni/Cu atoms and the optimal hydrogen adsorption energy of CuNi [22,80]. The hybrid materials CuNi-GO and CuNi-rGO combine the advantages of the CuNi composite with the support properties of GO or rGO, enhancing the distribution and stability of CuNi NPs while providing superior electrical conductance and a larger surface area [80]. The adsorption processes for methanol and ethanol oxidation on CuNi, CuNi-GO, and CuNi-rGO are complex and depend on the catalysts’ surface structure, composition, morphology, and reaction conditions. The potential steps include the adsorption of the alcohol molecules on the electrocatalyst surface, the dehydrogenation of the adsorbed alcohol molecules to CO and H2, the oxidation of CO to CO2, and the desorption of CO2 and H2O from the catalyst surface [22,80].

2.2.2. Effect of Electrolytes Concentration

Ni-based electro-electrodes are highly regarded for their superior ability to catalyze the electrooxidation of ethanol/methanol [81]. Figure 5 displays the CV profiles for the synthesized nanocomposites at varying concentrations of these alcohols. The electrocatalytic oxidation (ECO) process for ethanol hinges on the adsorption of reactants and intermediates, which then undergo dissociation, a critical factor in assessing the reaction’s selectivity and efficiency [82]. Therefore, fine-tuning the ethanol concentration is crucial. As depicted in Figure 5a, the CuNi-rGO nanocomposite demonstrates an increase in peak current density from 99.4 mA/g to 245 mA/g as the ethanol concentration is reduced from 2 M to 0.5 M, indicating optimal electrocatalytic activity at the lower concentration. This is because, at higher ethanol concentrations, the saturation of active sites with ethanol molecules impedes the binding of hydroxyl groups [83].
The optimization of the methanol concentration for ECO using the CuNi-rGO nanocatalyst is presented in Figure 5b and Figure S3 (Supplementary Materials). As the concentration of methanol was adjusted from 0.5 M to 2 M, there was a notable increase in the Jp value, rising from 207.8 mA/g to 267.2 mA/g. Then, the values are decreased for 2.5 M and 3 M, as shown in Figure S3. Concurrently, the oxidation peak current densities shift from ~100 mA/g at 0.711 V to ~200 mA/g at 0.807 V with the change in methanol concentration from 0.5 M to 2 M. Thus, it is deduced that the optimal concentration for methanol in the context of the CuNi-rGO nanocomposite is 2 M. These findings suggest that the nanocomposites exhibit a higher electrooxidation efficiency for methanol over ethanol. It is posited that elevated methanol concentrations may suppress the catalyst’s oxidizing function, thereby leaving the sites for oxygen evolution reactions (OERs) vacant, which, in turn, diminishes competitive interactions concerning OERs and the methanol ECO reaction [71]. This result aligns with observations made by Deng et al. [84] in their study using the more complex NiCo/C-N/CNT electrocatalyst.
Figure S4 (Supplementary Materials) captures the effect of a 1 M KOH electrolyte, in the presence and absence of methanol, on the ECO reaction. The CV curve for CuNi-rGO in a 1 M KOH + 2.0 M methanol electrolyte showcases an oxidation peak, signaling the electrooxidation of the catalyst, which is indicative of electron bond cleavage and the formation of oxyhydroxide (OOH) species [85].

2.2.3. Scanning Rate Effect

Figure 6a,b illustrates the catalytic efficacy of CuNi-rGO in the ECO of ethanol and methanol within a 1 M KOH electrolyte at 20 °C, correlated with varying scanning rates. As demonstrated in Figure 6a, the current densities for CuNi-rGO in 0.5 M ethanol escalate as the scanning rate rises to 100 mV.s−1 [86]. At elevated scanning rates, the diffusion process surpasses the reaction rate, leading to a surplus of electrolytic ions at the electrode–electrolyte boundary, yet a reduced number participates in the charge transfer reaction. Consequently, a scanning rate of 100 mV/s is identified as optimal [87]. However, when rGO is incorporated into the composite with 2 M methanol, as shown in Figure 6b, the ideal scanning rate shifts to 15 mV/s. This adjustment is likely because the outer surface of the electrode undergoes maximum electrolytic ion insertion at lower scanning rates [88]. For Ag-CuNi-rGO in 2 M methanol, the ideal scan speed was determined to be 100 mV.s−1. This speed allows for maximum ion intercalation into the electrode’s outer layer, a key factor for the ECO in DAFCs.

2.2.4. LSV Measurements

Figure 7a,b presents the linear sweep voltammetry (LSV) profiles for CuNi, CuNi-GO, CuNi-rGO, and Ag-CuNi-rGO within alcohol environments, utilizing optimal concentrations in a three-electrode cell setup. The potential scan range is set from −1 to +1 V at a rate of 100 mV.s−1. For ethanol ECO (Figure 7a), the current densities are 46.04, 95.20, and 125.24 mA/g at 1 V for CuNi, CuNi-rGO, and CuNi-GO, respectively. In methanol (Figure 7b), the current density is observed to increase, reaching 70.0, 266.96, and 326.04 mA/g for CuNi, CuNi-GO, and CuNi-rGO, respectively. These figures underscore the catalytic improvement achieved by incorporating CuNi into rGO and GO substrates. Due to their expansive surface areas and superior electrical conductivities, GO and rGO boost the ECO of methanol/ethanol by offering additional hot spots, facilitating electron movement, bolstering stability, improving mass transportation, and generating synergistic effects [89]. The onset potentials (Eonset) also serve as indicators of material activity [41,90]. The Eonset values for CuNi, CuNi-GO, CuNi-rGO, and Ag-CuNi-rGO are 0.401, −0.064, −0.315, and −0.548 V, respectively. Relative to CuNi and CuNi-GO, CuNi-rGO stands out as the most effective catalyst for methanol ECO, as evidenced by its electrocatalytic activity and onset potential. The superior ECO current density for methanol relative to ethanol when using the CuNi-rGO composite is likely due to methanol’s humbler structure, lower bonding energies, enhanced adsorption characteristics, greater surface coverages, and improved mass transportation capabilities [91].
In the case of Ag-CuNi-rGO, as depicted in Figure 7b, the current density significantly increases, reaching a peak of 412.55 mA/g for the ECO of methanol. Additionally, the onset potential for this electrode is notably improved, registering at −0.541 V. These advancements in the ECO performance of methanol can be attributed to several factors upon the integration of Ag and rGO into the CuNi nanocomposite. Specifically, the notable enhancement in the methanol ECO when utilizing the Ag-CuNi-rGO nanocomposite is associated with the increased density of hot spots from the incorporation of Ag, improved electrical conductivity due to rGO, and the synergistic impacts of the combined materials. These parameters collectively result in more efficient methanol oxidation reactions, lower onset potentials, and higher current densities, culminating in the observed improvement in ECO performance.

2.2.5. Time-Dependent Current Analysis

Chronoamperometric (CAM) analysis serves as a method to ascertain the enduring stability of electrode catalysts. The long-term stabilities of CuNi-GO, CuNi-rGO, and Ag-CuNi-rGO electrodes are evaluated and depicted in Figure 7c. To create this figure, an extended CAM assessment was conducted over a period of 10,000 s. The Ag-CuNi-rGO and CuNi-rGO electrodes showcased superior stabilities in the methanol ECO process compared to CuNi-GO in ethanol and methanol. These electrodes showed steady currents of 159.38 and 31.35 mA/g, respectively. An initial rapid decline in the current density, stabilizing at a steady rate, is attributed to minor corrosive interactions at the electro-electrode/redox electrolyte interfaces [92]. In contrast, the CuNi-GO electrode exhibited a lower steady current of 12.19 mA/g for methanol oxidation compared to the CuNi-rGO electrode. This pattern suggests that, despite an initial current density reduction, the Ag-CuNi-rGO electrode maintains robust chemical stability and prolonged operational life, qualifying it as an efficient ECO electrode.

2.2.6. EC Impedance (ECI) Spectral Analysis

The behavior of charge carriers plays a crucial role in the ECO efficiency of the electrodes under study. EIS data were gathered using the CHI EC station to assess the interface properties of the electrocatalysts [92]. Impedance analysis, which includes both resistive (Z′) and capacitive (Z″) components, offers insights into the overall resistance and capacitance within the cell [93]. EIS was performed over a frequency range of 0.1 Hz–100 kHz, with the electro-electrodes placed in a 2 M methanol solution and exposed to illumination. The resulting Nyquist plots, illustrated in Figure 8a, and the corresponding Bode plots, shown in Figure 8b, reveal that at higher frequencies, the electrodes exhibit low charge transfer resistance (Rct), as indicated by the small semicircles [94]. At lower frequencies, the plots display linear trends characteristic of diffusion-related Warburg impedance (Zw) and double-layered capacitance (Cdl). An equivalent circuit model, as suggested by Randall, was employed to fit the data, incorporating the solution resistance (RS), Rct, Zw, and Cdl, with the specific element values presented in Table 1. The addition of CuNi to GO and rGO substrates led to a reduction in Zw, implying improved catalytic activity due to rGO integration. All samples showed low Rct, suggesting reduced charge recombination at the electro-electrode–solution boundary [95]. The maximum phase shift (θmax) and its corresponding frequency (fmax) were determined from the Bode plots for CuNi-rGO, CuNi-GO, and CuNi, with these figures also included in Table 1. Reflecting the observations in the optical studies, Ag-CuNi-rGO and CuNi-rGO displayed two maxima, while NiCu-GO showed a single peak.
f m a x is crucial for determining the charge carriers’ lifetimes, as indicated in Table 1 [96]. The addition of CuNi to rGO and GO substrates significantly enhances the lifespan of these carriers. Furthermore, the integration of Ag NPs has a positive effect on extending the lifetime of charge carriers. These improvements are indicative of the successful reduction in charge recombination at the interface between the electro-electrode and solution due to the presence of Ag and rGO. These alterations also promote more efficient electrooxidation reactions, improve the diffusion of the electrolyte, and increase the ionic conductivity within the Ag-CuNi-rGO electrode framework. As a result, the Ag-CuNi-rGO and CuNi-rGO electrodes exhibit superior catalytic performance in electrooxidation processes compared to their CuNi and CuNi-GO counterparts.
Table 2 presents a comparative analysis of the electrocatalytic performance between our refined CuNi-rGO and Ag-CuNi-rGO nanocatalysts and previously documented Pt- or Ni-based nanocatalysts for methanol/ethanol EC oxidation [97,98,99,100,101,102,103,104,105,106]. Our CuNi-rGO and Ag-CuNi-rGO nanocatalysts outperform many of the earlier Pt-based or Ni-based nanocatalysts in terms of current densities and onset potentials, indicating superior electrocatalytic activities for DAFC applications. The dual-metal composition of CuNi-rGO positions it as a cost-effective substitute for more expensive DAFC nanocatalysts. The integration of Ag and rGO within the Ag-CuNi-rGO composite mitigates the clustering of CuNi particles, enhancing electrochemical performance. However, the long-term durability of these composites warrants additional research for industrial use. Modifying CuNi to rGO and Ag ratios could further improve its efficacy. In recent studies related to alcohol oxidation [107,108,109], Cui et al. [107] employed a BiVO4 photoanode in an acid electrolyte with anion modulation, achieving a photocurrent density of 7.52 mA cm−2 for photoelectrochemical (PEC) biomass oxidation. Meanwhile, Javan et al. [108] utilized Ni-Cu/RCQD/GCE, yielding a current density of 90.41 mA cm−2. Additionally, Mao et al. [109] investigated Ni-Cu(5.6:1)/TiN in KOH media, achieving a current density of 139.1 mA cm−2. Ding et al. [110] and Zhao et al. [111] have introduced a pioneering method employing machine learning (ML) for the design and optimization of proton-exchange membrane FCs (PEMFCs). ML’s capability to process vast and intricate data sets, whether empirical or theoretical, allows for more accurate predictions with fewer experimental iterations [110,112]. Future endeavors will leverage ML to refine the synthesis, functionality, and cost-efficiency of catalysts, as well as to elucidate their interactions with fuels and membranes. Subsequent steps will involve validating these catalysts within actual DAFCs, benchmarking them against Pt-based nanocatalysts, and investigating additional metallic/graphene variants as prospective nanocatalysts in DAFCs.

3. Experimental Details

3.1. Materials

All chemicals, including graphite powder (extra pure), H2SO4 (96–98%), H3PO4 (>85%), H2O2 (30%), KMnO4 (99%), KOH (99.9%), NiCl2.6H2O (99.9%), CuCl2.2H2O (99.9%), H6N2.H2O (80%), and (CH3)2CHOH (extra-pure), were purchased from PioChem (Giza, Egypt) and were used without any further purification. Absolute methanol (CH3OH) and ethanol (C2H5OH) were supplied from Fischer Scientific (Loughborough, UK). Nafion (5 wt.%) was purchased from Sigma-Aldrich Inc. (Burlington, MA, USA). Deionized water was utilized in all testing. Table S2 (Supplementary Materials) shows the number of moles, molar masses, volumes utilized, masses employed, and purity levels of all reactants involved in the nanocomposite synthesis process.

3.2. Synthesis of CuNi-GO and CuNi-rGO

Hammer’s approach was combined with a hydrothermal process to create an improved, cost-effective, and innovative electrocatalyst by utilizing CuNi-GO and CuNi-rGO as alternatives to Pt. We employed Hammer’s approach to fabricate GO nanosheets, with certain modifications, as described by Zaaba et al. [112]. This procedure entails the combination and agitation of 0.1 L of H2SO4 and 0.017 L of H3PO4 for 10 min. Subsequently, the liquid is stirred for 60 min at a speed of 200 rpm, with the addition of 1 g of graphite powder. Then, 6 g of KMnO4 was meticulously introduced into the blend, which was situated in a chilled ice bath to avoid any problems related to excessive heat. Throughout the day, this mixture was constantly agitated. Subsequently, 0.5 L of distilled water was used to dilute it, and the concoction was agitated for 30 min at a speed of 200 rpm. To eliminate the excess KMnO4, 6 mL of H2O2 was gradually added while stirring at a rate of 100 rpm for a duration of 10 min. The mixture had an exothermic reaction and subsequently decreased in temperature when placed in the ice bath. Subsequently, the mixture underwent centrifugation at 4000 rpm for 5 min to obtain the necessary GO in the form of pellets. Subsequently, the pellets were collected in a beaker and subjected to repeated washing using a combination of distilled water and ethanol every time. To obtain a finely powdered powder of GO, each pellet underwent further filtration, was dried at 90 °C for one day, and was thoroughly pulverized.
Next, 500 mg of GO was combined with 0.05 L of a well-mixed solution of 500 mg of NiCl2.6H2O and 500 mg of CuCl2.2H2O under stirring for 1 h at 20 °C to ensure the complete dissolution of these salts. Subsequently, the mixture was enclosed within a 0.15 L autoclave and subjected to a temperature of 200 °C for a duration of 180 min in the presence of 0.025 L of 10 M KOH. The hydrothermally created product was filtered and dried at 50 °C for 1 day, resulting in a CuNi-GO nanocomposite.
The CuNi-rGO composite was synthesized by subjecting the GO powder to treatment with 30 mL of H6N2·H2O for a reduction reaction, leading to the creation of rGO nanosheets, which were then ground [113,114]. Subsequently, in the aforementioned procedure for the synthesis of the CuNi-GO nanocomposite, GO was substituted with rGO nanosheets.

3.3. CuNi-GO and CuNi-rGO Composite Characterization

The morphologies of the produced composites were examined using a Sigma 500 VP scanning electron microscope (SEM) from Carl ZEISS. The nanocomposites’ chemical compositions were analyzed using an energy-dispersive X-ray (EDX) detector endowed with an SEM system, manufactured by AMETEK Inc. The presence of functional groups within the composites was determined by capturing Fourier transform infrared (FTIR) spectra with a Bruker Vertex 70 device. The Raman spectra of the composites were captured by the i-Raman Plus spectrophotometer from B&W Tek Inc. (Newark, DE, USA). The molecules’ vibrations were induced using a 532 nm laser beam. A duration of 10 s was used for the exposure. Also, a Lambda 950 PerkinElmer spectrophotometer was used to explore their optical behaviors. Furthermore, an XRD instrument (Philips X’Pert Pro MRD device, Malvern Panalytical, Almelo, Netherlands) was used to analyze their crystallographic properties. This device used a Cu-Kα source (1.54056 Å) at a 40 kV voltage and a 40 mA current at a rate of 0.01°/s for 2-theta up to 80°.

3.4. Electrochemical (EC) Analysis

The electrocatalysts examined in this research were assessed based on their efficiency using different electrolyte concentrations (0.5 M–2.0 M), scan speeds (10–100 mV), and reaction durations (0–300 min). In addition, the stability and performance of the electrodes were assessed using EIS, CAM, and CV studies. The EC investigations were conducted using a CHI 660E EC workstation (Austin, TX, USA). The cell used consisted of 3 electroelectrodes: Pt counter, Hg/HgCl reference, and CuNi-rGO or CuNi-GO working electro-electrodes. To prepare the working electrode, 25 mg of the synthesized nanocomposite was mixed with 30 μL of Nafion (5 wt.%) and 0.4 mL of (CH3)2CHOH. Ink with a uniform distribution of the nanocomposite was created by stirring for 24 h. Subsequently, 0.015 mL of this ink was directly dispensed onto a glassy carbon electrode with a ~7.07 mm2 surface area using a loading density of 58.13 mg/cm3 for this catalyst. Subsequently, the electro-electrode was subjected to a drying procedure at 20 °C for one hour. The voltage was systematically adjusted within a voltage range of ±1 V relative to the Hg/HgCl reference electrode. This adjustment was performed at various scanning speeds and with variable amounts of methanol and ethanol. The ECI spectroscopic curves were acquired using a 0.5 V open circuit relative to the Hg/HgCl reference electrode. The voltage increment was set at 0.005 V, and the frequency spanned from 100,000 to 10 Hz. The electrocatalytic activity of the nanocomposites was evaluated using linear sweep voltammetry (LSV) polarization behaviors at 20 °C with a scanning rate of 0.1 V/s. To investigate the impact of incorporating plasmonic nanoparticles, a 60 μg solution of Ag nanoparticles (40 nm nanoparticle diameter, 0.02 mg.mL−1 in aqueous solution, molecular weight of 107.87, Sigma Aldrich) was introduced during the fabrication of the electrode composed of CuNi-rGO, resulting in the formation of the Ag/CuNi-rGO electrode.

4. Conclusions

Our study successfully synthesized a CuNi composite and its derivatives, CuNi-GO and CuNi-rGO, using a single hydrothermal process. We characterized these materials by employing different spectroscopic and microscopic methods to determine their structural properties, compositions, functional groups, and optical band gaps. Electrochemical assessments included the current density, onset potential, impedance, chemical stability, and charge carrier longevity. The GO-supported CuNi catalyst exhibited significant improvements of approximately 134.9% for methanol and 104.5% for ethanol relative to CuNi. Among the tested catalysts, Ag-CuNi-rGO demonstrated the highest electrochemical activity, attributed to rGO’s role in preventing CuNi nanoparticle aggregation and enhancing the plasmonic effect of Ag nanoparticles. Compared to bare CuNi, the CuNi-rGO and Ag-CuNi-rGO composites achieved superior current densities of 267.2 mA/g and 679.3 mA/g, respectively, with enhancements of approximately 319.6% and 812.6% in 2 M methanol. The streamlined hydrothermal synthesis method is efficient, cost-effective, and scalable, positioning the Ag-CuNi-rGO catalyst as a promising choice for future DAFC applications. However, future investigations should focus on reaction product analysis and full-cell studies to fully understand the catalytic processes and industrial efficiency of the Ag-CuNi-rGO composite.

Supplementary Materials

The following supporting information can be downloaded at https://www.mdpi.com/article/10.3390/catal14080551/s1. Table S1: A comparison of the developed CuNi-rGO and Ag-CuNi-rGO catalysts for methanol electrooxidation with earlier CuNi-based catalysts; Table S2. The number of moles, molecular weights, volumes utilized, masses employed, and purity levels of all reactants involved in the nanocomposite synthesis process; Figure S1: EDX spectra of rGO (a) and CuNi-rGO nanocomposite (b); Figure S2: SEM image of Ag nanoparticles and (b) TEM, (c) FTIR, and (d) XPS of Ag-CuNi-rGO composite; Figure S3: The influence of the methanol concentration on the electrocatalytic Ag-CuNi-rGO performance at 20 °C, 100 mV/s; Figure S4: CV analysis at 0.1 V/s for CuNi-rGO in 1 M KOH, comparing scenarios in the (a) absence and (b) presence of methanol; Figure S5: A schematic comparing the influence of Ag on Cu Ni/rGO on the overall activity.

Author Contributions

Conceptualization, A.M. and M.S.; methodology, A.M., M.G.M.K. and M.S.; validation, H.H., H.A., M.F.E. and M.S.; formal analysis, A.M., M.F.E., H.H., H.A., M.G.M.K. and M.S.; investigation, A.M., M.G.M.K. and M.S.; resources, M.S.; data curation, A.M., M.G.M.K. and M.S.; writing—original draft preparation, A.M., M.G.M.K. and M.S.; writing—review and editing, M.S.; visualization, H.H., M.F.E. and M.S.; project administration H.A. and M.S; funding acquisition, M.S. All authors have read and agreed to the published version of the manuscript.

Funding

The researchers wish to extend their sincere gratitude to the Deanship of Scientific Research at the Islamic University of Madinah for the support provided through the Research Groups Program: Grant no. (904/1443AH).

Institutional Review Board Statement

Not applicable.

Informed Consent Statement

Not applicable.

Data Availability Statement

The data presented in this study are available on request from the corresponding author. The data are not publicly available due to privacy.

Acknowledgments

This work is funded by the Deputyship of Research Innovation, Ministry of Education in Saudi Arabia, through project number (904/1443 AH). In addition, the authors would like to express their appreciation for the support provided by the Islamic University of Madinah.

Conflicts of Interest

The authors declare no conflicts of interest.

References

  1. Lei, R.; Feng, S.; Lauvaux, T. Country-Scale Trends in Air Pollution and Fossil Fuel CO2 Emissions during 2001–2018: Confronting the Roles of National Policies and Economic Growth. Environ. Res. Lett. 2020, 16, 014006. [Google Scholar] [CrossRef]
  2. Stambouli, A.B.; Traversa, E. Solid Oxide Fuel Cells (SOFCs): A Review of an Environmentally Clean and Efficient Source of Energy. Renew. Sustain. Energy Rev. 2002, 6, 433–455. [Google Scholar] [CrossRef]
  3. Mekhilef, S.; Saidur, R.; Safari, A. Comparative Study of Different Fuel Cell Technologies. Renew. Sustain. Energy Rev. 2012, 16, 981–989. [Google Scholar] [CrossRef]
  4. Lamy, C.; Lima, A.; LeRhun, V.; Delime, F.; Coutanceau, C.; Léger, J.-M. Recent Advances in the Development of Direct Alcohol Fuel Cells (DAFC). J. Power Sources 2002, 105, 283–296. [Google Scholar] [CrossRef]
  5. Wang, J.; Cao, X.; Fang, L.; You, X.; Wong, K.; Cao, S.; Xiao, C.; Cai, S.; Huang, Y.; Zhang, X. MoS2 Nanoflower Supported Pt Nanoparticle as an Efficient Electrocatalyst for Ethanol Oxidation Reaction. Int. J. Hydrogen Energy 2019, 44, 16411–16423. [Google Scholar] [CrossRef]
  6. Iwasita, T.; Dalbeck, R.; Pastor, E.; Xia, X. Progress in the Study of Electrocatalytic Reactions of Organic Species. Electrochim. Acta 1994, 39, 1817–1823. [Google Scholar] [CrossRef]
  7. Tran, L.T.; Nguyen, Q.M.; Nguyen, M.D.; Le, H.N.T.; Nguyen, T.T.; Vu, T.H.T. Preparation and Electrocatalytic Characteristics of the Pt-Based Anode Catalysts for Ethanol Oxidation in Acid and Alkaline Media. Int. J. Hydrogen Energy 2018, 43, 20563–20572. [Google Scholar] [CrossRef]
  8. Zhang, H.; Jin, M.; Liu, H.; Wang, J.; Kim, M.J.; Yang, D.; Xie, Z.; Liu, J.; Xia, Y. Facile Synthesis of Pd–Pt Alloy Nanocages and Their Enhanced Performance for Preferential Oxidation of CO in Excess Hydrogen. ACS Nano 2011, 5, 8212–8222. [Google Scholar] [CrossRef]
  9. Hajian, A.; Rafati, A.A.; Yurchenko, O.; Urban, G.; Afraz, A.; Najafi, M.; Bagheri, A. Nanostructured Flower like Pt-Ru for Ethanol Oxidation and Determination. J. Electrochem. Soc. 2014, 162, B41. [Google Scholar] [CrossRef]
  10. Pakhare, D.; Spivey, J. A Review of Dry (CO 2) Reforming of Methane over Noble Metal Catalysts. Chem. Soc. Rev. 2014, 43, 7813–7837. [Google Scholar] [CrossRef]
  11. Li, M.; Hua, B.; Luo, J.; Pu, J.; Chi, B.; Jian, L. Carbon-Tolerant Ni-Based Cermet Anodes Modified by Proton Conducting Yttrium-and Ytterbium-Doped Barium Cerates for Direct Methane Solid Oxide Fuel Cells. J. Mater. Chem. A Mater. 2015, 3, 21609–21617. [Google Scholar] [CrossRef]
  12. Luo, X.; Wang, J.; Dooner, M.; Clarke, J. Overview of Current Development in Electrical Energy Storage Technologies and the Application Potential in Power System Operation. Appl. Energy 2015, 137, 511–536. [Google Scholar] [CrossRef]
  13. Danaee, I.; Jafarian, M.; Forouzandeh, F.; Gobal, F.; Mahjani, M.G. Electrocatalytic Oxidation of Methanol on Ni and NiCu Alloy Modified Glassy Carbon Electrode. Int. J. Hydrogen Energy 2008, 33, 4367–4376. [Google Scholar] [CrossRef]
  14. Sundaram, M.; Kamaraj, A.B.; Lillie, G. Experimental Study of Localized Electrochemical Deposition of Ni-Cu Alloy Using a Moving Anode. Procedia CIRP 2018, 68, 227–231. [Google Scholar] [CrossRef]
  15. Casati, R.; Vedani, M. Metal Matrix Composites Reinforced by Nano-Particles—A Review. Metals 2014, 4, 65–83. [Google Scholar] [CrossRef]
  16. Naseer, A.; Ahmad, F.; Aslam, M.; Guan, B.H.; Harun, W.S.W.; Muhamad, N.; Raza, M.R.; German, R.M. A Review of Processing Techniques for Graphene-Reinforced Metal Matrix Composites. Mater. Manuf. Process. 2019, 34, 957–985. [Google Scholar] [CrossRef]
  17. Lee, C.; Wei, X.; Kysar, J.W.; Hone, J. Measurement of the Elastic Properties and Intrinsic Strength of Monolayer Graphene. Science (1979) 2008, 321, 385–388. [Google Scholar] [CrossRef]
  18. Kuilla, T.; Bhadra, S.; Yao, D.; Kim, N.H.; Bose, S.; Lee, J.H. Recent Advances in Graphene Based Polymer Composites. Prog. Polym. Sci. 2010, 35, 1350–1375. [Google Scholar] [CrossRef]
  19. Cui, Y.; Kundalwal, S.I.; Kumar, S. Gas Barrier Performance of Graphene/Polymer Nanocomposites. Carbon 2016, 98, 313–333. [Google Scholar] [CrossRef]
  20. Wala, M.; Szewczyk, M.; Leśniak–Ziółkowska, K.; Kazek–Kęsik, A.; Simka, W. Preparation of NiCuGO Composite and Investigation of Its Electrocatalytic Properties in Methanol Oxidation. Electrochim. Acta 2022, 425, 140743. [Google Scholar] [CrossRef]
  21. Wala, M.; Blacha–Grzechnik, A.; Stolarczyk, A.; Bajkacz, S.; Dydo, P.; Simka, W. Unexpected Electrochemical Oxidation of Urea on a New NiCuGO Composite Catalyst. Int. J. Hydrogen Energy 2023, 48, 34229–34243. [Google Scholar] [CrossRef]
  22. Thamer, B.M.; Hameed, M.M.A.; Abdo, H.S.; El-Newehy, M.H. Bimetallic NiCu Alloy Nanoparticles Supported on Porous Carbon Nanosheets as an Efficient Electrocatalyst for Methanol and Urea Electrooxidation. Ionics 2023, 29, 4203–4215. [Google Scholar] [CrossRef]
  23. Gupta, S.; De, M. Role of Metal (Cu/Ni/Fe/Co)-Carbon Composite in Enhancing Electro-Oxidation of Ethylene Glycol. J. Appl. Electrochem. 2023, 53, 1795–1809. [Google Scholar] [CrossRef]
  24. Zhang, Z.; Liu, J.; Gu, J.; Su, L.; Cheng, L. An overview of metal oxide materials as electrocatalysts and supports for polymer electrolyte fuel cells. Energy Environ. Sci. 2014, 7, 2535–2558. [Google Scholar] [CrossRef]
  25. Tucker, M.C.; Ying, A.S. Metal-supported solid oxide fuel cells operated in direct-flame configuration. Int. J. Hydrogen Energy 2017, 42, 24426–24434. [Google Scholar] [CrossRef]
  26. André, L.; Abanades, S.; Cassayre, L. Mixed Metal Oxide Systems Applied to Thermochemical Storage of Solar Energy: Benefits of Secondary Metal Addition in Co and Mn Oxides and Contribution of Thermodynamics. Appl. Sci. 2018, 8, 2618. [Google Scholar] [CrossRef]
  27. Hidayah, N.M.S.; Liu, W.-W.; Lai, C.-W.; Noriman, N.Z.; Khe, C.-S.; Hashim, U.; Lee, H.C. Comparison on Graphite, Graphene Oxide and Reduced Graphene Oxide: Synthesis and Characterization. AIP Conf. Proc. 2017, 1892, 150002. [Google Scholar]
  28. Pareek, A.; Sravan, J.S.; Mohan, S.V. Exploring Chemically Reduced Graphene Oxide Electrode for Power Generation in Microbial Fuel Cell. Mater. Sci. Energy Technol. 2019, 2, 600–606. [Google Scholar] [CrossRef]
  29. Fajardo, S.; Ocón, P.; Rodríguez, J.L.; Pastor, E. Co Supported on N and S Dual-Doped Reduced Graphene Oxide as Highly Active Oxygen-Reduction Catalyst for Direct Ethanol Fuel Cells. Chem. Eng. J. 2023, 461, 142053. [Google Scholar] [CrossRef]
  30. Grigoriev, S.A.; Fateev, V.N.; Pushkarev, A.S.; Pushkareva, I.V.; Ivanova, N.A.; Kalinichenko, V.N.; Yu Presnyakov, M.; Wei, X. Reduced Graphene Oxide and Its Modifications as Catalyst Supports and Catalyst Layer Modifiers for PEMFC. Materials 2018, 11, 1405. [Google Scholar] [CrossRef]
  31. Xu, M.; Wu, L.; Zhu, M.; Wang, Z.; Huang, Z.-H.; Wang, M.-X. Self-Supporting Nitrogen-Doped Reduced Graphene Oxide@ Carbon Nanofiber Hybrid Membranes as High-Performance Integrated Air Cathodes in Microbial Fuel Cells. Carbon 2022, 193, 242–257. [Google Scholar] [CrossRef]
  32. Sheikh-Mohseni, M.A.; Hassanzadeh, V.; Habibi, B. Reduced Graphene Oxide Supported Bimetallic Ni-Co Nanoparticles Composite as an Electrocatalyst for Oxidation of Methanol. Solid State Sci. 2019, 98, 106022. [Google Scholar] [CrossRef]
  33. Rahmani, K.; Habibi, B. NiCo Alloy Nanoparticles Electrodeposited on an Electrochemically Reduced Nitrogen-Doped Graphene Oxide/Carbon-Ceramic Electrode: A Low Cost Electrocatalyst towards Methanol and Ethanol Oxidation. RSC Adv. 2019, 9, 34050–34064. [Google Scholar] [CrossRef] [PubMed]
  34. Noor, T.; Pervaiz, S.; Iqbal, N.; Nasir, H.; Zaman, N.; Sharif, M.; Pervaiz, E. Nanocomposites of NiO/CuO Based MOF with rGO: An Efficient and Robust Electrocatalyst for Methanol Oxidation Reaction in DMFC. Nanomaterials 2020, 10, 1601. [Google Scholar] [CrossRef]
  35. Sonia Theres, G.; Velayutham, G.; Santhana Krishnan, P.; Shanthi, K. Synergistic Impact of Ni–Cu Hybrid Oxides Deposited on Ordered Mesoporous Carbon Scaffolds as Non-Noble Catalyst for Methanol Oxidation. J. Mater. Sci. 2019, 54, 1502–1519. [Google Scholar] [CrossRef]
  36. Yuan, L.-S.; Zheng, Y.-X.; Jia, M.-L.; Zhang, S.-J.; Wang, X.-L.; Peng, C. Nanoporous Nickel-Copper-Phosphorus Amorphous Alloy Film for Methanol Electro-Oxidation in Alkaline Medium. Electrochim. Acta 2015, 154, 54–62. [Google Scholar] [CrossRef]
  37. Wu, D.; Zhang, W.; Cheng, D. Facile Synthesis of Cu/NiCu Electrocatalysts Integrating Alloy, Core–Shell, and One-Dimensional Structures for Efficient Methanol Oxidation Reaction. ACS Appl. Mater. Interfaces 2017, 9, 19843–19851. [Google Scholar] [CrossRef]
  38. Mardani, Z.; Gholivand, M.B. Improvement of Electrocatalytic Activity of Bimetal Sulfide of Ni-Cu by α-MnO2 for Methanol Oxidation. J. Electroanal. Chem. 2022, 923, 116822. [Google Scholar] [CrossRef]
  39. Urbańczyk, E.; Wala, M.; Blacha-Grzechnik, A.; Stolarczyk, A.; Maciej, A.; Simka, W. Electrocatalytic Methanol Oxidation Using Ni–Co–Graphene Composite Electrodes. Int. J. Hydrogen Energy 2021, 46, 33272–33286. [Google Scholar] [CrossRef]
  40. Shojaeenezhad, S.S.; Farbod, M.; Kazeminezhad, I. Effects of Initial Graphite Particle Size and Shape on Oxidation Time in Graphene Oxide Prepared by Hummers’ Method. J. Sci. Adv. Mater. Devices 2017, 2, 470–475. [Google Scholar] [CrossRef]
  41. Mohamed, A.; Shaban, M.; Kordy, M.G.M.; Al-Senani, G.M.; Eissa, M.F.; Hamdy, H. Fabrication and Characterization of NiCu/GO and NiCu/RGO Nanocomposites for Fuel Cell Application. RSC Adv. 2024, 14, 6776–6792. [Google Scholar] [CrossRef]
  42. Alfryyan, N.; Kordy, M.G.M.; Abdel-Gabbar, M.; Soliman, H.A.; Shaban, M. Characterization of the Biosynthesized Intracellular and Extracellular Plasmonic Silver Nanoparticles Using Bacillus Cereus and Their Catalytic Reduction of Methylene Blue. Sci. Rep. 2022, 12, 12495. [Google Scholar] [CrossRef]
  43. Almarashi, J.Q.M.; Gadallah, A.-S.; Shaban, M.; Ellabban, M.A.; Hbaieb, K.; Kordy, M.G.M.; Zayed, M.; Mohamed, A.-A.H. Quick Methylene Blue Dye Elimination via SDS-Ag Nanoparticles Catalysts. Sci. Rep. 2024, 14, 15227. [Google Scholar] [CrossRef] [PubMed]
  44. Dandia, A.; Bansal, S.; Sharma, R.; Rathore, K.S.; Parewa, V. Microwave-assisted nanocatalysis: A CuO NPs/rGO composite as an efficient and recyclable catalyst for the Petasis-borono–Mannich reaction. RSC Adv. 2018, 8, 30280. [Google Scholar] [CrossRef] [PubMed]
  45. Hu, C.-C.; Yeh, H.-H.; Hu, C.-P.; Lecaros, R.L.G.; Cheng, C.-C.; Hung, W.-S.; Tsai, H.-A.; Lee, K.-R.; Lai, J.-Y. The Influence of Intermediate Layer and Graphene Oxide Modification on the CO2 Capture Efficiency of Pebax-GO/PDMS/PSf Mixed Matrix Composite Membranes. J. Taiwan Inst. Chem. Eng. 2022, 135, 104379. [Google Scholar] [CrossRef]
  46. Lee, A.Y.; Yang, K.; Anh, N.D.; Park, C.; Lee, S.M.; Lee, T.G.; Jeong, M.S. Raman Study of D* Band in Graphene Oxide and Its Correlation with Reduction. Appl. Surf. Sci. 2021, 536, 147990. [Google Scholar] [CrossRef]
  47. Ranjbar-Azad, M.; Behpour, M. Facile in situ co-precipitation synthesis of CuO–NiO/rGO nanocomposite for lithium-ion battery anodes. J. Mater. Sci. Mater. Electron. 2021, 32, 18043–18056. [Google Scholar] [CrossRef]
  48. Haywood, B.C.G.; Collins, M.F. Lattice dynamics of MnO. J. Phys. C Solid State Phys. 1969, 2, 46. [Google Scholar] [CrossRef]
  49. He, R.; Chung, T.F.; Delaney, C.; Keiser, C.; Jauregui, L.A.; Shand, P.M.; Chancey, C.C.; Wang, Y.; Bao, J.; Chen, Y.P. Observation of Low Energy Raman Modes in Twisted Bilayer Graphene. Nano Lett. 2013, 13, 3594–3601. [Google Scholar] [CrossRef]
  50. Ramnani, P.; Neupane, M.R.; Ge, S.; Balandin, A.A.; Lake, R.K.; Mulchandani, A. Raman Spectra of Twisted CVD Bilayer Graphene. Carbon 2017, 123, 302–306. [Google Scholar] [CrossRef]
  51. Hembram, K.P.S.S.; Kim, J.G.; Lee, S.G.; Park, J.; Lee, J.-K. Radial-Tangential Mode of Single-Wall Carbon Nanotubes Manifested by Landau Regulation: Reinterpretation of Low- and Intermediate-Frequency Raman Signals. Sci. Rep. 2023, 13, 5012. [Google Scholar] [CrossRef] [PubMed]
  52. Zhao, B.; Song, J.S.; Liu, P.; Xu, W.W.; Fang, T.; Jiao, Z. Monolayer graphene/NiO nanosheets with two−dimension structure for supercapacitors. J. Mater. Chem. 2011, 21, 18792–18798. [Google Scholar] [CrossRef]
  53. Zhang, J.; Zeng, D.W.; Zhao, S.Q.; Wu, J.J.; Xu, K.; Zhu, Q. Room temperature NO2 sensing: What advantage does the rGO−NiO Nanocomposite have over pristine NiO. Phys. Chem. Chem. Phys. 2015, 17, 14903–14911. [Google Scholar] [CrossRef]
  54. Wang, F.; Liu, Y.; Song, Z.; Miao, Z.; Zhao, J. Ni-N-Doped Carbon-Modified Reduced Graphene Oxide Catalysts for Electrochemical CO2 Reduction Reaction. Catalysts 2021, 11, 561. [Google Scholar] [CrossRef]
  55. Li, S.; Niu, Z.; Jiao, Y.; Jin, P.; Yang, D.; Bai, C.; Liu, J.; Li, G.; Luo, Y. Preparation of Different Morphology Cu/GO Nanocomposites and Their Catalytic Performance for Thermal Decomposition of Ammonium Perchlorate. RSC Adv. 2022, 12, 22806–22814. [Google Scholar] [CrossRef] [PubMed]
  56. Luan, D.; Zhang, X.; Yu, Y.; Chen, Y.; Ma, Y.; Bi, C.; Zhao, D. Fabrication and electrochemical properties of graphene/copper–nickel solid solution reinforced polyaniline composite. J. Mater. Sci. Mater. Electron. 2017, 28, 14738–14746. [Google Scholar] [CrossRef]
  57. Kumari, V.; Kaushal, S.; Singh, P.P. Green Synthesis of a CuO/rGO Nanocomposite Using a Terminalia Arjuna Bark Extract and Its Catalytic Activity for the Purification of Water. Mater. Adv. 2022, 3, 2170–2184. [Google Scholar] [CrossRef]
  58. Vuong Hoan, N.T.; Anh Thu, N.T.; Van Duc, H.; Cuong, N.D.; Quang Khieu, D.; Vo, V. Fe 3 O 4/Reduced Graphene Oxide Nanocomposite: Synthesis and Its Application for Toxic Metal Ion Removal. J. Chem. 2016, 2016, 2418172. [Google Scholar] [CrossRef]
  59. Volanti, D.P.; Orlandi, M.O.; Andrés, J.; Longo, E. Efficient Microwave-Assisted Hydrothermal Synthesis of CuO Sea Urchin-like Architectures via a Mesoscale Self-Assembly. CrystEngComm 2010, 12, 1696–1699. [Google Scholar] [CrossRef]
  60. Zhao, Q.; Kulik, H.J. Where Does the Density Localize in the Solid State? Divergent Behavior for Hybrids and DFT+ U. J. Chem. Theory Comput. 2018, 14, 670–683. [Google Scholar] [CrossRef]
  61. Liu, H.B.; Xiang, L.; Jin, Y. Hydrothermal Modification and Characterization of Ni(OH)2 with High Discharge Capability. Cryst. Growth Des. 2006, 6, 283–286. [Google Scholar] [CrossRef]
  62. Wang, L.; Zhang, K.; Hu, Z.; Duan, W.; Cheng, F.; Chen, J. Porous CuO Nanowires as the Anode of Rechargeable Na-Ion Batteries. Nano. Res. 2014, 7, 199–208. [Google Scholar] [CrossRef]
  63. Gao, T.; Jelle, B.P. Paraotwayite-Type α-Ni (OH) 2 Nanowires: Structural, Optical, and Electrochemical Properties. J. Phys. Chem. C 2013, 117, 17294–17302. [Google Scholar] [CrossRef]
  64. Dong, L.; Chu, Y.; Sun, W. Controllable Synthesis of Nickel Hydroxide and Porous Nickel Oxide Nanostructures with Different Morphologies. Chem.–A Eur. J. 2008, 14, 5064–5072. [Google Scholar] [CrossRef]
  65. Askari, S.; Mariotti, D.; Brunet, P.; Vahl, A.; Benedikt, J. Iron-doped nanoflakes of layered double hydroxide of nickel for high-performance hybrid zinc batteries. Mater. Today Energy 2021, 22, 100879. [Google Scholar] [CrossRef]
  66. Zayed, M.; Ahmed, A.M.; Shaban, M. Synthesis and Characterization of Nanoporous ZnO and Pt/ZnO Thin Films for Dye Degradation and Water Splitting Applications. Int. J. Hydrogen Energy 2019, 44, 17630–17648. [Google Scholar] [CrossRef]
  67. Akbari, B.; Tavandashti, M.P.; Zandrahimi, M. Particle Size Characterization of Nanoparticles–A Practical Approach. Iran. J. Mater. Sci. Eng. 2011, 8, 48–56. [Google Scholar]
  68. Zayed, M.; Nasser, N.; Shaban, M.; Alshaikh, H.; Hamdy, H.; Ahmed, A.M. Effect of Morphology and Plasmonic on Au/ZnO Films for Efficient Photoelectrochemical Water Splitting. Nanomaterials 2021, 11, 2338. [Google Scholar] [CrossRef] [PubMed]
  69. Shaban, M.; Abdelkarem, K.; El Sayed, A.M. Structural, Optical and Gas Sensing Properties of Cu2O/CuO Mixed Phase: Effect of the Number of Coated Layers and (Cr+ S) Co-Doping. Phase Transit. 2019, 92, 347–359. [Google Scholar] [CrossRef]
  70. El-Nahass, M.M.; El-Gohary, Z.; Soliman, H.S. Structural and Optical Studies of Thermally Evaporated CoPc Thin Films. Opt. Laser Technol. 2003, 35, 523–531. [Google Scholar] [CrossRef]
  71. Bayansal, F.; Şahin, B.; Yüksel, M.; Biyikli, N.; Çetinkara, H.A.; Güder, H.S. Influence of Coumarin as an Additive on CuO Nanostructures Prepared by Successive Ionic Layer Adsorption and Reaction (SILAR) Method. J. Alloys Compd. 2013, 566, 78–82. [Google Scholar] [CrossRef]
  72. Abid; Sehrawat, P.; Islam, S.S.; Mishra, P.; Ahmad, S. Reduced Graphene Oxide (rGO) Based Wideband Optical Sensor and the Role of Temperature, Defect States and Quantum Efficiency. Sci. Rep. 2018, 8, 3537. [Google Scholar] [CrossRef] [PubMed]
  73. Abdelkarem, K.; Saad, R.; Ahmed, A.M.; Fathy, M.I.; Shaban, M.; Hamdy, H. Efficient Room Temperature Carbon Dioxide Gas Sensor Based on Barium Doped CuO Thin Films. J. Mater. Sci. 2023, 58, 11568–11584. [Google Scholar] [CrossRef]
  74. Ngetich, C.C.; Mutua, J.M.; Kareru, P.G.; Murimi, E.; Karanja, K. Synthesis and Characterization of Graphene Oxide and Graphene Nanomaterial for Fuel Cell Applications. In Proceedings of the Sustainable Research and Innovation Conference, JKUAT Main Campus, Kenya, 6–7 October 2021; pp. 92–96. [Google Scholar]
  75. Sawicki, B.; Tomaszewicz, E.; Piątkowska, M.; Groń, T.; Duda, H.; Górny, K. Correlation between the Band-Gap Energy and the Electrical Conductivity in MPr2W2O10 Tungstates (Where M= Cd, Co, Mn). Acta Phys. Pol. A 2016, 129, A94–A96. [Google Scholar] [CrossRef]
  76. Raslan, A.; Del Burgo, L.S.; Ciriza, J.; Pedraz, J.L. Graphene Oxide and Reduced Graphene Oxide-Based Scaffolds in Regenerative Medicine. Int. J. Pharm. 2020, 580, 119226. [Google Scholar] [CrossRef]
  77. Al-Enizi, A.M.; Ubaidullah, M.; Ahmed, J.; Alrobei, H.; Alshehri, S.M. Copper Nickel@ Reduced Graphene Oxide Nanocomposite as Bifunctional Electro-Catalyst for Excellent Oxygen Evolution and Oxygen Reduction Reactions. Mater. Lett. 2020, 260, 126969. [Google Scholar]
  78. Chaturvedi, K.R.; Sharma, T. Carbonated Polymeric Nanofluids for Enhanced Oil Recovery from Sandstone Reservoir. J. Pet. Sci. Eng. 2020, 194, 107499. [Google Scholar] [CrossRef]
  79. Liu, Z.; Wang, Q.; Kong, Q.; Tong, X.; Wu, S.; Zong, N.; Xu, R.; Yang, L. One-Step Electrosynthesis of Bifunctional NiCu Nanosheets on Iron Foam for Remarkably Enhanced Alkaline Water Splitting. Sustainability 2023, 15, 12240. [Google Scholar] [CrossRef]
  80. Yousaf, A.B.; Alsaydeh, S.A.M.; Zavahir, F.S.; Kasak, P.; Zaidi, S.J. Ultra-Low Pt-Decorated NiCu Bimetallic Alloys Nanoparticles Supported on Reduced Graphene Oxide for Electro-Oxidation of Methanol. MRS Commun. 2018, 8, 1050–1057. [Google Scholar] [CrossRef]
  81. Ballarin, B.; Seeber, R.; Tonelli, D.; Vaccari, A. Electrocatalytic Properties of Nickel (II) Hydrotalcite-Type Anionic Clay: Application to Methanol and Ethanol Oxidation. J. Electroanal. Chem. 1999, 463, 123–127. [Google Scholar] [CrossRef]
  82. Abdel-Hady, E.E.; Shaban, M.; Abdel-Hamed, M.O.; Gamal, A.; Yehia, H.; Ahmed, A.M. Synthesis and Characterization of NiCoPt/CNFs Nanoparticles as an Effective Electrocatalyst for Energy Applications. Nanomaterials 2022, 12, 492. [Google Scholar] [CrossRef] [PubMed]
  83. Li, Y.S.; Zhao, T.S.; Liang, Z.X. Performance of Alkaline Electrolyte-Membrane-Based Direct Ethanol Fuel Cells. J. Power Sources 2009, 187, 387–392. [Google Scholar] [CrossRef]
  84. Deng, Z.; Yi, Q.; Zhang, Y.; Nie, H. NiCo/CN/CNT Composite Catalysts for Electro-Catalytic Oxidation of Methanol and Ethanol. J. Electroanal. Chem. 2017, 803, 95–103. [Google Scholar] [CrossRef]
  85. Barakat, N.A.M.; Yassin, M.A.; Al-Mubaddel, F.S.; Amen, M.T. New Electrooxidation Characteristic for Ni-Based Electrodes for Wide Application in Methanol Fuel Cells. Appl. Catal. A Gen. 2018, 555, 148–154. [Google Scholar] [CrossRef]
  86. Yang, J.; Ju, Z.; Jiang, Y.; Xing, Z.; Xi, B.; Feng, J.; Xiong, S. Enhanced Capacity and Rate Capability of Nitrogen/Oxygen Dual-doped Hard Carbon in Capacitive Potassium-ion Storage. Adv. Mater. 2018, 30, 1700104. [Google Scholar] [CrossRef] [PubMed]
  87. Elgrishi, N.; Rountree, K.J.; McCarthy, B.D.; Rountree, E.S.; Eisenhart, T.T.; Dempsey, J.L. A Practical Beginner’s Guide to Cyclic Voltammetry. J. Chem. Educ. 2018, 95, 197–206. [Google Scholar] [CrossRef]
  88. Sood, A.; Poletayev, A.D.; Cogswell, D.A.; Csernica, P.M.; Mefford, J.T.; Fraggedakis, D.; Toney, M.F.; Lindenberg, A.M.; Bazant, M.Z.; Chueh, W.C. Electrochemical Ion Insertion from the Atomic to the Device Scale. Nat. Rev. Mater. 2021, 6, 847–867. [Google Scholar] [CrossRef]
  89. Tamang, S.; Rai, S.; Bhujel, R.; Bhattacharyya, N.K.; Swain, B.P.; Biswas, J. A Concise Review on GO, rGO and Metal Oxide/rGO Composites: Fabrication and Their Supercapacitor and Catalytic Applications. J. Alloys Compd. 2023, 947, 169588. [Google Scholar] [CrossRef]
  90. Stratakes, B.M.; Dempsey, J.L.; Miller, A.J.M. Determining the Overpotential of Electrochemical Fuel Synthesis Mediated by Molecular Catalysts: Recommended Practices, Standard Reduction Potentials, and Challenges. ChemElectroChem 2021, 8, 4161–4180. [Google Scholar] [CrossRef]
  91. Li, Z.; Yan, Y.; Xu, S.-M.; Zhou, H.; Xu, M.; Ma, L.; Shao, M.; Kong, X.; Wang, B.; Zheng, L. Alcohols Electrooxidation Coupled with H2 Production at High Current Densities Promoted by a Cooperative Catalyst. Nat. Commun. 2022, 13, 147. [Google Scholar] [CrossRef]
  92. Parsa, A.; Amanzadeh-Salout, S. Electrocatalytic Activity and Electrochemical Impedance Spectroscopy of Poly (Aniline-Co-Ortho-Phenylenediamine) Modified Electrode on Ascorbic Acid. Orient. J. Chem. 2016, 32, 2051. [Google Scholar] [CrossRef]
  93. Feng, L.-J.; Zhang, X.-H.; Zhao, D.-M.; Wang, S.-F. Electrochemical Studies of Bovine Serum Albumin Immobilization onto the Poly-o-Phenylenediamine and Carbon-Coated Nickel Composite Film and Its Interaction with Papaverine. Sens. Actuators B Chem. 2011, 152, 88–93. [Google Scholar] [CrossRef]
  94. Dhillon, S.; Kant, R. Theory for Electrochemical Impedance Spectroscopy of Heterogeneous Electrode with Distributed Capacitance and Charge Transfer Resistance. J. Chem. Sci. 2017, 129, 1277–1292. [Google Scholar] [CrossRef]
  95. Helal, N.H. Corrosion Inhibition and Adsorption Behavior of Methionine on Mg-Al-Zn Alloy. J. Chem. Eng. Mater. Sci. 2011, 2, 28–38. [Google Scholar]
  96. Tian, H.; Zhao, G.; Zhang, Y.; Wang, Y.; Cao, T. Hierarchical (0 0 1) Facet Anatase/Rutile TiO2 Heterojunction Photoanode with Enhanced Photoelectrocatalytic Performance. Electrochim. Acta 2013, 96, 199–205. [Google Scholar] [CrossRef]
  97. Sun, Y.; Zhou, T.; Pan, Q.; Zhang, X.; Guo, J. PtFe/Nitrogen-Doped Graphene for High-Performance Electrooxidation of Formic Acid with Composition Sensitive Electrocatalytic Activity. RSC Adv. 2015, 5, 60237–60245. [Google Scholar] [CrossRef]
  98. Khan, I.A.; Sofian, M.; Badshah, A.; Khan, M.A.; Imran, M.; Nadeem, M.A. Stable and Efficient PtRu Electrocatalysts Supported on Zn-BTC MOF Derived Microporous Carbon for Formic Acid Fuel Cells Application. Front. Chem. 2020, 8, 367. [Google Scholar] [CrossRef]
  99. Li, F.-M.; Kang, Y.-Q.; Liu, H.-M.; Zhai, Y.-N.; Hu, M.-C.; Chen, Y. Atoms Diffusion-Induced Phase Engineering of Platinum-Gold Alloy Nanocrystals with High Electrocatalytic Performance for the Formic Acid Oxidation Reaction. J. Colloid Interface Sci. 2018, 514, 299–305. [Google Scholar] [CrossRef]
  100. Shen, S.Y.; Zhao, T.S.; Xu, J.B.; Li, Y.S. Synthesis of PdNi Catalysts for the Oxidation of Ethanol in Alkaline Direct Ethanol Fuel Cells. J. Power Sources 2010, 195, 1001–1006. [Google Scholar] [CrossRef]
  101. Chen, F.-K.; Ho, Y.-H.; Chang, H.-W.; Tsai, Y.-C. Nanocomposite Integrating Tube-like NiCo2S4 and Carbon Nanotubes for Electrooxidation of Methanol. Electrochem. Commun. 2020, 117, 106783. [Google Scholar] [CrossRef]
  102. Hu, J.; Li, R.; Wang, X.; Wang, S.; Fang, C. Strain-Induced Porous Pd@ PdPt Core/Shell Nanocubes as Effective All-in-One Electrocatalysts toward Multialcohol Oxidation. ACS Appl. Nano Mater. 2023, 7, 10213–10222. [Google Scholar] [CrossRef]
  103. Higareda, A.; Mares-Briones, F.; Rosas, G.; Pérez, R.; Esparza, R. Enhanced Durability of Pdpt/c Electrocatalyst during the Ethanol Oxidation Reaction in Alkaline Media. J. Solid State Electrochem. 2022, 26, 2143–2151. [Google Scholar] [CrossRef]
  104. Xia, Q.Q.; Zhang, L.Y.; Zhao, Z.L.; Li, C.M. Growing Platinum-Ruthenium-Tin Ternary Alloy Nanoparticles on Reduced Graphene Oxide for Strong Ligand Effect toward Enhanced Ethanol Oxidation Reaction. J. Colloid Interface Sci. 2017, 506, 135–143. [Google Scholar] [CrossRef] [PubMed]
  105. Li, P.; Liu, K.; Ye, J.; Xue, F.; Cheng, Y.; Lyu, Z.; Liao, X.; Wang, W.; Zhang, Q.; Chen, X. Facilitating the C–C Bond Cleavage on Sub-10 Nm Concavity-Tunable Rh@ Pt Core–Shell Nanocubes for Efficient Ethanol Electrooxidation. J. Mater. Chem. A Mater. 2019, 7, 17987–17994. [Google Scholar] [CrossRef]
  106. Han, Z.; Wang, A.-J.; Zhang, L.; Wang, Z.-G.; Fang, K.-M.; Yin, Z.-Z.; Feng, J.-J. 3D Highly Branched PtCoRh Nanoassemblies: Glycine-Assisted Solvothermal Synthesis and Superior Catalytic Activity for Alcohol Oxidation. J. Colloid Interface Sci. 2019, 554, 512–519. [Google Scholar] [CrossRef] [PubMed]
  107. Cui, J.Y.; Li, T.T.; Yin, Z.H.; Chen, L.; Wang, J.J. Remarkably Enhanced Acidic Photoelectrochemical Glycerol Oxidation Achieving the Theoretical Maximum Photocurrent of BiVO4 through Anion Modulation. Chem. Eng. J. 2024, 493, 152461. [Google Scholar] [CrossRef]
  108. Javan, H.; Asghari, E.; Ashassi-Sorkhabi, H. Design of New Anodic Bimetallic Nanocatalyst Composed of Ni–Cu Supported by Reduced Carbon Quantum Dots for the Methanol Oxidation Reaction. Diam. Relat. Mater. 2021, 115, 108348. [Google Scholar] [CrossRef]
  109. Mao, Y.H.; Chen, C.Y.; Fu, J.X.; Lai, T.Y.; Lu, F.H.; Tsai, Y.C. Electrodeposition of Nickel copper on Titanium Nitride for Methanol Electrooxidation. Surf. Coat. Technol. 2018, 350, 949–953. [Google Scholar] [CrossRef]
  110. Ding, R.; Zhang, S.; Chen, Y.; Rui, Z.; Hua, K.; Wu, Y.; Li, X.; Duan, X.; Wang, X.; Li, J. Application of Machine Learning in Optimizing Proton Exchange Membrane Fuel Cells: A Review. Energy AI 2022, 9, 100170. [Google Scholar] [CrossRef]
  111. Zhao, C.; Yuan, S.; Cheng, X.; Zheng, Z.; Liu, J.; Yin, J.; Shen, S.; Yan, X.; Zhang, J. The Effect of Catalyst Layer Design on Catalyst Utilization in PEMFC Studied via Stochastic Reconstruction Method. Energy AI 2023, 13, 100245. [Google Scholar] [CrossRef]
  112. Zaaba, N.I.; Foo, K.L.; Hashim, U.; Tan, S.J.; Liu, W.-W.; Voon, C.H. Synthesis of Graphene Oxide Using Modified Hummers Method: Solvent Influence. Procedia Eng. 2017, 184, 469–477. [Google Scholar] [CrossRef]
  113. Liu, J.; Wang, X.; Liu, J.; Li, H.; Zhang, H. Improved Mechanical Properties of Ni-rGO/Cu Composites Prepared by Molecular-Level Mixing. Appl. Phys. A 2022, 128, 165. [Google Scholar] [CrossRef]
  114. Sadiq, M.; Arya, A.; Sharma, A.L. Dielectric Study of Polymer Nanocomposite Films for Energy Storage Applications. In Proceedings of the Recent Trends in Materials and Devices: Proceedings ICRTMD 2015; Springer: Berlin/Heidelberg, Germany, 2017; pp. 389–396. [Google Scholar]
Figure 1. (a) SEM depictions of CuNi NPs and (b) their corresponding nanoparticle size distributions, along with SEM depictions of (c) GO, (d) CuNi-GO, (e) rGO, and (f) CuNi-rGO.
Catalysts 14 00551 g001
Figure 2. FT-IR charts of (a) GO, reduced GO, and CuNi NPs and (b) CuNi-GO and CuNi-rGO composites; (c) Raman spectra of CuNi-GO and CuNi-rGO nanocomposites; and (d) XRD patterns of CuNi, CuNi-GO, and CuNi-rGO nanocomposites.
Catalysts 14 00551 g002
Figure 3. (a) Absorbance behaviors and (b) bandgap estimation for rGO, CuNi, CuNi-GO, and CuNi-rGO.
Catalysts 14 00551 g003
Figure 4. The influence of sample compositions on the electrocatalytic efficacy in 1 M KOH solutions at 20 °C, targeting the oxidation of (ac) 0.5 M ethanol and (df) 2 M methanol using CuNi, CuNi-GO, CuNi-rGO, and Ag-CuNi-rGO.
Catalysts 14 00551 g004
Figure 5. The influence of (a) ethanol and (b) methanol concentrations on the electrocatalytic CuNi-rGO performance at 20 °C, 100 mV/s.
Catalysts 14 00551 g005
Figure 6. Scanning rate effects on the electrocatalytic efficacy of (a) CuNi-rGO in 0.5 M ethanol and (b) CuNi-rGO and (c) Ag-CuNi-rGO in 2 M methanol at 20 °C.
Catalysts 14 00551 g006
Figure 7. LSV responses at 100 mV.s−1 for CuNi, CuNi-GO, CuNi-rGO, and Ag-CuNi-rGO in (a) ethanol and (b) methanol, (c) the alterations in current density over time, as determined by CAM analysis, in ethanol and methanol.
Catalysts 14 00551 g007
Figure 8. (a) Nyquist and (b) Bode diagrams for the electrodes Ag-CuNi-rGO, CuNi-rGO, CuNi-GO, and CuNi when tested in a 2 M methanol solution.
Catalysts 14 00551 g008
Table 1. Derived quantitative measurements for Randle’s circuit components.
NanocatalystsRsRctCdI/µFZWθmaxfmax/s−1 τ n /ms
Ag-CuNi-rGO72.9 ± 0.18.3 ± 0.123.18 ± 0.114.5 ± 0.0486.4° ± 0.213.48 ± 0.4074.2 ± 2.2
84.9 ± 0.21.09 ± 0.11918.3 ± 91.8
CuNi-rGO36.4 ± 0.67.5 ± 0.23.53 ± 0.151.34 ± 0.0372.0° ± 0.233.85 ± 0.5029.5 ± 0.4
69.4° ± 0.21.38 ± 0.15722.6 ± 77.4
CuNi-GO 37.2 ± 0.81.2 ± 0.12.09 ± 0.131.57 ± 0.0278.3° ± 0.32.57 ± 0.20388.4 ± 30.0
CuNi 35.4 ± 0.53.3 ± 0.20.78 ± 0.076.36 ± 0.0481.8° ± 0.313.39 ± 0.3074.7 ± 1.7
Table 2. Evaluative comparison of the newly developed CuNi-rGO and CuNi-GO nanocatalysts against earlier Pt- or Ni-based nanocatalysts for use in DAFCs.
CatalystsNanomorphologiesElectrolytesOnset
Potentials
(mV)
Current Density Catalyst Dose (mg)Ref.
Pt79Fe21/N-doped grapheneNanoparticles/sheets1 M Formic + 0.5 M sulfuric acids110 mV vs. RHE186 mA/g @ 0.4 V vs. RHE2 [97]
Pt1Ru2/microporous carbon-950Nanoparticles/microporous0.5 M H2SO4 + 1 M CH2O2110 mV vs. Ag/AgCl9.5 mA/cm2 @ 700 mV10[98]
PtAu/AuNanotexture0.5 M Formic + 0.5 M H2SO4-228 mA/g @ 0.51 V8 [99]
Pd2Ni3/CNanopowder1 M ethanol + 1 M KOH−650 mV vs. MMO217 mA/cm210 [100]
NiCo2S4/CNT(3:1)Nanocomposites1 M KOH + 1 M methanol -160 mA/cm2 @ 600 mV4 [101]
Pd@PdPtPorous nanocubes0.5 M KOH + 1 M ethanol467 mV vs. RHE3.4 mA/cm2-[102]
PdPt/CNanoparticles0.3 M KOH + 1 M ethanol−370 mV 3.3 mA/cm21 [103]
Pt1Ru0.5Sn0.5-RGONanoparticles1 M KOH + 1 M ethanol−633 mV2.5 mA/cm23 [104]
Rh@PtNanocubes0.1 M HClO4 + 0.2 M ethanol 460 mV vs. RHE2.6 mA/cm2-[105]
PtCoRhNano-assemblies1 M KOH + 1 M ethanol250 mV vs. RHE40.3 mA/cm22[106]
CuNi-rGONanospheres/sheets1 M KOH + 2 M methanol−315 mV 267.2 mA/g25 This study
Ag- CuNi-rGO−548 mV vs. Hg/HgCl679.3 mA/g
Disclaimer/Publisher’s Note: The statements, opinions and data contained in all publications are solely those of the individual author(s) and contributor(s) and not of MDPI and/or the editor(s). MDPI and/or the editor(s) disclaim responsibility for any injury to people or property resulting from any ideas, methods, instructions or products referred to in the content.

