Abstract
Copper-based catalysts are widely applied in catalytic CO conversion. Despite their importance in determining catalytic performance, the interaction of CO with different copper states has often been the subject of debate. Herein, we discuss the preparation of four different CuOx states (namely, fully oxidized and reduced (O-573 and R-573, respectively) and 800 and 1000 K annealed (A-800 and A-1000, respectively)) through in situ treatments, comparing CO adsorption behaviors with vacuum-transmission IR spectroscopy. CO only weakly adsorbed on the A-1000 and R-573 surfaces, whereas it led to the creation of trace amounts of surface oxygen vacancies over the O-573 surface, providing adsorption sites for the subsequent CO. Meanwhile, the produced CO2 re-adsorbed on the catalyst to form carbonate species. The reduction process was notably promoted over A-800 due to the presence of abundant surface oxygen vacancies, demonstrating the key role of Cuδ+ in oxygen vacancies, rather than merely its chemical state, in dominating the interaction of CO with CuOx.
1. Introduction
The efficient utilization of CO/CO2 is one of the core concepts in C1 chemistry, possibly facilitating energy-recycling loops involving renewable resources. Cu-based catalysts have long been thought to demonstrate a unique catalytic performance for CO/CO2 hydrogenation to methanol [1,2,3,4,5,6,7], the reverse water–gas shift reaction [8,9,10,11,12], and (preferential) CO oxidation [13,14,15,16,17,18,19], among others. Particularly, the Cu-ZnO-Al2O3 catalyst has attracted extensive research attention ever since its industrial application in methanol synthesis in the 1960s [20]. However, despite often being employed as a prototypical catalyst for mechanism studies, the Cu-ZnO-Al2O3 catalyst’s active structure is still under debate [20,21,22,23,24]. In general, the most commonly presented chemical states of Cu-based catalysts are metallic Cu (Cu0), copper oxide (CuO), cuprous oxide (Cu2O), and CuOx [25,26,27,28]. Cu0 was previously thought to be the active structure for methanol synthesis, relying on the positive correlation between catalytic activities and the Cu loading of Cu-ZnO-Al2O3 catalysts [29]. Similarly, Bell et al. [30,31,32] proposed that methanol synthesis activity increased linearly with the Cu surface area for a given phase of ZrO2 support. Subsequently, Natesakhawat et al. investigated the active sites and structure–activity relationships of Cu-based catalysts during methanol synthesis from CO2 hydrogenation, concluding that metallic Cu was responsible for the catalytic performance [21]. However, Goodman et al. [24] evaluated the values of turnover frequency (TOF) for methanol production on Cu (100), finding a significantly higher TOF on the oxidized surface than on the oxygen-free one. In this regard, the authors emphasized the role of ionic Cu species in promoting reactivity. Comparatively, by virtue of density functional theory (DFT) and kinetic Monte Carlo (KMC) simulations, Liu et al. [33] concluded that the main carbon sources for the hydrogenation of Cu-based catalysts were strongly dependent on the chemical state of Cu: metallic Cu exclusively catalyzed CO2 hydrogenation, while Cu+ action corresponded mainly to that of CO. In addition to the chemical state of Cu, Hu et al. [22] found that the synergistic effects among Cu0, Cu+, and ZnOx significantly contributed to the catalytic activity.
The reported models have somewhat diverged from one another due to disparities in the investigation conditions, sample status, and preparation methods and the structural complexity of the catalyst itself, as well as the dynamic evolution of its structure and chemical state during the reactions (e.g., with a high temperature and pressure). The characterization of Cu-based catalysts is routinely performed before and after catalytic reactions, while the chemical state of the active component may be altered under reaction conditions. Although more structural information has been obtained during reactions with the development of characterization techniques, the surface chemical state and its interaction with reactants have remained ambiguous. Indeed, CO adsorption on transition metal oxides has been reported to correlate with their d-band center [34,35,36,37,38]. For instance, the CO adsorption mechanism on the FeCo (100) surface has been investigated using plane-wave DFT [36], showing that FeCo (100) exhibits a stronger CO adsorption ability than pure Fe (100) due to its closer position to the Fermi level. In the case of copper, a shift in the position of the d-band center affects the state of the adsorbate on its surface [38]. Particularly, as the chemical state or surface structural state may have a strong influence on the d-band center, the study of CO adsorption behaviors over Cu-based catalysts with a defined chemical state is scientifically necessary to expand our understanding of the reaction mechanism. In this context, tuning the chemical state of Cu in situ and investigating the interaction of the different states with CO could eliminate model differences and refine the understanding of CO/CO2 catalytic conversion over Cu-based catalysts. In this study, we chose four commonly presented states of copper catalysts, obtained via the in situ oxidation, reduction, and annealing of a CuOx/Al2O3 catalyst prepared following the solvothermal method, to clarify the interaction of CO with Cu-based catalysts using a vacuum Fourier transform infrared spectrometer (FTIR). Contrary to previously proposed models, we found that the key factor influencing CO adsorption on Cu-based catalysts was the presence of Cuδ+ in oxygen vacancies, rather than merely its chemical state.
2. Results and Discussion
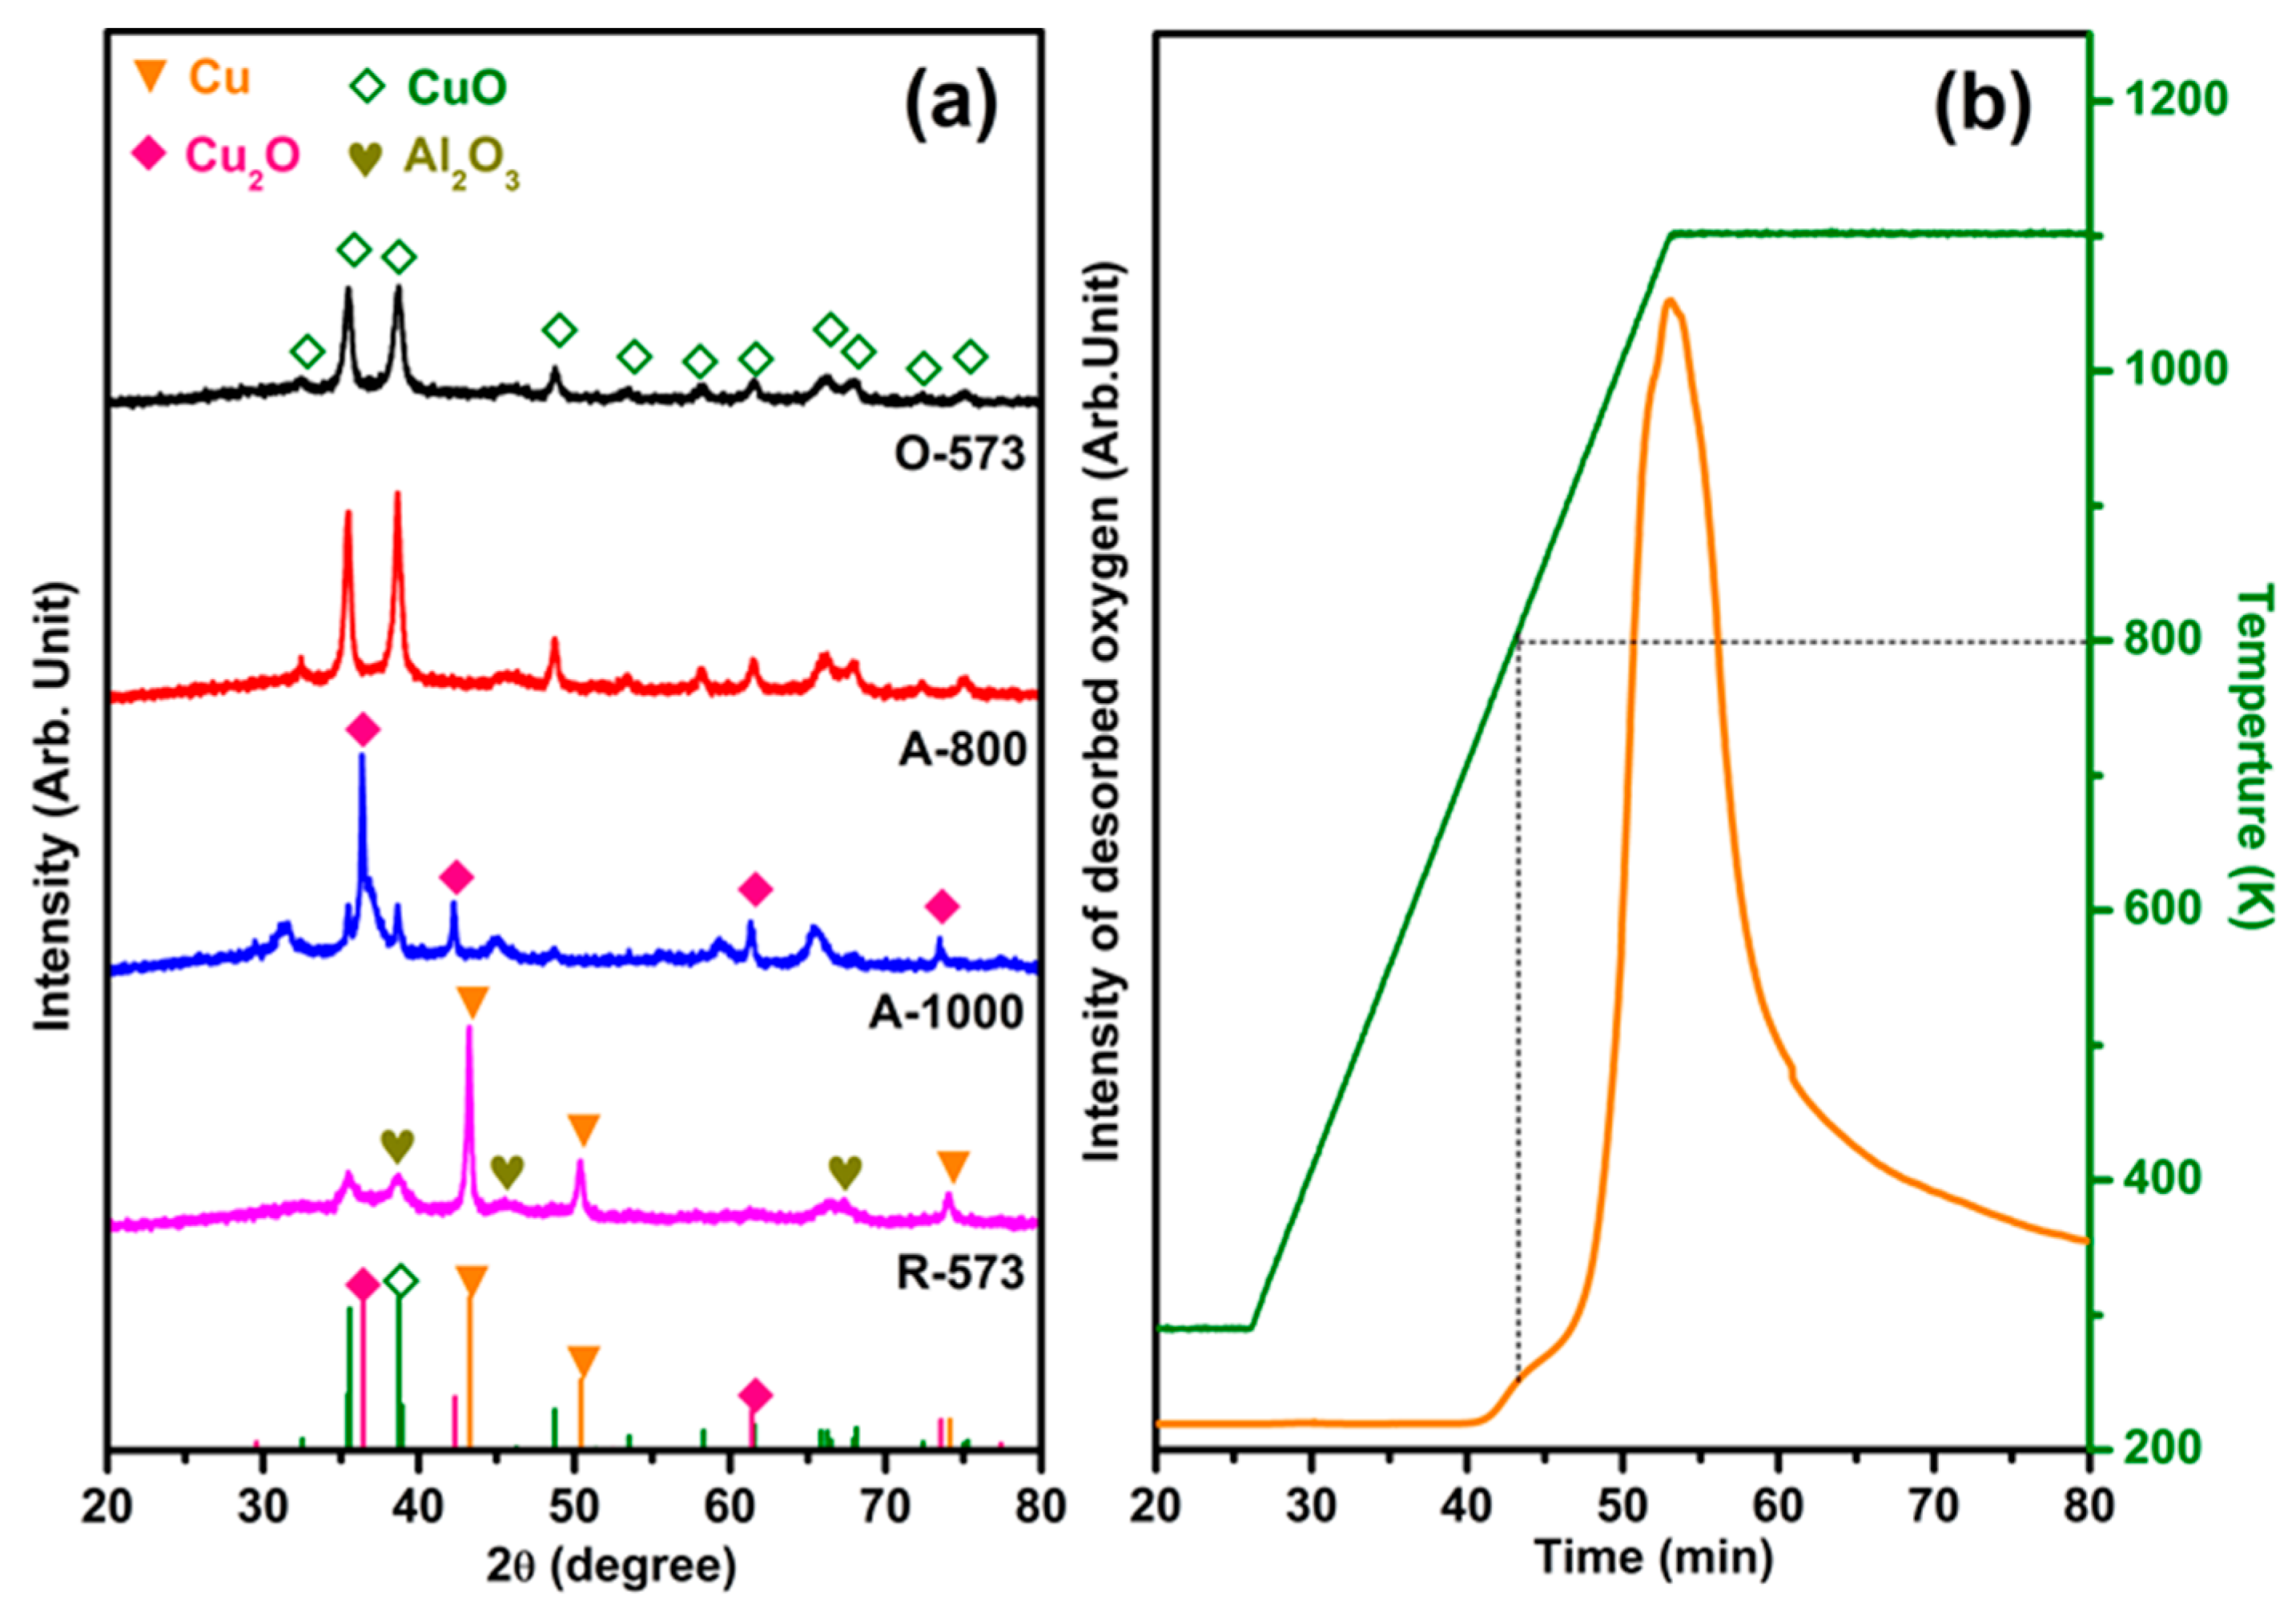
Figure 1a shows the XRD patterns of O-573, R-573, A-800, and A-1000. Crystalline Al2O3 phases can be observed around 2θ = 37.4°, 45.7°, and 67.4° (JCPDS, no. 50-0741) in all samples with different Cu states [39,40]. The patterns of O-573 and A-800 exhibit a pure CuO phase (JCPDS, no. 89-5897), while A-1000 and R-573 show Cu2O (JCPDS, no. 78-2076) and Cu (JCPDS, no. 04-0836) phases, respectively. The diffraction peaks at 2θ of 35.47° and 38.72° for R-573 and A-1000 are caused by the air contact induced by re-oxidation during measurement [6]. For A-800, the peak widths at 35.47° and 38.63° are narrower than those of O-573, indicating that annealing at 800 K does not lead to a phase transformation, except for grain size growth due to the annealing effect. The same trend can also be observed by ex situ scanning electron microscope (SEM) characterization (Figure S1). Figure 1b shows the TPD profile applied directly on a clean CuO sample (i.e., O-573), with the small desorption peak around 800 K corresponding to surface oxygen desorption and the huge desorption of oxygen above 800 K to a phase transformation from CuO to Cu2O. In addition, we speculate that the nature of the peak at 1073 cm−1 in the IR spectrum may contribute to the decrease in the charge carrier concentration of CuOx/Al2O3 (Figure S2) [41,42]. Combined with the A-800 XRD results, it can be inferred that annealing at 800 K led only to the generation of oxygen vacancies rather than phase transformations into Cu2O. Moreover, XPS was applied to further demonstrate the phase transformation and the quantitative comparison of oxygen vacancies, as detailed in Figure S3 and Table S1.
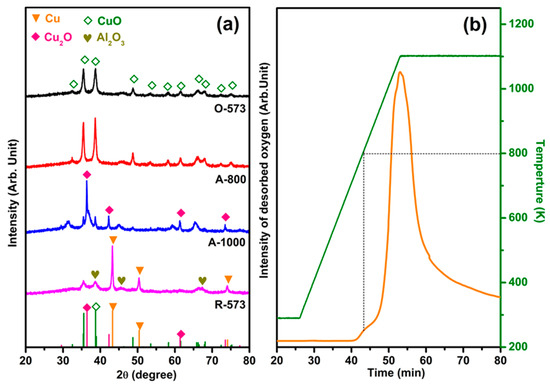
Figure 1.
(a) XRD patterns of 50 wt% CuOx/Al2O3 after different in situ pretreatments (fully oxidized (O-573), 800 K annealed (A-800), 1000 K annealed (A-1000), and fully reduced (R-573)). (b) Oxygen desorption profile during vacuum annealing of O-573, with a ramping rate of 30 K/min.
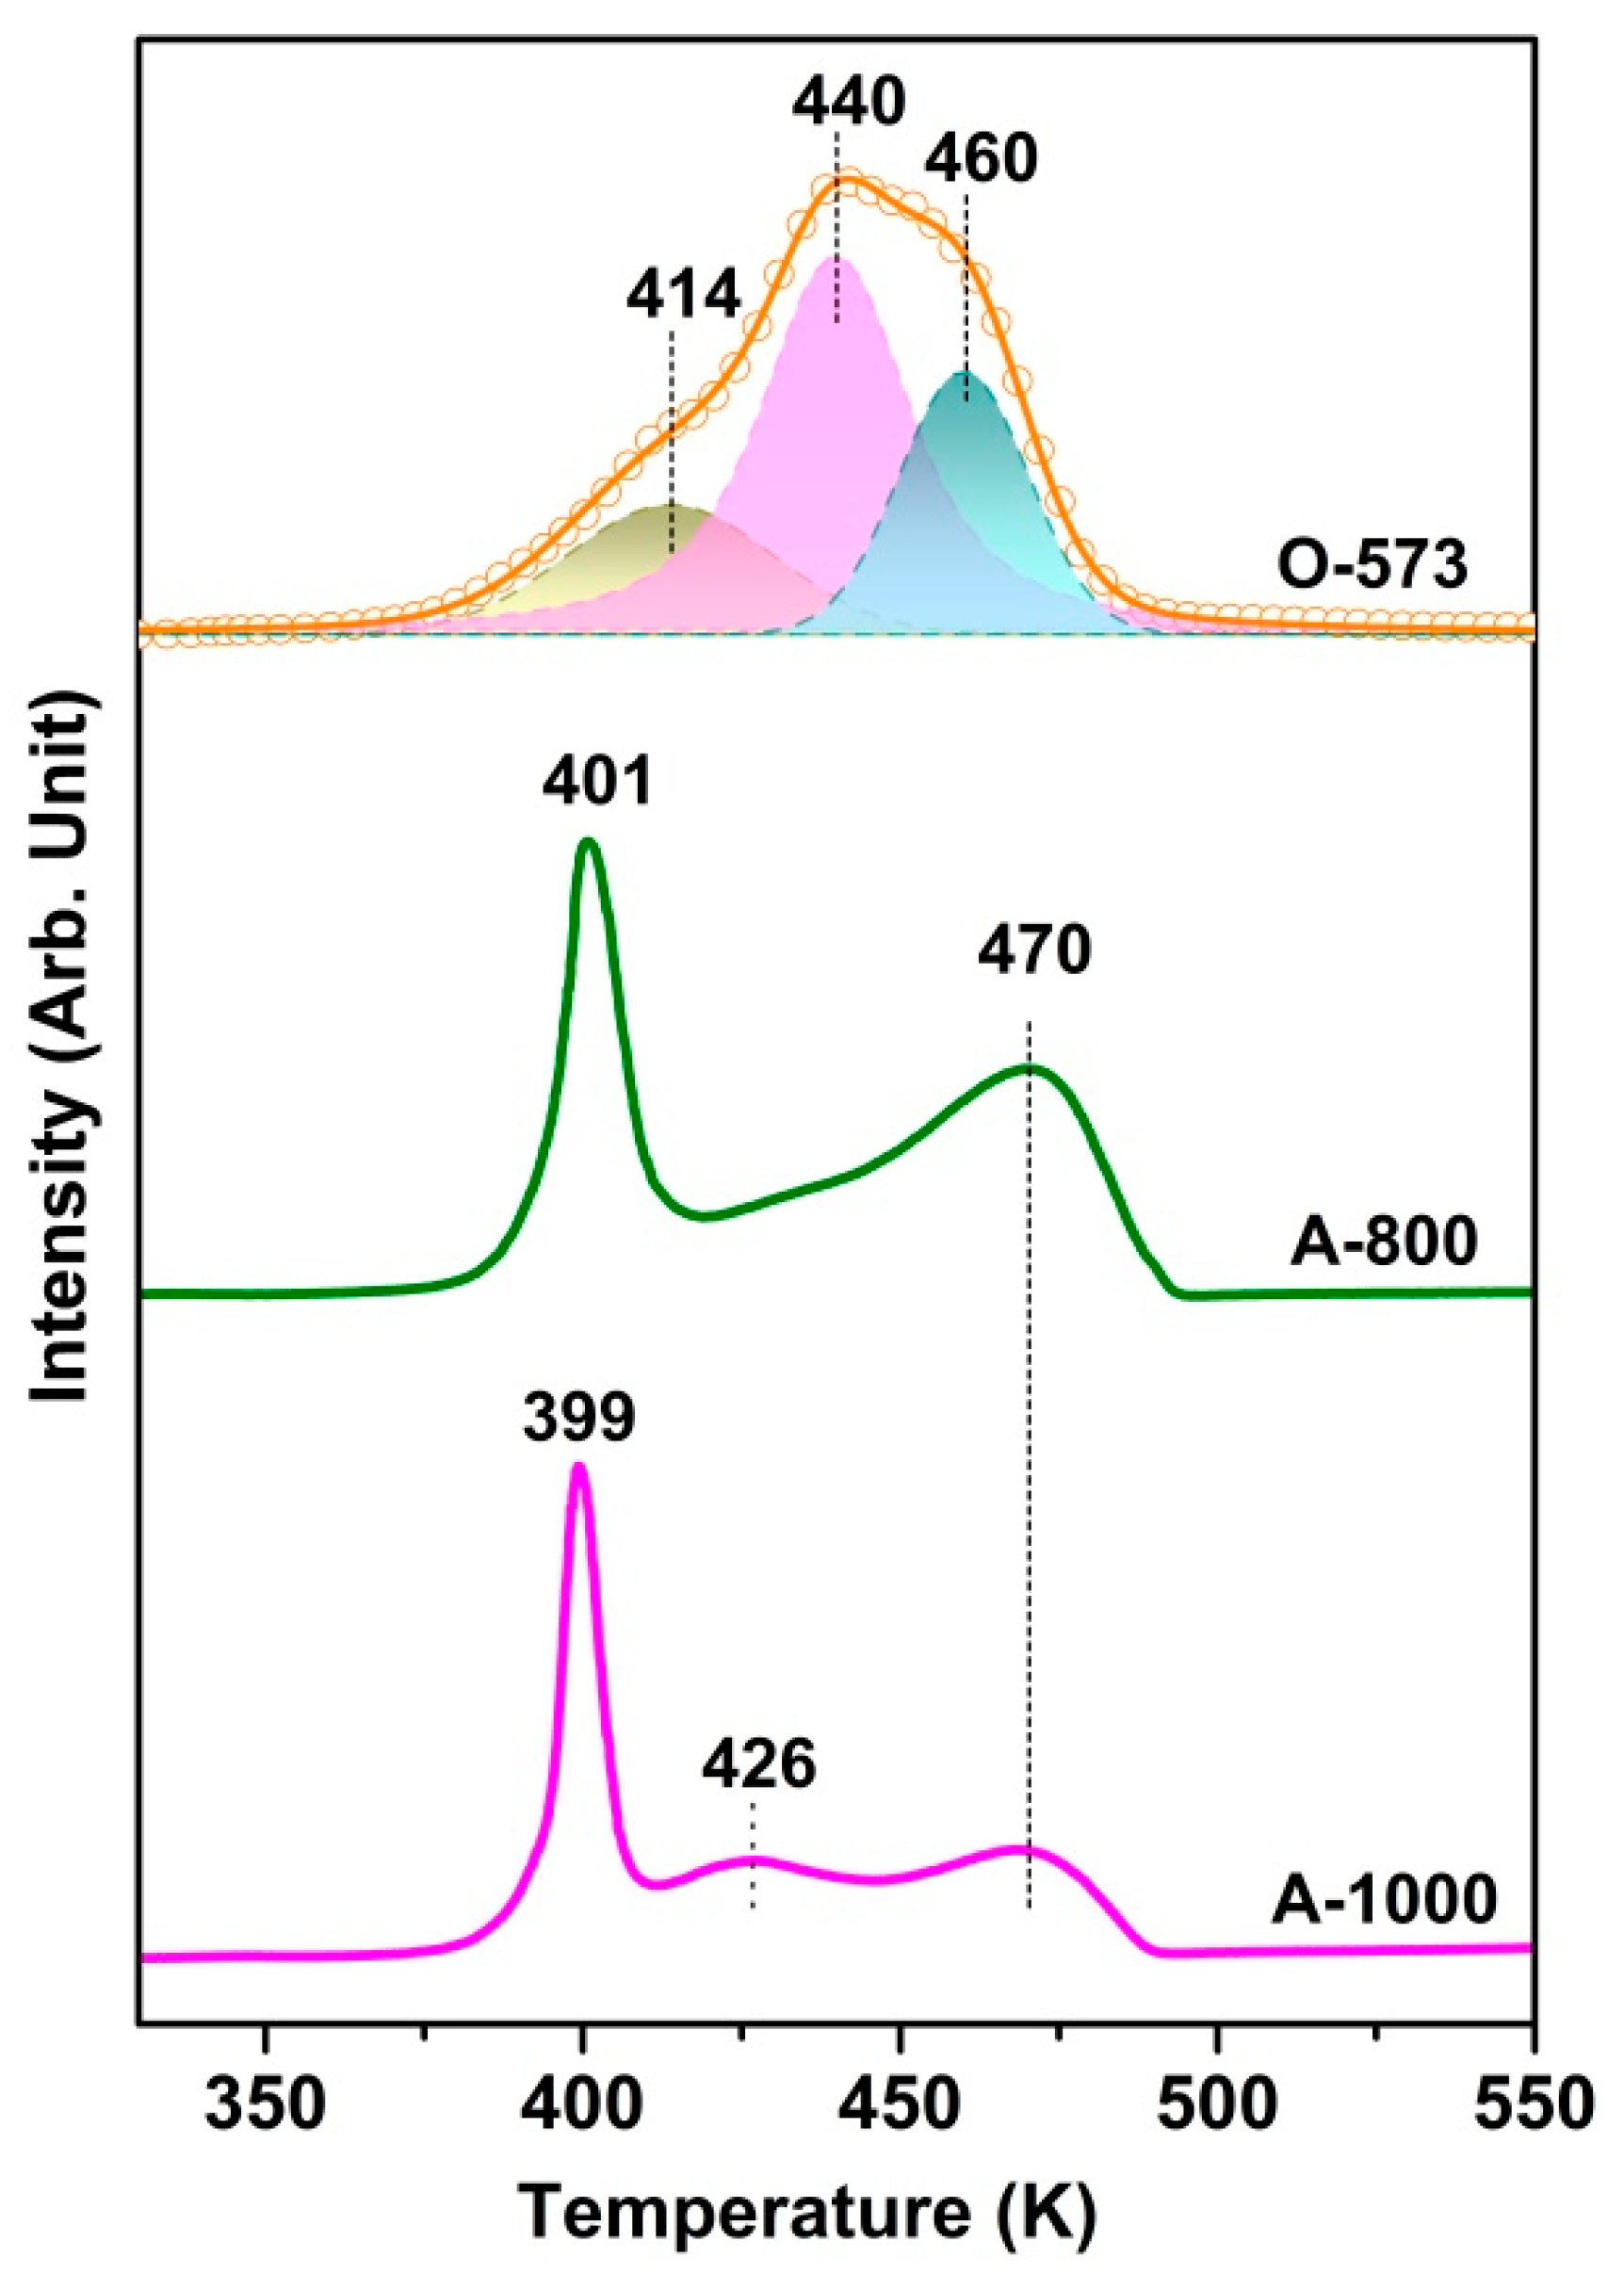
Figure 2 presents the TPR spectra of the O-573, A-800, and A-1000 samples, while the O2-TPO of the R-573 sample is shown in Figure S4. Note that peak fitting with Gaussian-type functions has been applied to the O-573 reduction profile. The samples’ different TPR profiles clearly reflect the structure or property changes during the in situ preparation. Two high-temperature peaks at 440 and 460 K for O-573 can be assigned to the reduction in highly dispersed CuO species and crystalline CuO, respectively [43,44]. However, the TPR profile becomes quite different after vacuum annealing at 800 K. Since A-800 has the same bulk structure but an abundance of surface oxygen vacancies, we can safely attribute the reduction peak at 401 K to the consumption of surface oxygen in the presence of surface Cu. The result is similar to the TPR after CO pretreatment, where the presence of Cuδ+ on surface oxygen vacancies facilitates H2 activation and, hence, the consumption of surface oxygen [43]. Considering this, we speculate that the wide reduction peak at 414 K for O-573 has the same origin as the oxygen vacancies created during the initial reduction of the catalyst’s surface and, in turn, promotes the further reduction of surface oxides. This speculation is consistent with the presence of a trace reduction peak at 414 K, also an indication that there may exist a small amount of Cu (e.g., at point defect) even for fully oxidized Cu. For A-1000, the peak at 426 K may be assigned to Cu2O reduction, which has a weak interaction with Al2O3 [45].

Figure 2.
H2-TPR profiles of O-573, A-800, and A-1000 under the following conditions: 10 K/min heating rate; 10% H2/Ar and 50 SCCM gas; and 100 mg catalyst weight.
The integrated peak areas corresponding to three TPR profiles and the BET results are summarized in Table 1. It can be seen that the surface area of the CuO sample was slightly reduced during the reduction and annealing phases, consistent with the slightly increased grain size. For the integrated peak area, the CuO value is roughly twice that of Cu2O, demonstrating that CuO has been thoroughly transformed into its Cu2O phase after 1000 K annealing for 30 min. Meanwhile, the relatively small value of A-800 indicates that a large amount of oxygen desorbs during annealing, which seems inconsistent with the small TPD peak at 800 K (Figure 1b). As the sample was kept at 800 K for 30 min during preparation, we speculate that an out-diffusion of bulk oxygen may have happened alongside the partial phase transformation, as proven by the Cu 2p XPS spectra (Figure S3). As shown by the black curve, the peak intensity of the O-573 sample’s Cu shake-up satellite is the strongest among the four copper states, a typical feature for the presence of a Cu2+ state [16,46]. Comparatively, the peaks of the A-800 and A-1000 samples gradually decrease, until they disappear in the R-573 sample, in line with the emergence of phase transformation.

Table 1.
Summary of CuOx samples’ peak TPR area, BET surface area, and grain size.
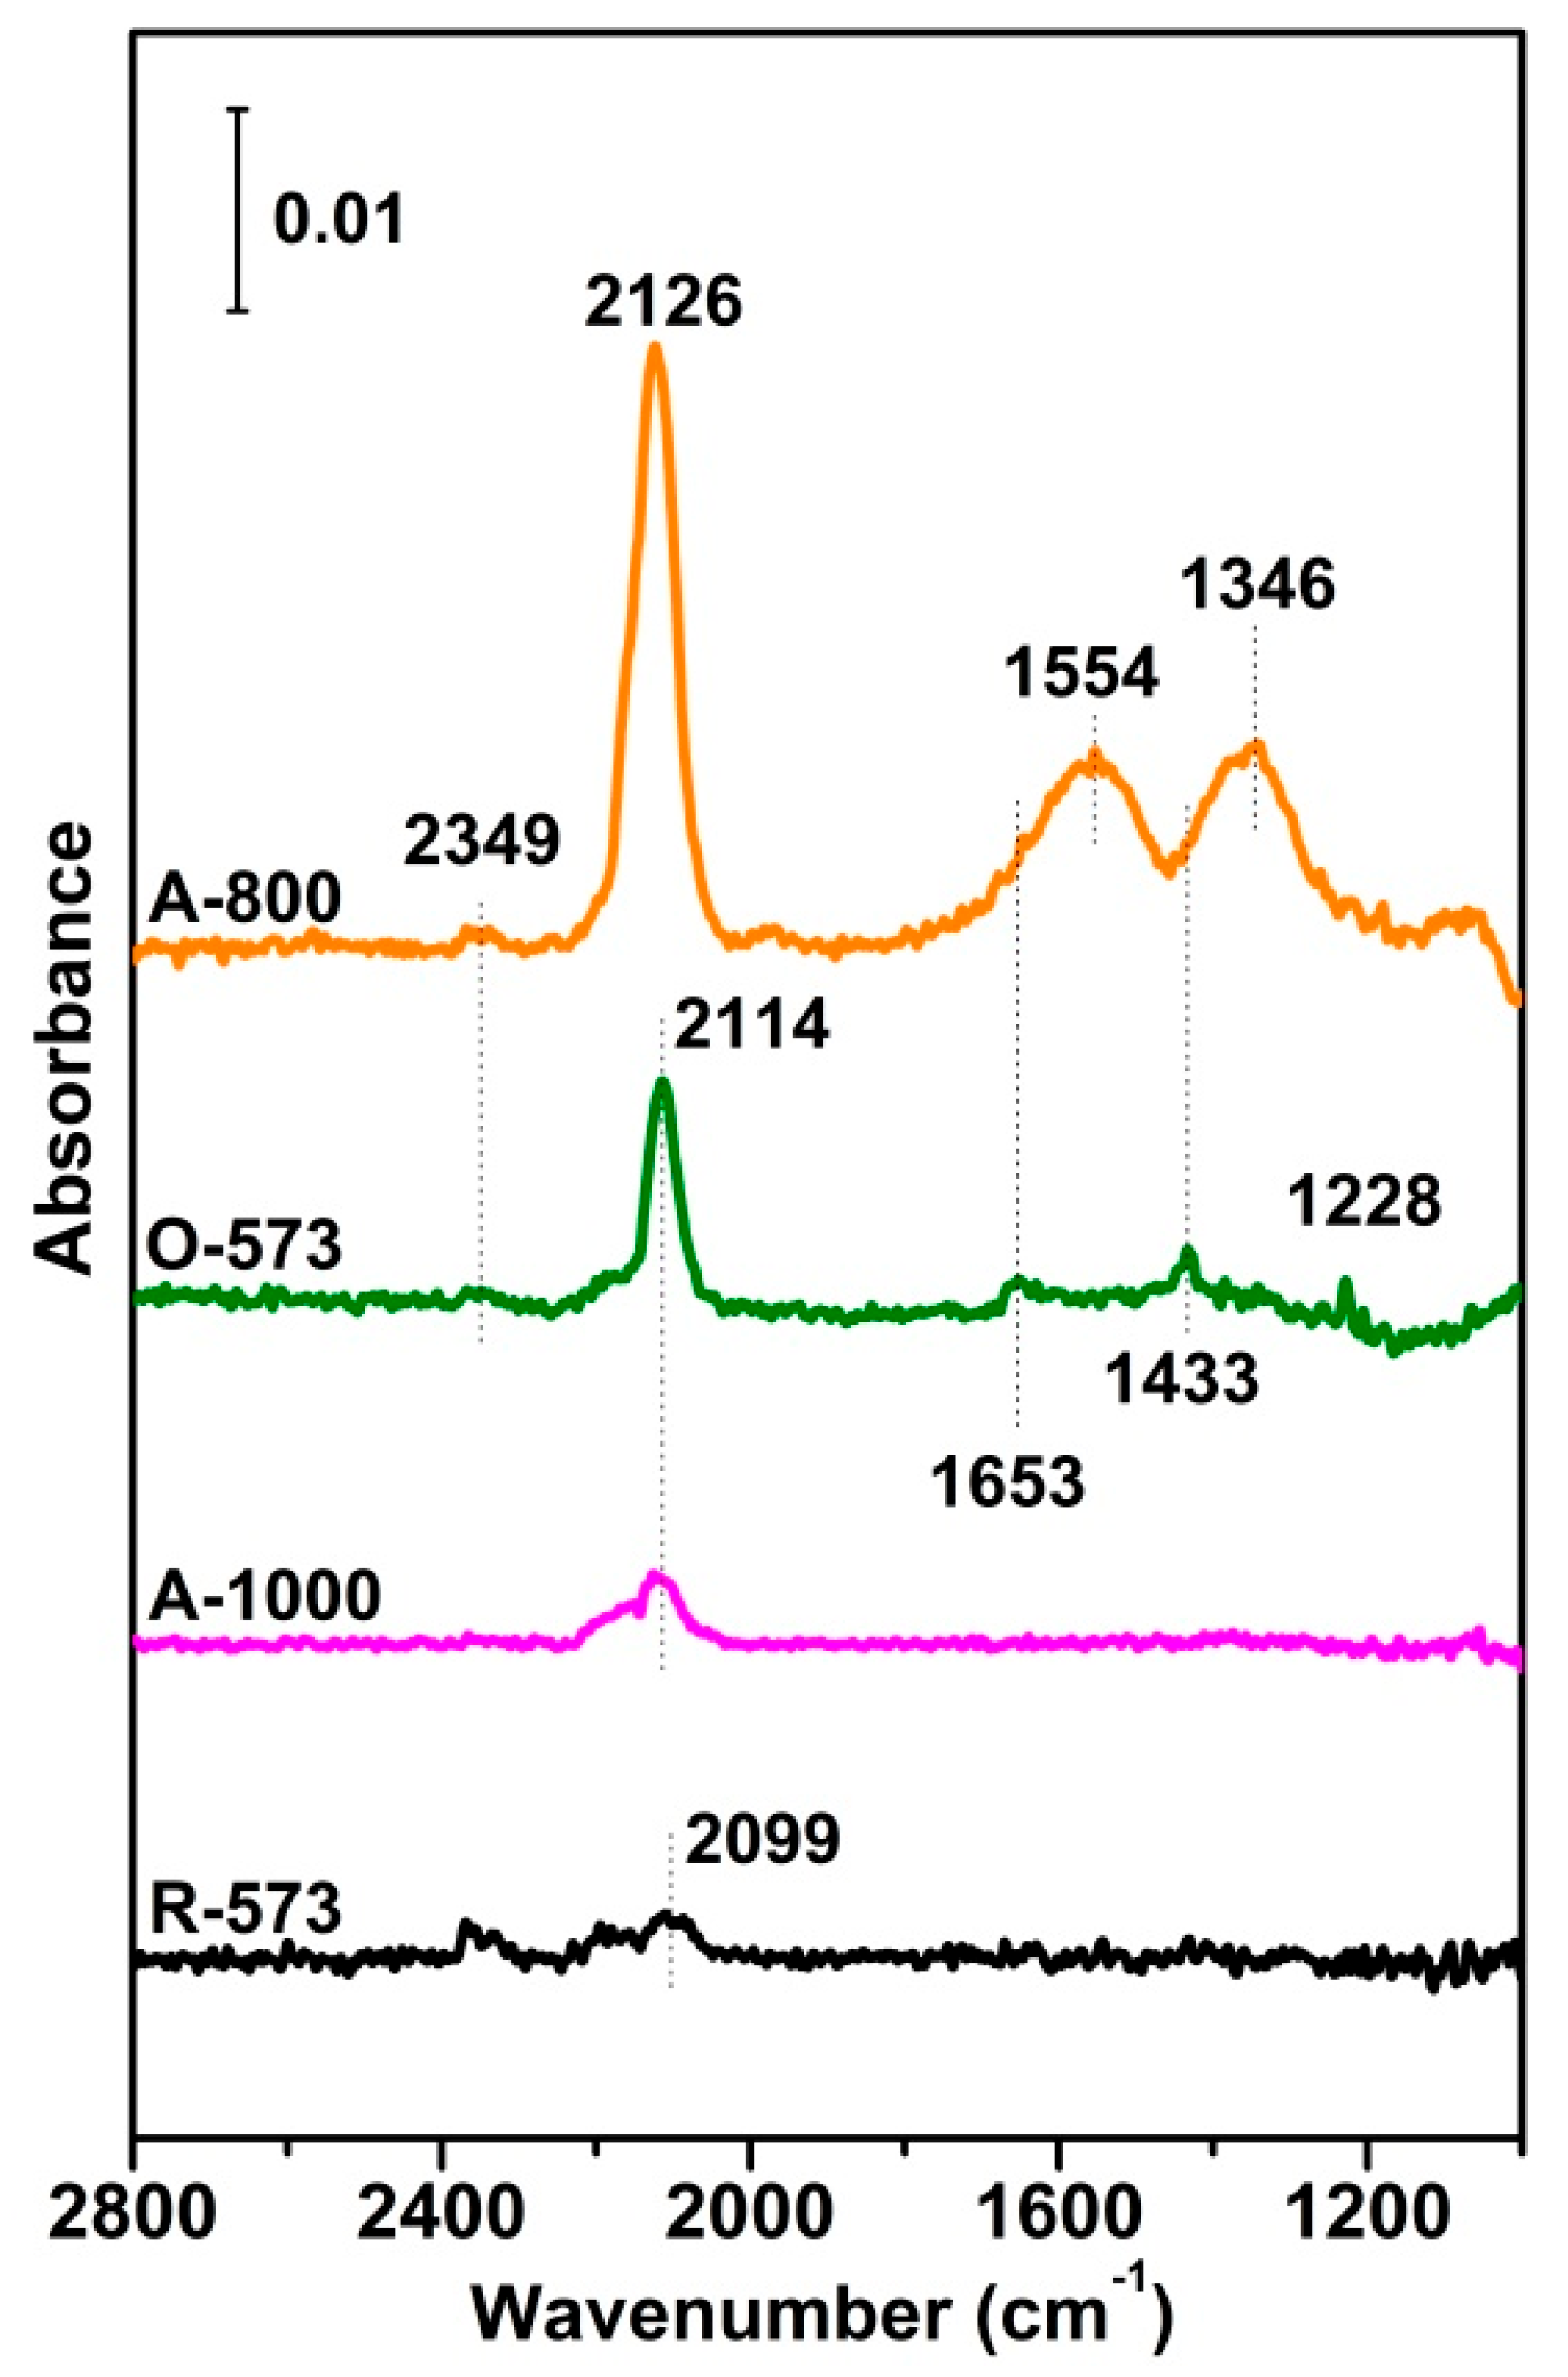
To compare CO adsorption over different CuO states, transmission IR was carried out over four CuOx samples prepared in situ. Due to the relatively weak adsorption strength of CO over the Cu sample, as shown in Figure 3, the in situ IR spectra were measured with 0.4 mbar CO exposure at RT, a pressure chosen to avoid the IR absorption of gas-phase CO. The vibrations of Cu2+-CO, Cu+-CO and Cu0-CO were mainly located at 2200–2140 cm−1, 2140–2100 cm−1, and 2100–2000 cm−1, respectively [47,48,49,50,51], while the bands at 1228 cm−1, 1433 cm−1, and 1653 cm−1 were thought to be the ν(CO3) vibrations [49], though the ν(CO3) vibrations of bidentate and monodentate carbonate species are mainly concentrated at 1346 cm−1 and 1554 cm−1, respectively [52,53,54]. For the fully reduced R-573 sample, only a weak CO band could be observed at around 2099 cm−1, attributed to CO adsorption on small Cu0 particles [50,55,56]. For A-1000, the CO band was blue-shifted to 2114 cm−1 due to the relatively high valence band state of Cu [48]. For the fully oxidized O-573, the 2114 cm−1 peak became intense, with several small peaks presenting at lower wavenumbers, typical features for surface carbonate species. Since CO exposure was carried out in a sealed chamber, it would have been reasonable to speculate that CO may have reacted with the surface oxygen of O-573 to produce CO2 that re-adsorbed onto the surface, forming surface carbonate [57], while the CO bound itself to the Cuδ+ in the new oxygen vacancies. This was confirmed by the spectrum of A-800, where the band of gas-phase CO2 at 2349 cm−1 emerged, and both the CO (2126 cm−1) and carbonate bands increased notably. The trend between O-573 and A-800 also indicated that the presence of surface oxygen may have promoted the reduction of the catalyst surface (i.e., by CO), consistent with the TPR result by H2 (Figure 2). In this situation, the Cuδ+ in the surface oxygen vacancies provided adsorption sites for CO for further reactions. Table S1 and Figure S3 also show that the deconvolution of broad O 1s peaks (O-573, 1-800, and A-1000 samples) divides them into two peaks: the lower-binding-energy peak (530.93–531.29 eV) is related to the lattice oxygen species (Olatt), and the higher-binding-energy peak (531.85–533.23 eV) is assignable to the adsorbed oxygen species in the oxygen vacancies (Ov) [46,58]. The Ov/(Olatt + Ov) value of the A-800 sample is the highest among the four samples, indicating that the oxygen vacancies are most abundant on its surface. The results also show that the amount of oxygen vacancies has a positive correlation with the surface carbonates species, meaning that the presence of the former promotes CO oxidation activities to form more CO2, which is later chemisorbed as the latter [59,60].
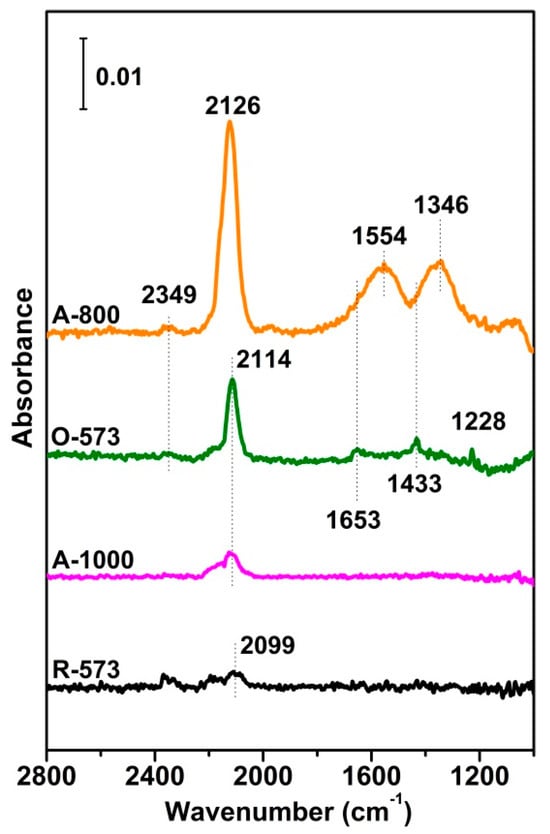
Figure 3.
Transmitted IR spectra of R−573, A−1000, O−573, and A−800 exposed to 0.4 mbar CO at room temperature (RT). For all the measurements, reference spectra were taken on the sample before CO exposure.
To verify the assignment of different IR bands, as shown in Figure 4, a series of IR spectra for CO adsorption were recorded at RT after the fully oxidized CuO samples were annealed at different temperatures, showing that both the CO and carbonate bands varied with the latter. Particularly, the intensity of the CO and carbonate bands varied in the same manner, confirming that CO reacts with the surface oxygen to create CO2 and surface oxygen vacancies. The highest intensity of both bands occurred at 700–800 K. Although higher annealing temperatures facilitate the creation of oxygen vacancies, the phase transformation to Cu2O at a high temperature may work in the opposite direction. In addition, this phase transformation is accompanied by the out-diffusion of oxygen from the bulk of CuO, which may rehabilitate the vacancies, resulting in a decrease in absorption and surface reactions.
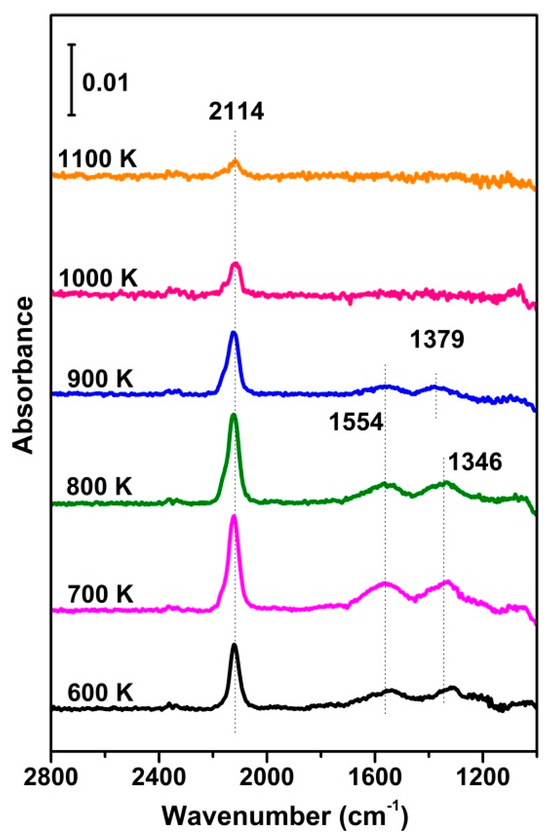
Figure 4.
In situ FTIR results of CO adsorption (0.4 mbar) on vacuum−annealed O−573 at RT, alongside the reference spectrum, taken on O−573.
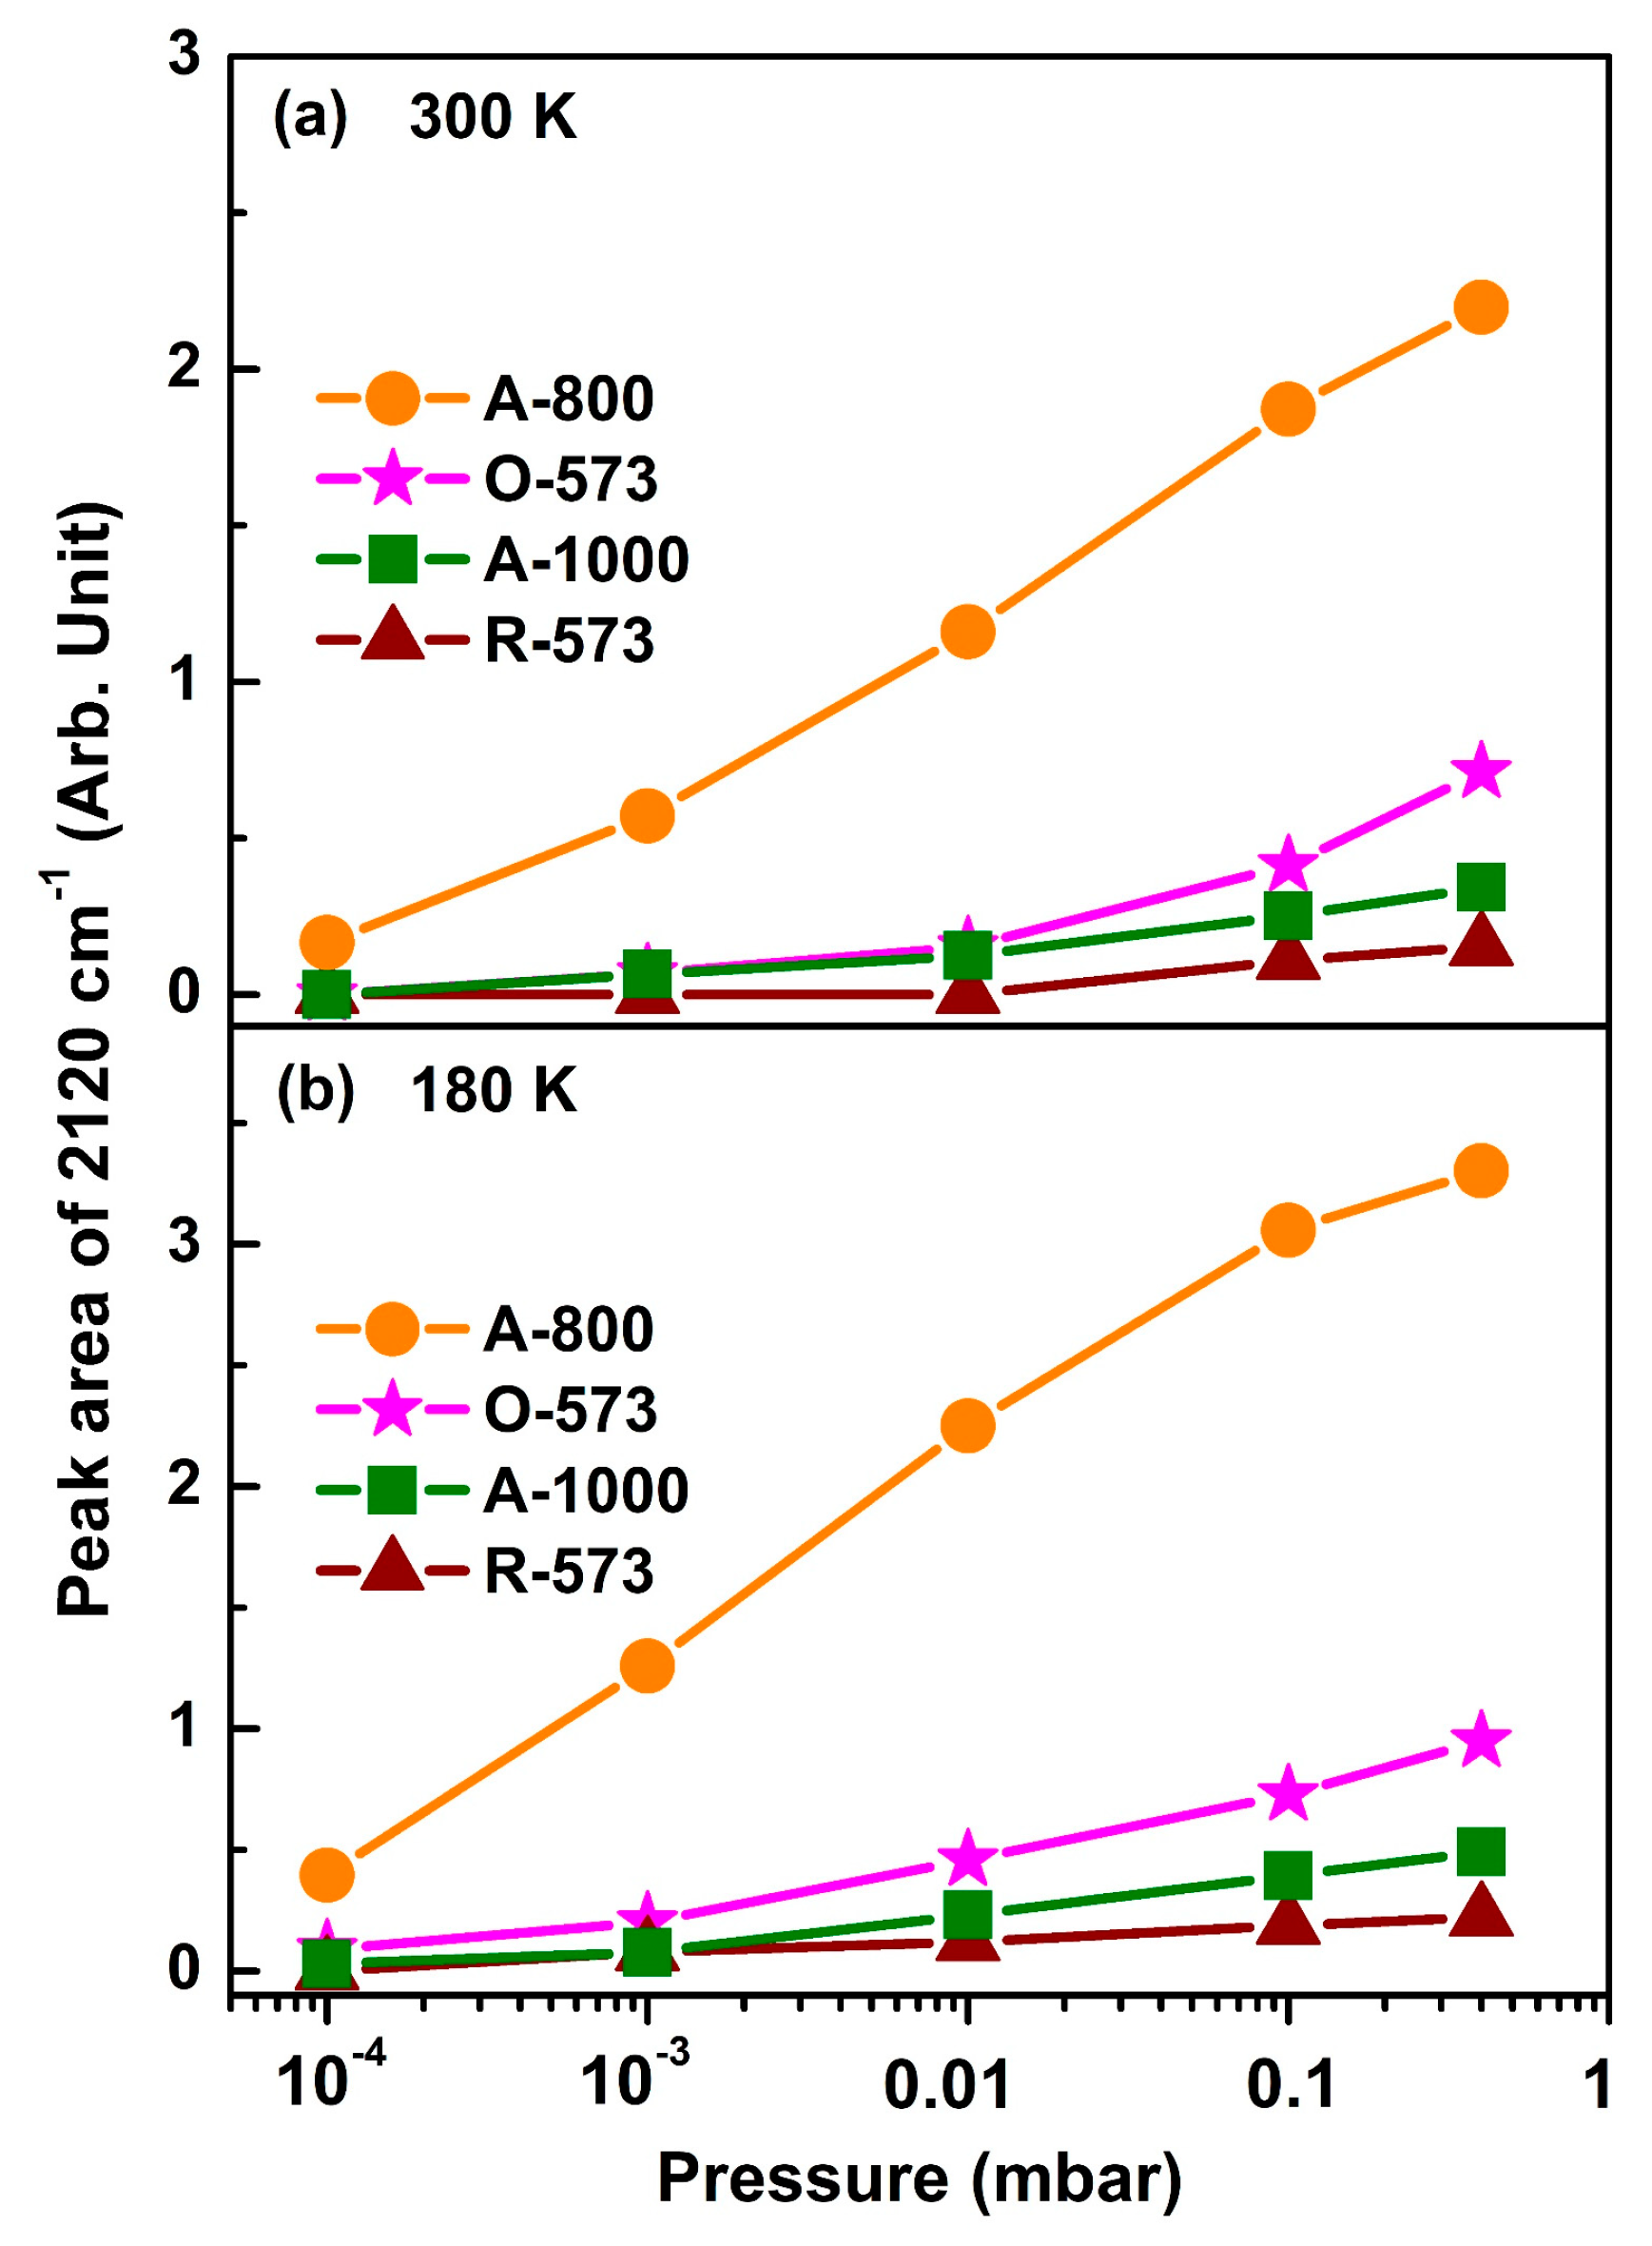
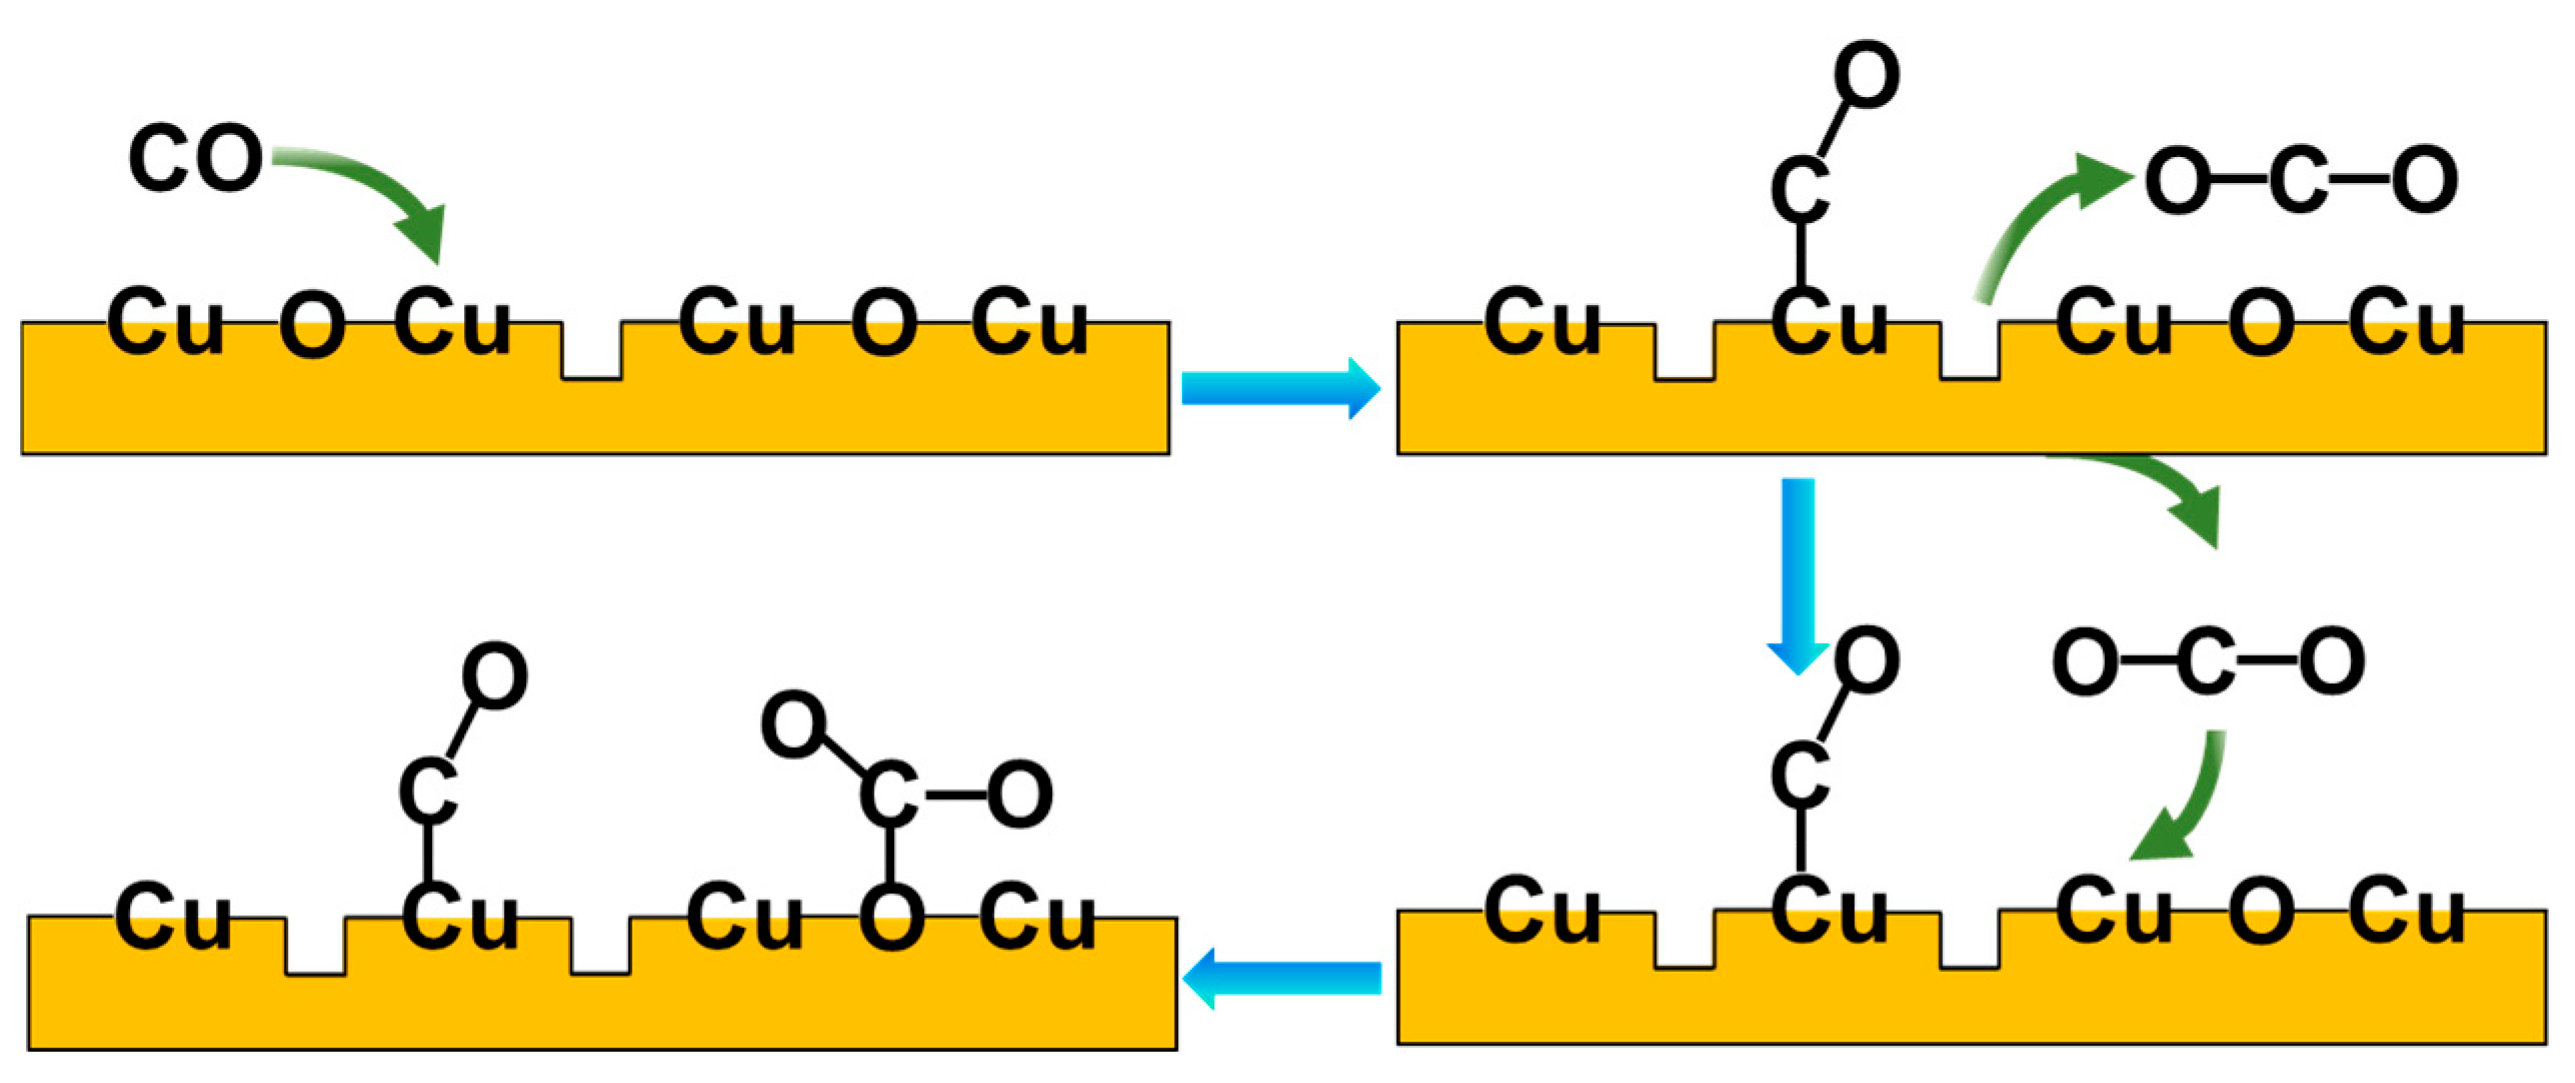
In Figure 5, the peak area of ν(CO) at 2120 cm−1 is plotted as a function of CO pressure at 300 K and 180 K, respectively (with the original spectra shown in Figures S5 and S6). The peak intensity increases since the CO equilibrium coverage increases with elevating CO pressures, while, for O-573 and A-800, the peak intensity is mainly determined by CO-related surface reduction, since the oxygen vacancies are occupied by CO adsorption reactions once created. It can be seen from Figure 5 that, for each CO pressure, the area of ν(CO) follows the following order: A-800 > O-573 > A-1000 > R-573. Accordingly, it can be concluded that the Cuδ+ in the oxygen vacancies on the surface of the A-800 sample had the best CO adsorption capacity. The proposed model of CO adsorption on CuO in the presence of oxygen vacancies (e.g., A-800) is briefly depicted in Figure 6. CO is initially adsorbed onto the Cu sites in the oxygen vacancies, where it may react with surface oxygen to form gas-phase CO2, leaving another oxygen vacancy on the surface, consequently leading to more CO molecules adsorbing onto the Cu sites in these oxygen vacancies. At the same time, the gas-phase CO2 may re-adsorb on the surface, reacting with the surface oxygen to form carbonate. The presence of oxygen vacancies on CuOx is, therefore, proposed to facilitate the creation of more oxygen vacancies and CO adsorption, consequently achieving the best CO adsorption capacity on the surface. We also noticed that the enhancement of CO over A-800 was accompanied by the formation of surface carbonate. Indeed, an increased CO adsorption strength was reported over ZnO, where the formation of surface carbonate was thought to enhance cations’ Lewis acidity and hence increase CO binding [57]. We therefore speculate that a similar enhancement mechanism may exist for CO interacting with Cu-based catalysts. Combined with the XRD results, the crystallite size follows the order of R-573 > A-1000 > O-573, showing the trend opposite to the indicated CO adsorption strength. Moreover, the particle size has a relationship with the CO adsorption strength [61]. Therefore, it is speculated that the crystallite size of the Cu-based catalysts plays an important role in the CO adsorption capacity. However, it is not a determinant factor, according to our investigation. For instance, the A-800 sample had an intermediate crystallite size, but exhibited the best CO adsorption capacity due to the abundance of oxygen vacancies on the A-800 surface (Table S1). Moreover, although the valence state of Cu in the surface oxygen vacancies (e.g., for A-800) was similar to that of Cu2O, they showed quite different adsorption abilities to CO. This means that the adsorption ability and catalytic properties of a certain catalyst are not determined solely by the chemical state of the metal element but also strongly depend on the local surroundings. In terms of reactions, catalysts often undergo dynamic structural or chemical evolution at the initial stage of a reaction (during the activation process), but the correlation between the catalyst’s activity and initial state may vastly deviate from the reality. In this case, studying the initial activation process or carrying out an in situ investigation of the reaction via operando spectroscopy would provide more valuable information.
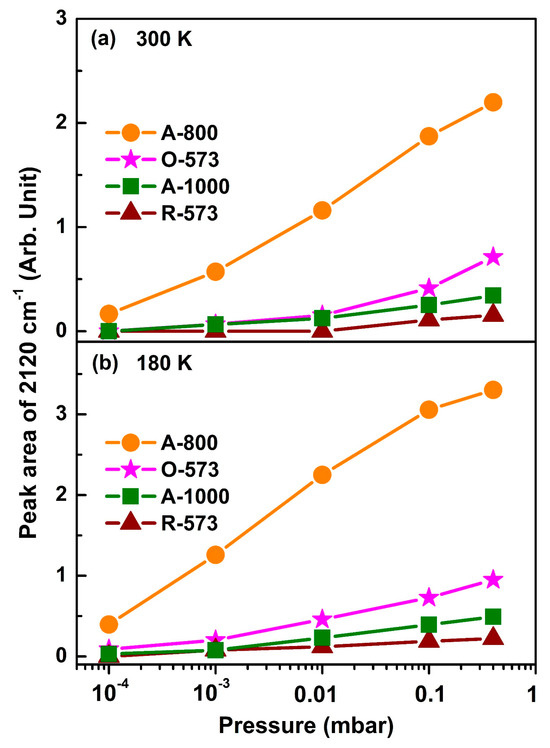
Figure 5.
Plots of the integrated peak area of the CO vibrational band at 2120 cm−1 recorded at (a) 300 K and (b) 180 K as a function of CO pressure.
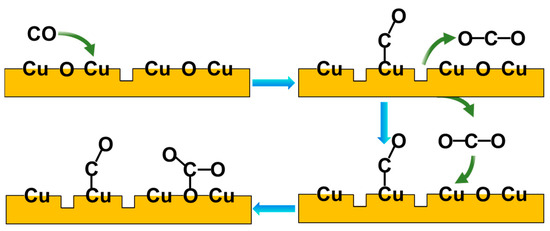
Figure 6.
The proposed model of CO adsorption on CuO in the presence of oxygen vacancies. The blue arrows represent the order of the reaction and the green arrows represent the reactant and product involved in the reaction.
3. Materials and Methods
3.1. Sample Preparation
A total of 2.39 g of commercial Al2O3 (Aladdin, average particle size of 10 nm) and 6.00 g of cupric acetate (C4H6CuO4·H2O, Sinopharm, purity of 99.0%) were separately dispersed in 45 mL of ethanol and stirred for 20 min. The obtained solutions were then mixed and transferred into a Teflon-lined stainless-steel autoclave for a 20 h reaction at 423 K. Subsequently, the precursor was centrifuged and washed several times with deionized water, followed by calcining at 773 K for 60 min (10 K/min) in a muffle furnace. The calcined catalyst was labeled 50 wt% CuOx/Al2O3 (Figure S7). The sample was then put either in the vacuum-transmission infrared spectroscopy (IR) chamber or in the X-ray photoemission spectroscopy (XPS) system’s load-lock chamber for further in situ treatments and characterizations. The sample was pretreated with vacuum annealing at 800 K for 10 min to remove water, carbonate, and organic contaminants. To obtain the fully oxidized Cu state and remove any further contaminants, such as carbon, after annealing, the sample was oxidized at 573 K for 30 min with 100 mbar O2. Meanwhile, to obtain partially reduced CuO and Cu2O, the oxidized sample was annealed in a vacuum to 800 K and 1000 K for 30 min, respectively. Instead, the fully reduced sample was obtained by reducing the oxidized sample with 100 mbar H2 at 573 K for 30 min. For convenient description purposes, the fully oxidized sample, fully reduced sample, partially reduced sample, and Cu2O were named O-573, R-573, A-800, and A-1000, respectively. For the measurement of the specific surface area and temperature-programmed reduction, the samples were prepared in situ using a chemisorption analyzer instrument with a similar process, replacing vacuum annealing with annealing under an Ar environment.
3.2. Characterization Methods
Powder X-ray diffraction (XRD) patterns were acquired on a Bruker D8 ADVANCE with Cu-Kα radiation (40 kV, 40 mA, λ = 1.5404 Å). SEM characterizations were carried out using GeminiSEM 300 (Carl Zeiss AG, Oberkochen, Germany) at an acceleration voltage of 10 kV and a working distance of 5.8 nm. The single-point Brunauer–Emmett–Teller (BET) specific surface area, temperature-programmed reaction (TPR), and temperature-programmed oxidation (TPO) were measured with a gas sorption analyzer instrument (VDsorb-91i, Vodo). The temperature-ramping rate for TPR and TPO was 10 K/min, while the TPD experiments were performed in a custom-designed vacuum system for powder samples and the desorption signal was detected using a differentially pumped mass spectrometer (MS, Pfeiffer, QMG 220). The XPS system was equipped with a hemispherical energy analyzer (Phoibos 150, SPECS GmbH, Berlin, Germany) and an Al/Mg twin-anode X-ray source operated at 15 kV and 300 W. For characterization purposes, an Al Kα X-ray source (hν = 1486.61 eV) was adopted. The CO adsorption behavior on different Cu sample states was investigated with a vacuum-transmission IR spectroscopy chamber, reconstructed from a commercial IR spectrometer (Bruker, Vertex 70 v, Karlsruhe, Germany). The original measurement compartment was replaced with a stainless-steel chamber separated from the IR spectrometer by two KBr windows, described in detail in ref. [42,62]. During this process, an IR beam from the light source in the spectrometer passed through the sample in the IR chamber and was detected by a deuterated L-alanine-doped triglycine sulfate (DLATGS) detector. The base pressure in the spectrometer was over 0.1 mbar, effectively diminishing the influence of H2O and CO2 during measurement, while the base pressure in the IR chamber was ~1 × 10⁻⁷ mbar. A full-range pressure gauge and a capacitance gauge (0.1–1000 mbar) were connected to the chamber to monitor pressure. The prepared CuO sample was first pressed on a stainless-steel grid (100 mesh, 10 mm × 7 mm) at 20 MPa, and then fixed between two molybdenum legs using two tantalum clamps. Sample heating was achieved by applying a voltage between the two legs, with the electrical current flowing through the stainless-steel grid capable of heating the sample up to 1100 K. A K-type thermocouple was welded carefully on top of the grid, in the center. Sample cooling was achieved by introducing liquid nitrogen (LN) through the hollow sample holder. In the current configuration, in situ transmission IR measurements can be performed under vacuum, with gas exposure conditions at variable sample temperatures.
4. Conclusions
Four different Cu states—O-573 (fully oxidized sample), R-573 (fully reduced sample), A-800 (vacuum-annealed sample), and A-1000 (cuprous oxide)—were prepared in situ to directly compare CO adsorption behaviors. Both Cu2O (A-1000) and Cu (R-573) showed a relatively weak adsorption ability towards CO. For the fully oxidized CuO sample (O-573), there was a surface reaction whereby oxygen vacancies were created and CO2 was produced and later re-adsorbed to form surface carbonate. In this scenario, the Cuδ+ in the created oxygen vacancies provided an adsorption site for CO. Meanwhile, for the vacuum-annealed sample (e.g., A-800), the reduction process was notably accelerated by the pre-created oxygen vacancies. This work demonstrates that the Cuδ+ in the surface oxygen vacancies of CuO plays an important role in catalyzing surface oxygen reduction and enhancing CO adsorption strength.
Supplementary Materials
The following supporting information can be downloaded at https://www.mdpi.com/article/10.3390/catal14090578/s1: Figure S1: SEM images of the CuOx samples prepared in situ: (a) O-573; (b) R-573; (c) A-800; and (d) A-1000. Figure S2: In situ O-573 FTIR spectra with 800 K annealing, reduction at 573 K, and oxidation at 573 K, (a) taken on the sample at room temperature and (b) vacuum-annealed O-573 at a 10 K/min heating rate. Figure S3: XPS spectra for the O-573, A-800, A-1000, and R-573 samples: (a) Cu 2p and (b) O 1s. The O 1s curves were fitted into two or three peaks using a Lorentzian Asymmetric (LA) (1.53, 2.43) line shape. The binding energies were calibrated using the contaminant carbon species (C1 s) at 284.6 eV. All spectra were acquired at RT. Figure S4: O2-TPO profile of the R-573 sample under the following conditions: gas, 10% O2/Ar and 50 SCCM; catalyst weight, 100 mg; and heating rate, 10 K/min. Figure S5: In situ transmitted IR spectra of R-573, A-1000, O-573, and A-800 after exposure to different CO pressures, gradually varied from 10−4 to 0.4 mbar, at room temperature (RT). For all the measurements, reference spectra were taken on the samples before CO exposure. Figure S6: In situ transmitted IR spectra of R-573, A-1000, O-573, and A-800 after exposure to different CO pressures, gradually varied from 10−4 to 0.4 mbar, at 180 K. For all the measurements, reference spectra were taken on the samples before CO exposure. Figure S7: Schematic diagram of the CuOx/Al2O3 samples’ synthesis process and CO adsorption over CuOx prepared in situ. Table S1: XPS peaks’ fitting results of O 1s for the O-573, A-800, A-1000, and R-573 samples.
Author Contributions
Conceptualization, Y.Z., X.W. and H.Q.; methodology, Y.Z., Y.L. and R.Z.; validation, Y.Z., X.W. and H.Q.; formal analysis, Y.Z., B.L., X.W. and H.Q.; investigation, Y.Z., Y.L. and R.Z.; data curation, Y.Z., Y.L., R.Z. and B.L.; writing—original draft preparation, Y.Z.; writing—review and editing, X.W. and H.Q.; supervision, H.Q.; funding acquisition, H.Q. All authors have read and agreed to the published version of the manuscript.
Funding
This research was funded by the National Natural Science Foundation of China, with grant number 21972128.
Data Availability Statement
Data are contained within the article and Supplementary Materials.
Acknowledgments
We thank Shuzhuang Sun for carefully reading the manuscript and initiating fruitful discussions.
Conflicts of Interest
The authors declare no conflicts of interest.
References
- Swallow, J.E.N.; Jones, E.S.; Head, A.R.; Gibson, J.S.; David, R.B.; Fraser, M.W.; van Spronsen, M.A.; Xu, S.; Held, G.; Eren, B.; et al. Revealing the role of CO during CO2 hydrogenation on Cu surfaces with in situ soft X-ray spectroscopy. J. Am. Chem. Soc. 2023, 145, 6730–6740. [Google Scholar] [CrossRef]
- Yang, M.; Yu, J.; Zimina, A.; Sarma, B.B.; Pandit, L.; Grunwaldt, J.D.; Zhang, L.; Xu, H.; Sun, J. Probing the nature of zinc in copper-zinc-zirconium catalysts by operando spectroscopies for CO2 hydrogenation to methanol. Angew. Chem.-Int. Ed. 2023, 62, e202216803. [Google Scholar] [CrossRef] [PubMed]
- Kuld, S.; Thorhauge, M.; Falsig, H.; Elkjær, C.F.; Helveg, S.; Chorkendorff, I.; Sehested, J. Quantifying the promotion of Cu catalysts by ZnO for methanol synthesis. Science 2016, 352, 969–975. [Google Scholar] [CrossRef] [PubMed]
- Sun, J.; Liu, F.; Salahuddin, U.; Wu, M.; Zhu, C.; Lu, X.; Zhang, B.; Zhao, B.; Xie, Z.; Ding, Y.; et al. Optimization and understanding of ZnO nanoarray supported Cu-ZnO-Al2O3 catalyst for enhanced CO2-methanol conversion at low temperature and pressure. Chem. Eng. J. 2023, 455, 140559–140569. [Google Scholar] [CrossRef]
- Zhang, Z.; Cheng, S.; Liu, W.; Chen, B.; Gao, X.; Wang, P.; Gao, J.; Tan, Y.; Dang, S.; Tu, W. Unraveling the regulation of Mn in Cu-ZnOx formation during methanol synthesis from syngas over Cu/ZnO/Al2O3-Mn catalysts. Appl. Catal. B-Environ. 2023, 338, 122985–122998. [Google Scholar] [CrossRef]
- Bahmani, M.; Farahani, B.V.; Sahebdelfar, S. Preparation of high performance nano-sized Cu/ZnO/Al2O3 methanol synthesis catalyst via aluminum hydrous oxide sol. Appl. Catal. A-Gen. 2016, 520, 178–187. [Google Scholar] [CrossRef]
- Wang, J.; Song, Y.; Li, J.; Liu, F.; Wang, J.; Lv, J.; Wang, S.; Li, M.; Bao, X.; Ma, X. Modulation of Al2O3 and ZrO2 composite in Cu/ZnO-based catalysts with enhanced performance for CO2 hydrogenation to methanol. Appl. Catal. A-Gen. 2024, 674, 119618–119627. [Google Scholar] [CrossRef]
- Zhang, Z.; Chen, X.; Kang, J.; Yu, Z.; Tian, J.; Gong, Z.; Jia, A.; You, R.; Qian, K.; He, S.; et al. The active sites of Cu-ZnO catalysts for water gas shift and CO hydrogenation reactions. Nat. Commun. 2021, 12, 4331–4339. [Google Scholar] [CrossRef]
- Phey, M.L.P.; Abdullah, T.A.T.; Ali, U.F.M.; Mohamud, M.Y.; Ikram, M.; Nabgan, W. Reverse water gas shift reaction over a Cu/ZnO catalyst supported on regenerated spent bleaching earth (RSBE) in a slurry reactor: The effect of the Cu/Zn ratio on the catalytic activity. RSC Adv. 2023, 13, 3039–3055. [Google Scholar] [CrossRef]
- Stone, F.S.; Waller, D. Cu-ZnO and Cu-ZnO/Al2O3 catalysts for the reverse water-gas shift reaction. The effect of the Cu/Zn ratio on precursor characteristics and on the activity of the derived catalysts. Top. Catal. 2003, 22, 305–318. [Google Scholar] [CrossRef]
- Galván, C.Á.; Schumann, J.; Behrens, M.; Fierro, J.L.G.; Schlögl, R.; Frei, E. Reverse water-gas shift reaction at the Cu/ZnO interface: Influence of the Cu/Zn ratio on structure-activity correlations. Appl. Catal. B-Environ. 2016, 195, 104–111. [Google Scholar] [CrossRef]
- Liu, X.; Piscina, P.R.d.l.; Toyir, J.; Homs, N. CO2 reduction over Cu-ZnGaMO (M = Al, Zr) catalysts prepared by a sol-gel method: Unique performance for the RWGS reaction. Catal. Today 2017, 296, 181–186. [Google Scholar] [CrossRef]
- Shi, Y.; Xu, L.; Chen, M.; Yang, B.; Cheng, G.; Wu, C.; Miao, Z.; Wang, N.; Hu, X. Fabricating Cu2O-CuO submicron-cubes for efficient catalytic CO oxidation: The significant effect of heterojunction interface. J. Ind. Eng. Chem. 2022, 105, 324–336. [Google Scholar] [CrossRef]
- Meng, M.; Liu, Y.; Sun, Z.; Zhang, L.; Wang, X. Synthesis of highly-dispersed CuO-CeO2 catalyst through a chemisorption-hydrolysis route for CO preferential oxidation in H2-rich stream. Int. J. Hydrogen Energy 2012, 37, 14133–14142. [Google Scholar] [CrossRef]
- Cruz, A.R.M.; Assaf, E.M.; Gomes, J.F.; Assaf, J.M. Active copper species of co-precipitated copper-ceria catalysts in the CO-PROX reaction: An in situ XANES and DRIFTS study. Catal. Today 2021, 381, 42–49. [Google Scholar] [CrossRef]
- Wang, Q.; Gong, J.; Zhang, H.; Fan, Q.; Xue, L.; Wu, J.; Li, J.; Wang, Y.; Liu, Z.; Gao, R.; et al. Co-promotion of two-type active sites: PtCu single-atom alloy and copper-ceria interface for preferential oxidation of CO. Appl. Catal. B-Environ. 2022, 306, 121117–121128. [Google Scholar] [CrossRef]
- Chagas, C.A.; Schmal, M. The effect of copper oxide on the CuO-NiO/CeO2 structure and its influence on the CO-PROX reaction. Int. J. Hydrogen Energy 2022, 47, 8858–8866. [Google Scholar] [CrossRef]
- Avgouropoulos, G.; Ioannides, T. Selective CO oxidation over CuO-CeO2 catalysts prepared via the urea-nitrate combustion method. Appl. Catal. A-Gen. 2003, 244, 155–167. [Google Scholar] [CrossRef]
- Wan, H.; Li, D.; Dai, Y.; Hu, Y.; Zhang, Y.; Liu, L.; Zhao, B.; Liu, B.; Sun, K.; Dong, L.; et al. Effect of CO pretreatment on the performance of CuO/CeO2/γ-Al2O3 catalysts in CO+O2 reactions. Appl. Catal. A-Gen. 2009, 360, 26–32. [Google Scholar] [CrossRef]
- Zhong, J.; Yang, X.; Wu, Z.; Liang, B.; Huang, Y.; Zhang, T. State of the art and perspectives in heterogeneous catalysis of CO2 hydrogenation to methanol. Chem. Soc. Rev. 2020, 49, 1385–1413. [Google Scholar] [CrossRef]
- Natesakhawat, S.; Lekse, J.W.; Baltrus, J.P.; Ohodnicki, P.R., Jr.; Howard, B.H.; Deng, X.; Matranga, C. Active sites and structure-activity relationships of copper-based catalysts for carbon dioxide hydrogenation to methanol. ACS Catal. 2012, 2, 1667–1676. [Google Scholar] [CrossRef]
- Hu, J.; Li, Y.; Zhen, Y.; Chen, M.; Wan, H. In situ FTIR and ex situ XPS/HS-LEIS study of supported Cu/Al2O3 and Cu/ZnO catalysts for CO2 hydrogenation. Chin. J. Catal. 2021, 42, 367–375. [Google Scholar] [CrossRef]
- Laudenschleger, D.; Ruland, H.; Muhler, M. Identifying the nature of the active sites in methanol synthesis over Cu/ZnO/Al2O3 catalysts. Nat. Commun. 2020, 11, 3898–3907. [Google Scholar] [CrossRef] [PubMed]
- Szanyi, J.; Goodman, D.W. Methanol synthesis on a Cu(100) catalyst. Catal. Lett. 1991, 10, 383–390. [Google Scholar] [CrossRef]
- Kattel, S.; Ramírez, P.; Chen, J.; Rodriguez, J.; Liu, P. Active sites for CO2 hydrogenation tomethanol on CuZnO catalysts. Science 2017, 355, 1296–1299. [Google Scholar] [CrossRef] [PubMed]
- Chinchen, G.; Spencer, M.; Waught, K.; Whan, D. Promotion of methanol synthesis and the water-gas shift reactions by adsorbed oxygen on supported copper catalysts. J. Chem. Soc. Faraday Trans. 1987, 83, 2193–2212. [Google Scholar] [CrossRef]
- Schott, V.; Oberhofer, H.; Birkner, A.; Xu, M.; Wang, Y.; Muhler, M.; Reuter, K.; Wöll, C. Chemical activity of thin oxide layers: Strong interactions with the support yield a new thin-film phase of ZnO. Angew. Chem.-Int. Ed. 2013, 52, 11925–11929. [Google Scholar] [CrossRef]
- Wang, Z.; Xu, Z.; Peng, S.; Zhang, M.; Lu, G.; Chen, Q.; Chen, Y.; Guo, G. High-performance and long-lived Cu/SiO2 nanocatalyst for CO2 hydrogenation. ACS Catal. 2015, 5, 4255–4259. [Google Scholar] [CrossRef]
- Kamsuwan, T.; Krutpijit, C.; Praserthdam, S.; Phatanasri, S.; Jongsomjit, B.; Praserthdam, P. Comparative study on the effect of different copper loading on catalytic behaviors and activity of Cu/ZnO/Al2O3 catalysts toward CO and CO2 hydrogenation. Heliyon 2021, 7, e07682–e07691. [Google Scholar] [CrossRef]
- Jung, K.T.; Bell, A.T. Effects of zirconia phase on the synthesis of methanol over zirconia-supported copper. Catal. Lett. 2002, 80, 63–68. [Google Scholar] [CrossRef]
- Rhodes, M.D.; Pokrovski, K.A.; Bell, A.T. The effects of zirconia morphology on methanol synthesis from CO and H2 over Cu/ZrO2 catalysts Part II. Transient-response infrared studies. J. Catal. 2005, 233, 210–220. [Google Scholar] [CrossRef]
- Rhodes, M.D.; Bell, A.T. The effects of zirconia morphology on methanol synthesis from CO and H2 over Cu/ZrO2 catalysts Part I. Steady-state studies. J. Catal. 2005, 233, 198–209. [Google Scholar] [CrossRef]
- Liu, Y.; Liu, J.; Liu, S.; Li, J.; Gao, Z.; Zuo, Z.; Huang, W. Reaction mechanisms of methanol synthesis from CO/CO2 hydrogenation on Cu2O(111): Comparison with Cu(111). J. CO2 Util. 2017, 20, 59–65. [Google Scholar] [CrossRef]
- Amorim, R.; Batista, K.; Nagurniak, G.; Orenha, R.; Parreira, R.; Piotrowski, M. CO, NO, and SO adsorption on Ni nanoclusters: A DFT investigation. Dalton Trans. 2020, 49, 6407–6417. [Google Scholar] [CrossRef]
- Nagarajan, V.; Chandiramouli, R. A DFT study on adsorption behaviour of CO on Co3O4 nanostructures. Appl. Surf. Sci. 2016, 385, 113–121. [Google Scholar] [CrossRef]
- Rochana, P.; Wilcox, J. A theoretical study of CO adsorption on FeCo(100) and the effect of alloying. Surf. Sci. 2011, 605, 681–688. [Google Scholar] [CrossRef]
- Hammer, B.; Morikawa, Y.; Nørskov, J. CO chemisorption at metal surfaces and overlayers. Phys. Rev. Lett. 1996, 76, 2141–2144. [Google Scholar] [CrossRef]
- Hammer, B.; Nørskov, J. Theoretical surface science and catalysis-calculations and concepts. Adv. Catal. 2000, 45, 71–129. [Google Scholar]
- Ai, X.; Xie, H.; Chen, S.; Zhang, G.; Xu, B.; Zhou, G. Highly dispersed mesoporous Cu/γ-Al2O3 catalyst for RWGS reaction. Int. J. Hydrogen Energy 2022, 47, 14884–14895. [Google Scholar] [CrossRef]
- Miao, C.; Zhou, G.; Chen, S.; Xie, H.; Zhang, X. Synergistic effects between Cu and Ni species in NiCu/γ-Al2O3 catalysts for hydrodeoxygenation of methyl laurate. Renew. Energy 2020, 153, 1439–1454. [Google Scholar] [CrossRef]
- Noei, H.; Qiu, H.; Wang, Y.; Muhler, M.; Wöll, C. Hydrogen loading of oxide powder particles: A transmission IR study for the case of zinc oxide. ChemPhysChem 2010, 11, 3604–3607. [Google Scholar] [CrossRef] [PubMed]
- Wang, X.; Lu, B.; Li, L.; Qiu, H. Exploring the interactions of oxygen with defective ZnO. ChemistryOpen 2018, 7, 491–494. [Google Scholar] [CrossRef] [PubMed]
- Wan, H.; Wang, Z.; Zhu, J.; Li, X.; Liu, B.; Gao, F.; Dong, L.; Chen, Y. Influence of CO pretreatment on the activities of CuO/γ-Al2O3 catalysts in CO+O2 reaction. Appl. Catal. B-Environ. 2008, 79, 254–261. [Google Scholar] [CrossRef]
- Xie, Z.; Hei, J.; Cheng, L.; Li, J.; Yin, X.; Meng, S. Influence of Cu/Al ratio on the performance of carbon-supported Cu/ZnO/Al2O3 catalysts for CO2 hydrogenation to methanol. Catalysts 2023, 13, 800. [Google Scholar] [CrossRef]
- Jiang, L.; Zhu, H.; Razzaq, R.; Zhu, M.; Li, C.; Li, Z. Effect of zirconium addition on the structure and properties of CuO/CeO2 catalysts for high-temperature water-gas shift in an IGCC system. Int. J. Hydrogen Energy 2012, 37, 15914–15924. [Google Scholar] [CrossRef]
- Wang, L.; Peng, H.; Shi, S.; Hu, Z.; Zhang, B.; Ding, S.; Wang, S.; Chen, C. Metal-organic framework derived hollow CuO/CeO2 nano-sphere: To expose more highly dispersed Cu-O-Ce interface for enhancing preferential CO oxidation. Appl. Surf. Sci. 2022, 573, 151611–151622. [Google Scholar] [CrossRef]
- Ding, J.; Geng, Z.; Li, L.; Wang, Y.; Zuo, Y.; Li, H.; Yang, M.; Li, G. Migration of cations in layered oxides for creating a highly active interface toward CO preferential oxidation. J. Mater. Chem. A 2021, 9, 12623–12635. [Google Scholar] [CrossRef]
- Kydd, R.; Ferri, D.; Hug, P.; Scott, J.; Teoh, W.Y.; Amal, R. Temperature-induced evolution of reaction sites and mechanisms during preferential oxidation of CO. J. Catal. 2011, 277, 64–71. [Google Scholar] [CrossRef]
- Sharma, S.K.; Paul, B.; Pal, R.S.; Bhanja, P.; Banerjee, A.; Samanta, C.; Bal, R. Influence of Indium as a promoter on the stability and selectivity of the nanocrystalline Cu/CeO2 catalyst for CO2 hydrogenation to methanol. ACS Appl. Mater. Interfaces 2021, 13, 28201–28213. [Google Scholar] [CrossRef]
- Manzoli, M.; Monte, R.D.; Boccuzzi, F.; Coluccia, S.; Kaspar, J. CO oxidation over CuOx-CeO2-ZrO2 catalysts: Transient behaviour and role of copper clusters in contact with ceria. Appl. Catal. B-Environ. 2005, 61, 192–205. [Google Scholar] [CrossRef]
- Li, F.; Zhao, B.; Tan, Y.; Chen, W.; Tian, M. Preparation of Al2O3-CeO2 by hydrothermal method supporting copper oxide for the catalytic oxidation of CO and C3H8. Ind. Eng. Chem. Res. 2022, 61, 4739–4751. [Google Scholar] [CrossRef]
- Wang, W.; Qu, Z.; Song, L.; Fu, Q. CO2 hydrogenation to methanol over Cu/CeO2 and Cu/ZrO2 catalysts: Tuning methanol selectivity via metal-support interaction. J. Energy Chem. 2020, 40, 22–30. [Google Scholar] [CrossRef]
- Pokrovski, K.; Jung, K.T.; Bell, A.T. Investigation of CO and CO2 adsorption on tetragonal and monoclinic zirconia. Langmuir 2001, 17, 4297–4303. [Google Scholar] [CrossRef]
- Bando, K.; Sayama, K.; Kusama, H.; Okabe, K.; Arakawa, H. In-situ FT-IR study on CO2 hydrogenation over Cu catalysts supported on SiO2, Al2O3, and TiO2. Appl. Catal. A-Gen. 1997, 165, 391–409. [Google Scholar] [CrossRef]
- Baber, A.; Xu, F.; Dvorak, F.; Mudiyanselage, K.; Soldemo, M.; Weissenrieder, J.; Senanayake, S.; Sadowski, J.; Rodriguez, J.; Matolín, V.; et al. In situ imaging of Cu2O under reducing conditions: Formation of metallic fronts by mass transfer. J. Am. Chem. Soc. 2013, 135, 16781–16784. [Google Scholar] [CrossRef]
- Dandekar, A.; Vannice, M. Determination of the dispersion and surface oxidation states of supported Cu catalysts. J. Catal. 1998, 178, 621–639. [Google Scholar] [CrossRef]
- Wang, Y.; Kováčik, R.; Meyer, B.; Kotsis, K.; Stodt, D.; Staemmler, V.; Qiu, H.; Traeger, F.; Langenberg, D.; Muhler, M.; et al. CO2 activation by ZnO through the formation of an unusual tridentate surface carbonate. Angew. Chem.-Int. Ed. 2007, 46, 5624–5627. [Google Scholar] [CrossRef]
- Zhang, G.; Fan, G.; Zheng, L.; Li, F. Ga-promoted CuCo-based catalysts for efficient CO2 hydrogenation to ethanol: The key synergistic role of Cu-CoGaOx interfacial sites. ACS Appl. Mater. Interfaces 2022, 14, 35569–35580. [Google Scholar] [CrossRef]
- Ren, Z.; Peng, F.; Li, J.; Liang, X.; Chen, B. Morphology-dependent properties of Cu/CeO2 catalysts for the water-gas shift reaction. Catalysts 2017, 7, 48. [Google Scholar] [CrossRef]
- Zhang, X.; Li, G.; Tian, R.; Feng, W.; Wen, L. Monolithic porous CuO/CeO2 nanorod composites prepared by dealloying for CO catalytic oxidation. J. Alloy. Compd. 2020, 826, 154149. [Google Scholar] [CrossRef]
- Mendes, P.; Ocampo-Restrepo, V.; Silva, J. Ab initioinvestigation of quantum size effects on the adsorption of CO2, CO, H2O, and H2 on transition-metal particles. Phys. Chem. Chem. Phys. 2020, 22, 8998–9008. [Google Scholar] [CrossRef] [PubMed]
- Du, Y.; Li, L.; Wang, X.; Qiu, H. A newly designed infrared reflection absorption spectroscopy system for in situ characterization from ultrahigh vacuum to ambient pressure. Appl. Spectrosc. 2017, 72, 122–128. [Google Scholar] [CrossRef] [PubMed]

Disclaimer/Publisher’s Note: The statements, opinions and data contained in all publications are solely those of the individual author(s) and contributor(s) and not of MDPI and/or the editor(s). MDPI and/or the editor(s) disclaim responsibility for any injury to people or property resulting from any ideas, methods, instructions or products referred to in the content. |
© 2024 by the authors. Licensee MDPI, Basel, Switzerland. This article is an open access article distributed under the terms and conditions of the Creative Commons Attribution (CC BY) license (https://creativecommons.org/licenses/by/4.0/).