
Preparation of Bi@Ho3+:TiO2/Composite Fiber Photocatalytic Materials and Hydrogen Production via Visible Light Decomposition of Water
Abstract
:1. Introduction
2. Results and Discussion
2.1. XRD Analysis
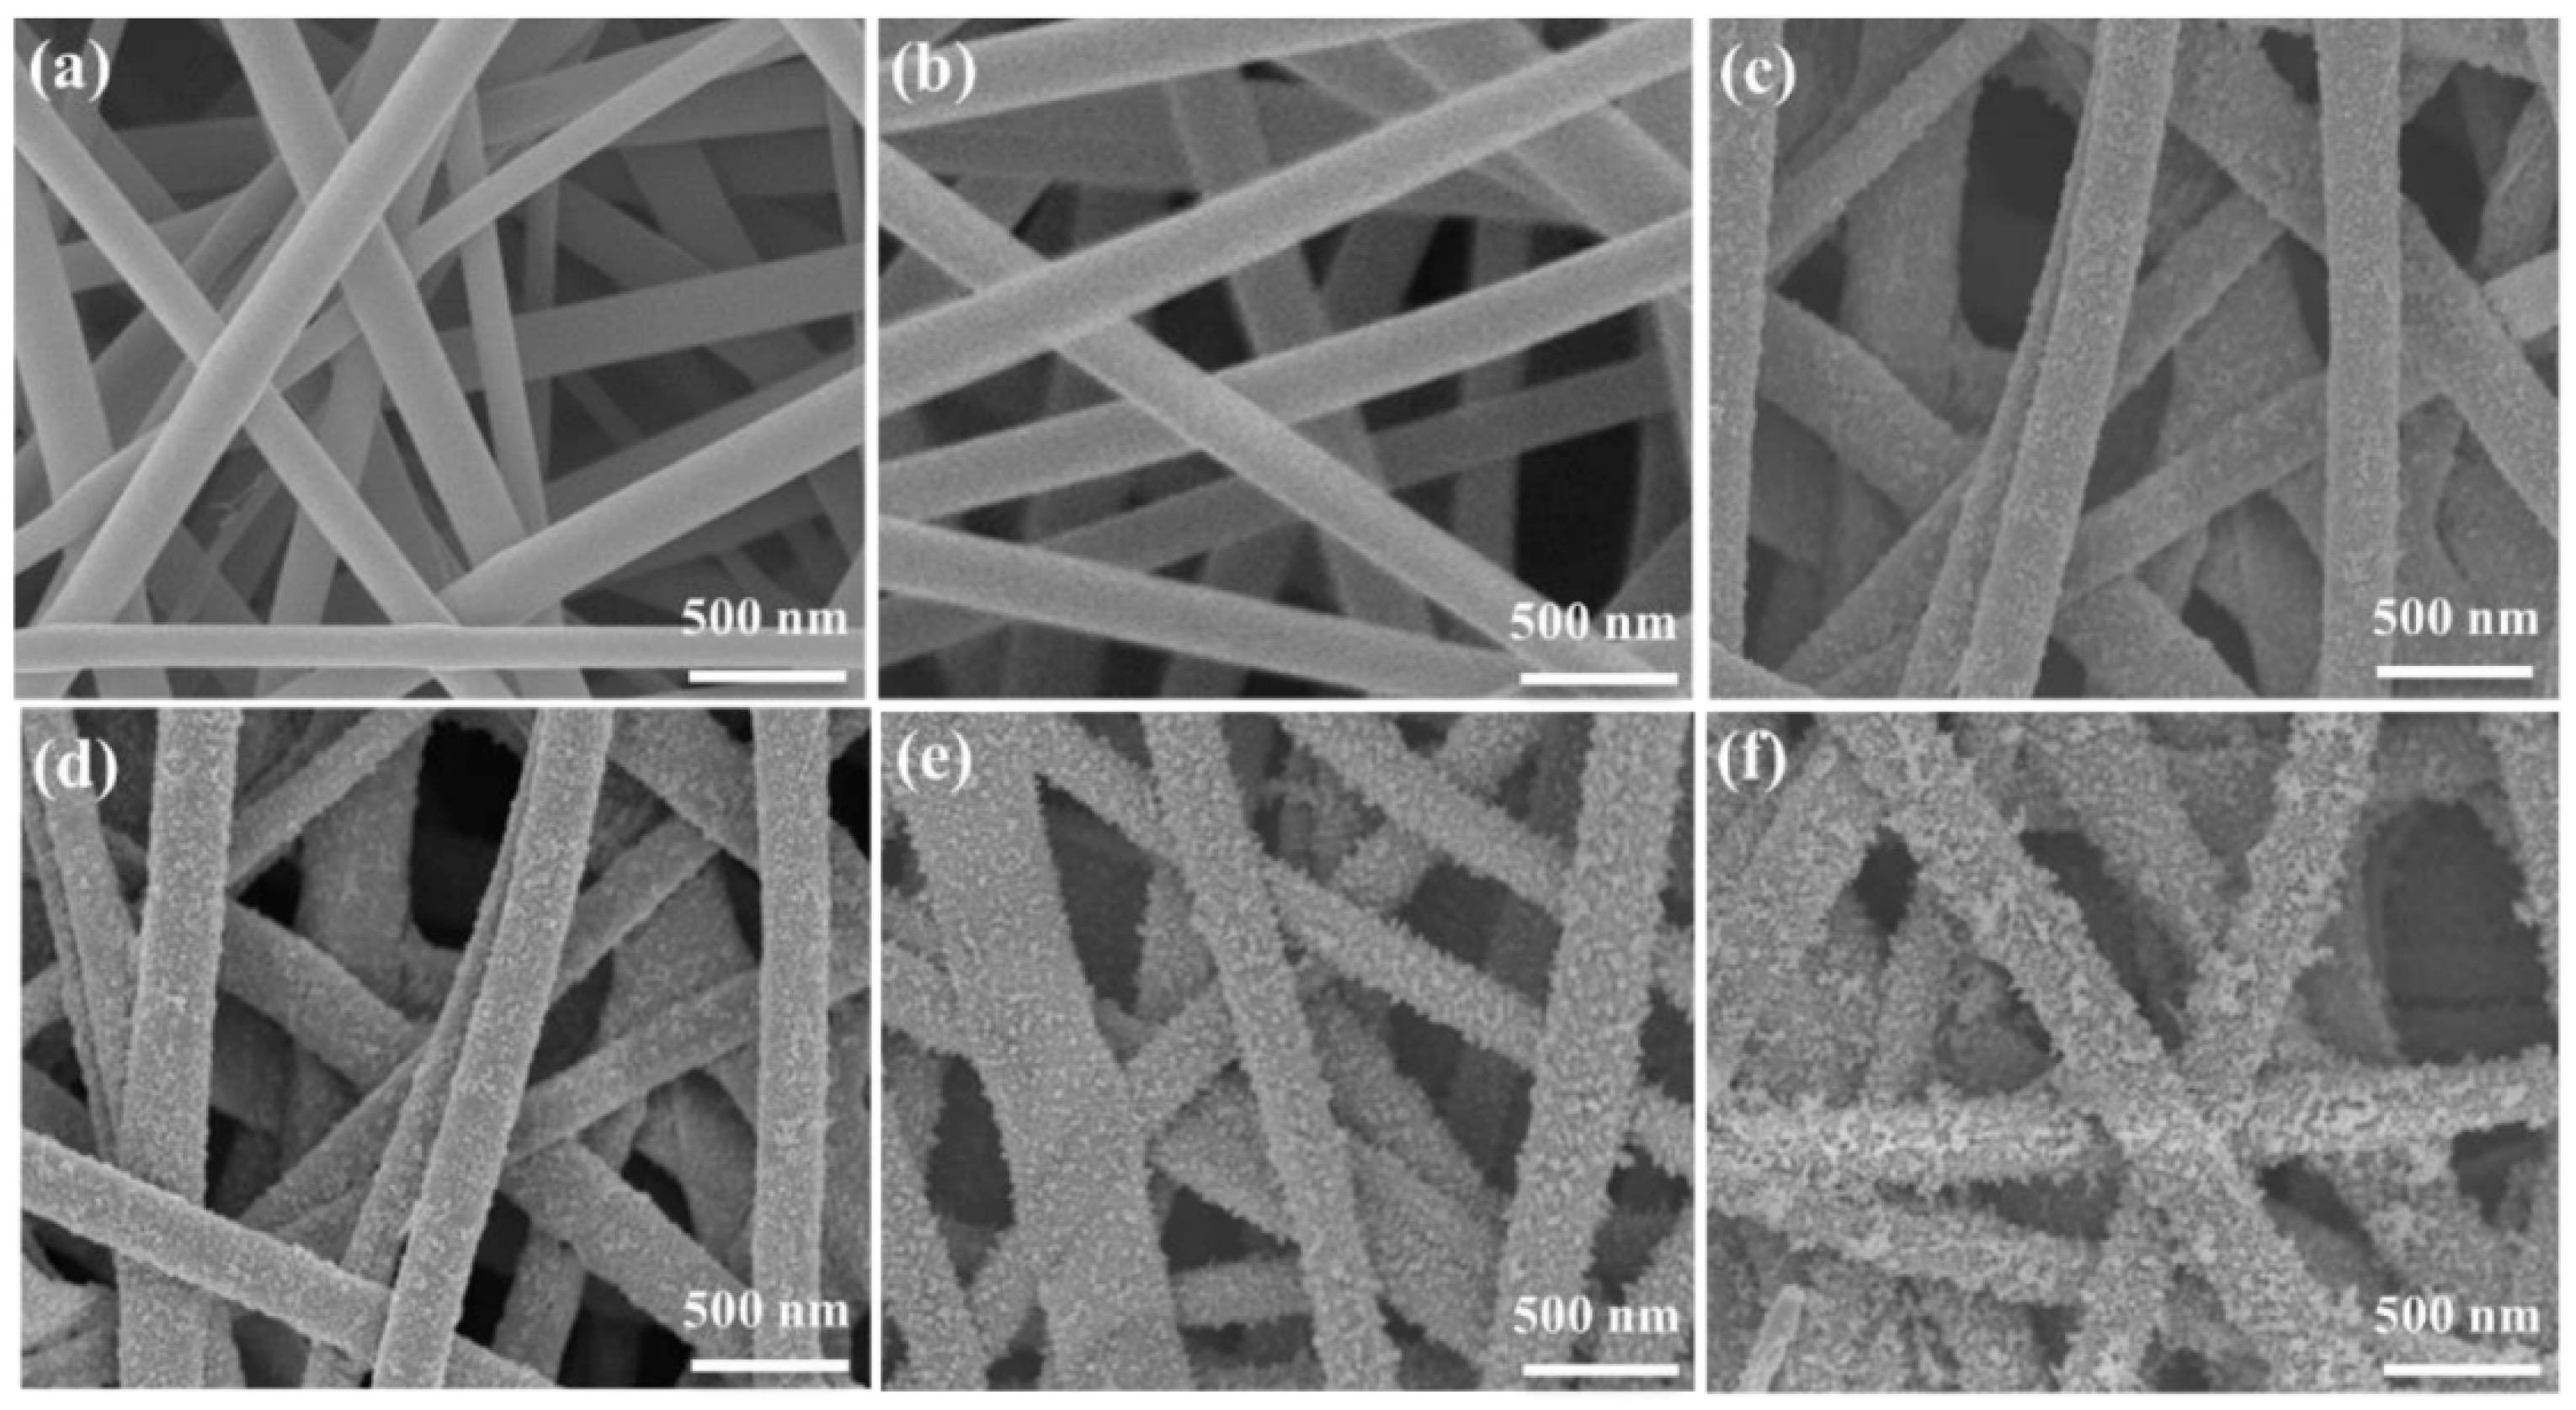
2.2. SEM Analysis
2.3. XPS Analysis
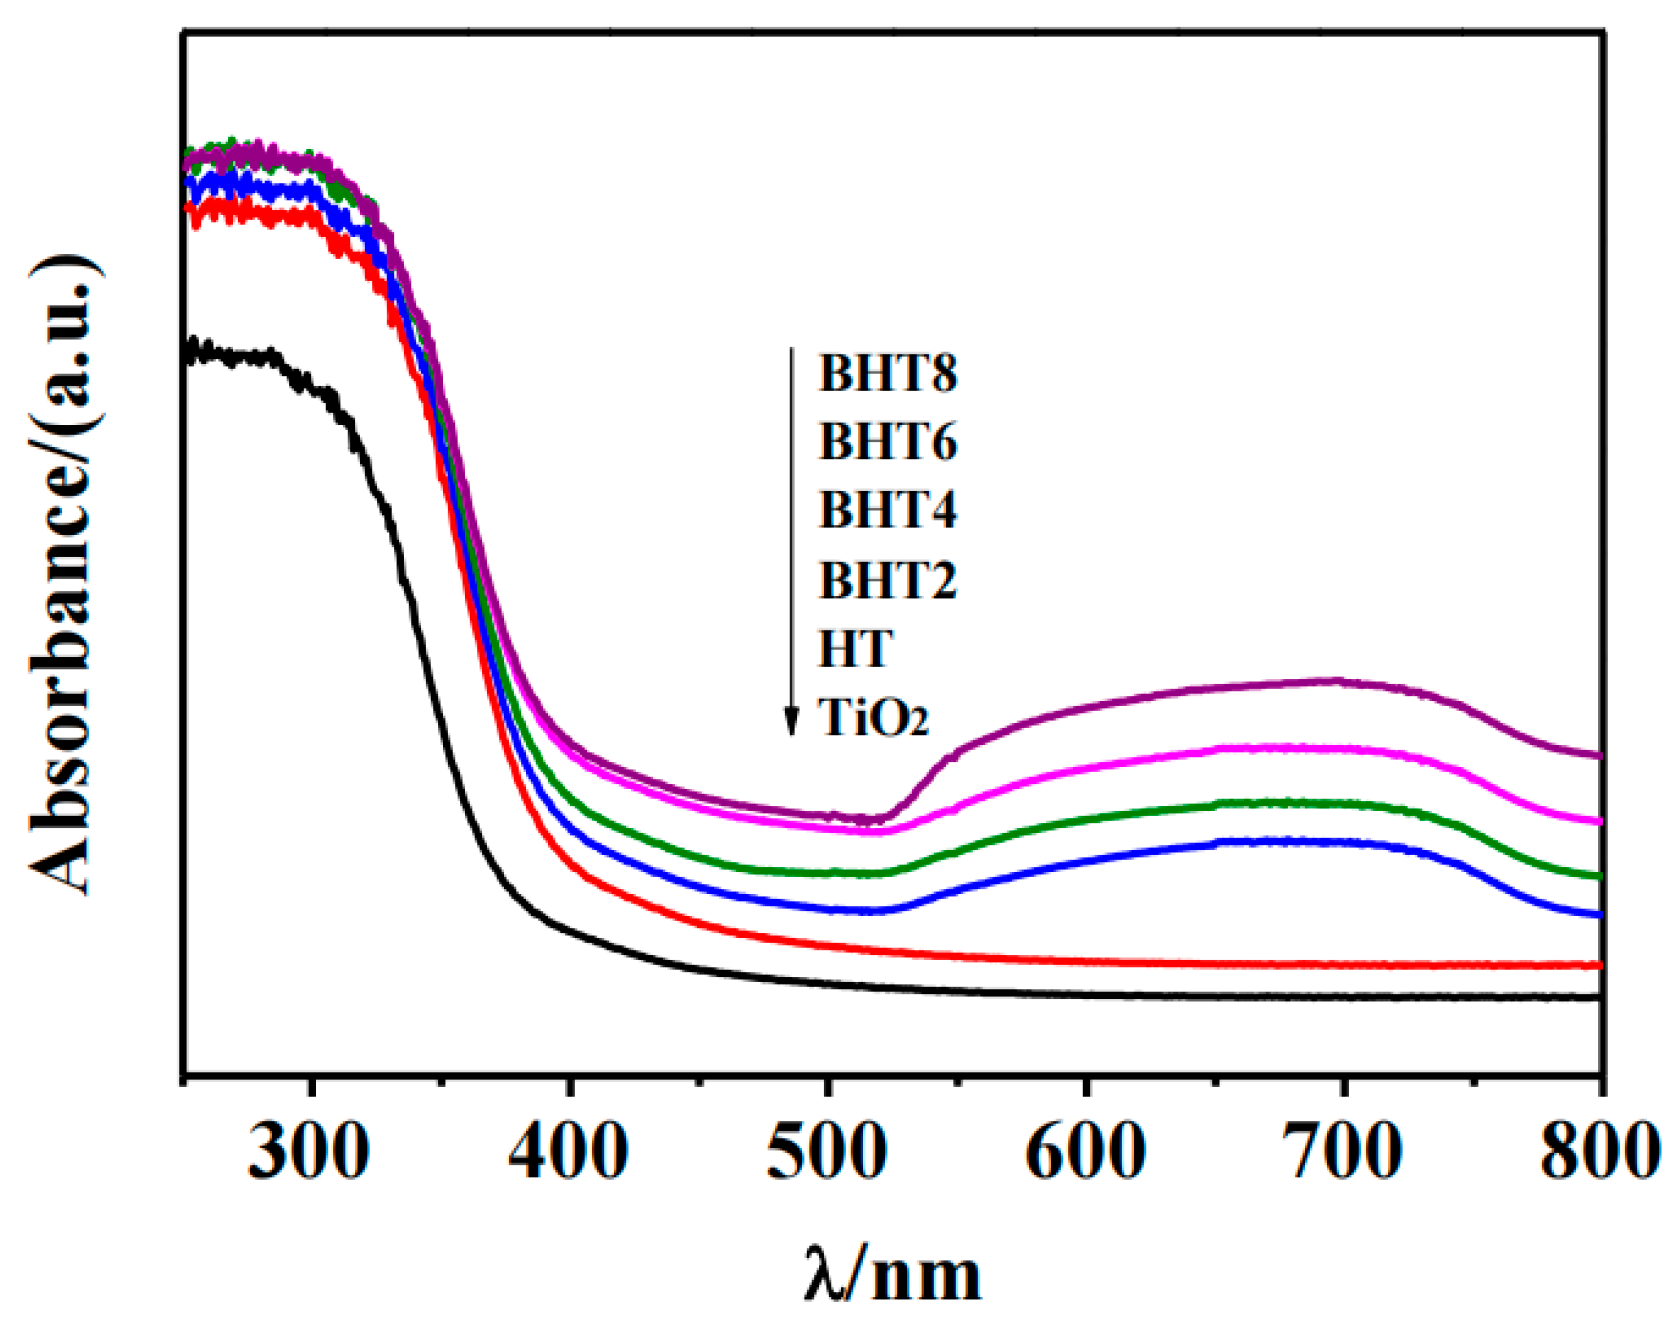
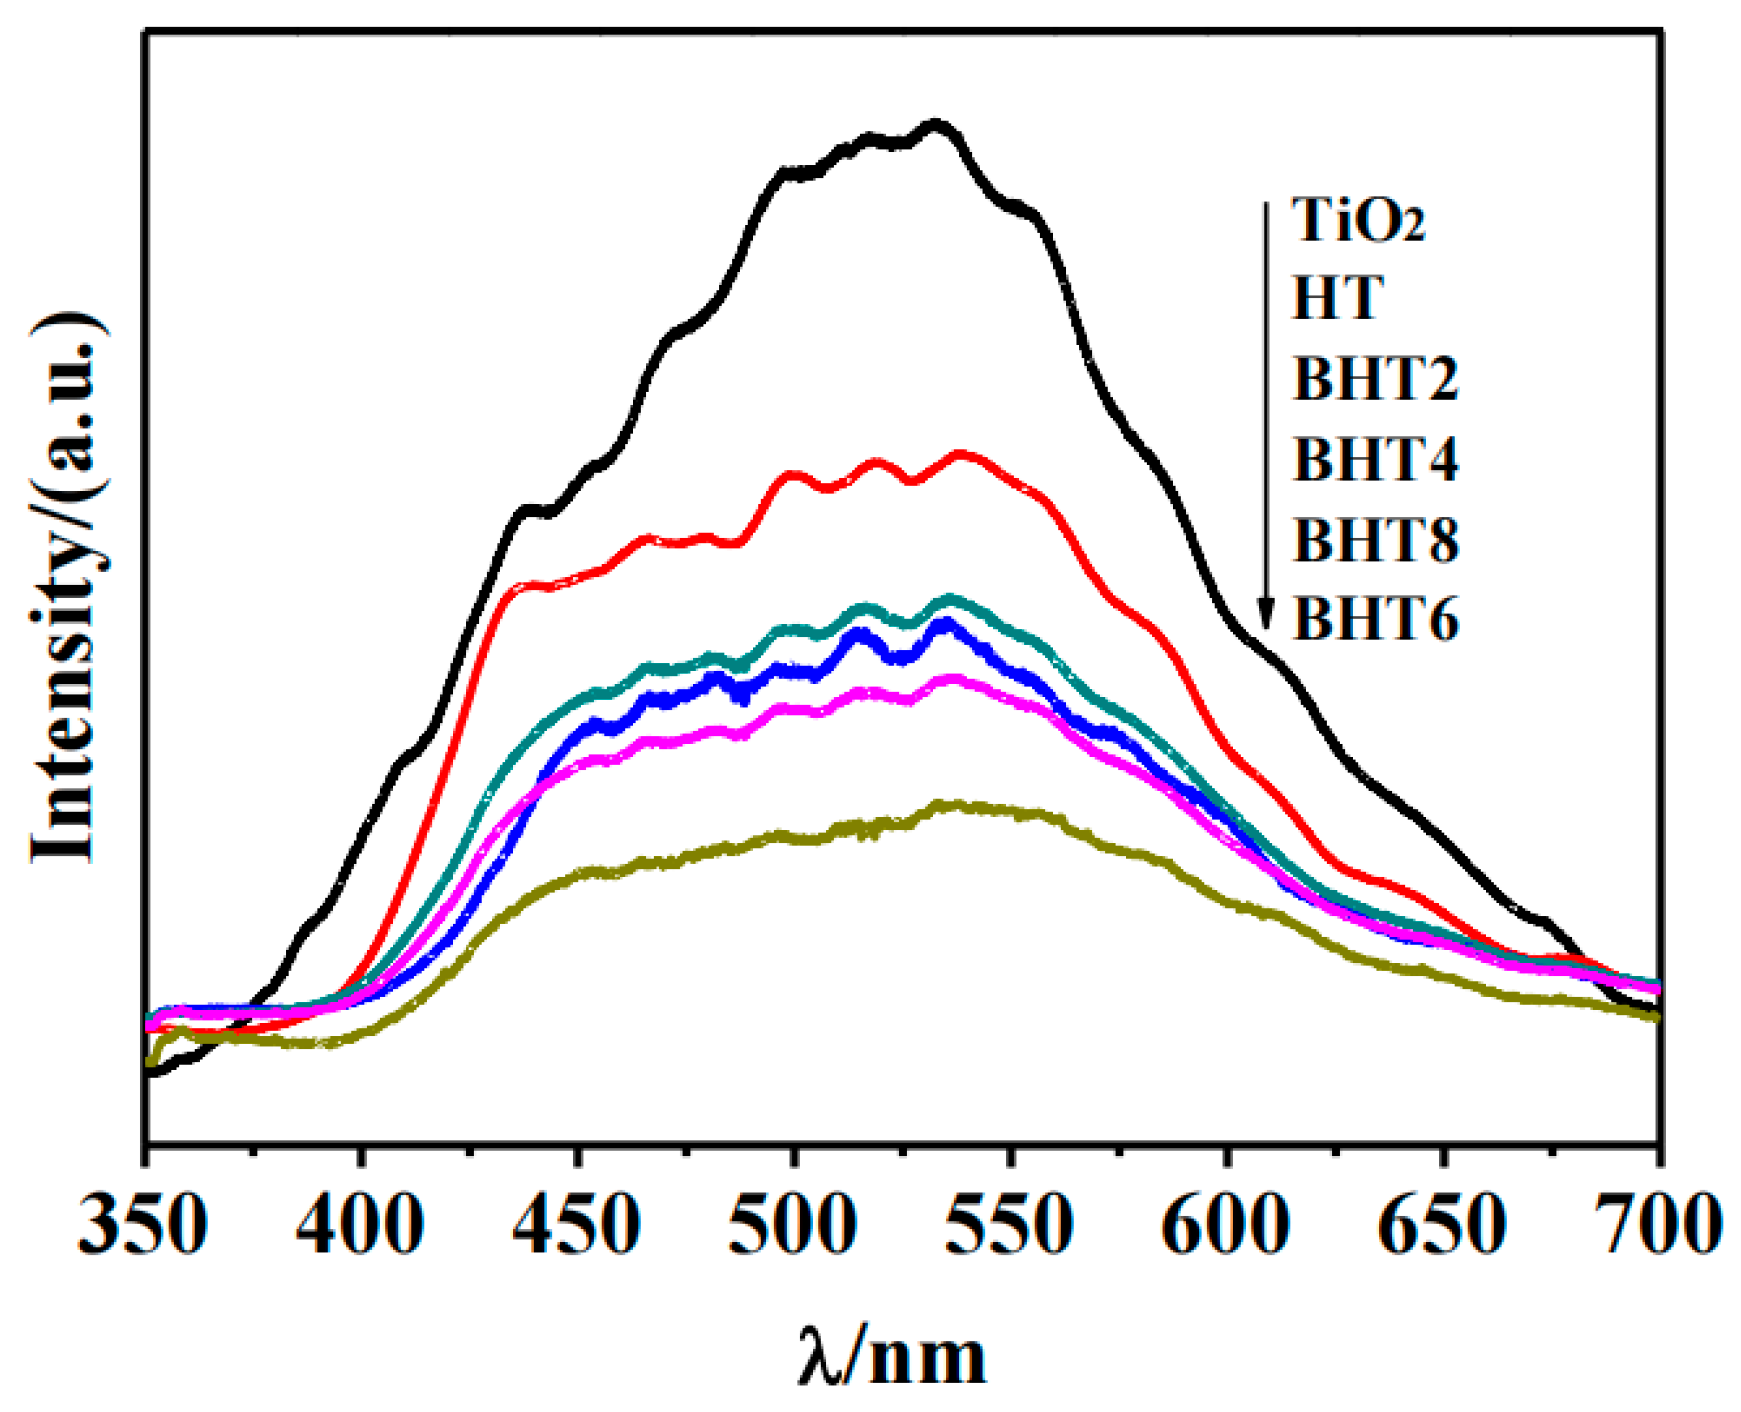
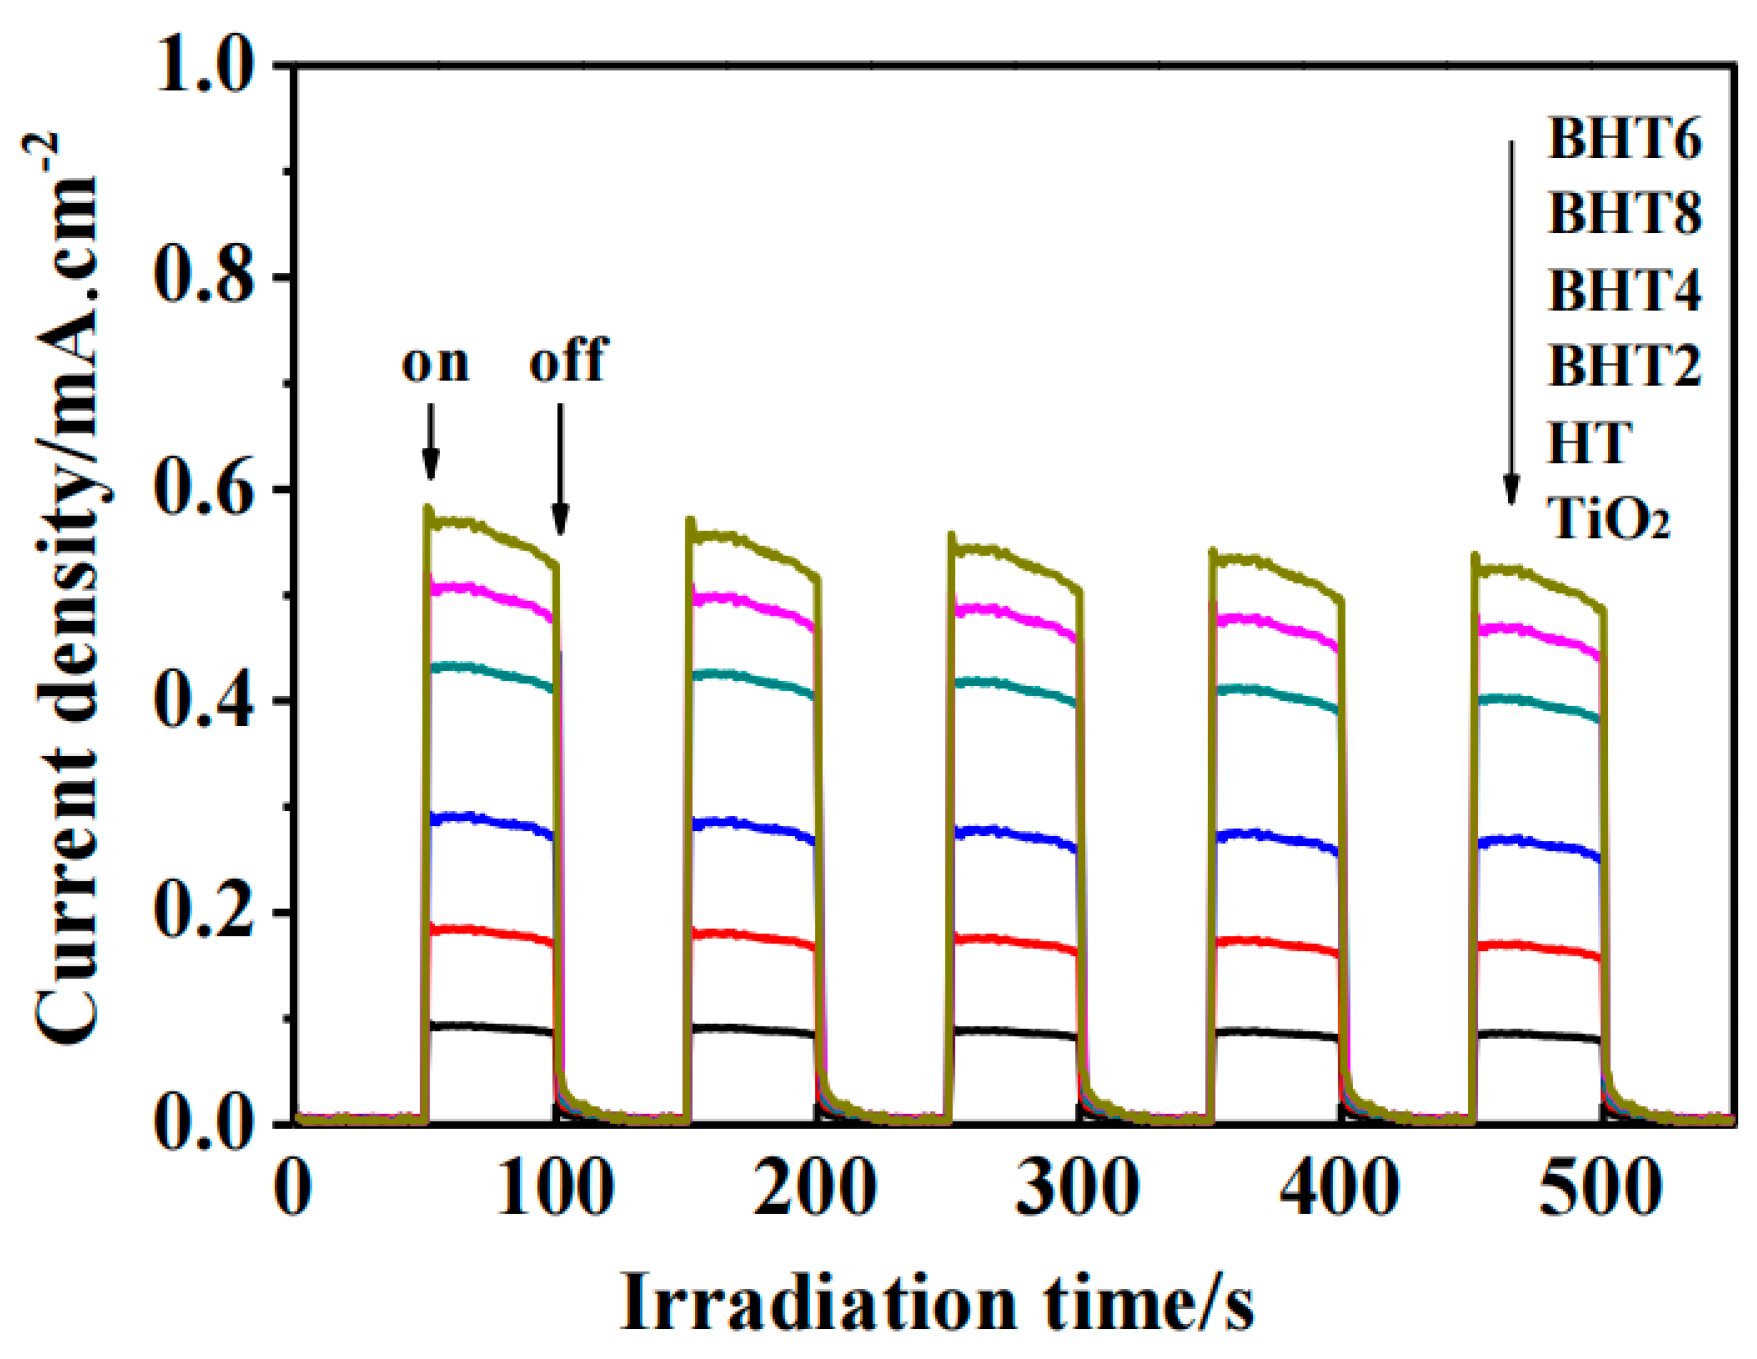
2.4. Photoelectric Performance Analysis
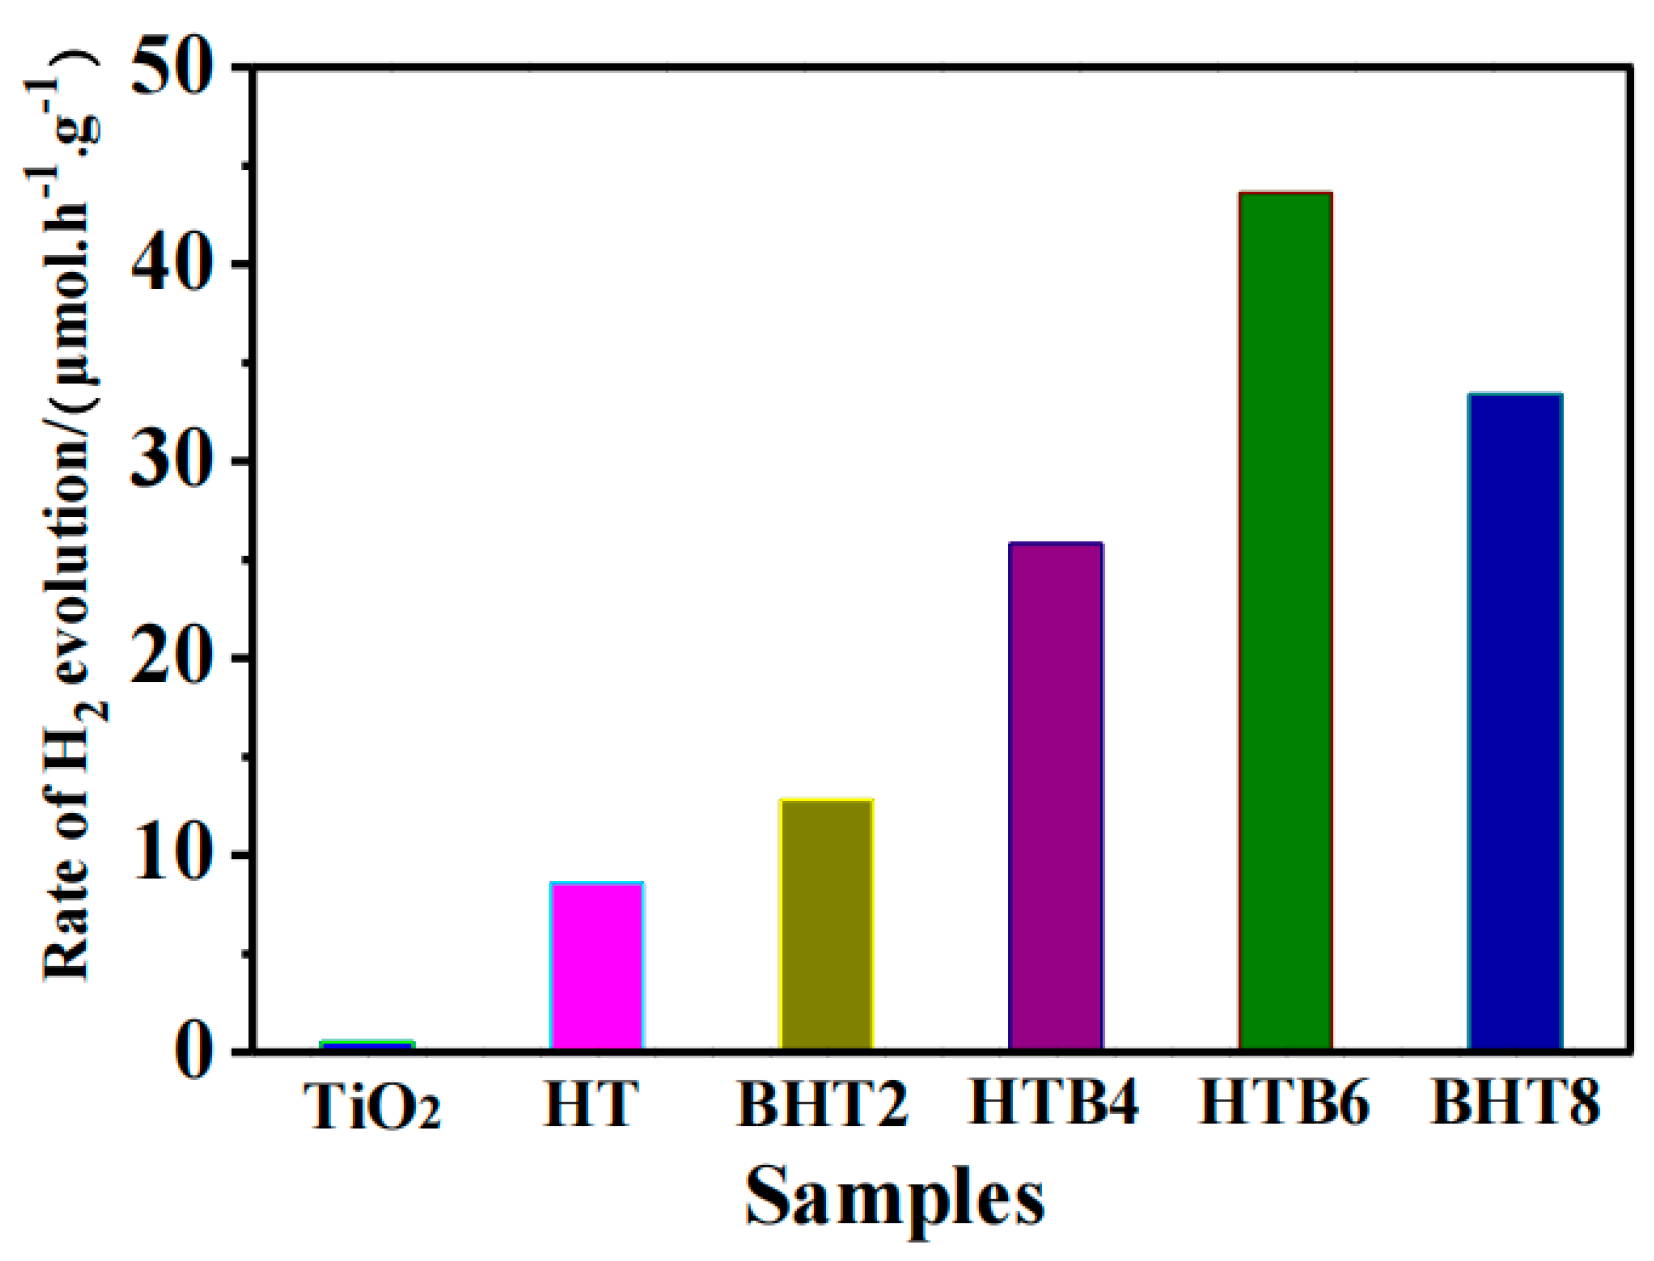
2.5. Photocatalytic Performance Evaluation
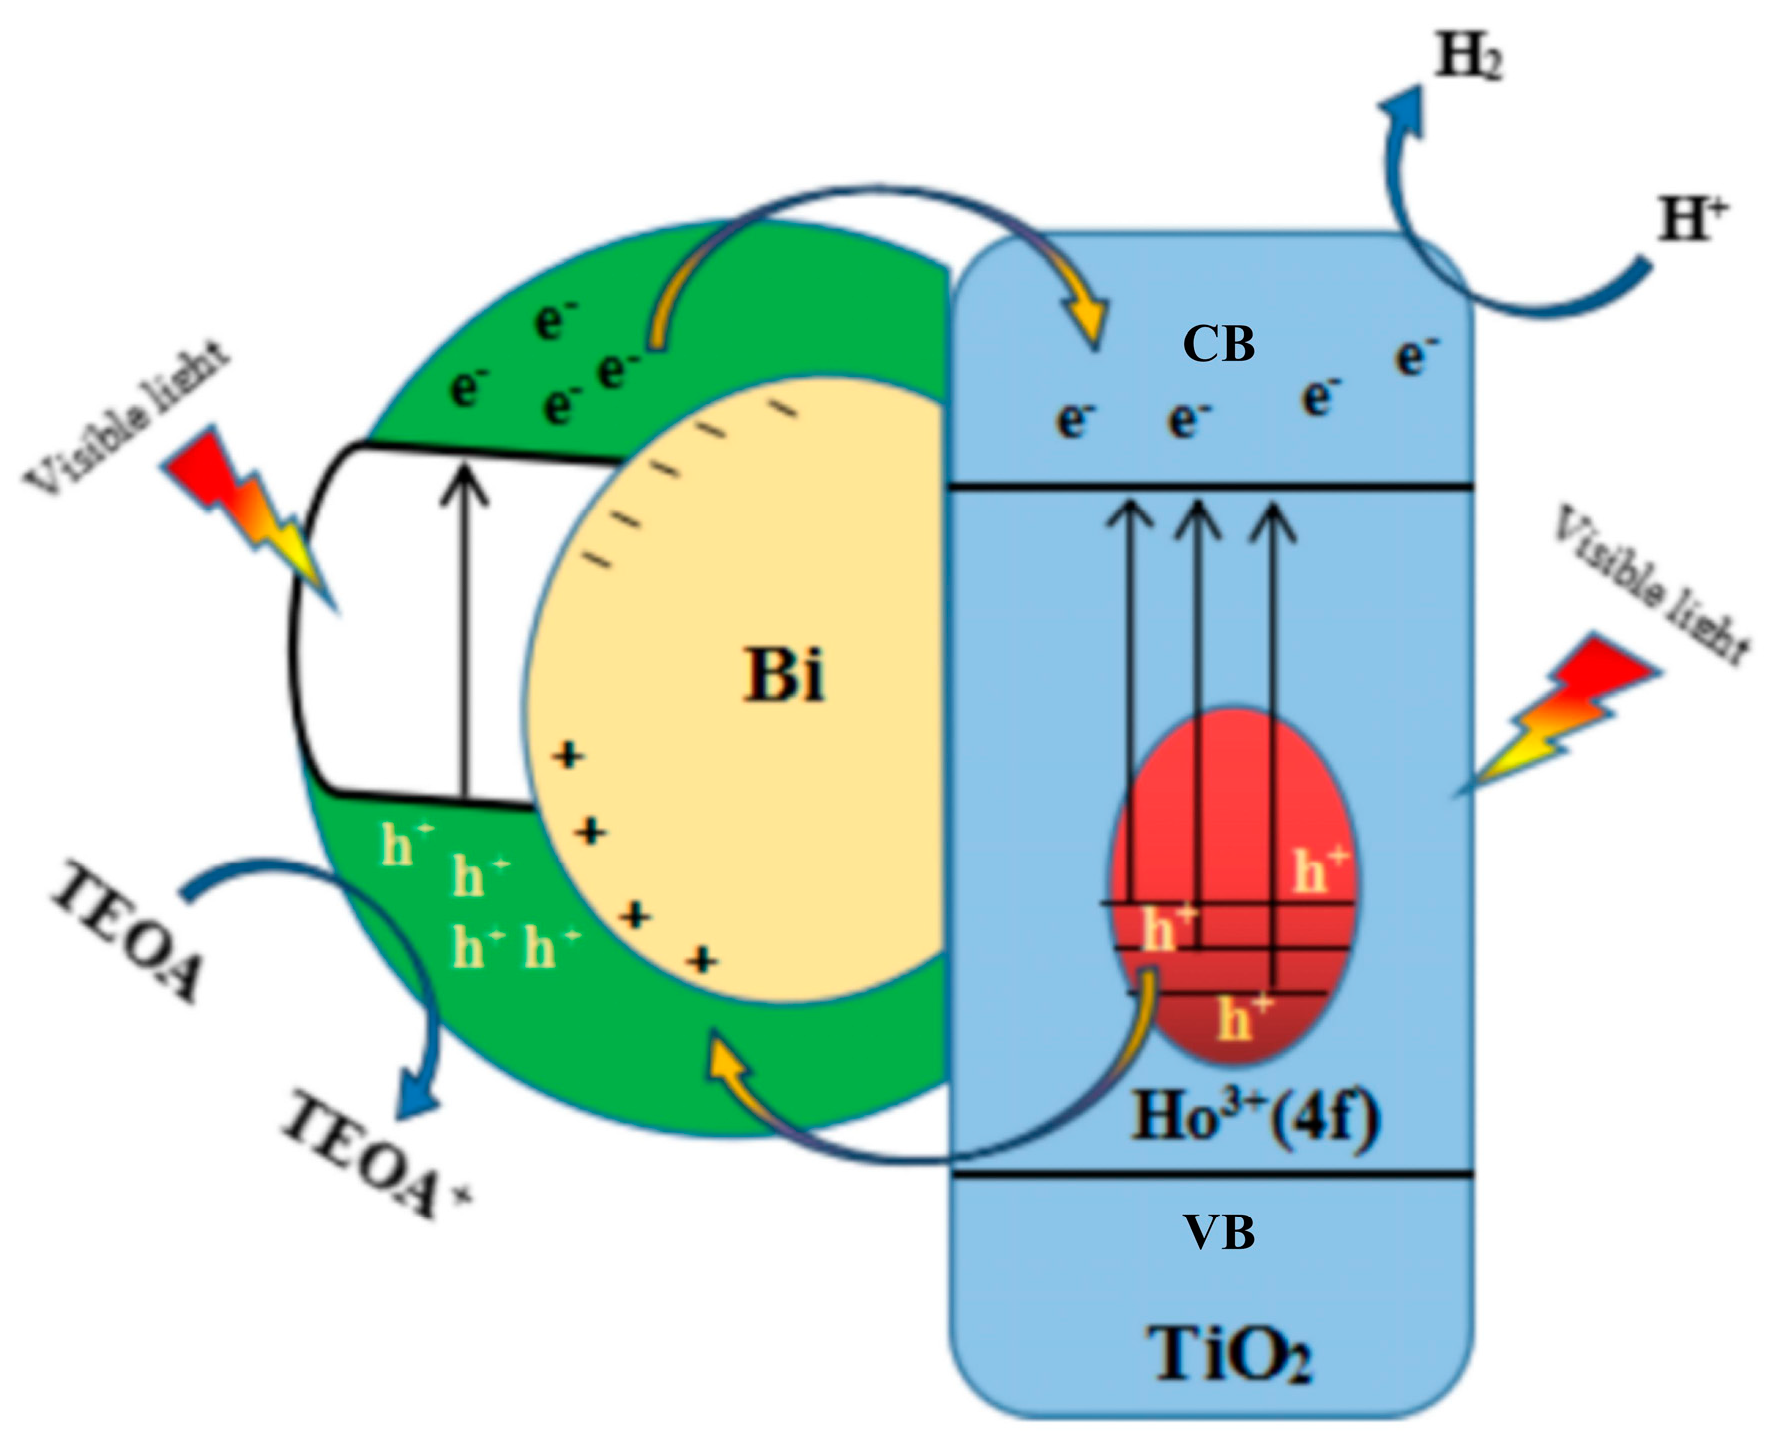
2.6. Visible Photocatalytic Hydrogen Production Mechanism
3. Experiment
3.1. Materials and Methods
3.2. Sample Preparation
3.3. Photoelectric Performance Test
3.4. Performance Evaluation of Hydrogen in Photolysis Water
4. Conclusions
Supplementary Materials
Author Contributions
Funding
Data Availability Statement
Conflicts of Interest
References
- Gao, Q.; Wu, X.; Huang, T. Novel energy efficient window coatings based on In doped CuS nanocrystals with enhanced NIR shielding performance. Sol. Energy 2021, 220, 1–7. [Google Scholar] [CrossRef]
- Zhou, C.G.; Wang, S.M.; Zhao, Z.Y. A Facet-Dependent Schottky-Junction Electron Shuttle in a BiVO4{010}-Au-Cu2O Z-Scheme Photocatalyst for Efficient Charge Separation. Adv. Funct. Mater. 2018, 28, 1801214–1801224. [Google Scholar] [CrossRef]
- Yang, J.H.; Guo, Y.Z.; Jiang, R.B. High-Efficiency “Working-in-Tandem” Nitrogen Photofixation Achieved by Assembling Plasmonic Gold Nanocrystals on Ultrathin Titania Nanosheets. J. Am. Chem. Soc. 2018, 140, 8497–8508. [Google Scholar] [CrossRef] [PubMed]
- Patnaik, S.; Swain, G.; Parida, K.M. Highly Efficient Charge Transfer Through a Double Z-scheme Mechanism by a Cu-promoted MoO3/g-C3N4 Hybrid Nanocomposite with Superior Electrochemical and Photocatalytic Performance. Nanoscale 2018, 10, 5950–5964. [Google Scholar] [CrossRef] [PubMed]
- Tanaka, A.; Hashimoto, K.; Kominami, H. A Very Simple Method for the Preparation of Au/TiO2 Plasmonic Photocatalysts Working Under Irradiation of Visible Light in the Range of 600–700 nm. Chem. Commun. 2017, 53, 4759–4762. [Google Scholar] [CrossRef] [PubMed]
- Cheng, W.R.; Su, H.; Tang, F.M. Synergetic Enhancement of Plasmonic Hot-electron Injection in Au Cluster-nanoparticle/C3N4 for Photocatalytic Hydrogen Evolution. J. Mater. Chem. A 2017, 5, 19649–19655. [Google Scholar] [CrossRef]
- Kumari, G.; Zhang, X.Q.; Devasia, D. Watching Visible Light-Driven CO2 Reduction on a Plasmonic Nanoparticle Catalyst. ACS Nano 2018, 12, 8330–8340. [Google Scholar] [CrossRef]
- Tong, F.; Liang, X.; Ma, F. Plasmon-Mearatea Nirobenzene Hyarogenatuon witn Formate as the Hydrogen Donor Studied at a Single-Particle Level. ACS Catal. 2021, 117, 3801–3809. [Google Scholar] [CrossRef]
- Yue, X.; Cheng, L.; Li, F. Highly Strained Bi-MOF on Bismuth Oxyhalide Support with Tailored Intermediate Adsorption/Desorption Capability for Robust CO2 Photoreduction. Angew. Chem. Int. Ed. Engl. 2022, 61, 2022084144. [Google Scholar] [CrossRef]
- Gavade, N.L.; Babar, S.B.; Kadam, A.N. Fabrication of M@CuxO/ZnO (M = Ag, Au) Heterostructured Nanocomposite with Enhanced Photocatalytic Performance under Sunlight. Ind. Eng. Chem. Res. 2017, 56, 14489–14501. [Google Scholar] [CrossRef]
- Yang, L.; Pillai, S.; Green, M.A. Can plasmonic Al nanoparticles improve absorption in triple junction solar cells. Sci. Rep. 2015, 5, 11852–11864. [Google Scholar] [CrossRef] [PubMed]
- He, W.J.; Sun, Y.J.; Jiang, G.M. Defective Bi4MoO9/Bi metal core/shell heterostructure: Enhanced visible light photocatalysis and reaction mechanism. Appl. Catal. B Environ. 2018, 239, 619–627. [Google Scholar] [CrossRef]
- Wang, H.; Zhang, W.D.; Li, X.W. Highly enhanced visible light photocatalysis and in situ FT-IR studies on Bi metal@defective BiOCl hierarchical microspheres. Appl. Catal. B Environ. 2018, 225, 218–227. [Google Scholar] [CrossRef]
- Dong, F.; Zhao, Z.W.; Sun, Y.J. An Advanced Semimetal–Organic Bi Spheres gC3N4 Nanohybrid with SPR-Enhanced Visible-Light Photocatalytic Performance for NO Purification. Environ. Sci. Technol. 2015, 49, 12432–12440. [Google Scholar] [CrossRef]
- Qu, L.L.; Luo, Z.J.; Tang, C. One Step Synthesis of Bi@Bi2O3@ Carboxylate-rich Carbon Spheres with Enhanced Photocatalytic Performance. Mater. Res. Bull. 2013, 48, 4601–4605. [Google Scholar] [CrossRef]
- Xiong, Z.; Lei, Z.; Xu, Z.W.; Chen, X.X.; Gong, B.G.; Zhao, Y.C.; Zhao, H.B.; Zhang, J.Y.; Zheng, C.G. Flame spray pyrolysis synthesized ZnO/CeO2 nanocomposites for enhanced CO2 photocatalytic reduction under UV-vis light irradiation. J. CO2 Util. 2017, 18, 53–61. [Google Scholar] [CrossRef]
- Aazam, E.S. Holmium-TiO2 thin film for methanol preparation from photocatalytic reduction of carbon dioxide. Desalin. Water Treat. 2018, 111, 241–246. [Google Scholar] [CrossRef]
- Wang, X.Y.; Zhang, Z.G.; Huang, Z.F.; Dong, P.M.; Nie, X.X.; Jin, Z.; Zhang, X.W. Synergistic effect of N-Ho on photocatalytic CO2 reduction for N/Ho Co-doped TiO2 nanorods. Mater. Res. Bull. 2019, 118, 110502. [Google Scholar] [CrossRef]
- Pascariu, P.; Cojocaru, C.; Homocianu, M.; Samoila, P.; Dascalu, A.; Suchea, M. New La3+ doped TiO2 nanofibers for photocatalytic degradation of organic pollutants: Effects of thermal treatment and doping loadings. Ceram. Int. 2022, 48, 4953–4964. [Google Scholar] [CrossRef]
- Lavanya, R.; Ramakrishnappa, T.; Girish, K.M.; Suresh Kumar, K.; Radhakrishna Reddy, M.; Prakash, H.R. Synthesis and characterization of hydrothermally derived cerium-doped TiO2@MoS2 nanocomposites for waste-water treatment and super capacitor applications. Bull. Mater. Sci. 2024, 47, 34–44. [Google Scholar] [CrossRef]
- Xu, X.; Sun, Y.; Zhang, Q.; Cai, H.; Li, Q.; Zhou, S. Synthesis and photocatalytic activity of plasmon-enhanced core-shell upconversion luminescent photocatalytic Ag@SiO2 @YF3 :Ho3+ @TiO2 nanocomposites. Opt. Mater. 2019, 94, 444–453. [Google Scholar] [CrossRef]
- Patrycja, P.; Tomasz, G.; Alicja, M.; Kunlei, W.; Ewa, K.; Norbert, S.; Marek, K.; Paweł, M.; Adriana, Z.-M.; Joanna, N. Experimental and theoretical investigations of the influence of carbon on a Ho3+-TiO2 photocatalyst with Vis response. J. Colloid. Interface Sci. 2019, 549, 212–224. [Google Scholar]
- Tran, D.P.H.; Pham, M.T.; Bui, X.T.; Wang, Y.F.; You, S.J. CeO2 as a photocatalytic material for CO2 conversion: A review. Sol. Energy 2022, 240, 443–466. [Google Scholar] [CrossRef]
- Nyholm, R.; Berndtsson, A.; Martensson, N. Core Level Binding Energies for the Elements Hf to Bi (Z = 72 − 83). J. Phys. C Solid. State Phys. 1980, 13, 1091–1096. [Google Scholar] [CrossRef]
- Li, Y.Y.; Dang, L.Y.; Han, L.F. Iodine-sensitized Bi4Ti3O12/TiO2 Photocatalyst with Enhanced Photocatalytic Activity on Degradation of Phenol. J. Mol. Catal. A Chem. 2013, 379, 146–151. [Google Scholar] [CrossRef]
- Xie, F.X.; Mao, X.M.; Fan, C.M. Facile Preparation of Sn-doped BiOCl Photocatalyst with Enhanced Photocatalytic Activity for Benzoic Acid and Rhodamine B Degradation. Mater. Sci. Semicond. Process. 2014, 27, 380–389. [Google Scholar] [CrossRef]
- Wang, L.L.; Ma, W.H.; Fang, Y.F. Bi4Ti3O12 Synthesized by High Temperature Solid Phase Method and It’s Visible Catalytic Activity. Procedia Environ. Sci. 2013, 18, 547–558. [Google Scholar] [CrossRef]
- Lazǎr, C.; Burzo, E.; Neumann, M. XPS Study of RNi4B Compounds, Where R Nd, Tb, Dy, Ho and Er. J. Optoelectron. Adv. Mater. 2008, 10, 780–782. [Google Scholar]
- Ooka, C.; Yoshida, H.; Horio, M. Adsorptive and Photocatalytic Performance of TiO2 Pillared Montmorillonite in Degradation of Endocrine Disruptors Having Different Hydrophobicity. Appl. Catal. B Environ. 2003, 41, 313–321. [Google Scholar] [CrossRef]
- McMahon, J.M.; Schatz, G.C.; Gray, S.K. Plasmonics in the Ultraviolet with the Poor metals Al, Ga, in, Sn, Tl, Pb, and Bi. Phys. Chem. Chem. Phys. 2013, 15, 5415–5423. [Google Scholar]
- Wang, Z.; Jiang, C.L.; Huang, R.; Peng, H.; Tang, X. Investigation of Optical and Photocatalytic Properties of Bismuth Nanospheres Prepared by a FacileThermolysis Method. J. Phys. Chem. C 2014, 118, 1155–1160. [Google Scholar] [CrossRef]
- Toudert, J.; Serna, R.; Jiménez De Castro, M. Exploring the Optical Potential of Nano-Bismuth: Tunable Surface Plasmon Resonances in the Near Ultraviolet-to-Near Infrared Range. J. Phys. Chem. C 2012, 116, 20530–20539. [Google Scholar] [CrossRef]
- Zhang, M.Y.; Shao, C.L.; Liu, Y.C. One-dimensional Bi2MoO6/TiO2 hierarchical heterostructures with enhanced photocatalytic activit. CrystEngComm 2012, 14, 605–612. [Google Scholar] [CrossRef]
- Long, R.; Prezhdo, O.V. Instantaneous Generation of Charge-Separated State on TiO2 Surface Sensitized with Plasmonic Nanoparticles. J. Am. Chem. Soc. 2014, 136, 4343–4354. [Google Scholar] [CrossRef]


Disclaimer/Publisher’s Note: The statements, opinions and data contained in all publications are solely those of the individual author(s) and contributor(s) and not of MDPI and/or the editor(s). MDPI and/or the editor(s) disclaim responsibility for any injury to people or property resulting from any ideas, methods, instructions or products referred to in the content. |
© 2024 by the authors. Licensee MDPI, Basel, Switzerland. This article is an open access article distributed under the terms and conditions of the Creative Commons Attribution (CC BY) license (https://creativecommons.org/licenses/by/4.0/).
Share and Cite
Cao, T.; Gao, Y.; Xia, W.; Qi, X. Preparation of Bi@Ho3+:TiO2/Composite Fiber Photocatalytic Materials and Hydrogen Production via Visible Light Decomposition of Water. Catalysts 2024, 14, 588. https://doi.org/10.3390/catal14090588
Cao T, Gao Y, Xia W, Qi X. Preparation of Bi@Ho3+:TiO2/Composite Fiber Photocatalytic Materials and Hydrogen Production via Visible Light Decomposition of Water. Catalysts. 2024; 14(9):588. https://doi.org/10.3390/catal14090588
Chicago/Turabian StyleCao, Tieping, Yue Gao, Wei Xia, and Xuan Qi. 2024. "Preparation of Bi@Ho3+:TiO2/Composite Fiber Photocatalytic Materials and Hydrogen Production via Visible Light Decomposition of Water" Catalysts 14, no. 9: 588. https://doi.org/10.3390/catal14090588