Article

Enhanced Photocatalytic Degradation of Herbicide 2,4-Dichlorophenoxyacetic Acid Using Sulfated CeO2

1
Grupo de Catálisis, Escuela de Ciencias Químicas, Universidad Pedagógica y Tecnológica de Colombia UPTC, Avenida Central del Norte 39-115, Tunja 150003, Boyacá, Colombia
2
Grupo de Ecocatálisis, Universidad Autónoma Metropolitana-Iztapalapa, Av. San Rafael Atlixco No. 186, Ciudad de México 09340, Mexico
*
Author to whom correspondence should be addressed.
Catalysts 2024, 14(9), 594; https://doi.org/10.3390/catal14090594
Submission received: 2 August 2024 / Revised: 17 August 2024 / Accepted: 26 August 2024 / Published: 4 September 2024
(This article belongs to the Special Issue Catalytic Energy Conversion and Catalytic Environmental Purification)

Abstract

:
The present study presents the results obtained from evaluating the photocatalytic behavior of a series of sulfated CeO2 materials in the photocatalytic degradation of the herbicide 2,4-dichlorophenoxyacetic acid. The CeO2 photocatalytic support was prepared using the precipitation synthesis method. Subsequently, the support was wetly impregnated with different contents of sulfate ions (0.5, 1.0, and 2.0 wt.%). The materials were characterized using X-ray diffraction, nitrogen physisorption, infrared spectroscopy, diffuse reflectance UV–Vis spectrophotometry, and thermal analysis. The characterization results showed that the sulfation of the material promoted an increase in the surface area and a decrease in the average size of the crystallites. Likewise, it was possible to demonstrate the surface sulfation of the support through bidentate coordination of the sulfate groups to the semiconductor metal. Concerning photoactivity, the convenience of the surface modification of CeO2 was confirmed because the sulfate groups acted as capturers of the electrons generated during the photocatalytic process, reducing the frequency of recombination of the charge carriers and allowing the availability of the gaps to favor the degradation reaction of the contaminant. Finally, it was evident that a percentage of 1.0 wt.% of the sulfate anion is the optimal content to improve the photocatalytic properties of CeO2.

1. Introduction

The frequent use of herbicides for weed control and to improve agricultural production processes represents an important environmental challenge, due to the resistance of these products to conventional degradation, associated with factors such as their chemical structure, limited biodegradability, microbial resistance, and adverse environmental conditions [1]. A herbicide highly recognized for its extensive use is 2,4-dichlorophenoxyacetic acid (2,4-D), classified as an auxin herbicide due to its antitumor, antimicrobial, and inhibitory properties towards the growth and development of weeds. Still, they are harmful to human health, because they can be absorbed through the skin, or inhaled, which can cause damage to the liver, kidneys, muscles, and brain tissue.
Recently, some techniques have been used, such as adsorption on activated carbon [2], flocculation [3], and ultrafiltration [4] with porous resins or biological treatments [5], to eliminate contaminants present in water sources. However, applying advanced oxidation processes (AOPs), such as heterogeneous photocatalysis, is considered an attractive, sustainable, and versatile strategy to remove organic contaminants at low concentrations, potentially leading to their total mineralization. The photocatalytic process requires a photocatalytic material, generally a semiconductor solid, which is activated by irradiation, generating highly reactive charge carriers (electron–hole pairs). The released electrons can participate in reduction reactions. At the same time, the holes can react with water to form highly oxidizing hydroxyl radicals (OH) capable of decomposing organic contaminants present in water, converting them into less harmful products [6].
Thus, one of the main challenges for researchers in photocatalysis is related to the development of materials with adequate physicochemical characteristics that favor activity in reactions promoted via activation of the material with radiation. In this sense, studies on the textural, structural, and morphological modification of materials have experienced significant growth in recent years, given that these modifications can have a significant impact on photocatalytic behavior [7]. Recent research indicates that rare earth oxides are high-performance materials in catalytic and photocatalytic reactions. Among these solids, CeO2 has been successfully tested in photocatalysis, due to its chemical stability, non-toxicity, biocompatibility [8,9], strong absorption in the ultraviolet region (typical absorption edge between 385−400 nm), and the strong redox potential of the Ce4+/Ce3+ pair that promotes the separation of the photogenerated electron–hole pairs [10]. Regarding this last aspect, in the electron transfer process, the Ce4+/Ce3+ pair acts as an electron trap; thus, the Ce4+ species can accept an electron and be reduced to Ce3+. Subsequently, the Ce3+ species can return to the oxidized state by releasing the electron, which is transferred to the substrates adsorbed on the semiconductor [11,12].
However, recent studies confirm the convenience of the surface modification of CeO2 with anionic species such as phosphates, reflected in an improvement in the physicochemical and photocatalytic properties of the semiconductor in degradation reactions of phenolic contaminants [6]. This behavior is associated with the phosphate species bound to the surface of the support in bidentate mode, which could favor a decrease in the recombination frequency of the charge carriers.
To improve the physicochemical properties and effectiveness of CeO2 for photocatalytic applications, it is interesting to evaluate the effects produced by surface modification through sulfation processes. The use of the sulfation route to modify catalysts has been shown to improve photocatalytic properties, which results in a highly effective removal of organic compounds and dyes [13,14,15].
In this way, we intend to verify the potential use of the series of sulfated ceria materials in photocatalytic applications, specifically in environmental remediation processes, through the degradation of herbicide 2,4-dichlorophenoxyacetic acid, which is characterized by a long half-life, which allows enough time for it to be transferred to surface and groundwater and create kidney and liver problems in animals and humans.
According to the above, the main aim of this work is to present the results of the synthesis, physicochemical characterization, and evaluation of the photocatalytic behavior of a series of materials of sulfated CeO2 with different contents of anion (0.5, 1.0, and 2.0 wt.%) during the degradation of 2,4-D under UV irradiation.

2. Results and Discussion

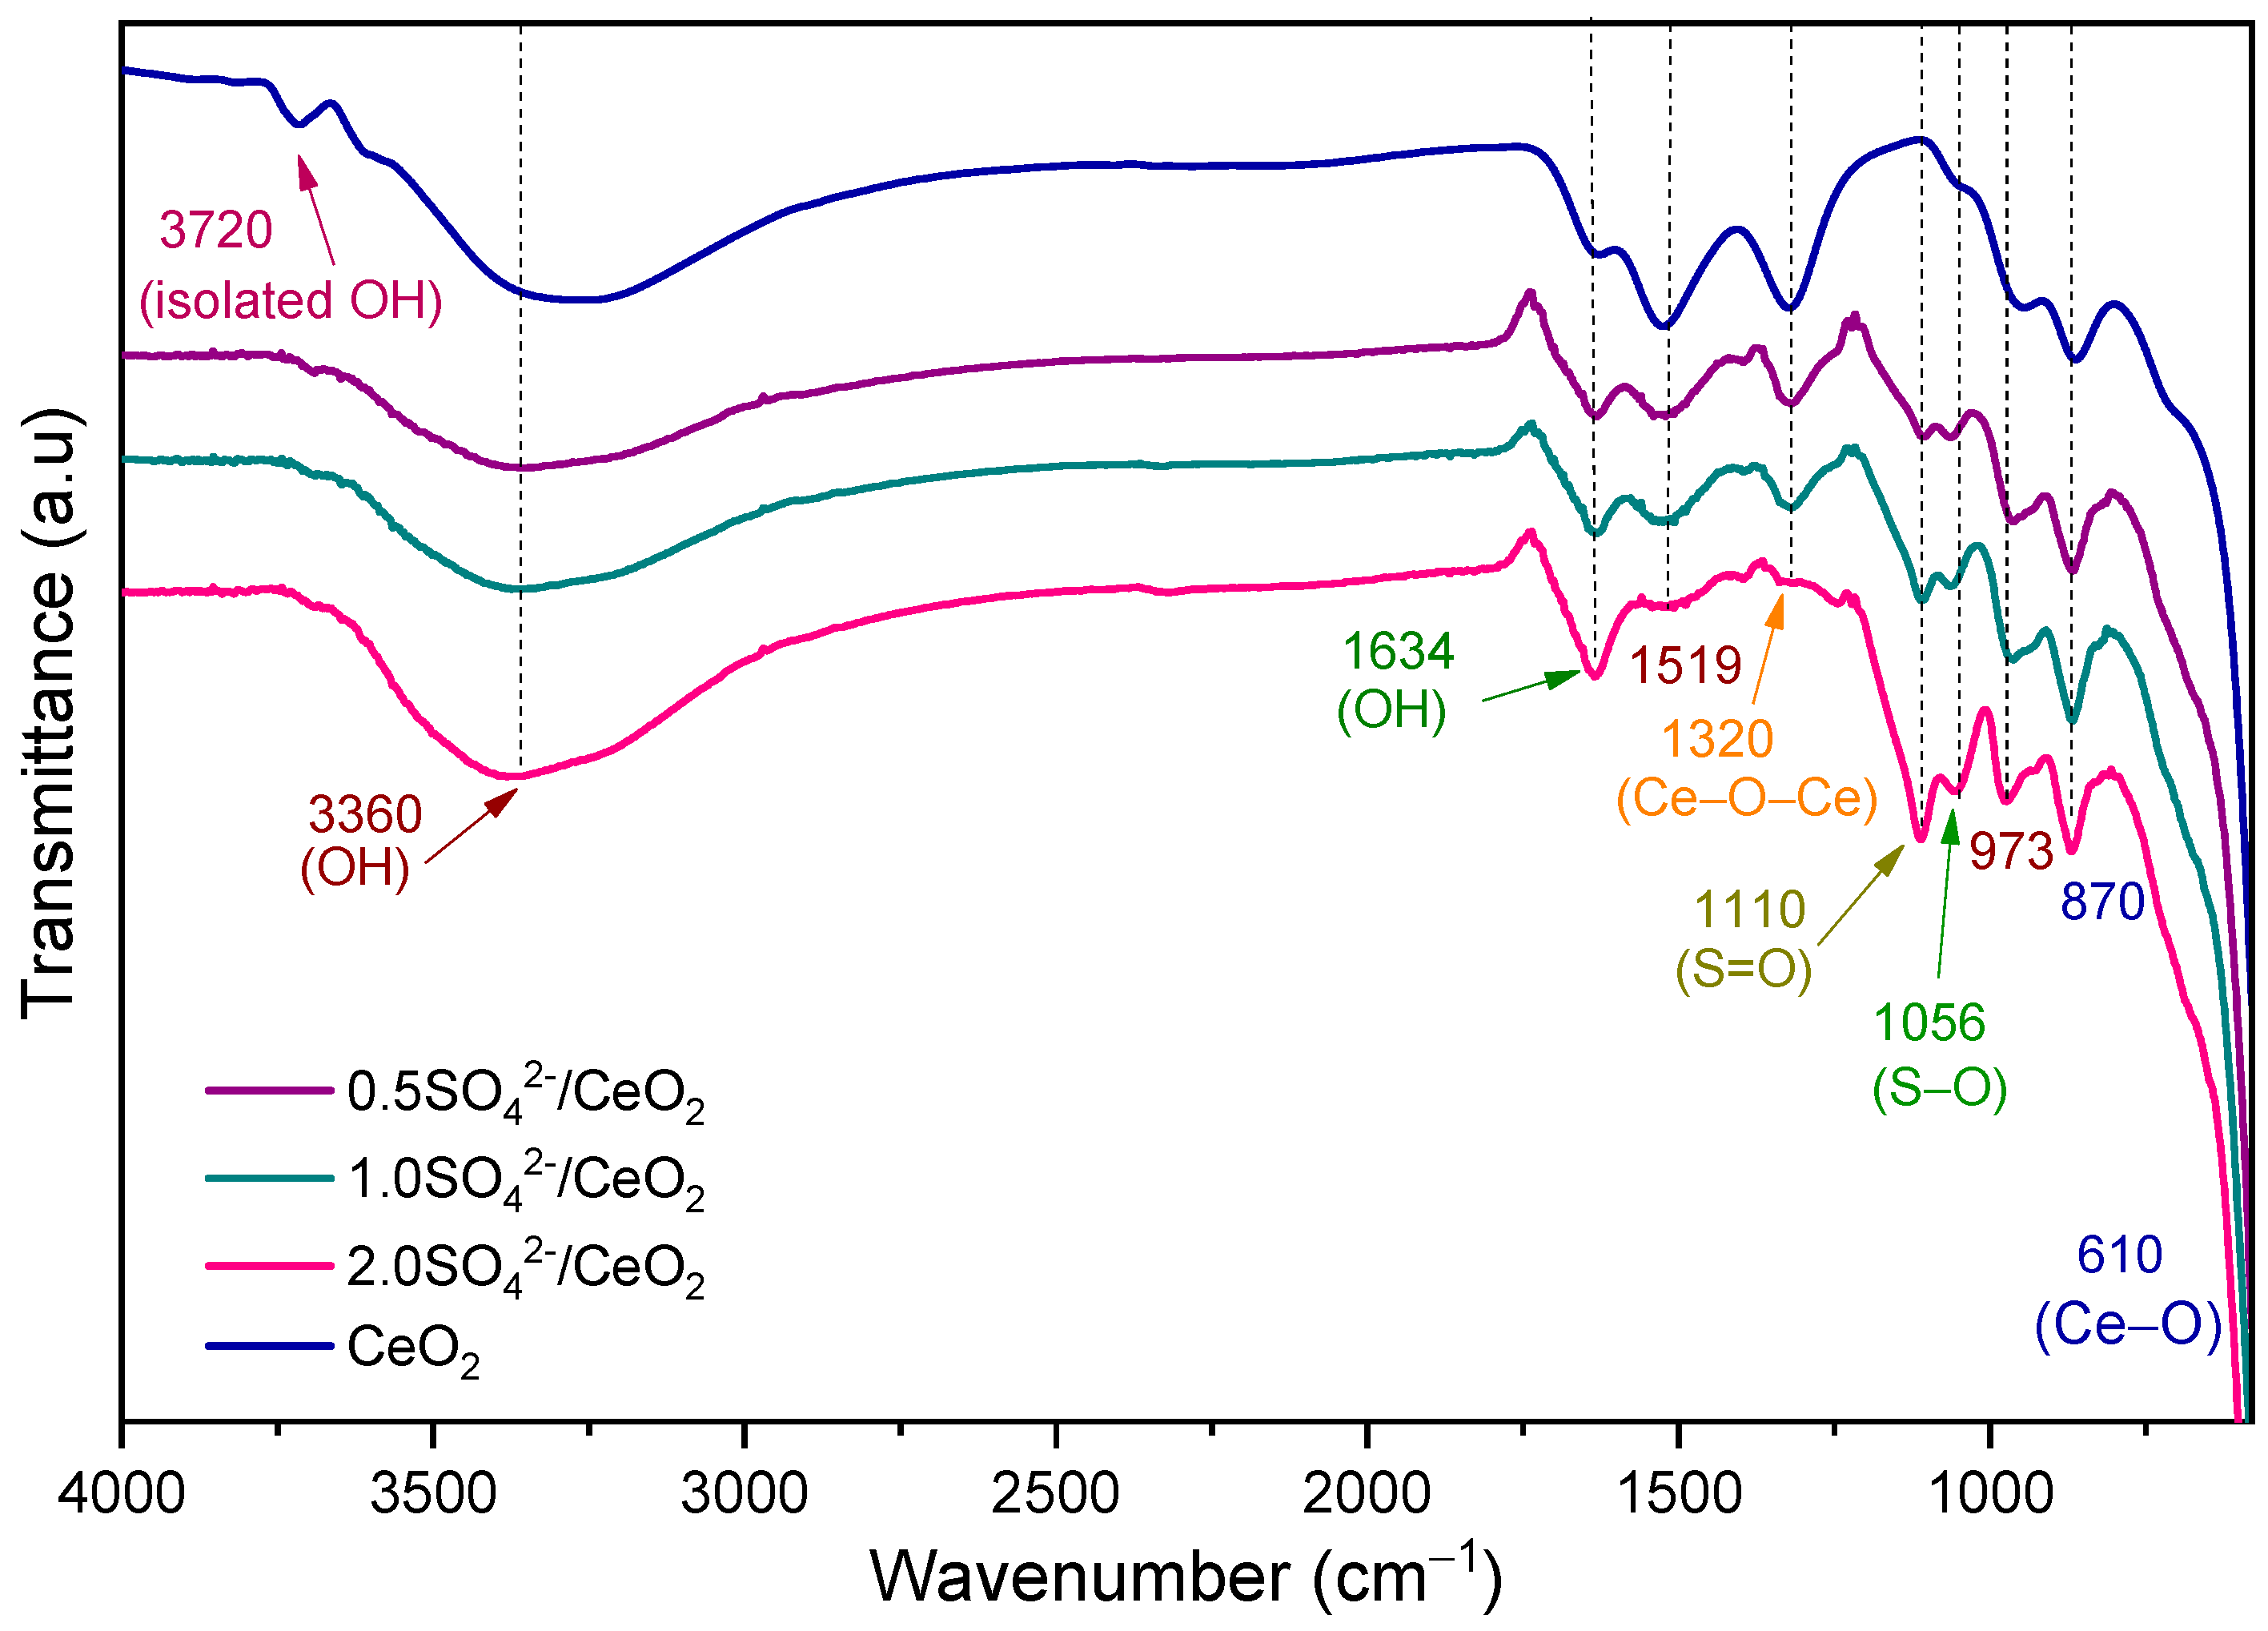
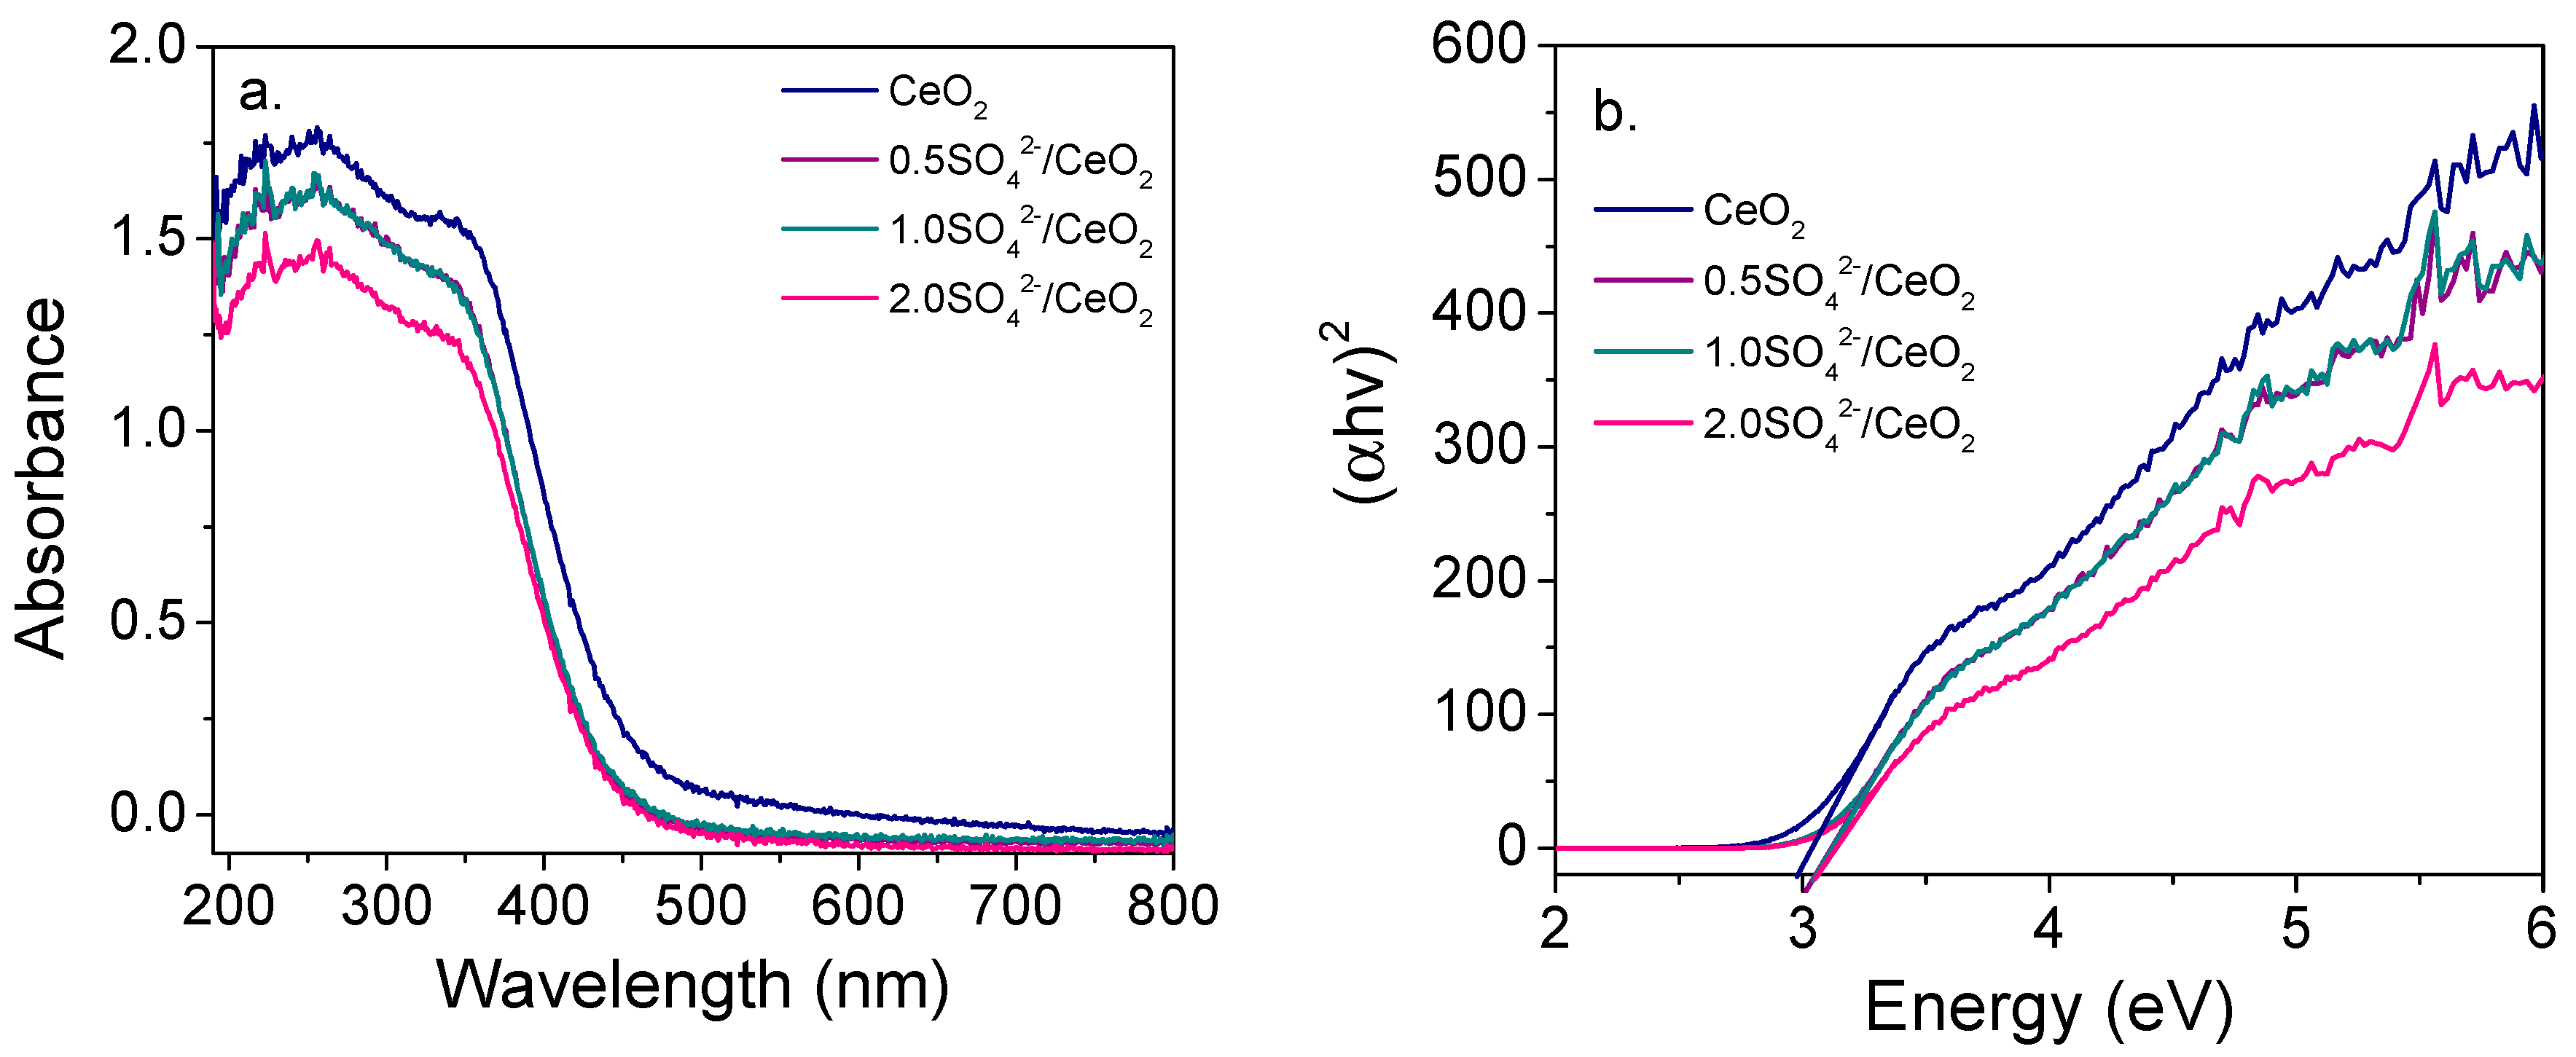
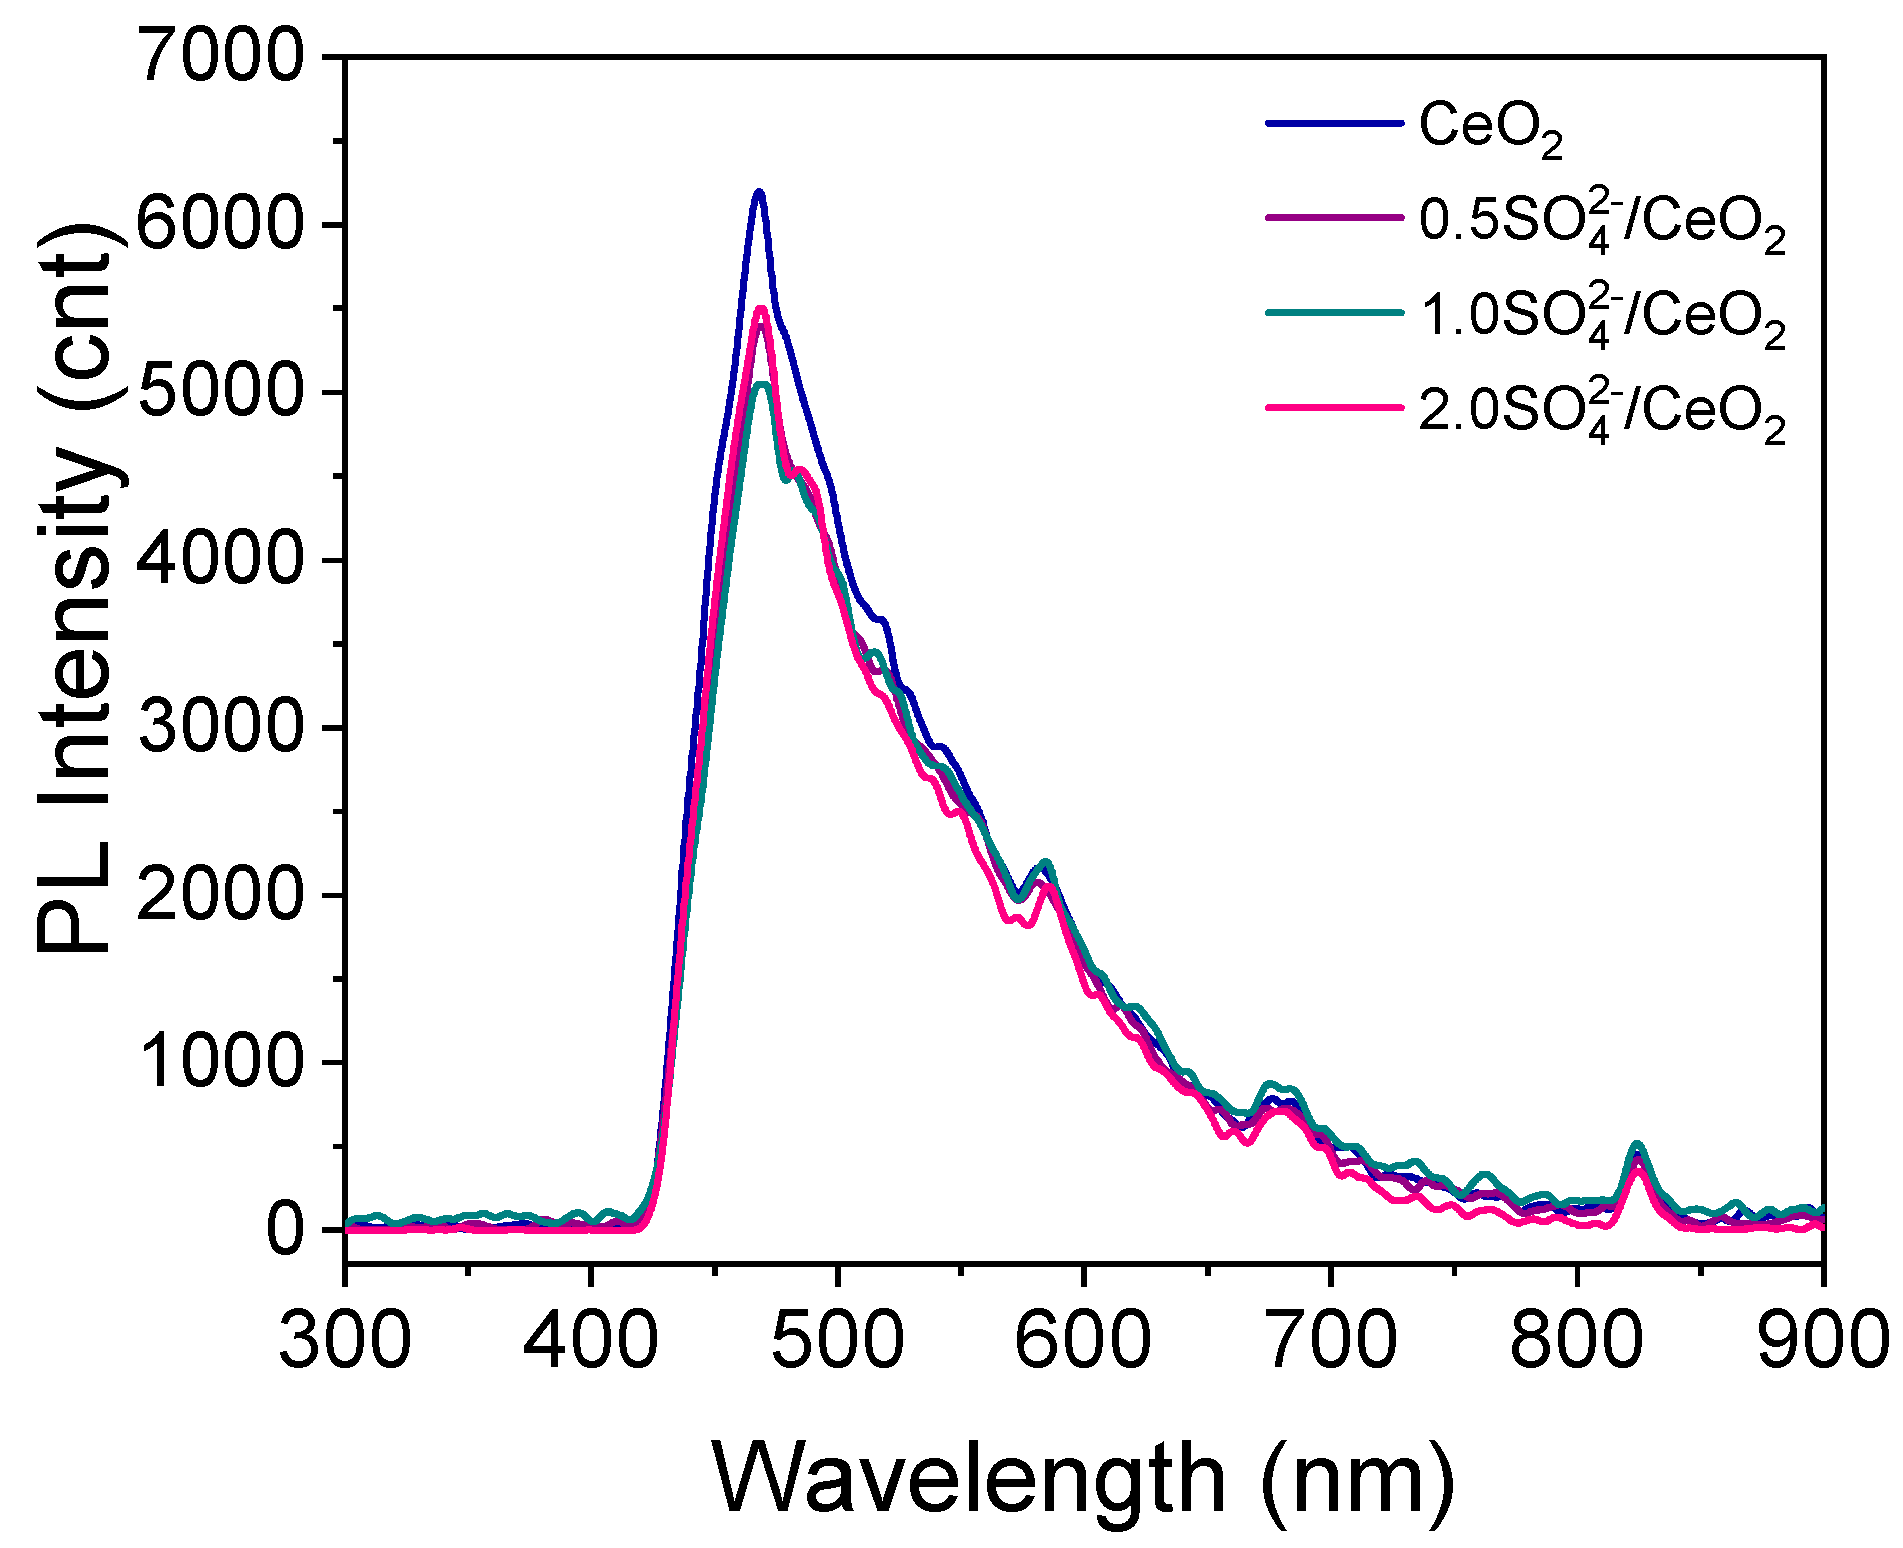
2.1. Characterization of the Photocatalysts

The crystallinity of the CeO2 support and the sulfated materials was determined through XRD analysis, as depicted in Figure 1. Characteristic X-ray diffraction signals of cerium dioxide were detected at 2θ angles of 28.2°, 32.4°, 47.0°, 55.9°, 58.5°, 69.0°, 76.5°, and 78.8°. These signals correspond to the pure cubic fluorite structure characteristic of CeO2 (JCPDS 34-0394).
Furthermore, as shown in Figure 1, no shifts in diffraction signals are observed in the sulfated materials compared to the photocatalytic support. This could suggest that the bulk structure of CeO2 does not change during the sulfation procedure. It is crucial to note that substituting Ce4+ ions (with an ionic radius of 0.092 nm) with S6+ ions (with an ionic radius of 0.029 nm), which could be originated from the sulfuric acid used in the impregnation process of the support, would probably promote shifts in the diffraction signal towards higher angles, suggesting lattice contraction. Consequently, to corroborate the surface modification of the CeO2 support, lattice parameter values were calculated and included in Table 1. As observed, there is no change in the edges, confirming that no substitutions of oxygen or cerium by sulfide ions have occurred.
Figure 2 presents nitrogen adsorption–desorption isotherms for the CeO2 support and SO42−/CeO2 photocatalysts. According to the IUPAC classification, typical type IV(a) isotherms were observed in the samples associated with mesoporous solids [6]. A hysteresis loop of type H2 (b) was observed in the isotherms of the support and the materials sulfated with 0.5 and 1.0% anion content, characteristic of materials featuring pores with a narrow distribution in the body and a broad distribution in neck size [16]. However, a detailed observation of the desorption branch in the isotherm corresponding to the 2.0SO42−/CeO2 material shows a H2 (a) hysteresis loop, indicating a narrow distribution of pore neck widths, resulting in a very pronounced desorption branch, possibly due to the amount of H2SO4 and the pH reached during the synthesis of the material [17].
The surface areas and pore size values calculated for the materials studied are listed in Table 1. The modification of the CeO2 support with sulfate ions promotes an increase in surface areas. Literature reports indicate that sulfated metal oxides, such as TiO2 [18], ZrO2 [19], and SnO2 [20], present a higher surface area compared to the unmodified material. These results are associated with the dispersed sulfate species on the surface, which prevent the agglomeration of metal oxide particles, leading to a reduction in crystallite size and consequently an increase in the surface area [21].
Figure 3 presents the ATR-FTIR spectra of the CeO2 support and the sulfated materials. ATR-FTIR analysis was conducted to confirm the presence of sulfate groups in the sulfated ceria catalyst and to assess the effect of sulfate ion concentration on the intensity of the band for each functional group of the synthesized catalyst. The CeO2 support presents a small band around 3720 cm−1, corresponding to isolated hydroxyl groups. At approximately 3360 cm−1, a broadband corresponding to the stretching vibration of the O-H bond of adsorbed water molecules was identified [22]. Additionally, the band near 1634 cm−1 is attributed to the bending vibration of the hydroxyl group assigned as chemisorbed water; this band increases in intensity, which could be associated with a more hydroxylated surface as sulfate content increases, in line with the previously described surface area results [23]. The increase in the surface hydroxylation could be associated with the negative charges of the sulfate ions anchored on the surface of CeO2, which attracts water molecules. It is important to consider that the presence of hydroxylated surfaces is desirable in photocatalytic processes because the surface hydroxyls could experience oxidation reactions with the photogenerated holes in the semiconductor and favor both the decrease in the recombination frequency of the charge carriers and the formation of hydroxyl radicals, which are mainly responsible for the degradation of organic contaminants [24,25].
The stretching vibration of Ce-O-Ce bonds becomes evident in the band at 1320 cm−1, whose intensity decreases with the increase in the sulfate ion content impregnated in the material. The stretching vibration mode of the Ce-O bond of CeO2 nanoparticles is shown in the band at 610 cm−1. Regarding the sulfated photocatalysts, their spectra reveal a band near 1110 cm−1, corresponding to the vibration of the S=O group of sulfate species, which exhibits a characteristic band between 1222 cm−1 and 1100 cm−1. Furthermore, bands between 1057 cm−1 and 994 cm−1 are attributed to the stretching vibrations in symmetric and asymmetric modes of the S-O bonds [23]. The presence of these bands confirms the sulfation process and indicates the bidentate coordination of the sulfate groups to the metal atom of the support [26,27]. Besides, the decrease in the intensity of the band located at 1320 cm−1 mentioned previously could be a consequence of the surface sulfation of the semiconductor, which would inhibit the vibration of the Ce-O-Ce bonds.
The UV–Vis spectra of the CeO2 support and the sulfated materials are shown in Figure 4a. The typical absorption region of the CeO2 semiconductor was observed around 420 nm. Two bands at 228 and 280 nm, corresponding to the direct charge transition between the Ce4+ and O2− states, are evident [28].
The Tauc plot as a function of absorbed light energy is depicted in Figure 4b. The values of the bandgap energy (Eg) were calculated through linear fitting with the energy axis and are presented in Table 1. As observed, the modification of the support with sulfate anions promoted a slight blue shift in the UV–Vis spectra, which suggests a slight increase in the value of Eg (CeO2 3.00 eV and sulfated CeO2 materials 3.08 eV), which is consistent with the decrease in crystallite size in the sulfated materials, as evidenced by X-ray diffraction analyses. It is widely recognized that the increase in the energy of the band gap with the decrease in crystallite size is associated with the quantum confinement effect (particle sizes less than 10 nm), which favors the presence of discrete energy levels [29,30].
Furthermore, based on these results, the insertion of sulfide ions into the CeO2 lattice can be ruled out, as such a modification in the crystal structure would lead to a decrease in the energy of the band gap [31]. Thus, the surface sulfation of the semiconductor in the materials evaluated in this study is confirmed. On the other hand, the increase in sulfate ion content on the material surface does not produce significant variations in the values of Eg.
The results of the thermal analysis of the materials coupled with mass spectroscopy (TGA-MS) are shown in Figure 5. The TGA-MS of the uncalcined CeO2 support is shown in Figure 5a; the mass loss between 50–200 °C is associated with the desorption of adsorbed water and ammonia remaining following the support synthesis [32,33]. CO2 was released during the various mass-loss steps between 110–250 °C and 310–460 °C. In addition, at temperatures ranging from 200 to 460 °C, the dehydration of water strongly bound to the surface of the nanoparticles occurs, generating a network of water and dehydroxylation of surface OH groups [34]. The mass loss recorded at the end of the process was 19%.
In Figure 5b, the thermogram of the photocatalyst 1.0SO42−/CeO2 is shown. The removal of adsorbed water from the material is observed at a temperature close to 200 °C, resulting in a mass loss of 6.2%. In addition, the release of residual ammonia following the synthesis was seen. The CO2 released in this material is significantly lower than in the support considering that the impregnation of the anions occurred on the calcined CeO2 support. Additionally, another stage in the thermogram is evident, corresponding to the loss of sulfates from the material at higher temperatures (500–800 °C); the SO42− ions from the sulfated sample are released in the form of SO2 and SO [23], which were confirmed by MS analysis. The mass loss recorded at the end of the process was 10%. The difference in total mass loss between the uncalcined CeO2 support and the sulfated material can be attributed to changes in the chemical composition of the materials, due to the surface modification of the support with sulfate anions carried out on the calcined CeO2.
The recombination of the photogenerated electron–hole pairs is a critical factor to consider in photocatalysis and likely the most significant one, as it prevents the oxidation–reduction processes from taking place. To understand the behavior of the photogenerated charge carriers in the materials, photoluminescence spectra were obtained for the CeO2 support and the sulfated solids (Figure 6).
The photocatalytic materials exhibited a fluorescence emission signal at 468 nm when excited using a fixed wavelength of 254 nm. The emission band ranging from 360 nm to 530 nm is attributed to the presence of defects related to the Ce 4f and O 2p states [35,36]. As can be seen, the CeO2 support showed the signal with the highest intensity, suggesting a greater charge recombination capacity. Conversely, the 1.0 wt.% sulfated material evidenced an emission signal with lower intensity compared to the other materials, which is associated with a lower capacity for electron–hole pair recombination in the semiconductor. This result suggests that the 1.0SO42−/CeO2 material is likely to exhibit the best photocatalytic behavior in the degradation of the herbicide 2,4-D, as it favors a decrease in the charge carrier recombination rate [37].

2.2. Evaluation of the Photocatalytic Activity

The photocatalytic behavior of CeO2 support and sulfated materials was evaluated in the degradation of the 2,4-dichlorophenoxyacetic acid (2,4-D) herbicide using UV radiation.

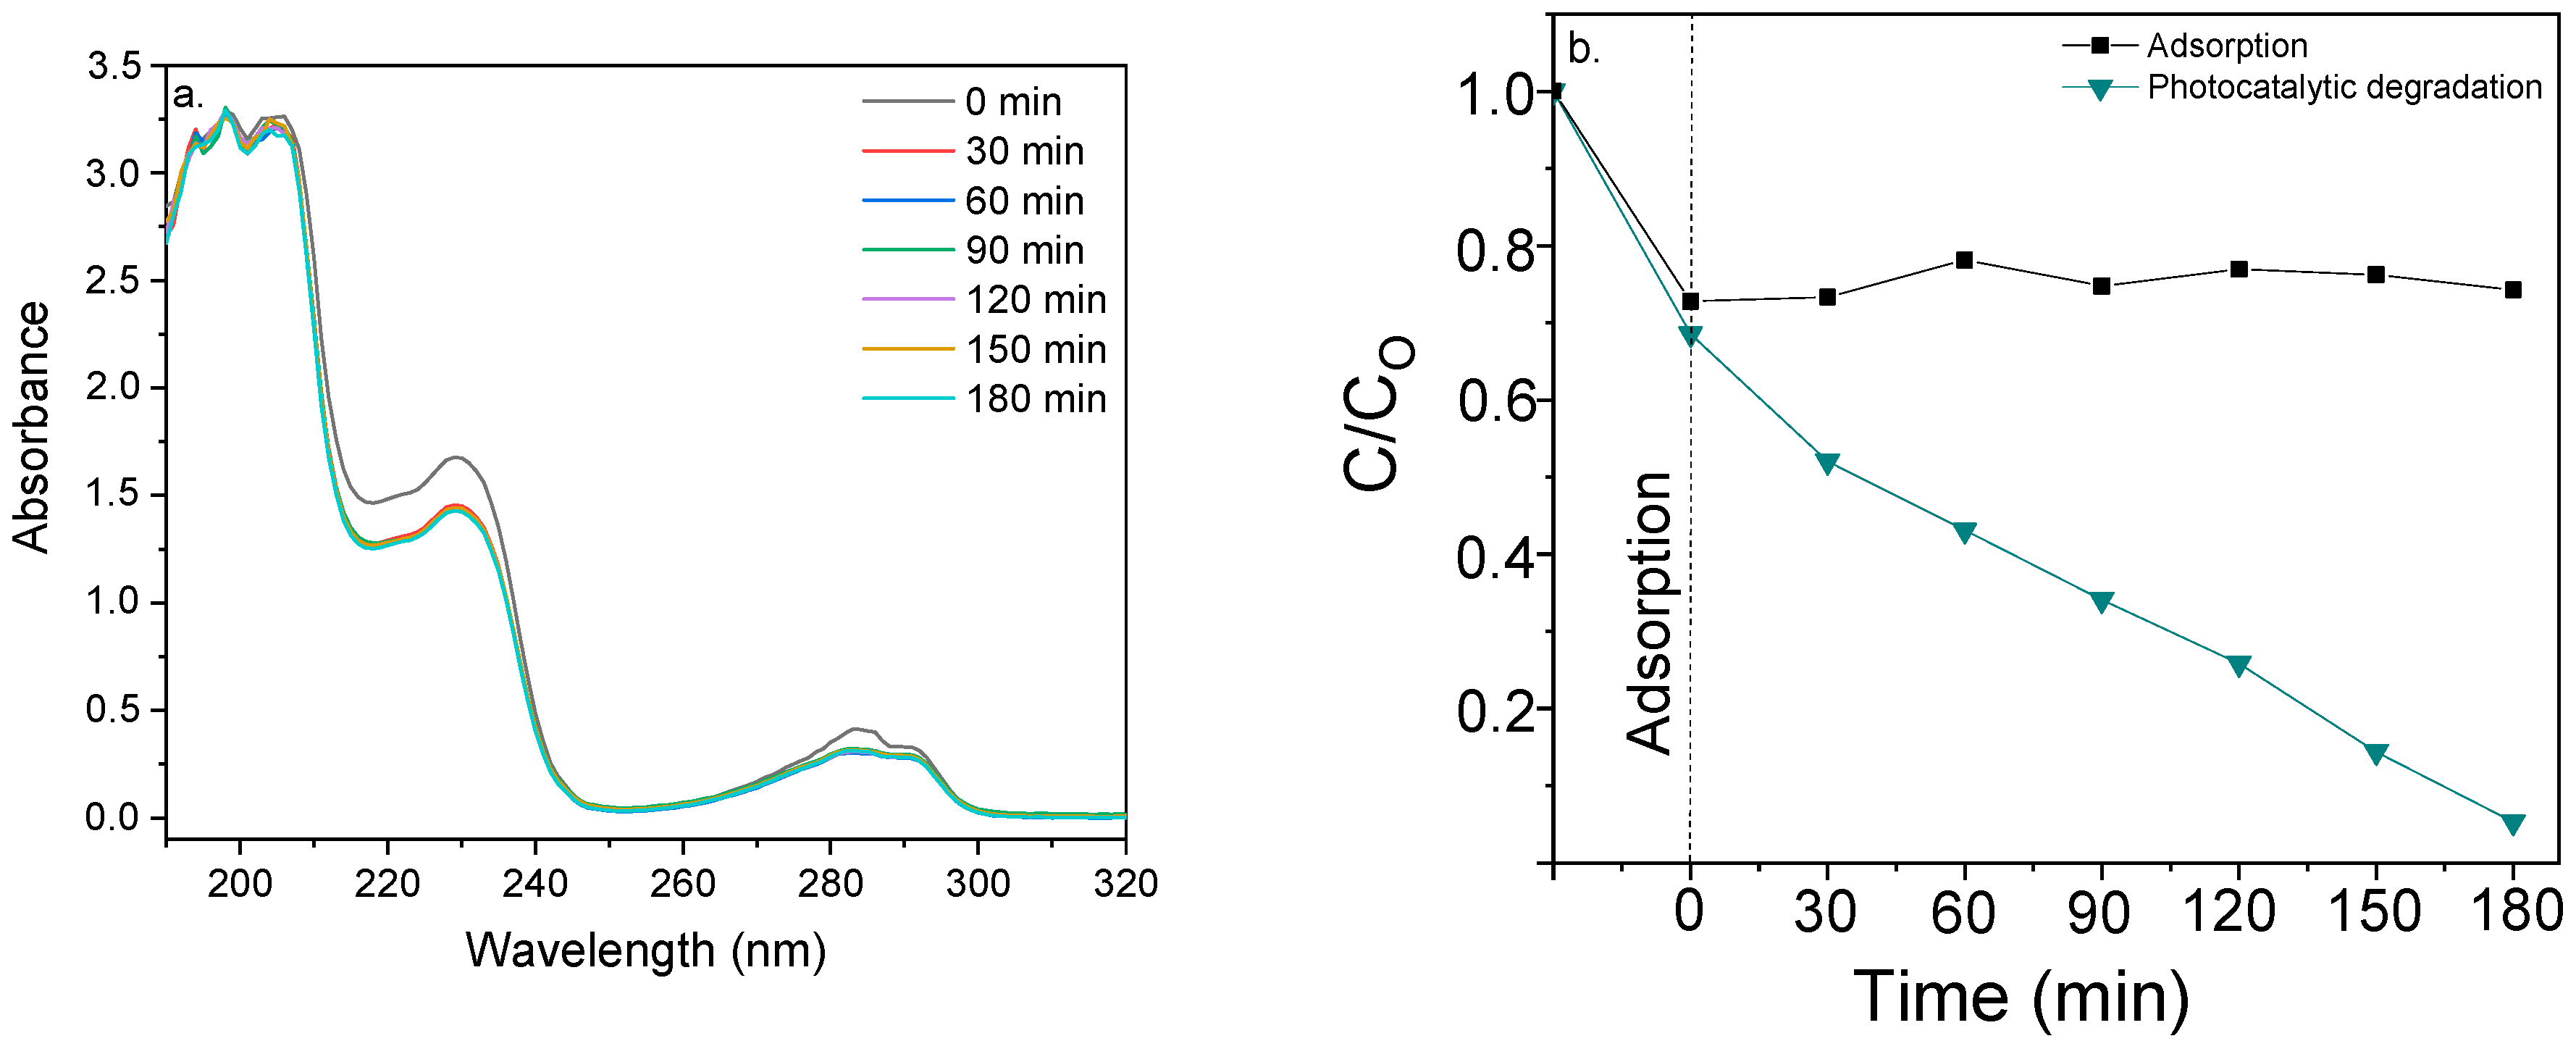
Photocatalytic Degradation of 2,4-Dichlorophenoxyacetic Acid

The ultraviolet absorption spectra corresponding to the degradation monitoring of 2,4-dichlorophenoxyacetic acid using the 1.0SO42−/CeO2 photocatalyst are presented in Figure 7a. The absorption bands identified at 203 and 227 nm are associated with the π→π* transition of the aromatic ring, while the band located at 282 nm is related to n→π* transitions [38,39]. As the reaction progresses, a decrease in the intensity of the absorption band is observed, indicating herbicide degradation.
The variation of the relative concentration of 2,4-dichlorophenoxyacetic acid with reaction time is presented in Figure 7b. As observed, conducting the reaction in the absence of a photocatalytic material (photolysis) promotes a 37% degradation of the contaminant. The degradation of the molecule is contingent upon its ability to absorb incident radiation and reach an excited state, leading to bond cleavages. If the molecule does not degrade directly via photolysis, indirect degradation may occur by forming hydroxyl radicals from water [40,41]. In the presence of the photocatalysts, a reduction in the herbicide concentration is observed during the irradiation time. After 180 min of reaction, a degradation of the contaminant of approximately 87%, 87%, 95%, and 88% was achieved using CeO2, 0.5SO42−/CeO2, 1.0SO42−/CeO2, and 2.0SO42−/CeO2, respectively.
As can be seen in Figure 7b, the 1.0SO42−/CeO2 material shows significant adsorption at 30 min in the dark. To confirm the behavior of the sulfated material with an anion content of 1.0 wt.% in the adsorption process, the herbicide degradation reaction was conducted under the experimental conditions described in the methodology, in the absence of radiation. The results indicated that after 30 min of reaction, the pollutant was adsorbed by the material; however, no further decrease in concentration was observed over time. This suggests that the material has reached its adsorption equilibrium or maximum capacity, and extending the time in the dark may not lead to a significant reduction in herbicide concentration. UV spectra of the 2,4-D adsorption using the 1.0SO42−/CeO2 photocatalyst and the comparison between the adsorption and the photocatalytic degradation of the herbicide are shown in Figure 8.
Based on the results obtained from the evaluation of the photocatalytic behavior of the studied materials, it was observed that the degradation of 2,4-D acid follows a first-order kinetic behavior. The values of the kinetic constants, as well as the half-life time (t1/2) and the coefficient of linearization R2, are detailed in Table 2.
As can be seen, a higher photodegradation rate and a shorter half-life time (t1/2) were recorded when using the 1.0SO42−/CeO2 photocatalyst. The reaction rate constant when employing the material with a 1.0 wt.% anion content is 1.6 times higher than that obtained using the CeO2 support, indicating that sulfation enhances the degradation rate of the contaminant.
Mineralization of the contaminant was analyzed by measuring the percentage of residual total organic carbon (TOC) content after 180 min of reaction. Conducting the reaction in the absence of a photocatalyst results in approximately a 2% TOC removal; however, using CeO2 as a support promotes a 28% removal. On the other hand, employing modified materials achieves a TOC removal of 25%, 50%, and 31% for 0.5SO42−/CeO2, 1.0SO42−/CeO2, and 2.0SO42−/CeO2, respectively.
Based on the results obtained, the suitability of modifying the CeO2 support via surface sulfation was confirmed, as it enhanced its photocatalytic properties, resulting in increased effectiveness in degrading the contaminant and the percentage of mineralization of this herbicide. Additionally, it was shown that a 1% sulfate anion content is optimal for promoting higher photodegradation of the compound. Through FTIR results, it was possible to confirm the bidentate coordination of the SO42− groups on the semiconductor surface, which could act as electron collectors during photocatalytic activation, thereby decreasing carrier velocity and increasing herbicide degradation.
In this regard, the photocatalytic degradation of the herbicide 2,4-D using the 1.0SO42−/CeO2 material is depicted in Figure 9. Once the photocatalyst is irradiated, electron–hole pairs are generated; the photogenerated electrons are attracted to the sulfate groups anchored on the semiconductor surface, acting as trap centers for these charge carriers. Adsorbed oxygen (O2) is then reduced through interaction with the electrons, leading to the formation of superoxide radicals (O2●−). Consequently, the photogenerated holes remain available in the semiconductor to undergo reactions with hydroxyl groups from water, facilitating the formation of hydroxyl radicals (OH), which are responsible for degrading the organic contaminant.
However, the results also demonstrated that sulfate anion concentrations exceeding 1.0 wt.% exert a negative effect on the photoactivity. This could be attributed to a significant coverage of the active sites on the semiconductor, hindering effective interaction between the contaminant and the photocatalyst. Similar findings have been observed by other researchers in sulfated metal oxide materials [42].

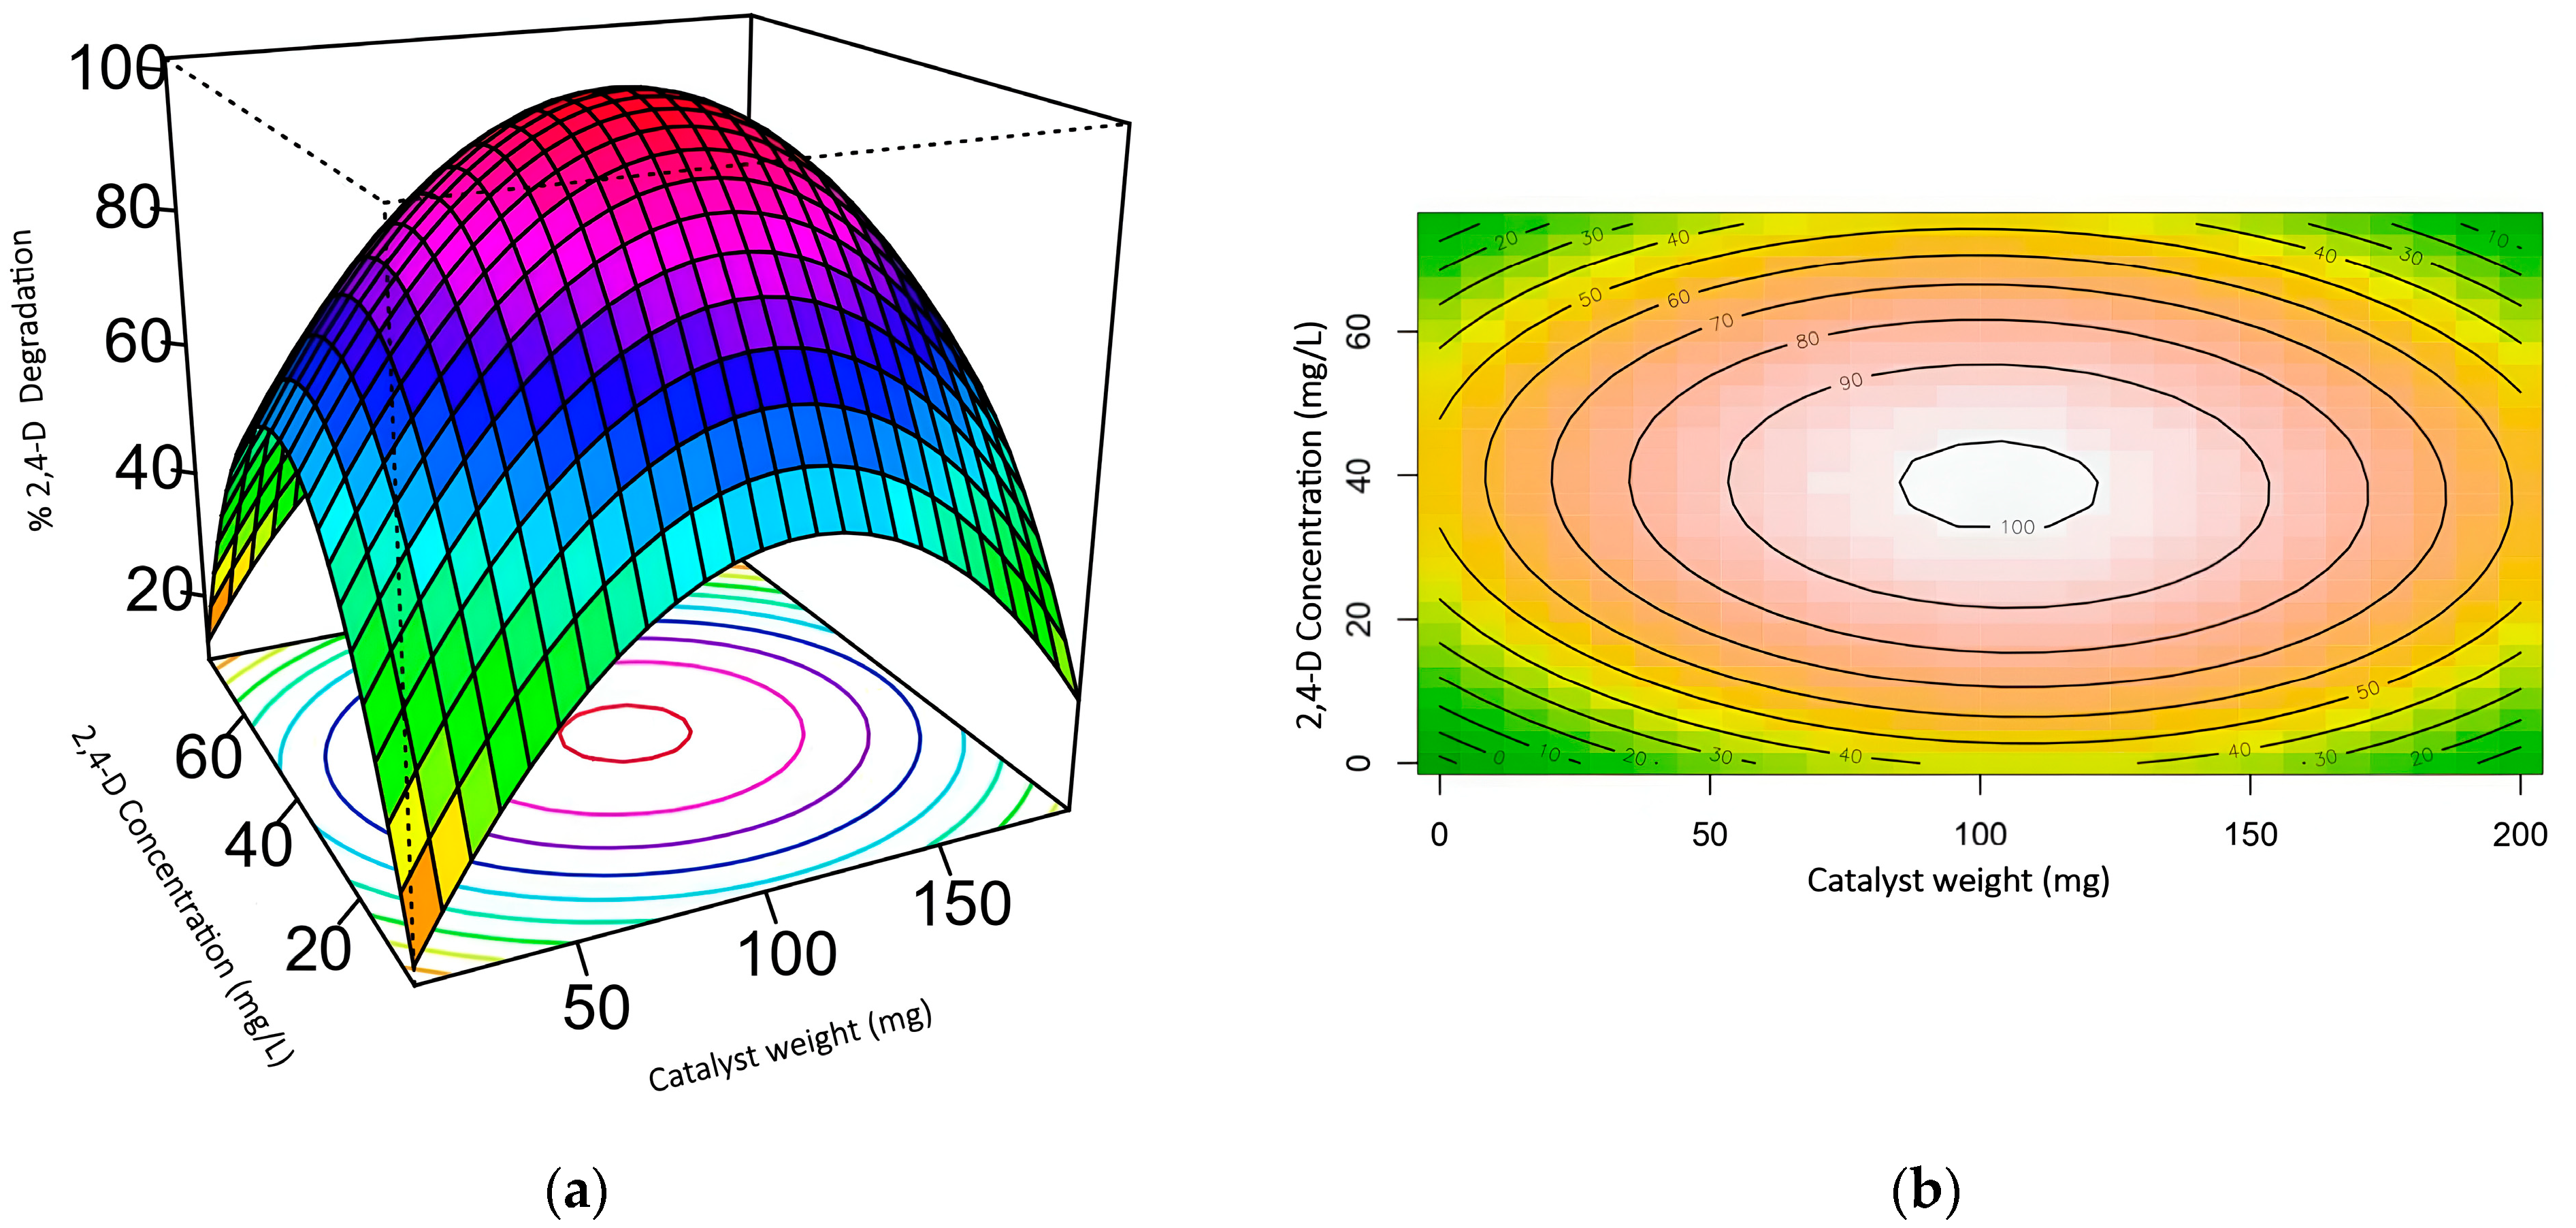
2.3. Response Surface Methodology (RSM)

The randomly chosen photocatalyst was 1.0SO42−/CeO2, which was utilized in the central composite design with a constant reaction time of 180 min. Experiments were randomized using the following code in RStudio software (https://posit.co/download/rstudio-desktop/). Several models were explored, and among them, the one showing the best fit was obtained from the CCD matrix. This matrix was constructed with the 13 randomized experiments, and the results along with predicted values are detailed in Table 3.
Values exceeding a 10% error may be attributed to significant changes in reaction conditions. These changes can induce effects external to the reaction itself. For example, an excess of material may lead to shielding phenomena in the reaction, resulting in not only photocatalytic but also catalytic processes, altering the degradation mechanisms of the molecule [43]. In situations where there is an excess of photons and a shortage of material capable of capturing them and generating charged species responsible for degrading the contaminant, the removal efficiency of the contaminant is limited [44]. Additionally, at low contaminant concentrations, the interaction between it and the photocatalyst may be restricted due to the limited availability of contaminant molecules, competition with other species, secondary reactions, and reduced quantum efficiency, resulting in limited removal efficiency of the contaminant through photocatalytic processes [43]. On the other hand, discrepancies between calculated and experimental values may be due to random laboratory errors. These errors, occurring unpredictably, may result from variations in environmental conditions, fluctuations in measurement instruments, and random human errors, among other factors. Although they can be minimized, it is difficult to eliminate them, and they cannot be fully controlled.
During the analysis of variance (ANOVA), the factors under study and their interactions were explored, and their influence on the variable of interest was examined. Table A1 presents the analysis results (Appendix A), providing a detailed view of how each variable contributes to the proposed model.
Based on the data analysis an empirical quadratic equation was proposed for the photocatalytic degradation of 2,4-D using the photocatalyst 1.0SO42−/CeO2:
Y % = 22.782 + 1.0057 × M + 3.2438 × C 0.0046131 × M 2 0.040299 × C 2
In the presented equation, Y% denotes the degradation percentage, while M and C represent the catalyst mass and the contaminant concentration, respectively. Upon examining the regression coefficients in Equation (1), it is observed that the value associated with C (3.2438) is considerably larger than the value associated with M (1.0057). This suggests that the contaminant concentration (C) has a more significant impact on Y% compared to the catalyst mass (M). The analysis of the variance of the data supports this conclusion, showing an F-value for the model of 35.5 and a P-value for the model fit (0.0001973 < 0.05), confirming consistency between the proposed equation and experimental data. Furthermore, the influence of variables M and C on the degradation percentage (Y%) is depicted in Figure 10a,b, where it can be observed that the maximum value for Y% is achieved when the concentration of 2,4-D and the mass of the photocatalyst are 38.5 ppm and 103.4 mg, respectively (optimal conditions).

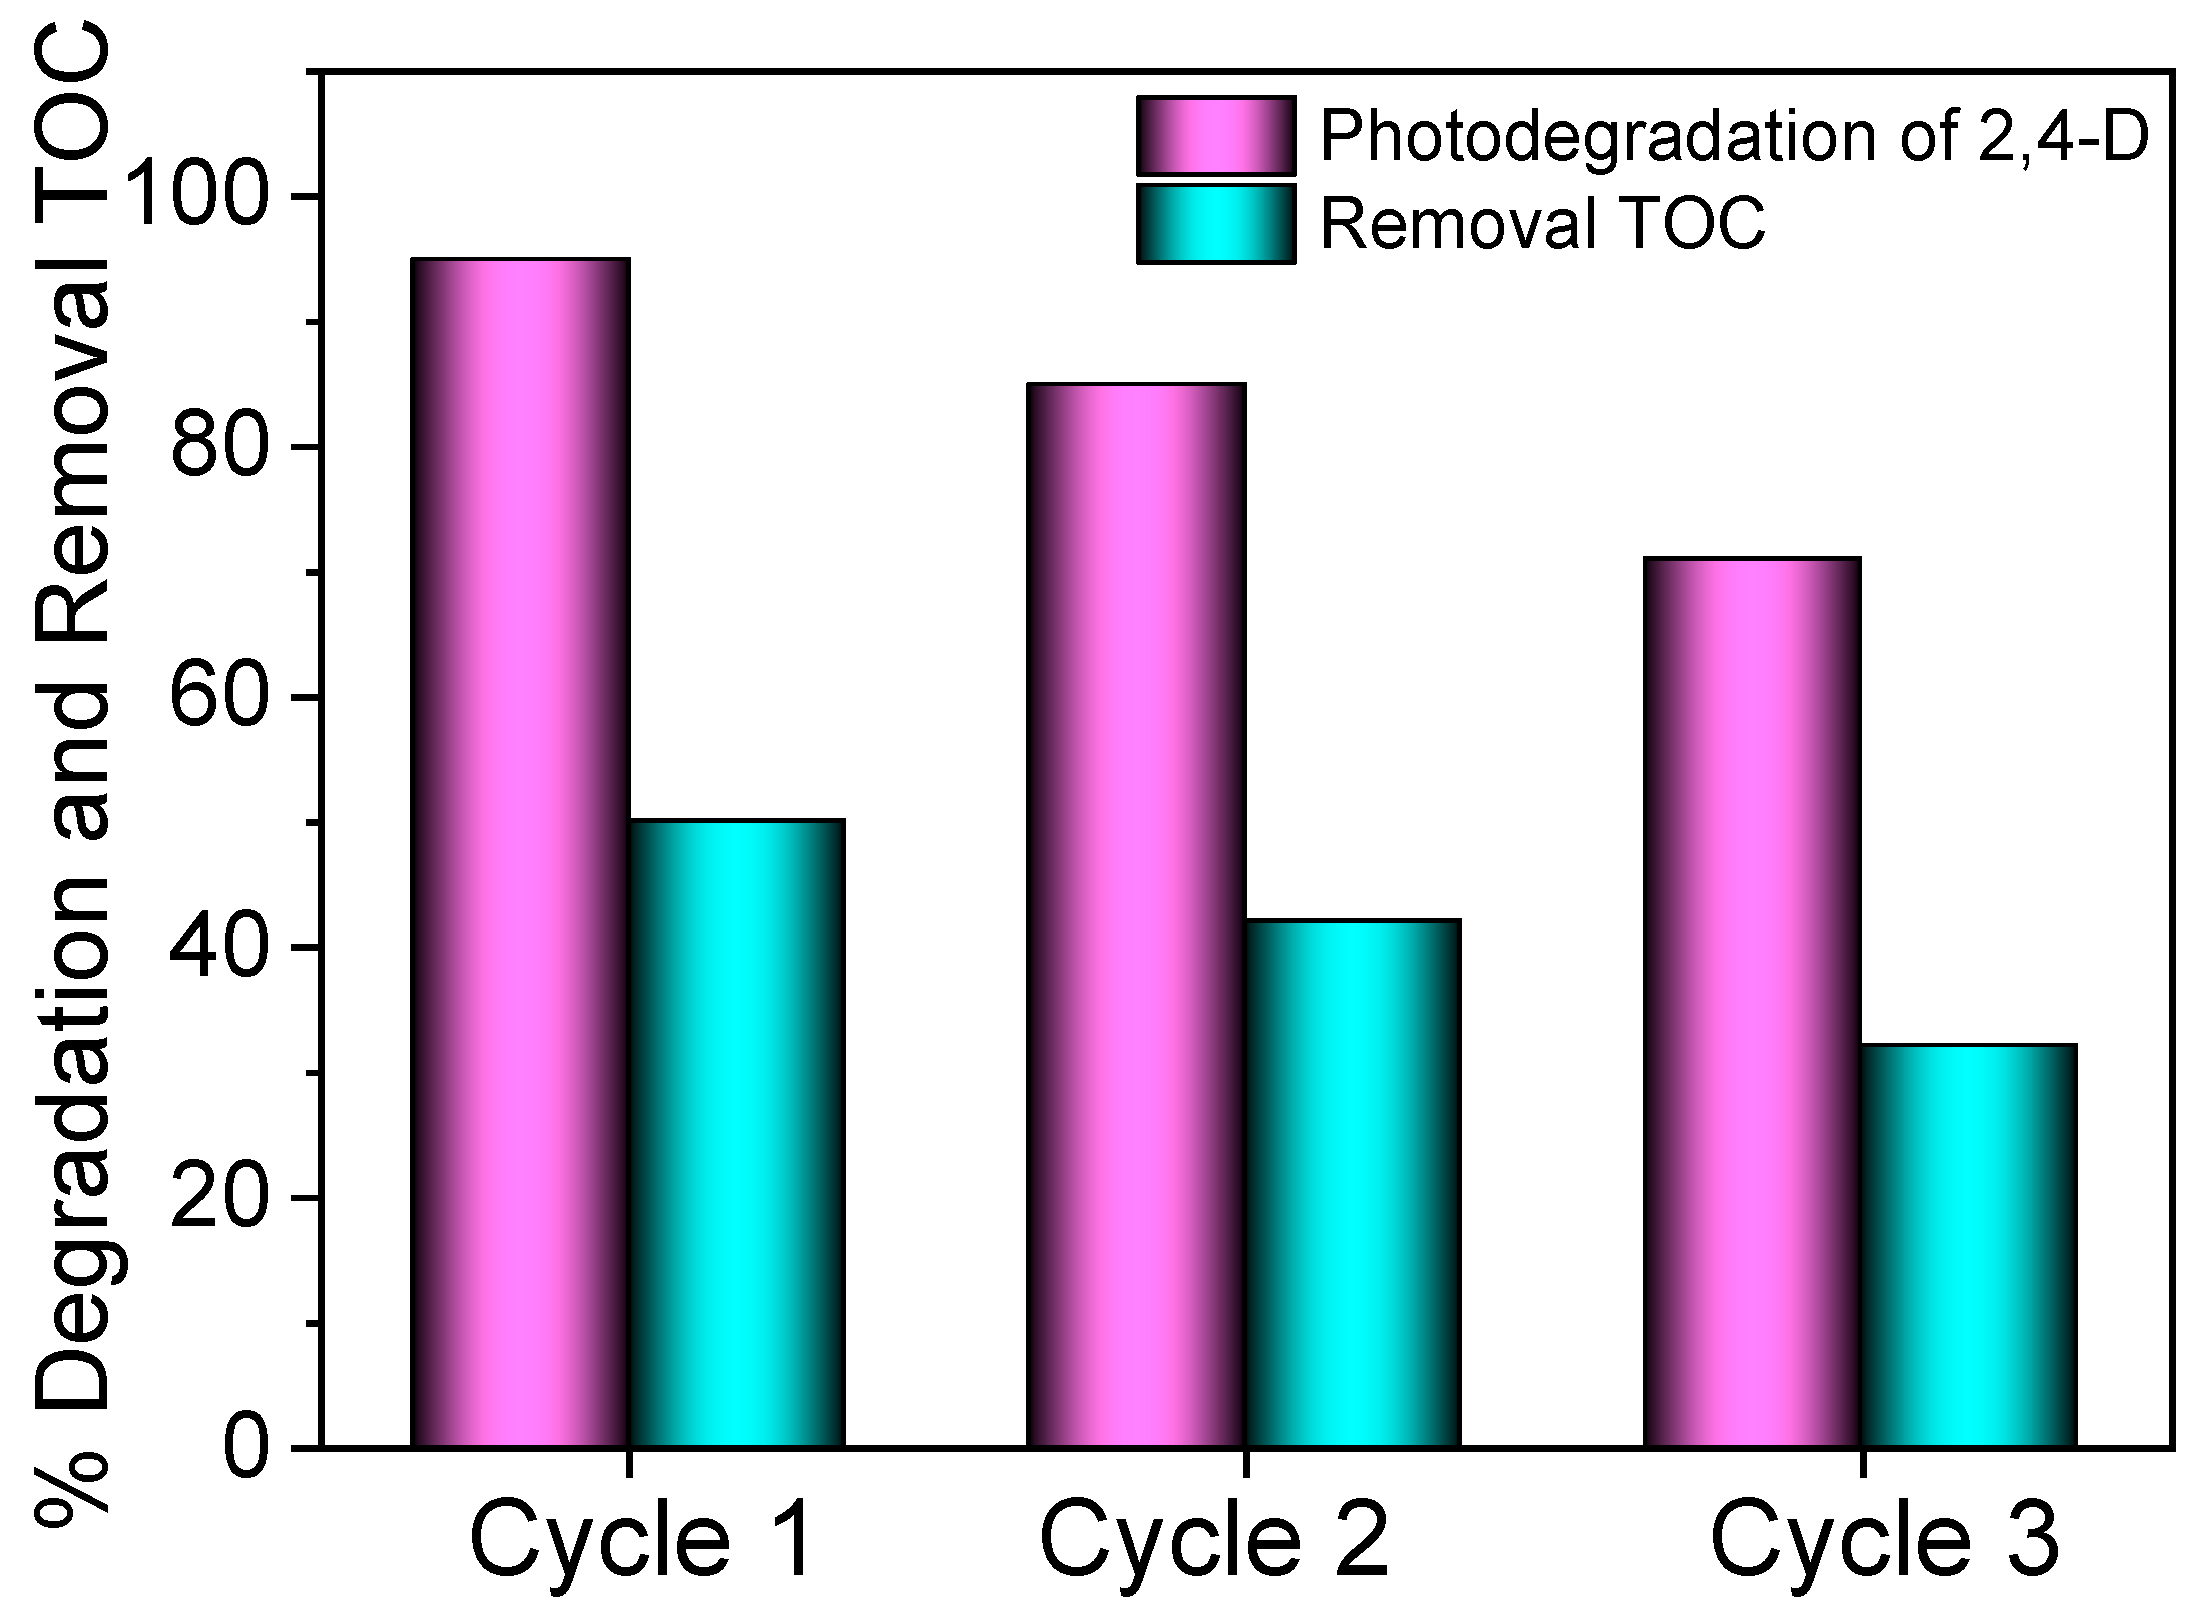
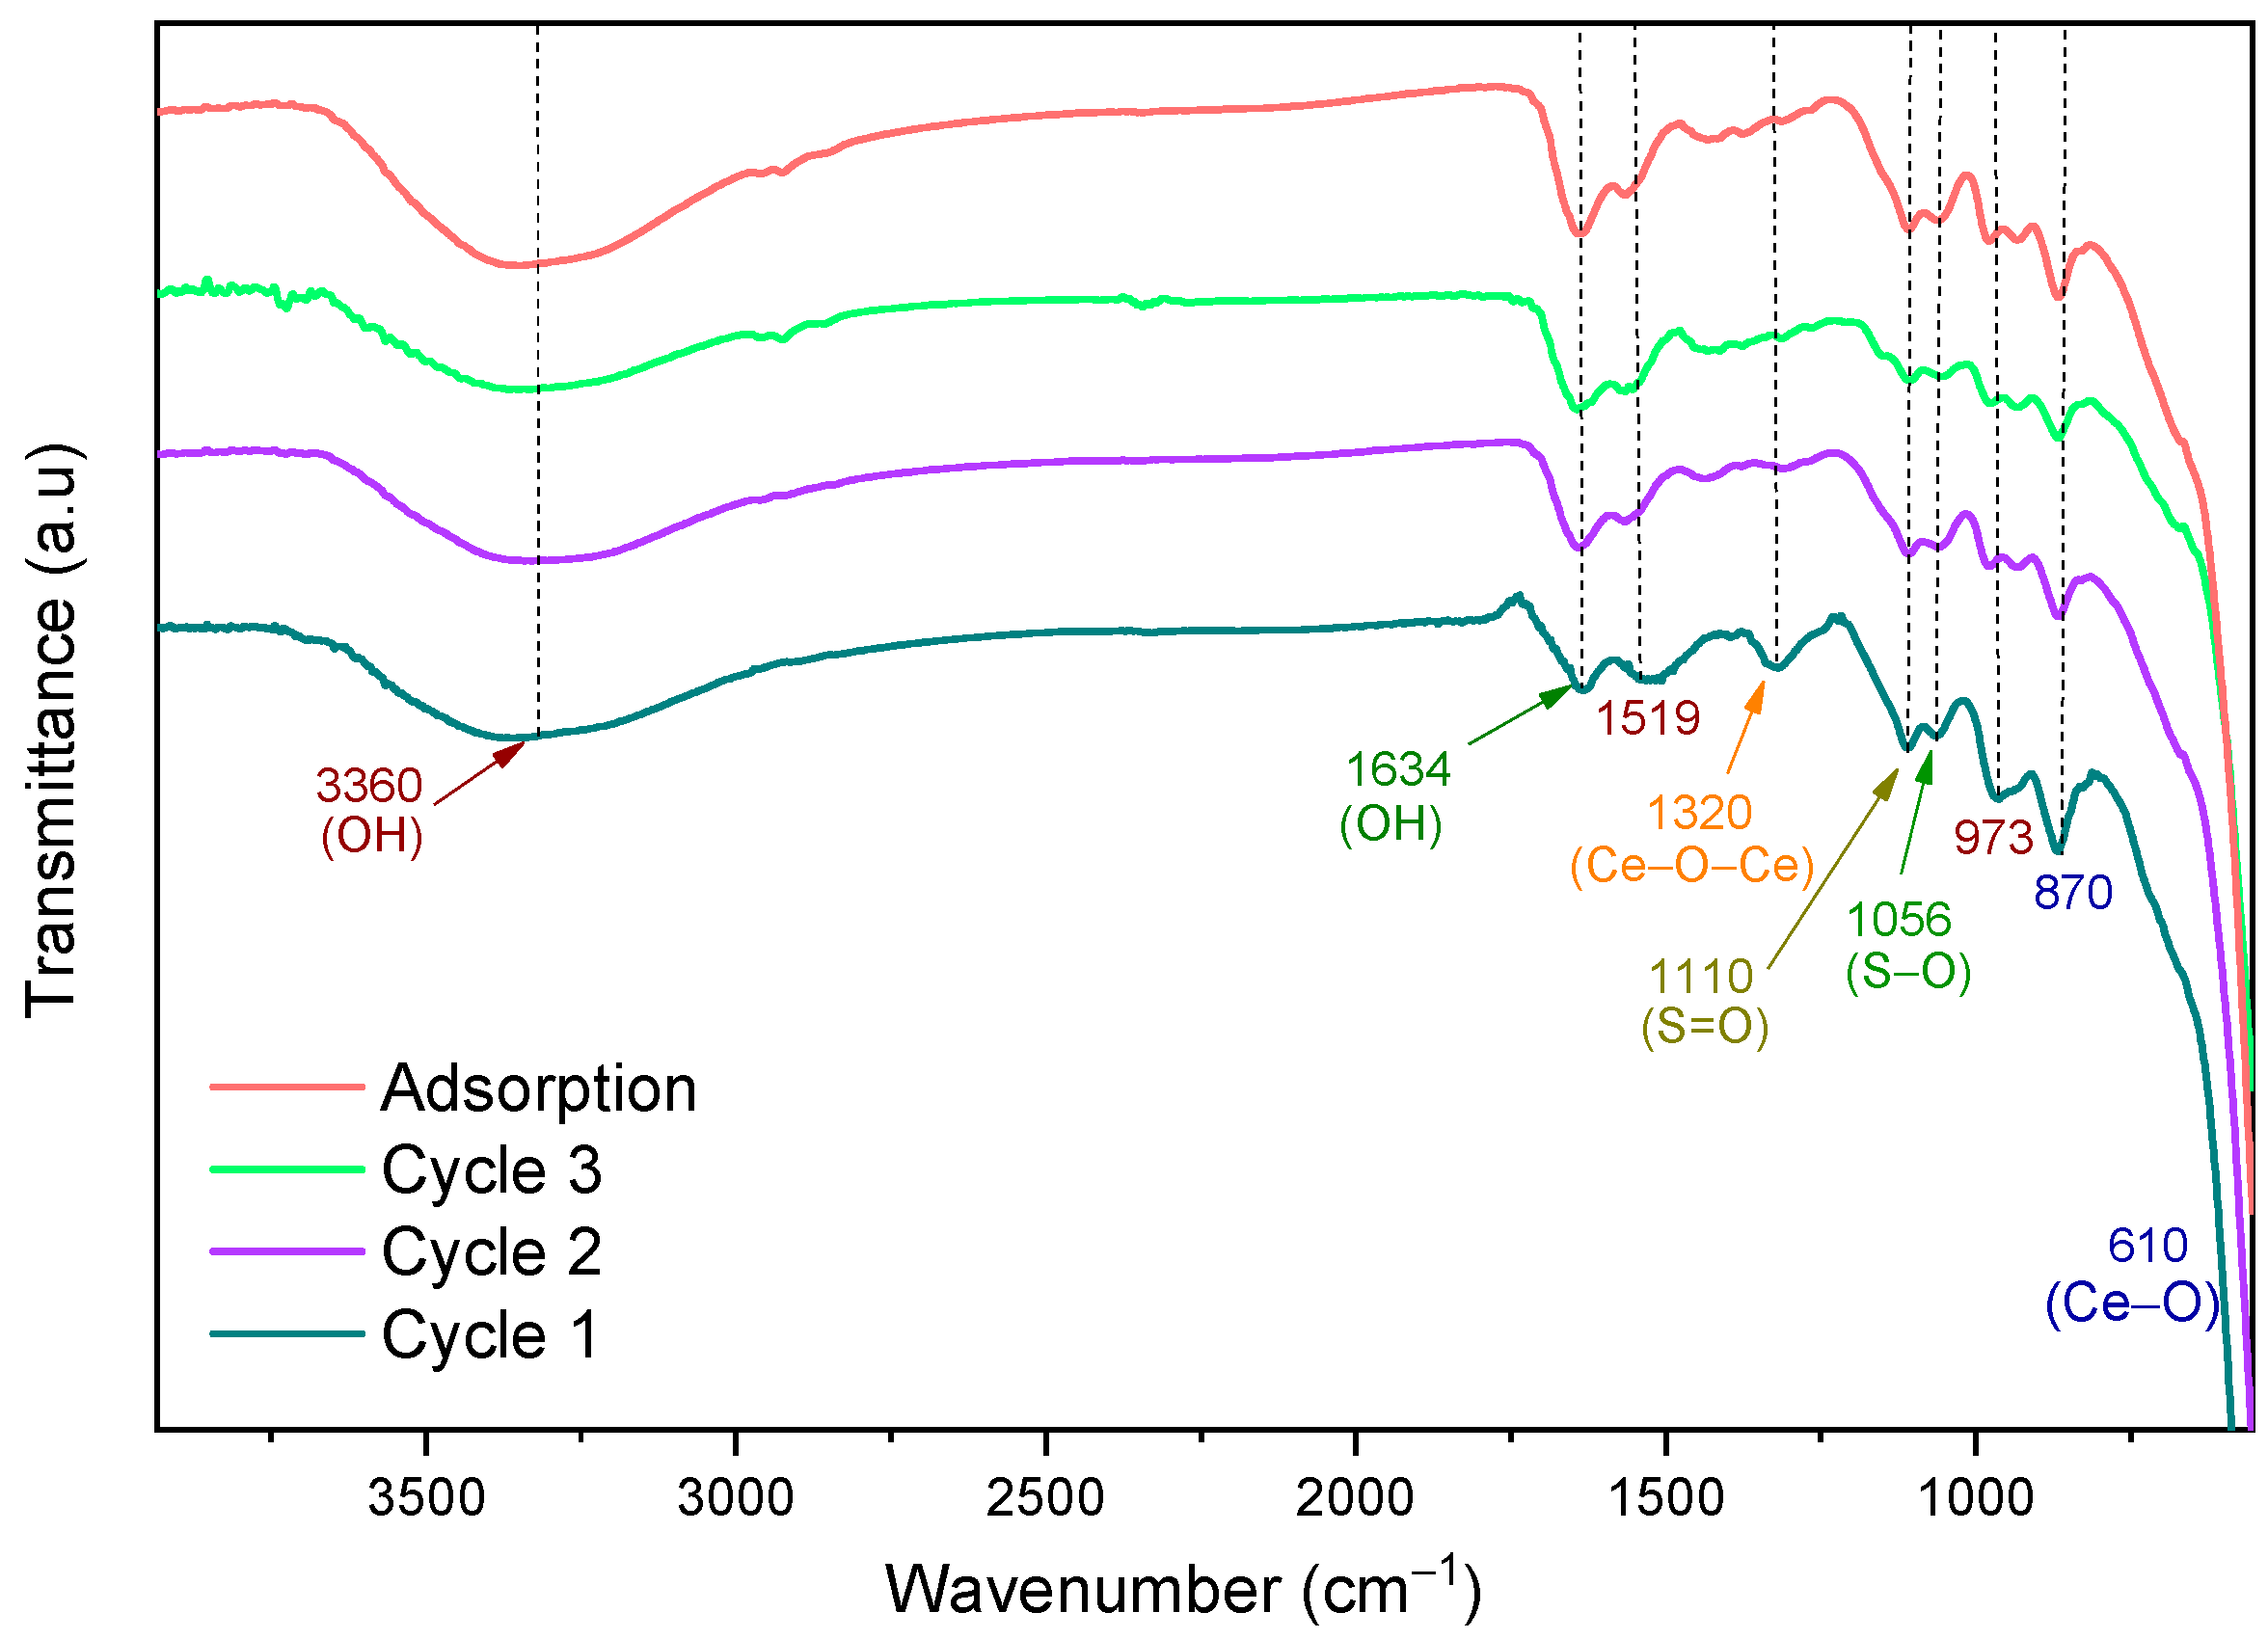
2.4. Reuse of the 1.0SO42−/CeO2 Photocatalyst in the Degradation of 2,4-Dichlorophenoxyacetic Aacid

The reusability of the 1.0SO42−/CeO2 photocatalyst was evaluated over three photocatalytic cycles under identical conditions, reintroducing the recovered solid into a new solution of 2,4-dichlorophenoxyacetic acid. The results, depicted in Figure 11, show that the photodegradation of 2,4-D experiences a decrease, with degradation percentages of 95%, 85%, and 71% for each cycle, respectively, after 180 min of reaction. In terms of the percentage of removal of the total organic carbon (TOC) content, values of 50%, 42%, and 32% were observed in the three cycles, respectively.
Figure 12 shows the ATR-FTIR spectra of the 1.0SO42−/CeO2 material reused in the cycle experiments and the material used in the adsorption test. As can be seen, the intensity of the signal associated with the vibrational mode of the Ce-O-Ce bonds at 1320 cm−1 decreases as a function of the reuse cycles.
These results could be related to the permanent adsorption of the herbicide or the degradation intermediates formed on the material surface during each reaction cycle. To corroborate this information, the ATR-FTIR spectrum of the material collected after the adsorption study was analyzed and it is shown in Figure 12. The spectrum reveals the decrease in the intensity in the signal located at 1320 cm−1, which suggests that the Ce-O-Ce sites are probably responsible for the pollutant adsorption. Thus, the progressive decrease in the percentage of degradation as the cycles increase would be related to the lower availability of the sites (Ce-O-Ce) for herbicide adsorption.

3. Materials and Methods

3.1. Synthesis of the Photocatalysts

The CeO2 support was synthesized by slowly adding a 0.33 M sodium hydroxide (NaOH) solution to a solution prepared with 4.34 g of cerium (III) nitrate hexahydrate (Ce(NO)3·6H2O) and 2.19 g of cetyltrimethylammonium bromide (CTAB) in 200 mL of distilled water. The mixture was continuously stirred at 300 rpm for 24 h. Subsequently, the solution was thermally treated at 90 °C for 3 h, forming a precipitate, which was filtered and washed using hot water. The material was dried at 100 °C for 6 h, ground, and then calcined at 450 °C for 4 h.
The sulfation procedure of the support was carried out by adding 1 g of CeO2 into a beaker and 20 mL of distilled water was added. Then, the appropriate amount of 0.1 M sulfuric acid (H2SO4) solution was added to achieve sulfate ion concentrations of 0.5%, 1.0%, and 2.0 wt.%, respectively. The solution was stirred for 12 h at 400 rpm, and subsequently dried for 12 h at 85 °C. The material was then ground to obtain a fine powder and finally calcined at 450 °C for 2 h. The catalysts were labeled as 0.5SO42−/CeO2, 1.0SO42−/CeO2, and 2.0SO42−/CeO2. The sulfate anion contents were selected based on recent studies with similar materials, where it was shown that the surface modification of the semiconductors such as TiO2 and CeO2 with sulfate, fluoride, and phosphate anions in contents higher than 2.0 or 3.0 wt.% does not cause photocatalytic activity, which is associated with a hindered effective interaction between the pollutant with the semiconductor, which leads to a decline in photoactivity [6,17,45,46].

3.2. Charactherization of the Photocatalysts

The photocatalytic materials were characterized using various techniques to determine their physicochemical properties. The crystalline structure and crystallite size of the materials were obtained from X-ray diffraction (XRD) analyses performed using a Bruker 2D Phaser instrument irradiated with Cu Kα radiation (Bruker Corporation, Billerica, MA, USA), considering the range of 10 to 80°. The textural properties of the solids were obtained through nitrogen physisorption analysis at −196 °C. For this purpose, the materials were degassed at 200 °C for 6 h and analyzed using an ASAP 2020 porosimetry instrument (Micromeritics Instrument Corporation, Norcross, Georgia, EE. UU). The values of specific surface area were calculated using the BET method, and the average pore sizes were determined using the BJH method applied to the desorption branch of the isotherms. Fourier transform infrared (FTIR) spectroscopy analyses were performed using a Thermo Scientific Nicolet iS50 FTIR spectrometer equipped with an attenuated total reflectance (ATR) device (Thermo Scientific, Waltham, MA, USA), considering a range between 4000 to 200 cm−1, a resolution of 8 cm−1, and 32 scans. The band gap energies (Eg) of the materials were determined from UV-Vis spectra obtained using an Evolution 300 spectrophotometer with a Praying Mantis accessory (Thermo Scientific, Waltham, MA, USA), in the range of 200 to 700 nm. BaSO4 was used as a reference material. Additionally, the materials were studied using thermogravimetric analysis (TGA) performed on thermal analyzer DTA DSC SETARAM 1600 (SETARAM Instrumentation, Lyon, France), in a temperature range between 20 to 800 °C, employing a heating rate of 10 °C/min. Photoluminescence analyses were conducted on the synthesized samples using a Scinco FS-2 fluorescence spectrometer (Scinco, Seoul, Republic of Korea). Excitation occurred at a wavelength of 254 nm, with readings taken within the 300 to 700 nm range.

3.3. Evaluation of the Photocatalytic Activity

The photocatalytic behavior of the series of sulfated CeO2 materials was studied in the photocatalytic degradation of the herbicide 2,4-dichlorophenoxyacetic acid (2,4-D). For this purpose, 200 mL of an aqueous solution with a concentration of 40 ppm of the herbicide and 100 mg of the photocatalyst were added to a glass reactor. The suspension was continuously stirred at 700 rpm, bubbled with airflow, and irradiated with a high-pressure mercury lamp emitting at 254 nm with an intensity of 4.4 mW, protected with a quartz tube and immersed in the solution. To achieve an adsorption–desorption equilibrium of the corresponding acid on the surface of the photocatalyst, the suspension was kept in darkness for the first 30 min of the reaction. Then, it was irradiated, and samples were taken every 30 min for 3 h. The samples were filtered using a 0.45-micron membrane filter and analyzed by UV spectrophotometry using an Evolution 300 instrument. The mineralization process was monitored by determining the samples’ residual total organic carbon (TOC) content.

3.4. Experimental Design-Data Analysis

A central composite design (CCD) and response surface methodology (RSM) were employed to model and optimize the photocatalytic degradation of 2,4-D. The variables under study were the catalyst mass (x1) and the 2,4-D concentration (x2). The percentage degradation of 2,4-dichlorophenoxyacetic acid (Y%) after 180 min of treatment was considered the response variable, according to Equation (2):
Y % = C o C t C o × 100
where Co is the initial concentration of 2,4-D in ppm and Ct is the concentration after photocatalytic treatment (ppm). In the experimental design, low (−1) and high (+1) levels were considered, as well as central points (0), for the investigated independent variables. A total of 13 experiments were conducted using this dataset to optimize the response of the percentage of photocatalytic degradation of 2,4-D.
The statistical analysis was performed using RStudio software, employing a second-order polynomial response equation (Equation (3)) to correlate the response variable with the independent variables:
y = β 0 + i = 1 k β i x i + i = 1 k β i i x i 2 + i = 1 k < j = 1 k β i j x i x j + ε
The response variable Y represents the degradation percentage, while β0 denotes the constant term. The regression coefficients, βi, βii, and βij indicate the linear, quadratic, and interaction effects, respectively, where xi and xj represent the independent variables. Additionally, ε represents the random error term in the model. The data were analyzed through an analysis of variance (ANOVA) based on the proposed model and subsequently evaluated. The precision and applicability of the polynomial model were determined using the coefficient of determination (R2, adjusted R2), while statistical significance was verified through F values (Fisher’s variation coefficient) and P-values. All terms of the model were assessed at a significance level of 95%. Additionally, response surface and contour plots were generated to visualize the interaction effects between the independent variables on the degradation of 2,4-D.

4. Conclusions

The photocatalytic activity of a series of sulfated CeO2 materials during the degradation of the herbicide 2,4-dichlorophenoxyacetic acid using ultraviolet radiation was explored. Characterization of the materials confirmed the effect of surface sulfation of the semiconductor on the textural and structural properties of the support. Specifically, the anchoring of sulfate groups on the surface of CeO2 in a bidentate mode was shown, promoting an increase in the surface area of the materials, which enhances the adsorption and subsequent degradation of the contaminant. Additionally, the role of sulfate groups as traps for photogenerated electrons was confirmed, leading to a reduction in the recombination rate of charge carriers. Finally, the effect of the percentage of sulfate anion on the photocatalytic activity was observed, with an optimal content of the anion at 1.0 wt.%, suggesting that higher amounts could generate recombination centers, leading to a decrease in herbicide degradation.

Author Contributions

Conceptualization, C.C., J.J.M., S.M., H.R., F.T. and R.G.; methodology, H.R., C.C. and J.J.M.; validation, C.C., F.T., J.J.M. and H.R.; formal analysis, F.T., C.R., C.C., E.S., J.J.M., S.M., and H.R.; investigation, C.R., R.G., F.T., C.C. and J.J.M.; writing—original draft preparation, C.C., C.R., J.J.M., H.R. and F.T.; writing—review and editing, C.C., C.R., J.J.M., H.R. and F.T.; supervision, C.C., J.J.M. and H.R.; project administration, C.C. and H.R.; funding acquisition, H.R. and C.C. All authors have read and agreed to the published version of the manuscript.

Funding

The authors express their special gratitude to the Universidad Pedagógica y Tecnológica de Colombia for its financial support in the development of this research, within the framework of project SGI 3684, and to the “CONVOCATORIA 01 DE 2024—INVESTIGAR DA MÁS” of the Vicerrectoría de Investigación y Extensión (VIE).

Data Availability Statement

The original contributions presented in the study are included in the article. Further inquiries can be directed to the corresponding authors.

Acknowledgments

Special thanks to the Ecocatalysis Group of the Universidad Autónoma Metropolitana-Iztapalapa, and the Catalysis Group of the Universidad Pedagógica y Tecnológica de Colombia.

Conflicts of Interest

The authors declare no conflicts of interest.

Appendix A

Table A1. Analysis of Variance (ANOVA).
CalculatedStandard Errort-ValuePr (>|t|)
(Intercept)−22.782 12.182−1.87010.1106605
Block 219.766 3.50745.63550.0013366
Mass1.00571.2655 × 10−17.94730.0002111
Concentration3.24383.4174 × 10−19.49197.791 × 10−5
Mass:Concentration−1.3333 × 10−31.9027 × 10−3−0.70080.5097046
Mass2−4.6131 × 10−34.9778 × 10−4−9.26738.923 × 10−5
Concentration2−4.0299 × 10−23.4945 × 10−3−11.53212.5560 × 10−5
R2 = 0.9726 R2 adjusted = 0.9452 p-value: 0.0001973
F-Statistic: 35.5
The stationary point of the response surface:
OPTIMAL CONDITIONS
Mass (mg)
103.3840
Concentration (ppm)
38.53572

References

  1. Mehdizadeh, M.; Mushtaq, W.; Siddiqui, S.A.; Ayadi, S.; Kaur, P.; Yeboah, S.; Mazraedoost, S.; K.A.Al Taey, D.; Tampubolon, K. Herbicide Residues in Agroecosystems: Fate, Detection, and Effect on Non-Target Plants. Rev. Agric. Sci. 2021, 9, 157–167. [Google Scholar] [CrossRef] [PubMed]
  2. McGinley, J.; Healy, M.G.; Ryan, P.C.; Mellander, P.E.; Morrison, L.; O’Driscoll, J.H.; Siggins, A. Batch adsorption of herbi-cides from aqueous solution onto diverse reusable materials and granulated activated carbon. J. Environ. Manag. 2022, 323, 116102. [Google Scholar] [CrossRef]
  3. Shabeer, T.A.; Saha, A.; Gajbhiye, V.; Gupta, S.; Manjaiah, K.; Varghese, E. Simultaneous removal of multiple pesticides from water: Effect of organically modified clays as coagulant aid and adsorbent in coagulation–flocculation process. Environ. Technol. 2014, 35, 2619–2627. [Google Scholar] [CrossRef] [PubMed]
  4. Acosta Santoyo, G.; Llanos, J.; Raschitor, A.; Bustos, E.; Cañizares, P.; Rodrigo, M. Performance of ultrafiltration as a pre-concentration stage for the treatment of oxyfluorfen by electrochemical BDD oxidation. Sep. Purif. Technol. 2019, 237, 116366. [Google Scholar] [CrossRef]
  5. Wang, Y.; Tian, Y.S.; Gao, J.J.; Xu, J.; Li, Z.J.; Fu, X.Y.; Han, H.J.; Wang, L.J.; Zhang, W.H.; Deng, Y.D.; et al. Complete biodegradation of the oldest organic herbicide 2,4-Dichlorophenoxyacetic acid by engineering Escherichia coli. J. Hazard. Mater. 2023, 451, 131099. [Google Scholar] [CrossRef] [PubMed]
  6. Castañeda, C.; Gutiérrez, K.; Alvarado, I.; Martínez, J.J.; Rojas, H.; Tzompantzi, F.; Gómez, R. Effective phosphated CeO2 materials in the photocatalytic degradation of phenol under UV irradiation. J. Chem. Technol. Biotechnol. 2020, 95, 3213–3220. [Google Scholar] [CrossRef]
  7. Zhang, X.; Su, L.; Kong, Y.; Ma, D.; Ran, Y.; Peng, S.; Wang, L.; Wang, Y. CeO2 nanoparticles modified by CuO nanoparticles for low-temperature CO oxidation with high catalytic activity. J. Phys. Chem. Solids 2020, 147, 109651. [Google Scholar] [CrossRef]
  8. Li, B.; Zhang, B.; Nie, S.; Shao, L.; Hu, L. Optimization of plasmon-induced photocatalysis in electrospun Au/CeO2 hybrid nanofibers for selective oxidation of benzyl alcohol. J. Catal. 2017, 348, 256–264. [Google Scholar] [CrossRef]
  9. Chang, J.; Ma, Q.; Ma, J.; Ma, H. Synthesis of Fe3O4 nanowire@CeO2/Ag nanocomposites with enhanced photocatalytic activity under sunlight exposure. Ceram. Int. 2016, 42, 11827–11837. [Google Scholar] [CrossRef]
  10. Valente, J.S.; Tzompantzi, F.; Prince, J. Highly efficient photocatalytic elimination of phenol and chlorinated phenols by CeO2/MgAl layered double hydroxides. Appl. Catal. B Environ 2011, 102, 276–285. [Google Scholar] [CrossRef]
  11. Vita, A. Catalytic Applications of CeO2-Based Materials. Catalysts 2020, 10, 576. [Google Scholar] [CrossRef]
  12. Montini, T.; Melchionna, M.; Monai, M.; Fornasiero, P. Fundamentals and Catalytic Applications of CeO2-Based Materials. Chem. Rev. 2016, 116, 5987–6041. [Google Scholar] [CrossRef] [PubMed]
  13. Patil, S.M.; Deshmukh, S.P.; More, K.V.; Shevale, V.B.; Mullani, S.B.; Dhodamani, A.G.; Delekar, S.D. Sulfated TiO2/WO3 nanocomposite: An efficient photocatalyst for degradation of Congo red and methyl red dyes under visible light irradiation. Mater. Chem. Phys. 2019, 225, 247–255. [Google Scholar] [CrossRef]
  14. Zhao, Y.; Li, J.; Wang, L.; Hao, Y.; Yang, L.; He, P.; Xue, J. Preparation and Characterization of Sulfated TiO2/Zeolite Composite Catalysts with Enhanced Photocatalytic Activity. Nano 2018, 13, 1850117. [Google Scholar] [CrossRef]
  15. Svensson, F.G.; Österlund, L. Adsorption and Photo-Degradation of Organophosphates on Sulfate-Terminated Anatase TiO2 Nanoparticles. Catalysts 2023, 13, 526. [Google Scholar] [CrossRef]
  16. Cychosz, K.A.; Thommes, M. Progress in the Physisorption Characterization of Nanoporous Gas Storage Materials. Engineering 2018, 4, 559–566. [Google Scholar] [CrossRef]
  17. Castañeda, C.; Tzompantzi, F.; Gómez, R.; Rojas, H. Enhanced photocatalytic degradation of 4-chlorophenol and 2,4-dichlorophenol on in situ phosphated sol-gel TiO2. J. Chem. Technol. Biotechnol. 2016, 91, 2170–2178. [Google Scholar] [CrossRef]
  18. Gómez, R.; López, T.; Ortiz-Islas, E.; Navarrete, J.; Sánchez, E.; Tzompanztzi, F.; Bokhimi, X. Effect of sulfation on the photo-activity of TiO2 sol–gel derived catalysts. J. Mol. Catal. A Chem. 2003, 193, 217–226. [Google Scholar] [CrossRef]
  19. Reddy, P.S.; Sudarsanam, P.; Mallesham, B.; Raju, G.; Reddy, B.M. Acetalisation of glycerol with acetone over zirconia and promoted zirconia catalysts under mild reaction conditions. J. Ind. Eng. Chem. 2011, 17, 377–381. [Google Scholar] [CrossRef]
  20. Khder, A.S.; El Sharkawy, E.A.; El Hakam, S.A.; Ahmed, A.I. Surface characterization and catalytic activity of sulfated tin oxide catalyst. Catal. Commun. 2007, 9, 769–777. [Google Scholar] [CrossRef]
  21. Marlowe, J.; Acharya, S.; Zuber, A.; Tsilomelekis, G. Characterization of Sulfated SnO2-ZrO2 Catalysts and Their Catalytic Performance on the Tert-Butylation of Phenol. Catalysts 2020, 10, 726. [Google Scholar] [CrossRef]
  22. Vinothini, R.; Tamizhdurai, P.; Mangesh, V.L.; Vanjinathan, M.; Pazhanisamy, P.; Kumaran, R.; Kumar, N.S.; Al Fatesh, A.S.; Kasim, S. Synthesis of CeO2/SO4/Ni nanoparticle with a greener perspective for the selective oxidation of propylene glycol in continuous reactor. Mol. Catal. 2023, 549, 113475. [Google Scholar] [CrossRef]
  23. Farisya, M.R.S.; Irmawati, R.; Shafizah, I.N.; Taufiq Yap, Y.H.; Muhamad, E.N.; Lee, S.L.; Salamun, N. Assessment on the effect of sulfuric acid concentration on physicochemical properties of Sulfated-Titania catalyst and glycerol acetylation performance. Catalysts 2021, 11, 1542. [Google Scholar] [CrossRef]
  24. Ghorai, T.K.; Chakraborty, M.; Pramanik, P. Photocatalytic performance of nano-photocatalyst from TiO2 and Fe2O3 by mechanochemical synthesis. J. Alloys Compd. 2011, 509, 8158–8164. [Google Scholar] [CrossRef]
  25. Castañeda, C.; Santos, D.; Hernández, J.S.; Álvarez, A.; Rojas, H.; Gómez, R.; Rajabi, F.; Martínez, J.J.; Luque, R. Efficient NiO/F–TiO2 nanocomposites for 4-chlorophenol photodegradation. Chemosphere 2023, 315, 137606. [Google Scholar] [CrossRef]
  26. Humelnicu, A.C.; Samoila, P.; Asandulesa, M.; Cojocaru, C.; Bele, A.; Marinoiu, A.T.; Sacca, A.; Harabagiu, V. Chitosan-Sulfated Titania Composite Membranes with Potential Applications in Fuel Cell: Influence of Cross-Linker Nature. Polymers 2020, 12, 1125. [Google Scholar] [CrossRef]
  27. Lefèvre, G. In situ Fourier-transform infrared spectroscopy studies of inorganic ions adsorption on metal oxides and hydroxides. Adv. Colloid Interface Sci. 2004, 107, 109–123. [Google Scholar] [CrossRef]
  28. Sumalatha, V.; Anujya, C.; Balchander, V.; Dhanalaxmi, B.; Kumar, M.P.; Ayodhya, D. Hydrothermal fabrication of n-CeO2/p-CuS heterojunction nanocomposite for enhanced photodegradation of pharmaceutical drugs in wastewater under visible-light and fluorometric sensor for detection of uric acid. Inorg. Chem. Commun. 2023, 155, 110962. [Google Scholar] [CrossRef]
  29. Chen, P. Crystal Sizes and Energy Gaps of Cerium Oxide Using Co-Precipitation Method. Mater. Sci. Appl. 2022, 13, 213–231. [Google Scholar] [CrossRef]
  30. Arora, N.; Joshi, D.P. Band gap dependence of semiconducting nano-wires on cross-sectional shape and size. Indian J. Phys. 2017, 91, 1493–1501. [Google Scholar] [CrossRef]
  31. Chen, J.; Feng, W.; Zhao, W. Anion-doped CeO2 for high-performance lithium-sulfur batteries. Appl. Surf. Sci. 2022, 584, 152613. [Google Scholar] [CrossRef]
  32. Bourja, L.; Bakiz, B.; Benlhachemi, A.; Ezahri, M.; Villain, S.; Favotto, C.; Valmalette, J.C.; Gavarri, J.R. Structural modifications of nanostructured ceria CeO2, xH2O during dehydration process. Powder Technol. 2012, 215–216, 66–71. [Google Scholar] [CrossRef]
  33. Heering, C.; Nateghi, B.; Janiak, C. Charge-Assisted Hydrogen-Bonded Networks of NH4+ and [Co(NH3)6]3+ with the New Linker Anion of 4-Phosphono-Biphenyl-4′-Carboxylic Acid. Crystals 2016, 6, 22. [Google Scholar] [CrossRef]
  34. Afshari, B.B.; Jamshidi, M.; Rostami, M.; Ghamarpoor, R. Improving the Mechanical/Anticorrosive Properties of a Nitrile Rubber-Based Adhesive Filled with Cerium Oxide Nanoparticles Using a Two-Step Surface Modification Method. ACS Omega 2022, 7, 44912–44927. [Google Scholar] [CrossRef] [PubMed]
  35. Poornaprakash, B.; Subramanyam, K.; Kumar, M.; Kim, Y.; Reddy, M.S.P. Enhanced photoluminescence characteristics and intrinsic ferromagnetism in Co-substituted CeO2 nanoparticles. Mater. Sci. Semicond. Process. 2020, 123, 105566. [Google Scholar] [CrossRef]
  36. Malleshappa, J.; Nagabhushana, H.; Prasad, B.D.; Sharma, S.C.; Vidya, Y.S.; Anantharaju, K.S. Structural, photoluminescence and thermoluminescence properties of CeO2 nanoparticles. Optik 2016, 127, 855–861. [Google Scholar] [CrossRef]
  37. Tzompantzi Flores, C.; Castillo Rodríguez, J.C.; Gómez, R.; Hernández, R.P.; Santolalla Vargas, C.E.; Tzompantzi, F. Photocatalytic evaluation of the ZrO2:Zn5(OH)6(CO3)2 composite for the H2 production via water splitting. Top. Catal. 2020, 63, 575–585. [Google Scholar] [CrossRef]
  38. Castañeda Martínez, C.P.; Alvarado Ortega, I.A.; Rojas Sarmiento, H.A.; Tzompantzi Morales, F.J.; Gómez Romero, J.R. Photocatalytic degradation of the 2,4-dichlorophenoxyacetic acid herbicide using supported iridium materials. Ciencia Desarrollo 2021, 12, 125–134. [Google Scholar] [CrossRef]
  39. Carvalho, L.M.; Soares Filho, A.F.; Lima, M.S.; Cruz Filho, J.F.; Dantas, T.C.M.; Luz, G.E. 2,4-Dichlorophenoxyacetic acid (2,4-D) photodegradation on WO3-TiO2-SBA-15 nanostructured composite. Environ. Sci. Pollut. Res. 2020, 28, 7774–7785. [Google Scholar] [CrossRef] [PubMed]
  40. Castañeda, C.; Martínez, J.J.; Santos, L.; Rojas, H.; Osman, S.M.; Gómez, R.; Luque, R. Caffeine photocatalytic degradation using composites of NiO/TiO2–F and CuO/TiO2–F under UV irradiation. Chemosphere 2021, 288, 132506. [Google Scholar] [CrossRef] [PubMed]
  41. Nawaz, T.; Sengupta, S. Chapter 4-Contaminants of Emerging Concern: Occurrence, fate, and remediation. In Advances in Water Purification Techniques; Elsevier: Amsterdam, The Netherlands, 2019; pp. 67–114. [Google Scholar] [CrossRef]
  42. Yan, X.M.; Mei, P.; Gao, L. Photocatalytic Degradation of Rhodamine B over Sulfated SiO2-TiO2 Composite by Sulphuric Acid Impregnation Method. J. Adv. Oxid. Technol. 2016, 19, 52–58. [Google Scholar] [CrossRef]
  43. Hernández, J.S.; Guevara, D.; Shamshurin, M.; Benassi, E.; Sokolov, M.N.; Feliz, M. Octahedral Tantalum Bromide Clusters as Catalysts for Light-Driven Hydrogen Evolution. Inorg. Chem. 2023, 62, 19060–19069. [Google Scholar] [CrossRef] [PubMed]
  44. Antonopoulou, M.; Konstantinou, I. Photocatalytic degradation of pentachlorophenol by visible light Ν–F–TiO2 in the presence of oxalate ions: Optimization, modeling, and scavenging studies. Environ. Sci. Pollut. Res. 2015, 22, 9438–9448. [Google Scholar] [CrossRef] [PubMed]
  45. Castañeda, C.; Tzompantzi, F.; Gómez, R. Photocatalytic reduction of 4-nitrophenol on in situ fluorinated sol–gel TiO2 under UV irradiation using Na2SO3 as reducing agent. J. Sol-Gel Sci. Technol. 2016, 80, 426–435. [Google Scholar] [CrossRef]
  46. Elghniji, K.; Hentati, O.; Mlaik, N.; Mahfoudh, A.; Ksibi, M. Photocatalytic degradation of 4-chlorophenol under P-modified TiO2/UV system: Kinetics, intermediates, phytotoxicity and acute toxicity. J. Environ. Sci. 2012, 24, 479–487. [Google Scholar] [CrossRef]
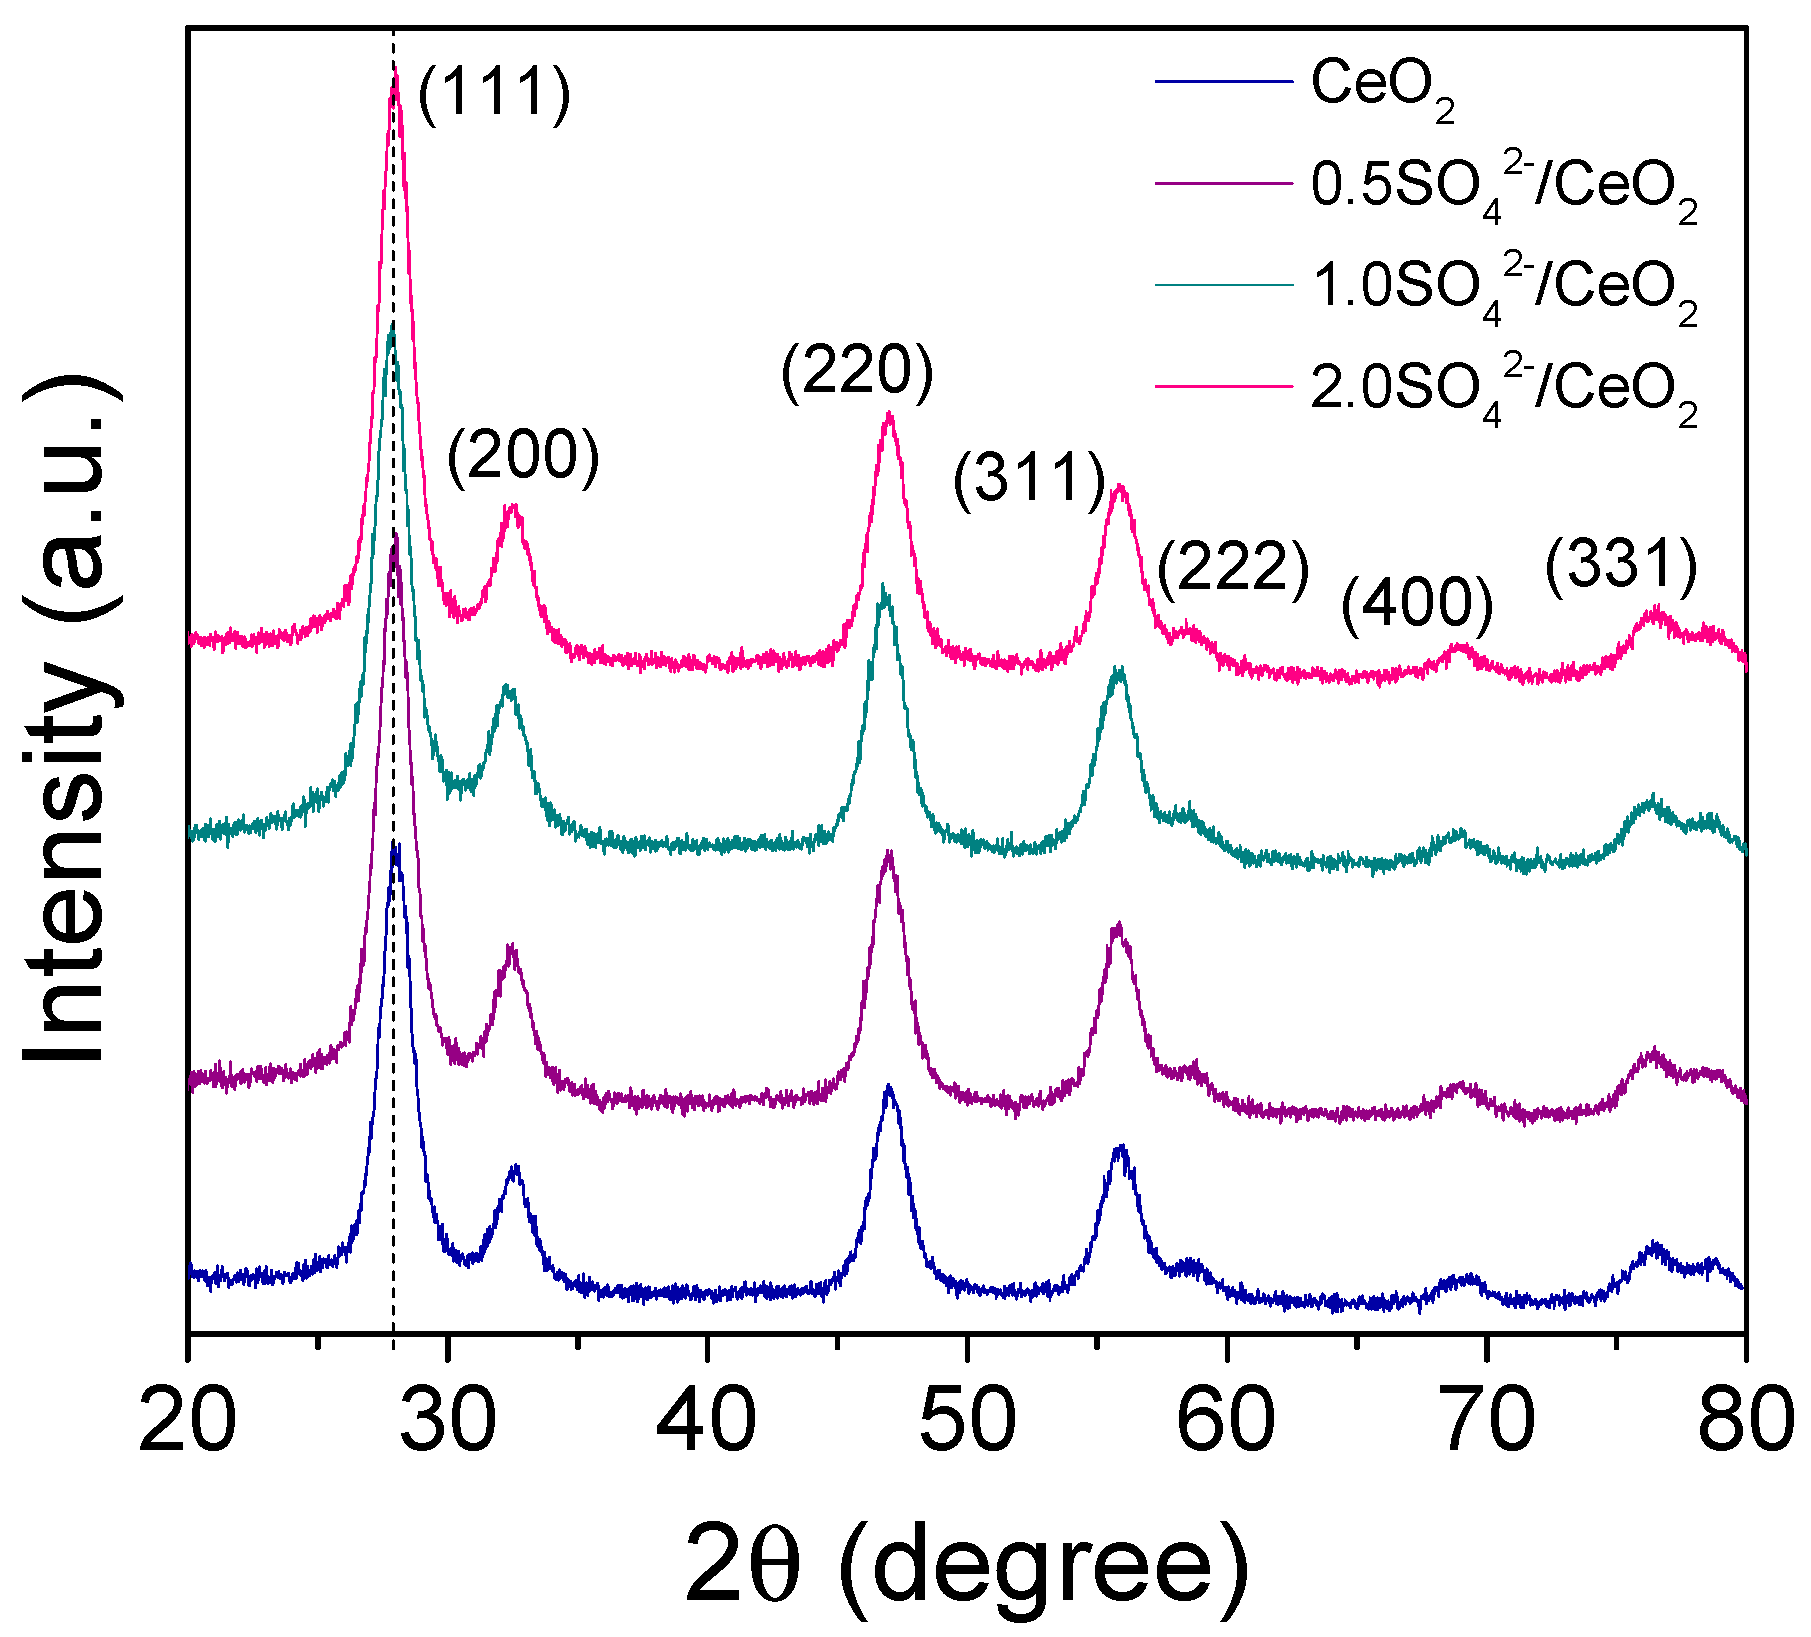
Figure 1. X-ray diffraction results of the materials studied.
Catalysts 14 00594 g001
Figure 2. N2 adsorption–desorption isotherms of the materials studied.
Catalysts 14 00594 g002
Figure 3. ATR-FTIR spectra of the materials studied.
Catalysts 14 00594 g003
Figure 4. (a) UV–Vis spectra and (b) Tauc plot of the materials studied.
Catalysts 14 00594 g004
Figure 5. TGA-MS results of (a) uncalcined CeO2 support and (b) 1.0SO42−/CeO2 photocatalyst.
Catalysts 14 00594 g005
Figure 6. Photoluminescence spectra of the materials studied.
Catalysts 14 00594 g006
Figure 7. (a) UV spectra of the 2,4-D photodegradation using 1.0SO42−/CeO2 photocatalyst, and (b) variation of the relative concentration of 2,4-D as a function of reaction time using materials studied.
Catalysts 14 00594 g007
Figure 8. (a) UV spectra of the 2,4-D adsorption using 1.0SO42−/CeO2 photocatalyst. (b) Comparison between the adsorption reaction and the photocatalytic degradation of the 2,4-D herbicide.
Catalysts 14 00594 g008
Figure 9. Representation of the photocatalytic process in the degradation of 2,4-D using the 1.0SO42−/CeO2 material.
Catalysts 14 00594 g009
Figure 10. (a) Surface plots and (b) contour plots representing the effect of 2,4-D concentration and photocatalyst mass on the degradation percentage.
Catalysts 14 00594 g010
Figure 11. Reuse of the 1.0SO42−/CeO2 photocatalyst in the photocatalytic degradation of 2,4-dichlorophenoxyacetic acid (2,4-D).
Catalysts 14 00594 g011
Figure 12. ATR-FTIR spectra of the 1.0SO42−/CeO2 material reused in the cycle experiments and the material used in the adsorption test.
Catalysts 14 00594 g012
Table 1. Physicochemical properties of the materials studied.
PhotocatalystCrystallite Size (nm)Lattice Parameter a (nm)SBET (m2/g)Pore Size (Å)Eg (eV)
CeO26.20.552146463.00
0.5SO42−/CeO25.60.554149463.08
1.0SO42−/CeO25.20.552158433.08
2.0SO42−/CeO25.00.552161453.08
Table 2. Kinetic parameters of the herbicide’s photocatalytic degradation using the materials studied.
Photocatalyst2,4-Dichlorophenoxyacetic Acid
k   ( × 10 3 min−1)t1/2 (min)R2
CeO25.51260.972
0.5SO42−/CeO25.81190.970
1.0SO42−/CeO28.6800.989
2.0SO42−/CeO26.91000.982
Table 3. Experiment randomization for response surface design.
Test N°Catalyst Mass (x1)Contaminant
Concentration (x2)
%Y
Calculated
%Y
Experimental
%
Error
1(−1) 50(−1) 2571.9711.22
2(1) 150(−1) 2580.2791.48
3(−1) 50(1) 5572.56510.3
4(1) 150(1) 5580.86914.6
5(−0.5) 10(0) 4052.17340.2
6(0.5) 190(0) 4067.07511.9
7(0) 100(−0.5) 546.96436.6
8(0) 100(0.5) 7548.36024.3
9(0) 100(0) 4096.9925.09
10(0) 100(0) 4096.9916.12
11(0) 100(0) 4096.9934.06
12(0) 100(0) 4096.9925.09
13(0) 100(0) 4096.9907.15
Disclaimer/Publisher’s Note: The statements, opinions and data contained in all publications are solely those of the individual author(s) and contributor(s) and not of MDPI and/or the editor(s). MDPI and/or the editor(s) disclaim responsibility for any injury to people or property resulting from any ideas, methods, instructions or products referred to in the content.

