Article

Influence of the Interaction of Nickel and Copper with Ceria on Ethanol Steam Reforming over Ni-Cu-CeO2 Catalysts

by
Karen C. Pájaro
1,2,
Vicente Cortés Corberán
1,* and
Arturo Martínez-Arias
1,*
1
Instituto de Catálisis y Petroleoquímica, CSIC, C/Marie Curie 2, Campus de Cantoblanco, 28049 Madrid, Spain
2
LICATUC, Universidad de Cartagena, Cartagena de Indias 130015, Colombia
*
Authors to whom correspondence should be addressed.
Catalysts 2024, 14(9), 605; https://doi.org/10.3390/catal14090605
Submission received: 27 July 2024 / Revised: 30 August 2024 / Accepted: 3 September 2024 / Published: 7 September 2024
(This article belongs to the Section Catalysis for Sustainable Energy)

Abstract

:
Catalysts of nickel-ceria, nickel-copper-ceria, and copper-ceria were explored with respect to their properties for hydrogen production through ethanol steam reforming (ESR). They were prepared by coprecipitation of the components within inverse microemulsions to achieve intimate contact between them, and the catalysts were characterized by N2 adsorption measurements, XRD, Raman spectroscopy, TPR, and XPS. The catalysts were tested for the ESR reaction, and they were regenerated with oxygen when significant deactivation took place, as occurred for the copper-containing systems. In contrast, the nickel–ceria catalyst exhibits a high activity and stability despite the formation of an important amount of carbon deposits during the course of the ESR test. The presence of nickel sites, which strongly interact with the ceria support, and which are affected by the presence of copper, and the limitation of copper for C-C bond breaking are invoked to explain the results obtained on the whole.

1. Introduction

In recent years, the consumption of fossil fuels has increased drastically, causing serious environmental and energy security problems on a global scale because these resources are limited and geographically concentrated in some regions of the world, and countries in other regions must import them [1]. Furthermore, global warming and climate change caused by the consumption of fossil fuels have generated global interest in the development of renewable energy sources. This situation makes search to produce sustainable and decentralized energy a priority [2].
Hydrogen is considered an environmentally friendly renewable secondary energy vector and can be even more efficient than conventional fuels when consumed in fuel cells. However, hydrogen is not found in its elemental state on Earth, except for residual geological deposits—white hydrogen—but rather combined in other molecules and, consequently, must be produced for use.
Among the possible raw materials for the production of hydrogen, ethanol (EtOH) is abundantly available from bio-fuel (biomass) [1,3,4], has high hydrogen content (H/C = 3), can be stored easily, and is non-toxic. In addition, the use of biomass would help to close the carbon cycle, using the CO2 produced during reforming via photosynthesis in plant growth.
The ethanol steam reforming (ESR) (reaction (1)) has a high hydrogen production capacity per molecule of ethanol reformed (up to 6 moles of hydrogen per mole of ethanol) but is very endothermic and requires a high temperature to achieve high conversion levels:
C 2 H 5 O H + 3 H 2 O 2 C O 2 + 6 H 2 H o 298 = 347.4   k J / m o l
Despite its apparent simplicity, this reaction takes place through a very complex reaction system, and side reactions occur simultaneously (Figure 1), which may be favored depending on the catalyst used. In most cases, these side reactions decrease the efficiency of hydrogen production, causing catalyst poisoning and reducing operation time; therefore, they must be considered [5,6].
Ethanol, due to its chemical nature, can be transformed into acetaldehyde by dehydrogenation (2) and ethylene by dehydration (3):
C 2 H 5 O H C H 3 C H O + H 2 H o 298 = 68   k J / m o l
C 2 H 5 O H C 2 H 4 + H 2 O H o 298 = 45   k J / m o l
Ethylene is the main coke precursor (4):
C 2 H 4 2 C + 2 H 2 H o 298 = 52   k J / m o l
Acetaldehyde plays a significant role in the formation of hydrogen through reforming reactions (5) and (6):
C H 3 C H O + H 2 O 3 H 2 + 2 C O H o 298 = 187   k J / m o l
C H 3 C H O + 3 H 2 O 5 H 2 + 2 C O 2 H o 298 = 105   k J / m o l
In turn, CO formation during reforming decreases hydrogen production to 4 mol H2/mol ethanol (7):
C 2 H 5 O H + H 2 O 4 H 2 + 2 C O H o 298 = 255   k J / m o l
Additionally, extra hydrogen can be recovered by water gas shift (WGS) (8):
C O + H 2 O C O 2 + H 2 H o 298 = 41   k J / m o l
Other possible reactions are the decomposition of acetaldehyde to methane and CO (9), its condensation to acetone (10), and methanation (11 and 12):
C H 3 C H O C H 4 + C O H o 298 = 19   k J / m o l  
2 C H 3 C H O C H 3 C O C H 3 + C O + H 2 H o 298 = 5   k J m o l
C O 2 + 4 H 2 C H 4 + 2 H 2 O H o 298 = 165   k J / m o l
C O + 3 H 2 C H 4 + H 2 O H o 298 = 206   k J / m o l  
Catalysts used in ethanol steam reforming play a significant role in directing the pathway followed by the reaction. They can be noble or transition metals. Among the latter, nickel has been widely investigated as an alternative to noble metals in ESR due to its low cost and its important activity for C-H bond breaking [1,3,5,7,8,9,10,11]. As a consequence, it is more prone to deactivation by coking, which has led to investigations on modifications of the systems by different supports, promoters, and/or other metals in bimetallic compositions as strategies to reduce this deactivation during the reforming reactions [5,7]. A summary of these is collected in Table S1 in the Supporting Information.
Copper catalysts have poor catalytic activity for ESR [7]. However, copper is the most important promoter of hydrogen production on inert supports such as Al2O3, La2O3, SiO2, or ZrO2 [12,13,14], leading to high catalytic activity and good selectivity and yield to H2 [12,13,15,16]. This is attributed to copper acting as an active agent: its good activity for WGS reaction and poor activity for C-C bond breaking, compared to nickel, could change the selectivity. At the same time, structural promotion, such as the formation of alloys with Ni, could decrease the formation of carbon deposits, thus decreasing catalyst deactivation [5,12,17].
CeO2 has been widely investigated as a redox support due to its unique properties. This support can intrinsically generate oxygen vacancies through a reversible redox cycle between Ce4+ and Ce3+ ions, which allows ceria to either release or take oxygen depending on the surface demand; this property is called oxygen storage capacity (OSC), which could be most helpful to eliminate carbon deposits [5,18] and, as a result, more stable catalysts. In addition, CeO2 can decrease catalyst deactivation due to its good oxygen transport properties and affect the catalytic activity of nickel catalysts by promoting intermediate steps for the reaction and/or for preventing coke deposition [8,19,20,21].
In this context, the objective of this work is to investigate the effect of Cu incorporation on the catalytic activity and stability of Ni-CeO2 catalysts for ESR and their regenerability after possible deactivation. For this purpose, catalysts of Ni-CeO2, NiCu-CeO2, and Cu-CeO2 have been prepared. A microemulsion preparation method has been chosen to achieve a closer contact between metal and support, which is considered essential to enhance the catalytic properties of Ni-CeO2 catalysts [8]. Furthermore, oxidative pretreatment has been applied to enhance the stability of the catalyst and to avoid sintering of the materials at high temperatures, as demonstrated by the previous work developed in our research group [22]. The catalysts obtained have been characterized by N2 adsorption/desorption, XRD, Raman, TPR, and XPS. The results reveal the importance of the interactions between nickel and ceria in this type of systems in order to achieve optimum ESR properties.

2. Results and Discussion

2.1. Characterization of Fresh Catalysts

The main textural properties of the studied catalysts are shown in Table 1. It can be observed that the SBET decreases when Ni is replaced by Cu, probably due to the presence of small CuO crystals clogging the smaller pores of the support [23]. For all samples, nitrogen adsorption/desorption isotherms show an IUPAC type IV pattern, characteristic of mesoporous solids (Figure 2). The studied catalysts present type II hysteresis, characteristic of porous structures that have narrow access pores and wide pore bodies called bottlenecks; the smaller the pore access, the wider the hysteresis loop [24]. For the monometallic Ni4Ce6 catalyst, a different hysteresis width is observed, which represents a lower total pore volume and a decrease in the relative pressure at which capillary condensation takes place, indicative of a smaller pore diameter (Table 1).
The crystalline structure of the samples was determined by X-ray diffraction (Figure 3). In all cases, the most intense diffraction peaks, observed at approximate values 2θ = 29.8°, 33.1°, 47.6°, and 56.5°, are characteristic of CeO2 with a fluorite type structure (JCPDS 34-0394). Additionally, the catalysts Ni4Ce6 and Ni2Cu2Ce6 presented peaks at 2θ = 37.2°, 43.3° and 62.4° corresponding to cubic NiO (JCPDS 04-0835). Reflections corresponding to copper-containing phases (CuO tenorite, JCPDS 48-1548) appear less intense in the Ni2Cu2Ce6 diffractogram in comparison with that of Cu4Ce6, in which peaks 2θ = 35.7° and 38.7°, the most intense peaks characteristic of the CuO tenorite phase, are apparent. The lattice parameter and the average size of the CeO2 crystals estimated from the Scherrer equation are presented in Table 1. The lowest value of crystal size was 6.4 nm for Ni4Ce6, and an increase in the crystal size is produced when including copper, Ni2Cu2Ce6 (8.6 nm), and Cu4Ce6 (8.8 nm), in correlation with the decrease observed in SBET.
XPS spectra for the three samples in Ce 3d, Ni 2p and/or Cu 2p and O 1s regions are shown in the Supporting Information (Figures S1–S4). Spectra in the Ce 3d region show the typical set of two triplets with peaks u’’’, u’’, and u corresponding to the 3d3/2 spin-orbit component, and v’’’, v’’, and v to the 3d5/2 one, attributed to Ce4+ in CeO2 [25,26]. To explore the presence of Ce3+, which is well known to occur in nanosized ceria samples like the ones explored here [27], the spectra were examined by fitting, as shown in Supporting Information. In the approximation followed, Ce3+ is represented by a single peak in each spin-orbit component (labelled as u’ and v’, respectively). This is considered valid for comparative purposes though it must be considered that Ce3+ in such an oxidic environment is expected to present two peaks in each spin-orbit component [26]. The main difference among the samples is in this sense related to the ratio of Ce3+/Ce4+ detected in each case, which is lower as the amount of Ni decreases, as collected in Table 2. In turn, the spectra observed in the Ni 2p region appear similar to those exhibited by nanostructured NiO [28,29,30], in agreement with XRD results above. They display a complex structure as a consequence of multiplet splitting in the final state and are constituted, also following analysis by fitting (Supporting Information and Table 2), by three peaks in every spin-orbit component [28,29,30]. Only small differences are found in this region between Ni4Ce6 and Ni2Cu2Ce6 (Supporting Information and Table 2). Concerning the Cu 2p3/2 region, two peaks at ca. 933.4–933.2 and 935.4–935.2 eV are detected, with the latter showing apparently higher intensity for Cu4Ce6, along with a satellite peak at ca. 943.5 eV. A lower relative intensity is observed for the satellite in the bimetallic catalyst, which indicates a relatively lower amount of Cu2+ in it. The two main peaks at 933.4–933.2 and 935.4–935.2 eV may correspond mainly to Cu2+ species, though the former may include some contribution from Cu+, particularly for Ni2Cu2Ce6. The difference between the Cu2+ species could be related to the chemical environment of the species, more oxidic for the signal at 933.4–933.2 eV and more hydroxylic for that at 935.4–935.2 eV [31]. This is supported by the spectra in the O 1s region. They are constituted by a signal corresponding to bulk oxygen at 529.8–529.4 eV along with signals corresponding to oxygens from hydroxyls or carbonates at 531.5–531.1 eV, as well as (for Cu-containing samples) a signal at ca. 532.8 eV, most likely related to adsorbed water [25,26,27]. The signal corresponding to oxygens from hydroxyls is particularly strong for Cu4Ce6, which supports the assignment performed of most intense signal observed for this sample in the Cu 2p3/2 region (at 935.2 eV) to hydroxide-type Cu2+ species. Relevant atomic ratios related to the respective dispersion of the metals are collected in Table 2.
The results of TPR, employed for exploring the redox properties of the samples and further characterizing the metal species in them, are shown in Figure 4. The profile of Ni4Ce6 shows different peaks between 50 and 400 °C, thus revealing, as discussed below, the presence of different nickel species. Note that pure ceria is expected to be reduced, in its bulk, above 650 °C [33], and here, promoted by nickel, such a reduction could correspond to the signal increase observed above ca. 500 °C. In turn, surface ceria reduction is expected to occur concomitantly to metal reduction in this type of sample and typically cannot be distinguished from it [34]. Pure NiO is typically reduced in a single step to metallic nickel, as reflected in a single, even if slightly asymmetric, reduction peak around 400 °C [35,36]. The presence of reduction peaks below 150 °C (marked as 1 in Figure 4) evidences an important promoting effect of ceria on the reduction of a small part of the nickel. Most of the nickel appears nevertheless reduced in a double peak between 200 and 400 °C, with a maximum at ca. 250 °C (peak 2). This could be related to the reduction of the NiO nanoparticles (as detected by XRD) promoted by the hydrogen activation on the metallic nickel reduced at lower temperatures during the course of the TPR test, as well as by interaction with ceria. TPR profiles of the two copper-containing samples are fully different and present sharper peaks below 200 °C, which are related to the reduction of the copper. Cu4Ce6 exhibits two peaks at 89 (peak 1) and 133 °C (peak 2) which are attributed to the reduction of copper species in contact with ceria and (metallic copper promoted) of CuO nanoparticles (as detected by XRD), respectively. A similar assignment can be made to the two sharp peaks observed at 83 (peak 1) and 104 °C (peak 2) in Ni2Cu2Ce6, the difference in reduction temperature concerning Cu4Ce6 being probably related to nickel-induced differences in the degree of interaction of the copper species with ceria and in the type of CuO nanoparticles present in each case. Peaks attributable to the reduction of nickel species appear in Ni2Cu2Ce6 at ca. 210 and 460 °C with a smaller one at ca. 330 °C. These appear generally shifted to higher temperatures with respect to peaks observed in Ni4Ce6, which suggests that the presence of copper decreases the interaction between nickel and ceria.
Raman spectra of the fresh catalysts are shown in Figure 5. Each graph shows spectra obtained by focusing the microscope on different spots and on different particles of the same sample to examine their structural homogeneity. The three sets of spectra show a similar pattern dominated by a very strong peak around 450 cm−1 and three other weaker peaks, two of them shoulders in the Ni-containing samples. The more homogeneous set and the simpler spectra correspond to catalyst Cu4Ce6 showing a quite symmetrical main peak centered at 451 ± 4 cm−1 and three weak ones at ca. 282, 617, and 1150 cm−1. These peaks are close to those typical of the Raman spectrum of pure ceria, which shows a strong peak around 461 cm−1, assigned to the F2g vibration mode of the fluorite phase, and three weak peaks: one at 594 cm−1 assigned to defects (oxygen vacancies) and two more at 257 and 1170 cm−1, assigned to second-order acoustic and longitudinal optical modes, respectively [37]. However, thin films of CuO show Raman shifts of 293, 340, and 624 cm−1 and a broad but relatively strong feature near 1100 cm−1 that are consistent with those reported for powder and single crystal CuO samples [38,39]. So the presence and position of the bands at 282, 340, 618, and (a very broad one) at 1100–1200 cm−1 in the Cu4Ce6 spectra indicate the presence of nanodomains of CuO, in agreement with XRD results. Only in a very scarce number of spots was a broad weak band around 210–240 cm−1 observed, which can be attributed to the Ag vibration mode of CuO, shifted to lower wavenumbers due to their nano size [27].
The shift of the main peak due to CeO2 to lower wavenumbers, caused by the incorporation of copper, can be due to either the lattice distortion of CeO2 by copper incorporation or to a decrease in the crystalline size [40,41]. The big similarity among the spectra and the almost constant position of the apex of the main peak indicates a high homogeneity of this sample.
On the contrary, the most diverse set and most complex spectra correspond to sample Ni4Ce6. The main peak due to CeO2 was broadened and more asymmetric, and the position of the maxima shifted widely in the range 434–458 cm−1; in turn, the band at ca. 600 cm−1 was much broadened, becoming a shoulder of the main one in some cases. When using a 523 nm laser excitation, the Raman spectrum of pure bulk NiO (bunsenite) shows very strong bands at ∼1520 and 1100 cm−1, as well as another around 500 cm−1 [42]. Even though those at 1100 and 571 cm−1 could be overlapped by bands assigned to ceria, the absence of the strongest one at 1520 cm−1 and the remaining two seems to indicate the absence of big particles of this phase. However, those bands are absent in the spectra of NiO thin sheets (80–100 nm thick) and nanograins (10–20 nm) that show bands only at ca. 420, 500, 708, and 1075 cm−1, attributed to phonon modes of NiO [43]. Yang et al. show a main broad band at 542 cm−1 along with weak peaks at 249 and 1054 cm−1 in NiO:Cu thin films [44]. Based on this, the asymmetry and broadening of the main peak of Ni4Ce6 can be interpreted as due to the overlapping of NiO bands at ca. 540 cm−1, while smaller ones at ca. 240 and 1100 cm−1 can also correspond to nano NiO [44]. The presence of the main nano NiO band at ca. 540 cm−1 will cause the observed increased intensity, broadening and maxima shifting to lower wavenumbers of the band at ca. 600 cm−1 and the great increase in its average intensity relative to one of the main peaks. One may conclude that NiO is present as nanodomains in this catalyst, in good agreement with XRD results.
The variety of spectra and broadness of bands in each of them indicate a broad heterogeneity of this catalyst, in which nickel is incorporated into the CeO2 in a broad range of interactions and highly dispersed in nanodomains on the external surface.
The set of spectra of Ni2Cu2Ce6 shows features that are intermediate between those of the former two. On one hand, the highly symmetrical main peak showed an apex position practically constant (450–456 cm−1), as in the Cu4Ce6 spectra. On the other, as in the Ni4Ce6 spectra, the band around 600 cm−1 mainly related to NiO nanodomains was less intense and shifted to lower wavenumbers, with quite variable area ratios among the spectra (but with lower values than for the Ni4Ce6 sample). This higher homogeneity among the spectra, as compared with Ni4Ce6, can be interpreted as caused by the incorporation of Cu into the CeO2 lattice, which could lead to a more homogeneous interaction between nickel and the ceria and, in turn, a higher homogeneity of nickel active centers.

2.2. Catalytic Activity

Catalytic tests were carried out at 500 °C for 18 h, and the results are described hereafter. Ni4Ce6 and Ni2Cu2Ce6 catalysts showed almost complete initial ethanol conversion, while Cu4Ce6 was much less active. The evolution of the yield to hydrogen was parallel to the conversion of ethanol (Figure 6). Unlike previous reports for other bimetallic Ni-Cu systems supported on silica [15], the bimetallic catalyst with Cu deactivated faster than Ni4Ce6, which only lost 12% of the initial conversion after 18 h of reaction. The catalysts followed an order of activity and stability of Ni4Ce6 > Ni2Cu2Ce6 > Cu4Ce6, coinciding with the variation in the nickel content present in the catalyst.
After their use in the catalytic test, the copper-containing catalysts were reactivated in situ with a flow of 100 mL/min of 10% O2 in helium at 650 °C for one hour with a heating ramp of 10 °C/min. Figure 6 show the evolution of the catalytic behavior after this regeneration treatment of the catalysts that underwent deactivation. Cu4Ce6 did not recover its initial activity compared to the fresh one. It presented a very low initial activity and a fast and complete deactivation. The Ni2Cu2Ce6 bimetallic catalyst practically recovered the previous initial conversion of ethanol although, as for the fresh system, it suffered important deactivation under the ESR mixture.
To gain a better understanding of the differences in catalytic performance observed, let us next analyze the distribution of carbon products and their evolution with reaction time in fresh and regenerated catalysts (Figure 7). The product distribution of the fresh Ni4Ce6 catalyst remained practically stable, and the main products were C1: CO2, CH4, and CO, with practically constant yields around 55%, 21%, and 13%, respectively. The formation of ethylene or acetone appeared residual during the whole test, and the yield of acetaldehyde was small, although it increased slightly with time. All this suggests that the main reaction pathway was dehydrogenation to acetaldehyde (2) and its subsequent and faster reforming, (5) and (6), which would slowly decrease over time, as reflected by a gradual, even if small, increase in the yield of acetaldehyde. Methane formation may be due to hydrogenation of carbon oxides since Ni is known for its hydrogenating properties [45].
Upon regenerating this catalyst under 10% O2/He at 650 °C after the first ESR test, practically the same behavior was observed (Figure 7).
Similarly to the Ni4Ce6 catalyst, the fresh Ni2Cu2Ce6 catalyst gave C1 compounds as the main initial products, and no formation of ethylene was observed along run time (Figure 7). The formation of mainly C1 products over the Ni-containing systems is an important difference from the behavior observed for Cu4Ce6, as shown below, and indicates that Ni is primarily responsible for the catalytic activity of these catalysts. The main difference observed in the product distribution when comparing Ni4Ce6 and Ni2Cu2Ce6 is the higher concentration of CO than for CO2 observed in the bimetallic system, which can be due to the good activity of copper for the reverse reaction of WGS (8) [46,47,48]. After 90 min of reaction, the yield of hydrogen decreased by 65.8% (Figure 6), a behavior similar to that observed in the yields of CO and CO2. Simultaneously, the acetaldehyde yield increased until about 120 min and remained stable thereafter. This would indicate that the decrease in hydrogen yield would be caused by the limitation for acetaldehyde reforming as the catalyst becomes deactivated during the reaction.
The distribution of yields of products shown, along with their evolution with reaction time, for regenerated Ni2Cu2Ce6 (Figure 7) is similar to that for the fresh one (Figure 7), although the ethanol conversion and the hydrogen yield are somewhat lower, indicating that the catalyst was not fully recovered to its initial condition.
The fresh sample of the Cu monometallic catalyst, Cu4Ce6, gave acetaldehyde as the main product, followed by ethylene and acetone (Figure 7), and practically no C1 product. This shows that Cu favors both the dehydrogenation reaction to acetaldehyde and the dehydration to ethylene but is ineffective in breaking C-C bonds. As a consequence, for the Cu4Ce6 catalyst, either fresh or regenerated (Figure 7), an almost null production of hydrogen was obtained, and very rapid deactivation (total in the regenerated sample) was produced as a consequence of catalyst poisoning, as will be addressed below.

2.3. Characterization of Used Catalysts

Portions of the catalysts samples employed for the ESR reaction tests could be recovered at the end of the consecutive tests and examined by means of XRD and Raman to explore the reasons for the deactivation phenomena observed.
The X-ray diffractograms (Figure 8) appear quite similar to those for the fresh catalysts, thus revealing no significant sintering of catalyst components during the reaction tests. At a variance to samples with a similar composition but prepared at 500 °C as a final calcination step [22], no massive nickel or copper reduction is produced in this case under the ESR mixture, which suggests a higher stability of corresponding oxides for the samples prepared at 650 °C. It is not possible to identify the presence of peaks related to possible carbon deposits formed during the reaction in these diffractograms, although we cannot discard the possibility that a residual feature detected at ca. 26.5° (in 2θ) could correspond to the presence of graphite in some case.
Nevertheless, the formation of carbon deposits has been confirmed by Raman for catalysts Ni4Ce6 and Cu4Ce6 samples after their use in ESR; their corresponding spectra are shown in Figure 9. Regrettably, we could not recover enough of the Ni2Cu2Ce6 catalyst to accomplish this study by Raman. Compared to the spectra of their corresponding fresh samples (Figure 5), the main difference is the presence of the two intense bands ascribed to carbon species: the D-band at around 1350 cm−1 assigned to amorphous carbon, and the G-band at 1590 cm−1 ascribed to graphitic carbon [49]. Similarly to the spectra of fresh samples, within the set for each sample, spectra are quite different among them, with some of the spectra showing an intense main peak at ca. 450 cm−1 corresponding to ceria, while in others, this peak is very weak or even absent. This indicates a great heterogeneity in the amount of deposited carbon on different areas of the catalyst particles surface. On average, the bands intensity ratio I450/IG was 0.66 and 0.11 for Cu4Ce6 and Ni4Ce6, respectively. In the case of used Ni4Ce6, it is noteworthy that the apex positions of this main peak are practically constant, which contrasts with the results for the fresh sample. Another peculiarity is that the broad signal between 300 and 700 cm−1, present in the fresh catalysts and attributed to NiO, appears absent in most of the spectra, which suggests that the formed carbon may cover this component. In turn, the intensity ratio ID/IG is characteristic of the Raman spectra of each carbon allotrope when pure. These ratios were quite similar among the different spectra in both sets (on average, 0.85 and 0.875 for Cu4Ce6 and Ni4Ce6, respectively). The heterogeneity of the spectra in each set and the similarity of these ratio values does not allow us to identify differences among the types of carbonaceous species deposited on each sample.

2.4. Structure/Activity Relationships

Catalytic differences as a function of the nature of the active metal appear clearly when comparing the activity data for the samples. The difficulties of generating C1 compounds in Cu4Ce6, in contrast with Ni4Ce6 and Ni2Cu2Ce6, evidence the limitations of copper for C-C bond breaking, which basically determines the activity of Cu4Ce6. For Ni4Ce6 and Ni2Cu2Ce6, the activity of nickel determines their catalytic properties. Some differences between them appear in any case. First, the ratio between the concentrations of CO and CO2 observed (Figure 7) can be related to the good activity of copper for the RWGS reaction, which determines the higher yield to CO of Ni2Cu2O6. The second important difference is the degree of deactivation achieved in each case during the test. While Ni4Ce6 maintains a relatively high and stable ESR activity, an appreciable degree of deactivation is produced for Ni2Cu2Ce6. Thus, although both start from practically full ethanol conversion (note in principle the relatively small difference in nickel dispersion, related to the surface nickel detected between the two samples inferred from the XPS atomic ratios collected in Table 2), Ni2Cu2Ce6 loses about 50% of conversion in 16 h, while the conversion of Ni4Ce6 only decreases by 12% after 19 h (Figure 6). The XRD analysis of the post-reaction samples indicates that apparently no sintering occurs during the ESR test, as expected considering that the samples were preconditioned at 650 °C while the reaction was carried out at 500 °C. Then, the deactivation observed must be attributed to the formation of carbon deposits, as confirmed by Raman (Figure 9), which cover the active sites. The high activity maintained over Ni4Ce6, which contrasts with that of the other two samples, and the fact that no important changes in the type of products detected are observed during the course of the long run performed suggest that the carbon structure formed on its surface permit, in any case, access of the gases to the active sites while most of these are kept intact during the run in Ni4Ce6. These can be related, as explored in detail in the works by Rodriguez and col. [19,20], to nickel species in close interaction with the ceria support. They presumably present a large oxygen mobility that facilitates the oxidation of carbon to prevent their deactivation. The coprecipitation of the two components within microemulsions could facilitate such intimate contact between nickel and ceria, as also observed in a former work [22]. Note in this sense that an important activity level could be maintained even though important amounts of carbon are formed, as observed in previous works [20]. Thus, Rodriguez and col., when exploring a Ni/CeO2 ESR catalyst [19,20], proposed the presence of two types of carbon deposits that were named, encapsulating and filamentous carbon, respectively, as earlier proposed by Alberton et al. [50], the latter not producing the deactivation of the catalyst. The catalytic results obtained suggest in our case that most of the carbon formed in Ni4Ce6 could be of a filamentous type not producing deactivation of the catalyst. The Raman spectra in Figure 9 suggest that carbon could be preferentially deposited on the NiO particles, preventing the observation of corresponding bands, in contrast to the fresh sample (Figure 5). Such NiO particles could act as a reservoir for the carbon and help to keep the active sites free of carbon poisoning. In contrast, Ni2Cu2Ce6 could form more encapsulating carbon on the nickel–ceria active sites, leading to a stronger deactivation. This suggests that copper inhibits to a certain degree the interaction between nickel and ceria that prevents the poisoning of the active sites (or of an appreciable part of them). Accordingly, the TPR results of Figure 4 show that copper retards the reduction of a part of the nickel, which indicates a weakening of the interaction between nickel and ceria in Ni2Cu2Ce4. In turn, Raman spectra for the fresh samples (Figure 5) show the presence of red-shifted F2g ceria domains in Ni4Ce6, most likely related to defective ceria as a consequence of the presence of nickel, while the overall red shift of this mode is much lower in Ni2Cu2Ce6, suggesting a copper hindering of the intimate interaction between nickel and ceria in comparison with Ni4Ce6.

3. Materials and Methods

3.1. Synthesis of the Catalysts

The catalysts were synthesized by the reverse microemulsion co-precipitation method, as described in [51], using n-heptane (99%, Sigma Aldrich, St. Louis, MO, USA) to form the organic phase, Triton X-100 (Sigma Aldrich) as a non-ionic surfactant to form the micelles, and 1-hexanol (98%, Sigma Aldrich) as a co-surfactant. The metallic nitrate salts (99%, Sigma Aldrich) dissolved in water were added to this organic phase. For the aqueous phase, a basic solution, tetramethylammonium hydroxide (TMAH), was used as an aqueous solution (25%, Alfa Aesar). When the aqueous and organic phases come into contact, micelles are formed. Within the micelles, water containing the precursors of the desired oxides are dispersed. The volume ratio of organic/co-surfactant/surfactant/aqueous solution in all preparations was 66/14/13/7. The final mixture of the two microemulsions (with the salts and the base, respectively) was stirred at room temperature for 1 h and centrifuged, and the obtained solid rinsed with methanol several times. The quantitative precipitation of the components is produced in any case according to the ICP-AES analysis of the final solids. Then, the precipitate was dried at 120 °C overnight and calcined under atmospheric air at 650 °C for 2 h with a heating ramp of 5 °C/min. The oxide materials obtained are denoted as NixCuyCe6 (x + y = 4), where x and y indicate the relative atomic content among the different constituent metals.

3.2. Physicochemical Characterization

BET surface area, pore volume and mean pore size of the catalysts were determined using a Micromeritics ASAP2020 nitrogen adsorption/desorption isotherm unit. In turn, temperature programmed reduction (TPR) was studied in a Micromeritics Autochem II 2920 chemisorption unit (Micromeritics, Norcross, GA 30093 USA) with a thermal conductivity detector (TCD) to evaluate the reducibility patterns of the catalysts.
X-ray diffractograms (XRD) of the catalysts were obtained in a Polycrystal X’Pert Pro PANalytical (Malvern Pananalytical Ltd., Malvern WR14 1XZ, UK) X-ray diffractometer with a θ-2θ configuration, using CuKα radiation (λ = 1.5406 Å). The equipment has a fast X’Celerator detector and a 15-position sample loader. Crystal sizes were estimated from peak half-maximum widths (FWHM) using Scherrer’s equation:
d = K λ β c o s ( θ )
where K = 0.89 is the Scherrer’s constant, λ(CuKα) = 1.54 Å is the wavelength of the radiation used, θ the position of the main peak, and β the FWHM of corresponding peak.
Raman spectra were taken with a confocal Renishaw inVia Qontor instrument (Renishaw plc, Wotton-under-Edge, Gloucestershire GL12 8JR, UK), equipped with a cooled RemCam CCD detector. Spectra were obtained with laser excitation of 514.5 nm Ar line, focused on the catalysts with a confocal microscope using a x50 objective (Olympus LMPlanFL) and a power of ca. 1 mW on the sample at 3 scans and 15 s acquisition time, dispersion grid of 2400 grooves/mm, and spectral resolution ca. 1 cm−1. Around fifty spectra from different spots and particles were recorded for each sample.
For the identification of the elements and their chemical state at surface layers, X-ray photoelectron spectroscopy (XPS) was performed using a SPECS GmbH system with a UHV system (pressure approx. 10−10 mbar), with a PHOIBOS 150 9MCD energy analyzer (SPECS GmbH, 13355 Berlin, Germany) and using the Mg Kα anode as X-ray source. The characteristic u’’’ peak of ceria at 917.0 eV in the Ce 3d region was employed for charge correction, considering the possible overlapping of signals in the C 1s region typically employed for such a purpose.

3.3. Catalytic Activity

Catalytic activity on SRE was performed in a continuous fixed-bed tubular reactor (305 mm length, 14.5 mm external diameter, and 9 mm internal diameter). A catalyst bed composed of 100 mg of sample with a particle size of 0.25–0.42 mm diluted in silicon carbide (SiC) with a 1:3 volumetric ratio was used. The catalyst was pretreated with a flow of 100 mL/min of 10% O2 in helium at 650 °C for 1 h, raising the temperature with a heating rate of 10 °C/min. Once activation was complete, the reactor was purged for 10 min with a flow of helium, before changing the temperature to that of the catalytic test. Two types of studies were carried out: study of influence of temperature on the activity of the catalytic systems between 400 and 650 °C, and stability tests at 500 °C. The feed was a mixture of ethanol/water/helium with 2.9/17.3/79.8 molar composition and a residence time of 0.12 gcat.h/gEtOH. The products were analyzed in a gas chromatograph Varian 3600 CX with two packed columns (molecular sieve and Porapak QS) and the Varian Star software. The exit flow was passed through a Peltier condenser to separate the condensable before venting the gases. The scheme of the experimental setup is presented in Figure 10.
Reaction parameters were estimated as follows. The yield of H2 (YH2) has been calculated, considering the stoichiometry of the ESR reaction, and the yield of carbon-containing compounds (Yi) has been calculated based on the ethanol carbon atoms fed, both expressed in molar percentage terms.
Y H 2 = m o l H 2 o u t 6 m o l C H 2 C H 3 O H i n × 100
Y i = n m o l c a r b o n c o m p o u n d s o u t 2 m o l C H 2 C H 3 O H i n × 100
where n is the number of C atoms in compound i. Ethanol conversion (X) is calculated as the sum of yields of carbonated products, expressed in molar %:
X = Y i
The carbon and oxygen balances are defined as the ratio between C or O atoms at the outlet and in the feed, respectively, expressed in %.
C b a l a n c e = m i c i o u t 2 m o l C H 2 C H 3 O H i n ˙ × 100
O b a l a n c e = m i O i + m H 2 O o u t m o l C H 2 C H 3 O H i n + m o l H 2 O i n × 100
where mi: moles of compound i; Ci: number of carbon atoms of compound i; Oi: number of oxygen atoms of compound i.

4. Conclusions

Catalysts of nickel-ceria (Ni4Ce6, numbers corresponding to atomic proportions employed) nickel-copper-ceria (Ni2Cu2Ce6), and copper-ceria (Cu4Ce6) have been prepared by coprecipitation of the components within inverse microemulsions and finally calcined at 650 °C. The catalysts exhibit SBET values between 57 and 30 m2g−1, which decrease with the amount of copper in good correlation with the CeO2 crystal size observed in each case. The X-ray diffractograms, and Raman and XPS spectra, reveal that part of the nickel or copper becomes segregated in the form of dispersed NiO or CuO nanoparticles. Additional information is obtained from TPR, which reveals the presence of dispersed nickel or copper entities that are reduced at lower temperature than larger nickel or copper oxide nanoparticles. In turn, TPR reveals that the copper shifts the reduction of nickel entities to higher temperature, which suggests a diminution of the interaction between nickel and ceria in Ni2Cu2Ce6. The ethanol steam reforming (ESR) activity at 500 °C of Cu4Ce6 is relatively poor (50% ethanol conversion and lower than 10% H2 yield) and the system becomes deactivated in a fast way, due to the formation of carbon deposits according to Raman exploration. This basically reflects the limitations of copper for the process and notably for C-C bond breaking, in accordance with the analysis of products. In contrast, Ni4Ce6 exhibits a high ESR activity (almost 100% ethanol conversion and more than 50% H2 yield) and stability (loss of only 12% ethanol conversion after 18 h) despite the formation of an important amount of carbon deposits, as evidenced by Raman spectroscopy. The activity results suggest that active sites involving nickel and ceria in strong interaction, formed when intimate contact between the two components is achieved and most likely favored by the preparation method employed, become mostly preserved from poisoning during the whole run, most likely due to the enhanced oxygen transport properties of such type of centers. In turn, Ni2Cu2Ce6 also shows an initially high ethanol conversion level (ca. 100%), although it deactivates in a relatively fast way (about 50% conversion after 16 h while the H2 yield decreases from about 50 to 20%). The main difference observed in product distribution for this bimetallic system compared with Ni4Ce6 is the formation of more CO on the former, which is attributed to the copper activity for the RWGS reaction. In any case, the faster deactivation detected for Ni2Cu2Ce6 is attributed to the modification of the interaction between nickel and ceria induced by copper in accordance with TPR and Raman results.

Supplementary Materials

The following are available online at https://www.mdpi.com/article/10.3390/catal14090605/s1: Figures S1–S4 (XPS spectra), Table S1 (summary of catalysts’ ESR performance).

Author Contributions

Conceptualization: A.M.-A., V.C.C.; methodology, K.C.P., V.C.C., A.M.-A.; validation, K.C.P., V.C.C., A.M.-A.; investigation, K.C.P., V.C.C., A.M.-A.; resources, A.M.-A., V.C.C.; data curation: K.C.P., V.C.C., A.M.-A.; writing—original draft preparation, K.C.P.; writing—review and editing, K.C.P., V.C.C., A.M.-A.; supervision, V.C.C., A.M.-A.; project administration, A.M.-A. All authors have read and agreed to the published version of the manuscript.”

Funding

This work was financed by Projects RTI2018-101604-B-I00 and PID2021-128915NB-I00 of the Spanish Ministry of Science and Innovation (MICINN).

Data Availability Statement

The data presented in this study are available on request from the corresponding authors.

Acknowledgments

The authors thank M.A. Bañares for the collection of the Raman spectra and the Technical Support Unit (Unidad de Apoyo) of ICP-CSIC for the collection of data from characterization techniques.

Conflicts of Interest

The authors declare no conflicts of interest.

References

  1. Greluk, M.; Rotko, M.; Turczyniak-Surdacka, S. Enhanced catalytic performance of La2O3 promoted Co/CeO2 and Ni/CeO2 catalysts for effective hydrogen production by ethanol steam reforming. Renew. Energy 2020, 155, 378–395. [Google Scholar] [CrossRef]
  2. Goh, C.S.; Aikawa, T.; Ahl, A.; Ito, K.; Kayo, C.; Kikuchi, Y.; Takahashi, Y.; Furubayashi, T.; Nakata, T.; Kanematsu, Y.; et al. Rethinking sustainable bioenergy development in Japan: Decentralised system supported by local forestry biomass. Sustain. Sci. 2019, 15, 1461–1471. [Google Scholar] [CrossRef]
  3. Chiou, J.Y.; Lai, C.L.; Yu, S.W.; Huang, H.H.; Chuang, C.L.; Wang, C.B. Effect of Co, Fe and Rh addition on coke deposition over Ni/Ce0.5Zr0.5O2 catalysts for steam reforming of ethanol. Int. J. Hydrogen Energy 2014, 39, 20689–20699. [Google Scholar] [CrossRef]
  4. Mattos, L.V.; Jacobs, G.; Davis, B.H.; Noronha, F.B. Production of Hydrogen from Ethanol: Review of Reaction Mechanism and Catalyst Deactivation. Chem. Rev. 2012, 112, 4094–4123. [Google Scholar] [CrossRef] [PubMed]
  5. Llorca, J.; Cortés Corberán, V.; Divins, N.J.; Olivera Fraile, R.; Taboada, E. Hydrogen from Bioethanol, Renewable Hydrogen Technologies: Production, Purification, Storage, Applications and Safety; Gandia, L.M., Arzamedi, G., Dieguez, P.M., Eds.; Elsevier: Amsterdam, The Netherlands, 2013; pp. 135–169. [Google Scholar]
  6. Sharma, Y.C.; Kumar, A.; Prasad, R.; Upadhyay, S.N. Ethanol steam reforming for hydrogen production: Latest and effective catalyst modification strategies to minimize carbonaceous deactivation. Renew. Sustain. Energy Rev. 2017, 74, 89–103. [Google Scholar] [CrossRef]
  7. Feng, X.; Zhao, Y.; Zhao, Y.; Wang, H.; Liu, H.; Zhang, Q. A minireview on recent progress of steam reforming of ethanol. RSC Adv. 2023, 13, 23991–24002. [Google Scholar] [CrossRef]
  8. Araiza, D.G.; Gómez Cortés, A.; Díaz, G. Effect of ceria morphology on the carbon deposition during steam reforming of ethanol over Ni/CeO2 catalysts. Catal. Today 2020, 349, 235–243. [Google Scholar] [CrossRef]
  9. Liu, J.; Su, W.; Rick, J.; Yang, S.; Pan, C.; Lee, J.; Chen, J.; Hwang, B. Rational design of ethanol steam reforming catalyst based on analysis of Ni/La2O3 metal–support interactions. Catal. Sci. Technol. 2016, 6, 3449–3456. [Google Scholar] [CrossRef]
  10. Osorio Vargas, P.; Flores González, N.A.; Navarro, R.M.; Fierro, J.L.G.; Campos, C.H.; Reyes, P. Improved stability of Ni/Al2O3 catalysts by effect of promoters (La2O3, CeO2) for ethanol steam-reforming reaction. Catal. Today 2016, 259, 27–38. [Google Scholar] [CrossRef]
  11. Zhurka, M.D.; Lemonidou, A.A.; Kechagiopoulos, P.N. Elucidation of metal and support effects during ethanol steam reforming over Ni and Rh based catalysts supported on (CeO2)-ZrO2-La2O3. Catal. Today 2021, 368, 161–172. [Google Scholar] [CrossRef]
  12. Mariño, F.; Baronetti, G.; Jobbagy, M.; Laborde, M. Cu-Ni-K/γ-Al2O3 supported catalysts for ethanol steam reforming: For-mation of hydrotalcite-type compounds as a result of metal–support interaction. Appl. Catal. A 2003, 238, 41–54. [Google Scholar] [CrossRef]
  13. Carrero, A.; Calles, J.; Vizcaíno, A. Effect of Mg and Ca addition on coke deposition over Cu–Ni/SiO2 catalysts for ethanol steam reforming. Chem. Eng. J. 2010, 163, 395–402. [Google Scholar] [CrossRef]
  14. Lytkina, A.; Zhilyaeva, N.; Ermilova, M.; Orekhova, N.; Yaroslavtsev, A. Influence of the support structure and composition of Ni–Cu-based catalysts on hydrogen production by methanol steam reforming. Int. J. Hydrogen Energy 2015, 40, 9677–9684. [Google Scholar] [CrossRef]
  15. Mariño, F.; Cerrella, E.; Duhalde, S.; Jobbagy, M.; Laborde, M. Hydrogen from steam reforming of ethanol. cCharacterization and performance of copper-nickel supported catalysts. Int. J. Hydrogen Energy 1998, 23, 1095–1101. [Google Scholar] [CrossRef]
  16. Lorenzut, B.; Montini, T.; De Rogatis, L.; Canton, P.; Benedetti, A.; Fornasiero, P. Hydrogen production through alcohol steam reforming on Cu/ZnO-based catalysts. Appl. Catal. B 2011, 101, 397–408. [Google Scholar] [CrossRef]
  17. Niazi, Z.; Irankhah, A.; Wang, Y.; Arandiyan, H. Cu, Mg and Co effect on nickel-ceria supported catalysts for ethanol steam reforming reaction. Int. J. Hydrogen Energy 2020, 45, 21512–21522. [Google Scholar] [CrossRef]
  18. Greluk, M.; Gac, W.; Rotko, M.; Słowik, G.; Turczyniak-Surdacka, S. Co/CeO2 and Ni/CeO2 catalysts for ethanol steam reforming: Effect of the cobalt/nickel dispersion on catalysts properties. J. Catal. 2021, 393, 159–178. [Google Scholar] [CrossRef]
  19. Xu, W.; Liu, Z.; Johnston Peck, A.; Senanayake, S.D.; Zhou, G.; Stacchiola, D.; Stach, E.A.; Rodriguez, J.A. Steam Reforming of Ethanol on Ni/CeO2: Reaction Pathway and Interaction between Ni and the CeO2 Support. ACS Catal. 2013, 3, 975–984. [Google Scholar] [CrossRef]
  20. Liu, Z.; Senanayake, S.D.; Rodriguez, J.A. Elucidating the interaction between Ni and CeOx in ethanol steam reforming cat-alysts: A perspective of recent studies over model and powder systems. Appl. Catal. B 2016, 197, 184–197. [Google Scholar] [CrossRef]
  21. Xiao, Z.; Wu, C.; Wang, L.; Xu, J.; Zheng, Q.; Pan, L.; Zou, J.; Zhang, X.; Li, G. Boosting hydrogen production from steam reforming of ethanol on nickel by lanthanum doped ceria. Appl. Catal. B Environ. 2021, 286, 119884. [Google Scholar] [CrossRef]
  22. Pinton, N.; Vidal, M.; Signoretto, M.; Martínez-Arias, A.; Cortés Corberán, V. Ethanol steam reforming on nanostructured catalysts of Ni, Co and CeO2: Influence of synthesis method on activity, deactivation and regenerability. Catal. Today 2017, 296, 135–143. [Google Scholar] [CrossRef]
  23. Jampa, S.; Jamieson, A.M.; Chaisuwan, T.; Luengnaruemitchai, A.; Wongkasemjit, S. Achievement of hydrogen production from autothermal steam reforming of methanol over Cu-loaded mesoporous CeO2 and Cu-loaded mesoporous CeO2–ZrO2 catalysts. Int. J. Hydrogen Energy 2017, 42, 15073–15084. [Google Scholar] [CrossRef]
  24. Faraldos, M.; Goberna, C. (Eds.) Técnicas de Análisis y Caracterización de Materiales; Editorial CSIC: Madrid, Spain, 2002; ISBN 84-00-08093-9. [Google Scholar]
  25. Mullins, D.; Overbury, S.; Huntley, D. Electron spectroscopy of single crystal and polycrystalline cerium oxide surfaces. Surf. Sci. 1998, 409, 307–319. [Google Scholar] [CrossRef]
  26. Holgado, J.P.; Alvarez, R.; Munuera, G. Study of CeO2 XPS spectra by factor analysis: Reduction of CeO2. Appl. Surf. Sci. 2000, 161, 301–315. [Google Scholar] [CrossRef]
  27. Fernández García, M.; Martínez Arias, A.; Hanson, J.C.; Rodriguez, J.A. Nanostructured Oxides in Chemistry:  Characteriza-tion and Properties. Chem. Rev. 2004, 104, 4063–4104. [Google Scholar] [CrossRef]
  28. Gonzalez Elipe, A.R.; Holgado, J.P.; Alvarez, R.; Munuera, G. Use of factor analysis and XPS to study defective nickel oxide. J. Phys. Chem. 1992, 96, 3080–3086. [Google Scholar] [CrossRef]
  29. Grosvenor, A.P.; Biesinger, M.C.; Smart, R.S.C.; McIntyre, N.S. New interpretations of XPS spectra of nickel metal and oxides. Surf. Sci. 2006, 600, 1771–1779. [Google Scholar] [CrossRef]
  30. Peck, M.A.; Langell, M.A. Comparison of Nanoscaled and Bulk NiO Structural and Environmental Characteristics by XRD, XAFS, and XPS. Chem. Mater. 2012, 24, 4483–4490. [Google Scholar] [CrossRef]
  31. Biesinger, M.C. Advanced analysis of copper X-ray photoelectron spectra. Surf. Interface Anal. 2017, 49, 1325–1334. [Google Scholar] [CrossRef]
  32. Wagner, C.D.; Davis, L.E.; Zeller, M.V.; Taylor, J.A.; Raymond, R.H.; Gale, L.H. Empirical atomic sensitivity factors for quantitative analysis by electron spectroscopy for chemical analysis. Surf. Interface Anal. 1981, 3, 211–225. [Google Scholar] [CrossRef]
  33. Laachir, A.; Perrichon, V.; Badri, A.; Lamotte, J.; Catherine, E.; Lavalley, J.C.; El Fallah, J.; Hilaire, L.; Le Normand, F.; Quéméré, E.; et al. Reduction of CeO2 by hydrogen. Magnetic susceptibility and Fourier-transform infrared, ultraviolet and X-ray photoelectron spectroscopy measurements. J. Chem. Soc. Faraday Trans. 1991, 87, 1601–16094. [Google Scholar]
  34. Gamarra, D.; Cámara, A.L.; Monte, M.; Rasmussen, S.B.; Chinchilla, L.E.; Hungria, A.B.; Munuera, G.; Gyorffy, N.; Schay, Z.; Cortés Corberán, V.; et al. Preferential oxidation of CO in excess H2 over CuO/CeO2 catalysts: Characterization and performance as a function of the exposed face present in the CeO2 support. Appl. Catal. B Environ. 2013, 130–131, 224–238. [Google Scholar] [CrossRef]
  35. Li, G.; Hu, L.; Hill, J.M. Comparison of reducibility and stability of alumina-supported Ni catalysts prepared by impregnation and co-precipitation. Appl. Catal. A Gen. 2006, 301, 16–24. [Google Scholar] [CrossRef]
  36. Zhang, Y.; Qin, Z.; Wang, G.; Zhu, H.; Dong, M.; Li, S.; Wu, Z.; Li, Z.; Wu, Z.; Zhang, J.; et al. Catalytic performance of MnOx–NiO composite oxide in lean methane combustion at low temperature. Appl. Catal. B Environ. 2012, 129, 172–181. [Google Scholar] [CrossRef]
  37. He, L.; Ren, Y.; Fu, Y.; Yue, B.; Tsang, S.C.E.; He, H. Morphology-Dependent Catalytic Activity of Ru/CeO2 in Dry Reforming of Methane. Molecules 2019, 24, 526. [Google Scholar] [CrossRef]
  38. Shabu, R.; Raj, A.M.E.; Sanjeeviraja, C.; Ravidhas, C. Assessment of CuO thin films for its suitablity as window absorbing layer in solar cell fabrications. Mater. Res. Bull. 2015, 68, 1–8. [Google Scholar] [CrossRef]
  39. Xu, J.F.; Ji, W.; Shen, Z.X.; Li, W.S.; Tang, S.H.; Ye, X.R.; Jia, D.Z.; Xin, X.Q. Raman spectra of CuO nanocrystals. J. Raman Spectrosc. 1999, 30, 413–415. [Google Scholar] [CrossRef]
  40. Popovic, Z.V.; Dohcevic-Mitrovic, Z.; Cros, A.; Cantarero, A. Raman scattering study of the anharmonic effects in CeO2y nanocrystals. J. Phys. Condens. Matter 2007, 19, 496209. [Google Scholar]
  41. Zhang, F.; Chan, S.W.; Spanier, J.E.; Apak, E.; Jin, Q.; Robinson, R.D.; Herman, I.P. Cerium oxide nanoparticles: Size-selective formation and structure analysis. Appl. Phys. Lett. 2002, 80, 127–129. [Google Scholar] [CrossRef]
  42. Thema, F.T.; Manikandan, E.; Gurib-Fakim, A.; Maaza, M. Single phase Bunsenite NiO nanoparticles green synthesis by Agathosma betulina natural extract. J. Alloys Comp. 2016, 657, 655–661. [Google Scholar] [CrossRef]
  43. Bose, P.; Ghosh, S.; Basak, S.; Naskar, M.K. A facile synthesis of mesoporous NiO nanosheets and their application in CO ox-idation. J. Asian Ceram. Soc. 2016, 4, 1–5. [Google Scholar] [CrossRef]
  44. Yang, X.; Liu, W.; Pan, G.; Sun, Y. Modulation of oxygen in NiO: Cu films toward a physical insight of NiO: Cu/c-Si hetero-junction solar cells. J. Mater. Sci. 2018, 53, 11684–11693. [Google Scholar] [CrossRef]
  45. Shi, D.; Wojcieszak, R.; Paul, S.; Marceau, E. Ni Promotion by Fe: What Benefits for Catalytic Hydrogenation? Catalysts 2019, 9, 451. [Google Scholar] [CrossRef]
  46. Wang, X.; Rodriguez, J.A.; Hanson, J.C.; Gamarra, D.; Martínez Arias, A.; Fernández García, M. In situ studies of the active sites for the water gas shift reaction over Cu-CeO2 catalysts: Complex interaction between metallic copper and oxygen vacancies of ceria. J. Phys. Chem. B 2006, 110, 428–434. [Google Scholar] [CrossRef] [PubMed]
  47. Kubacka, A.; Martínez Arias, A.; Fernández García, M. Role of the Interface in Base-Metal Ceria-Based Catalysts for Hydrogen Purification and Production Processes. ChemCatChem 2015, 7, 3614–3624. [Google Scholar] [CrossRef]
  48. Lin, L.; Yao, S.; Liu, Z.; Zhang, F.; Li, N.; Vovchok, D.; Martínez Arias, A.; Castañeda, R.; Lin, J.; Senanayake, S.D.; et al. In Situ Characterization of Cu/CeO2 Nanocatalysts for CO2 Hydrogenation: Morphological Effects of Nanostructured Ceria on the Catalytic Activity. J. Phys. Chem. C 2018, 122, 12934–12943. [Google Scholar] [CrossRef]
  49. Dresselhaus, M.S.; Jorio, A.; Hofmann, M.; Dresselhaus, G.; Saito, R. Perspectives on Carbon Nanotubes and Graphene Raman Spectroscopy. Nano Lett. 2010, 10, 751–758. [Google Scholar] [CrossRef] [PubMed]
  50. Alberton, A.L.; Souza, M.M.; Schmal, M. Carbon formation and its influence on ethanol steam reforming over Ni/Al2O3 catalysts. Catal. Today 2007, 123, 257–264. [Google Scholar] [CrossRef]
  51. Gamarra, D.; Munuera, G.; Hungría, A.B.; Fernández-García, M.; Conesa, J.C.; Midgley, P.A.; Wang, X.Q.; Hanson, J.C.; Rodríguez, J.A.; Martínez-Arias, A. Structure−Activity Relationship in Nanostructured Copper−Ceria-Based Preferential CO Oxidation Catalysts. J. Phys. Chem. C 2007, 111, 11026–11038. [Google Scholar] [CrossRef]
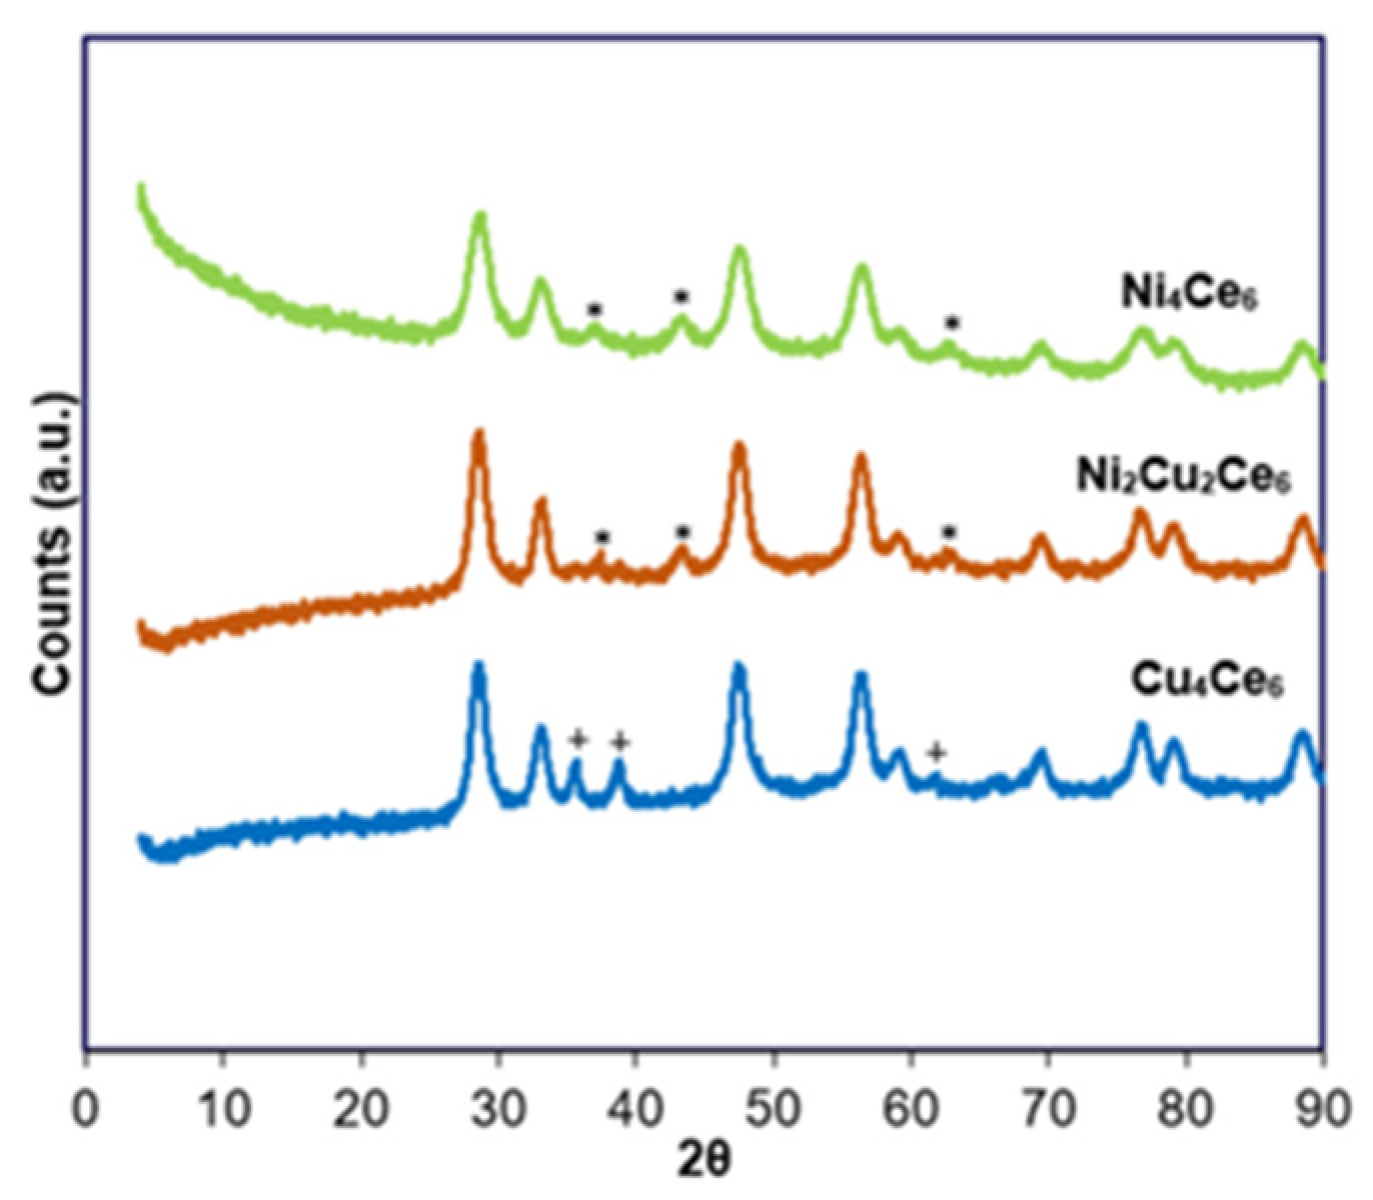
Figure 1. Ethanol steam reforming (ESR) reaction scheme.
Catalysts 14 00605 g001
Figure 2. N2 adsorption/desorption isotherms for indicated catalysts.
Catalysts 14 00605 g002
Figure 3. X-ray diffractograms for indicated catalysts. Peaks for nickel and copper oxides are marked as (*) NiO, (+) CuO.
Catalysts 14 00605 g003
Figure 4. TPR profiles for the following catalysts: (A) Ni4Ce6, (B) Ni2Cu2Ce6, and (C) Cu4Ce6. Note that raw data are shown, and a baseline drift is produced in all cases.
Catalysts 14 00605 g004
Figure 5. Raman spectra of the indicated fresh catalysts.
Catalysts 14 00605 g005
Figure 6. Left: Evolution of the ethanol conversion (top) and of the H2 yield (bottom) with time on stream during ESR at 500 °C over the indicated catalysts. Right: The same for catalysts regenerated under 10% O2/He at 650 °C after the first ESR test.
Catalysts 14 00605 g006
Figure 7. Evolution of the yield of indicated products with time on stream during ESR over the indicated fresh samples (top) and after regeneration in 10% O2/He at 650 °C after the first ESR test (bottom).
Catalysts 14 00605 g007
Figure 8. X-ray diffractograms for indicated catalysts after ESR. Peaks for nickel and copper oxides are marked as (*) NiO, (+) CuO.
Catalysts 14 00605 g008
Figure 9. Raman spectra of indicated catalysts after use in ESR tests.
Catalysts 14 00605 g009
Figure 10. Schematic diagram of the experimental setup employed for ESR catalytic activity measurements.
Catalysts 14 00605 g010
Table 1. Physicochemical properties for the indicated catalysts.
CatalystTextural PropertiesXRD Data
Specific Surface Area (SBET) (m2/g)Average Pore Size (nm)Pore Volume (cm3/g)CeO2 Lattice Parameter (nm)CeO2 Crystal Size (nm)
Ni4Ce6574.80.0680.5396.4
Ni2Cu2Ce6429.30.0970.5408.6
Cu4Ce63012.70.0940.5408.8
Table 2. Summary of XPS results.
SampleXPS Binding Energies of Observed Peaks, eV aAtomic Ratios
Ni 2p3/2Cu 2p3/2O 1sCe3+ (%)Ni (or Cu) /(M+Ce) b
Ni4Ce6854.2 (28.4)
856.0 (39.1)
861.5 (32.5)
529.5 (62.4)
531.5 (37.6)
13.20.12
Ni2Cu2Ce6854.2 (27.0)
856.0 (41.0)
861.6 (32.0)
933.2 (86.2)
935.4 (3.1)
943.4 (10.7)
529.4 (55.0)
531.1 (27.5)
532.8 (17.5)
17.60.10 (Ni)
0.17 (Cu)
Cu4Ce6 933.4 (39.0)
935.2 (44.0)
943.6 (17.0)
529.8 (26.8)
531.2 (41.6)
532.9 (31.6)
23.60.27
a Values in parentheses: percentage contribution for the peak. b M = Ni + Cu; sensitivity factors from Wagner et al. [32] were used for this estimation.
Disclaimer/Publisher’s Note: The statements, opinions and data contained in all publications are solely those of the individual author(s) and contributor(s) and not of MDPI and/or the editor(s). MDPI and/or the editor(s) disclaim responsibility for any injury to people or property resulting from any ideas, methods, instructions or products referred to in the content.

