Article

Enhanced Photoelectrochemical Water Splitting Performance of Ce-Doped TiO2 Nanorod Array Photoanodes for Efficient Hydrogen Production

1
College of Chemistry, Chemical Engineering and Environment, Fujian Province University Key Laboratory of Analytical Science, Minnan Normal University, Zhangzhou 363000, China
2
State Key Laboratory of Structural Chemistry, Fujian Institute of Research on the Structure of Matter, Chinese Academy of Sciences, Fuzhou 350002, China
3
Xiamen Key Laboratory of Rare Earth Photoelectric Functional Materials, Xiamen Institute of Rare-Earth Materials, Haixi Institutes, Chinese Academy of Sciences, Xiamen 361021, China
4
Fujian Science & Technology Innovation Laboratory for Optoelectronic Information of China, Fuzhou 350108, China
*
Author to whom correspondence should be addressed.
Catalysts 2024, 14(9), 639; https://doi.org/10.3390/catal14090639
Submission received: 25 July 2024 / Revised: 15 September 2024 / Accepted: 16 September 2024 / Published: 20 September 2024
(This article belongs to the Section Photocatalysis)

Abstract

:
In this study, original titanium dioxide (TiO2) and cerium (Ce)-doped TiO2 nanorod array photoanodes are prepared by hydrothermal method combined with high-temperature annealing, and their morphology, photoelectrochemical properties, and photocatalytic hydrogen production ability are systematically evaluated. X-ray diffraction (XRD) analysis shows that as the Ce content increases, the diffraction peak of the rutile phase (110) shifts towards lower angles, indicating the successful doping of different contents of Ce into the TiO2 lattice. Photoelectric performance test results show that Ce doping significantly improves the photocurrent density of TiO2, especially for the 0.54wt% Ce-doped TiO2 (denoted as CR5). The photocurrent density of CR5 reaches 1.98 mA/cm2 at a bias voltage of 1.23 V (relative to RHE), which is 2.6 times that of undoped TiO2 (denoted as R). Photoelectrochemical hydrolysis test results show that the hydrogen yield performance under full-spectrum testing conditions of Ce-doped TiO2 photoanodes is better than that of original TiO2 as well, which are 37.03 and 12.64 µmol·cm−2·h−1 for CR5 and R, respectively. These results indicate that Ce doping can effectively promote charge separation and improve hydrogen production efficiency by reducing resistance, accelerating charge transfer, and introducing new electronic energy levels. Our findings provide a new strategy for designing efficient photocatalysts with enhanced photoelectrochemical (PEC) water-splitting performance.

Graphical Abstract

1. Introduction

The quest for sustainable and renewable energy sources has led to significant advancements in photoelectrochemical (PEC) water-splitting technologies, which directly harness solar energy to produce hydrogen. Hydrogen, as a clean and versatile energy carrier, plays a crucial role in fuel cell applications and chemical synthesis, offering a promising solution to mitigate environmental pollution and reduce reliance on fossil fuels. Among various photoelectrocatalysts, titanium dioxide (TiO2) stands out due to its exceptional photocatalytic properties, chemical stability, non-toxicity, and cost-effectiveness. However, the substantial bandgap of TiO2 is around 3.2 eV, coupling with the swift recombination of electron-hole pairs generated by light, which considerably impedes its ability to absorb visible light and its overall photocatalytic effectiveness [1,2,3].
To overcome the limitations mentioned above, extensive research has been conducted to enhance TiO2’s photocatalytic efficiency through various modifications. These strategies include the formation of heterojunctions [4,5,6], non-metal or metal doping [7,8,9,10], and the deposition of noble metals [11,12]. Each of these approaches aims to either extend the light absorption spectrum of TiO2 into the visible region or improve the separation and transport of photo-generated carriers, thereby enhancing the photocatalytic activity [13,14,15,16]. For instance, the creation of SnO2/TiO2 heterojunctions by Zhang et al. [17] demonstrated a significant enhancement in photocatalytic activity due to the effective separation of photo-generated carriers at the interface. Similarly, non-metal doping, as achieved by Hoang et al. [18] through annealing in an H2 and Ar gas mixture, resulting in H and N co-doping, shifts the absorption edge of TiO2 towards the visible spectrum, thereby improving photocatalytic efficiency under visible light. Furthermore, the deposition of noble metal nanoparticles, such as gold or silver, on TiO2 surfaces serves as traps for photo-generated electrons and enhances light absorption through the localized surface plasmon resonance (LSPR) effect [19].
Among various doping strategies, cerium (Ce) doping shows its distinct advantages. As a rare earth element, Ce is known for its ability to introduce additional energy levels within the bandgap of semiconductors, which can facilitate the absorption of a broader spectrum of light, including visible light. Moreover, Ce doping is expected to enhance the charge carrier mobility and reduce the recombination rate of photo-generated electron-hole pairs, thus enhancing the overall PEC performance [20,21,22,23,24]. Tian et al. used a sol-gel method to prepare anatase TiO2 nano-powder doped with Ce, enabling visible-light-driven water splitting and photocurrent generation [20]. Lima et al. synthesized Ce-doped TiO2 nano-powder via solvothermal synthesis, demonstrating enhanced photocatalytic hydrogen evolution. Lactic acid addition increased the specific surface area and Ce3+ ratio, thus boosting activity. However, the heat-induced transformation of Ce3+ to Ce4+ decreased photocatalytic efficiency, highlighting the need for precise oxidation state control [21]. Tong et al. synchronously doped Ce into the lattice of anatase TiO2 nano-powder via a facile sol-gel method. The Ce doping suppressed the rutile phase and crystal growth of the anatase TiO2, leading to a smaller grain size and a higher specific surface area than pristine TiO2, thus enhancing the photoelectrochemical performance [22]. Tong et al. also prepared Ce-doped TiO2 nanotube arrays via electrochemical anodization, significantly improving the photoelectrochemical water-splitting performance for hydrogen production. They optimized Ce ion concentrations, effectively widening the light absorption spectrum and improving charge separation efficiency [23]. Lin et al. successfully developed CeO2/TiO2 heterojunction nanotubes, significantly enhancing the hydrogen production efficiency of TiO2 nanotube array photoelectrodes [24].
Compared to nano-powder and nanotubes, the nanorods have higher crystallinity, which facilitates the separation of photo-generated electrons and holes, leading to enhanced PEC water-splitting performance for hydrogen production. Therefore, distinct from the mentioned studies that focused on Ce doping into TiO2 nano-powder or nanotubes, this paper’s research focuses on Ce doping into TiO2 nanorods arrays. Photoelectric performance and photoelectrochemical hydrolysis test results show that compared to the original TiO2 nanorod array photoanodes (denoted as R), the 0.54wt% and 1.21wt% Ce-doped TiO2 nanorod array photoanodes (denoted as CR5 and CR10, respectively) show both enhanced photocurrent density and hydrogen yield performance. Significantly, the CR5 shows the optimal PEC water-splitting performance.

2. Results

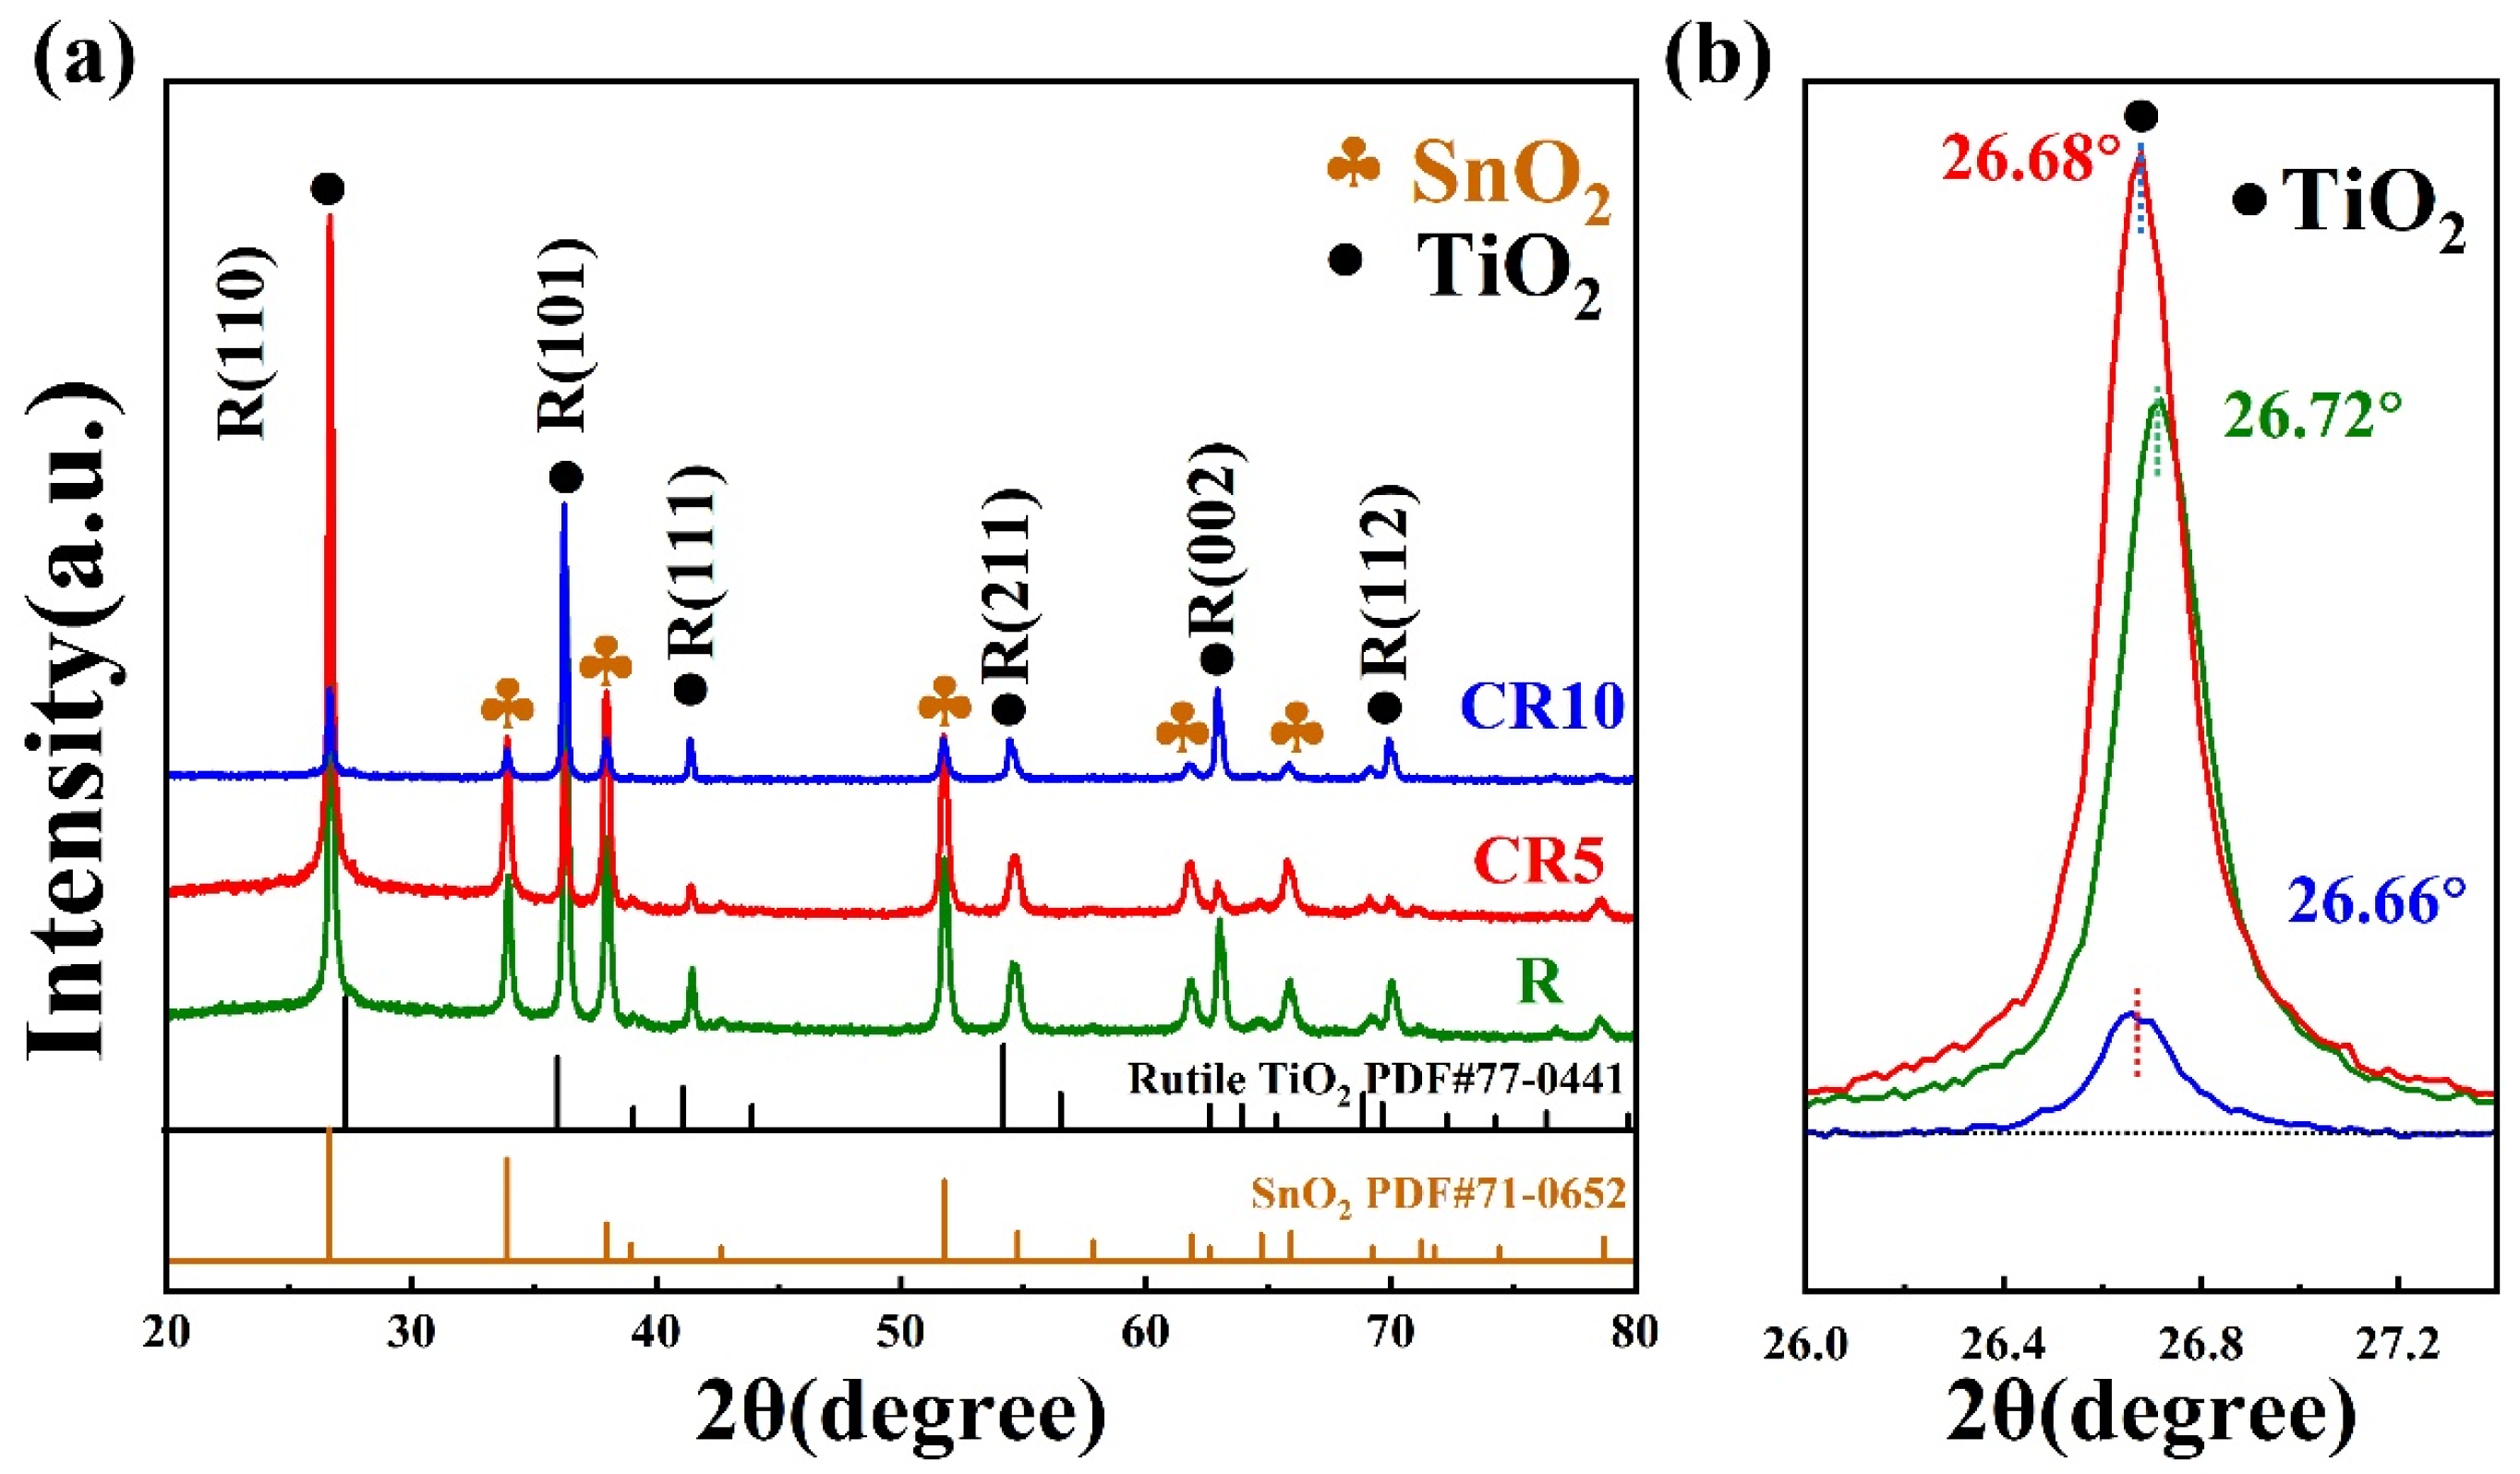
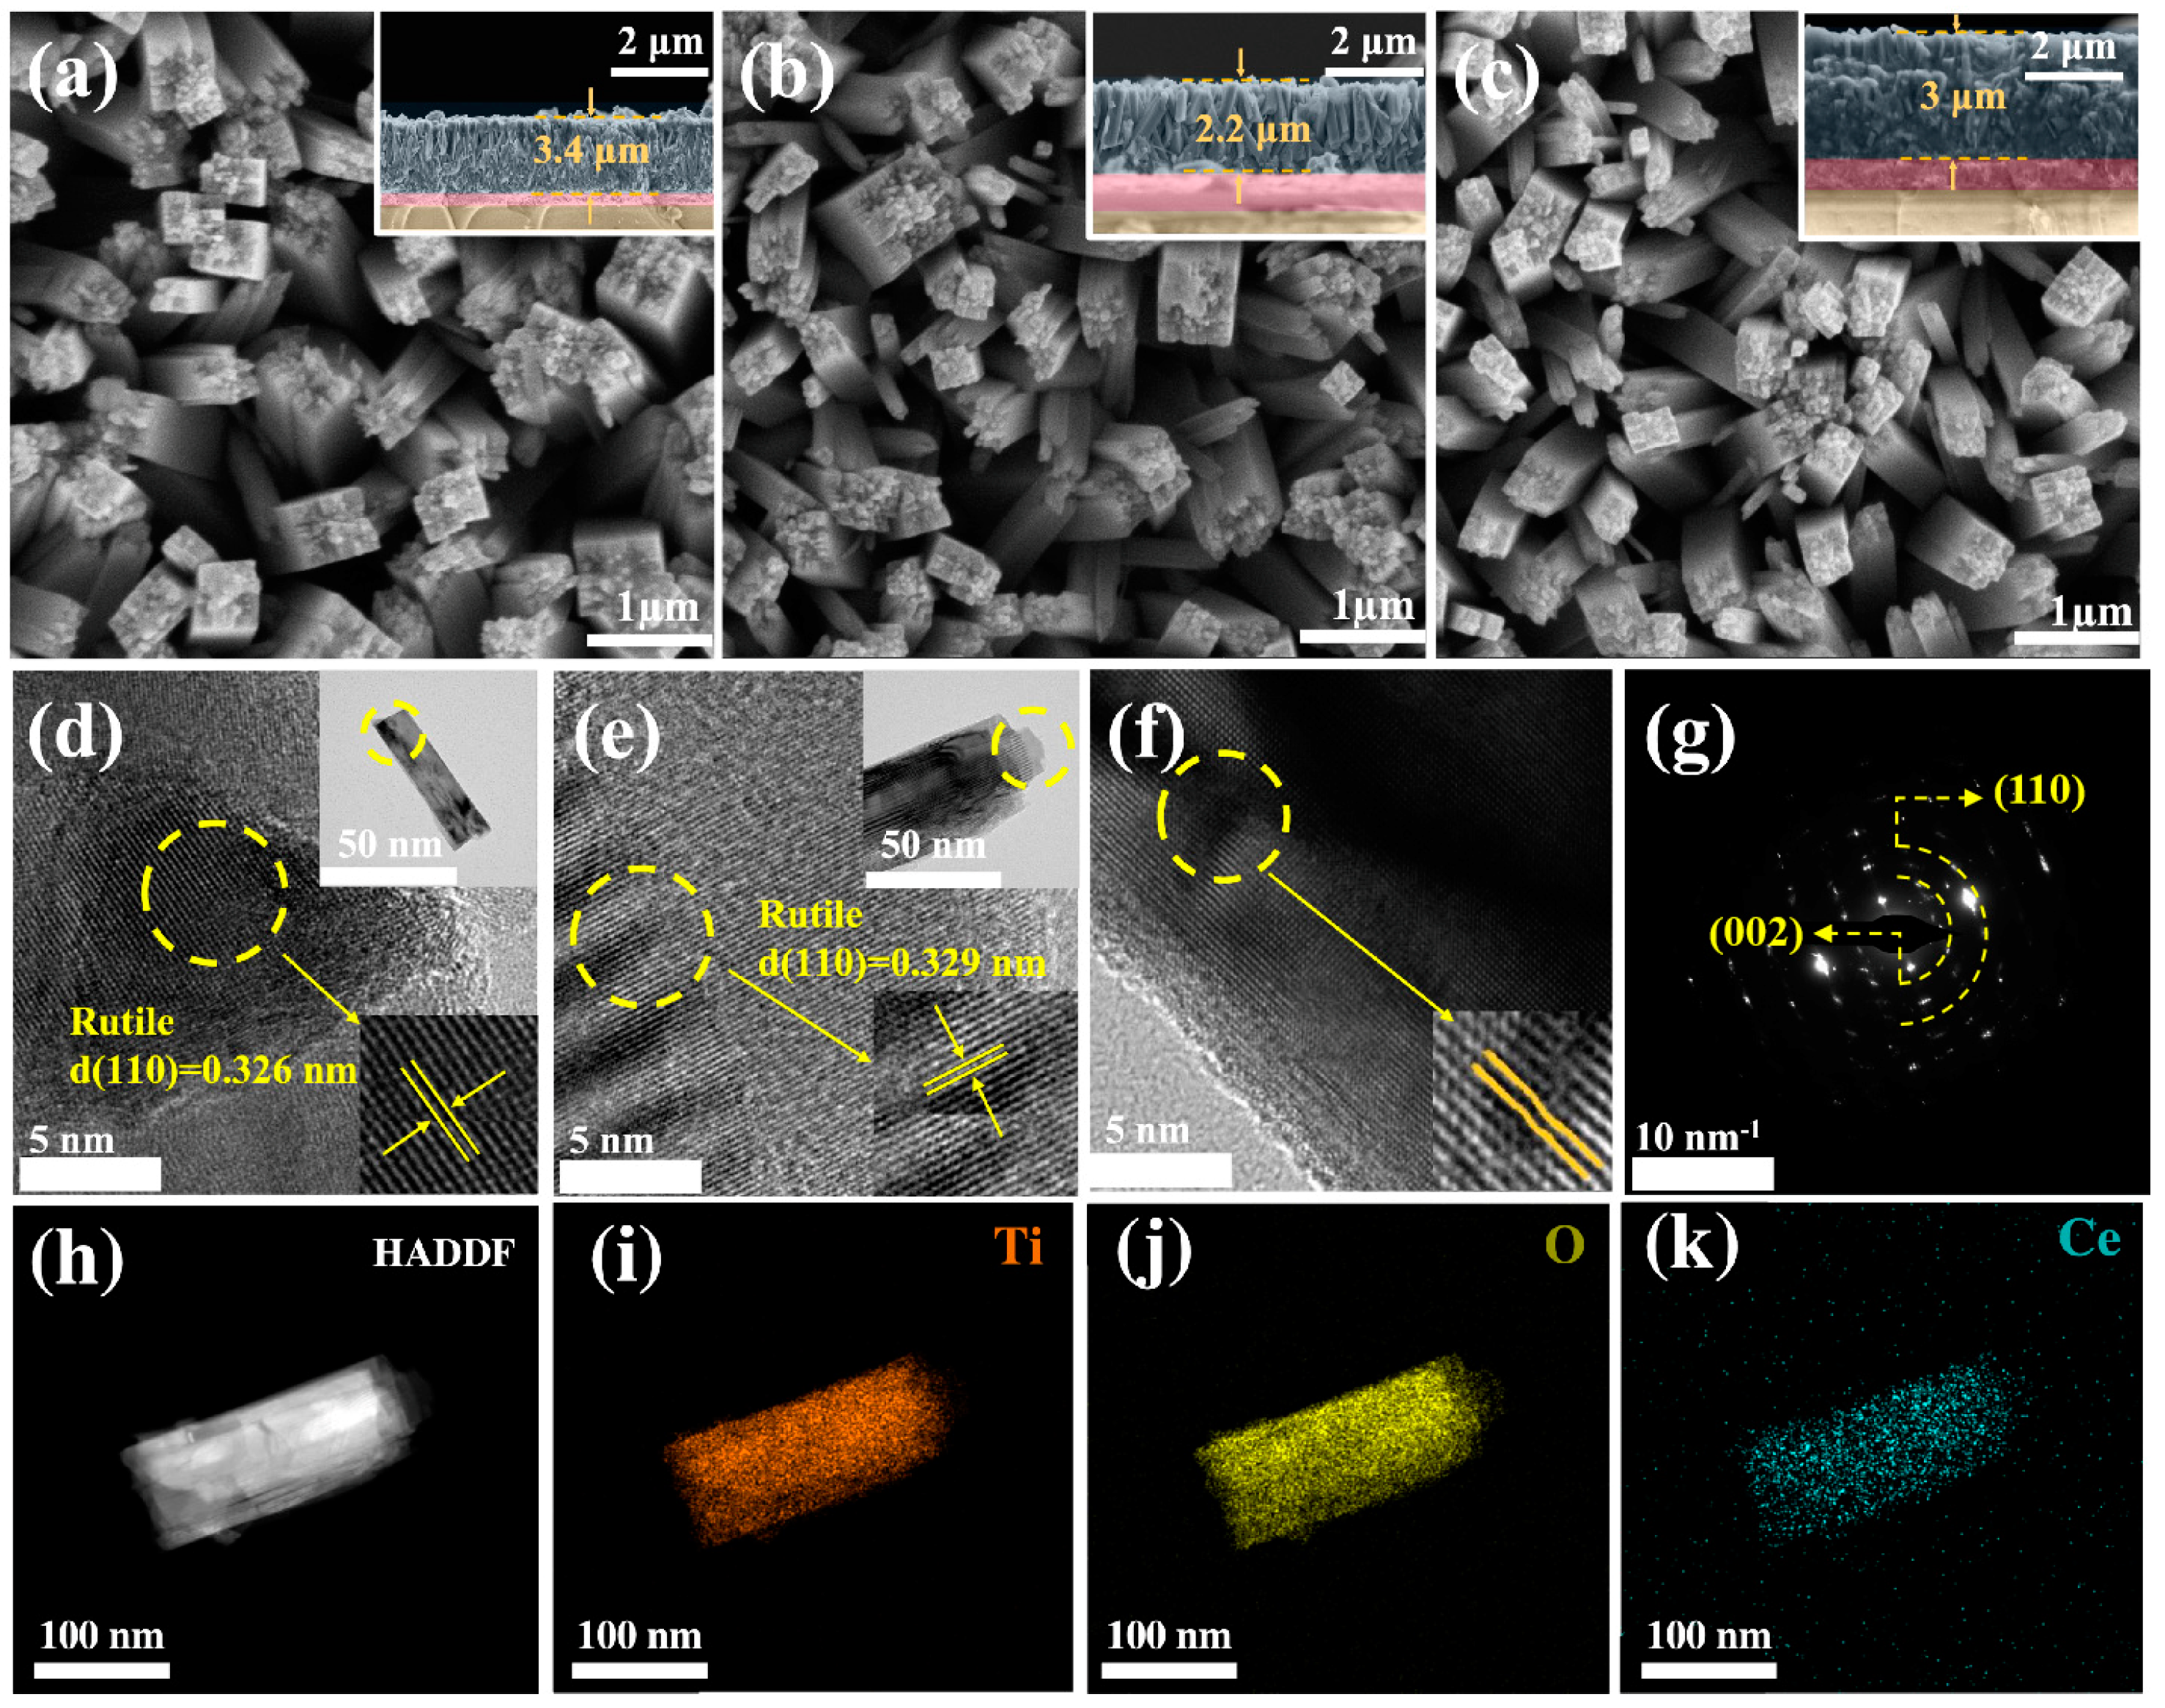
2.1. Structure and Morphology

Figure 1a presents XRD patterns of the as-prepared original TiO2 and two kinds of different mass contents Ce-doped TiO2 nanorod array photoanodes. For the Ce-doped TiO2 nanorod array photoanodes, the mass content of the doped Ce can be tuned by adjusting the mass of the added cerium nitrate hexahydrates (Ce precursor) during the TiO2 synthesis procedure, which can be found in detail in the Section 3.1. For simplification, the original TiO2 nanorod array photoanodes are denoted as R. The Ce-doped TiO2 nanorod array photoanodes with additional 21.7 mg and 43.4 mg cerium nitrate hexahydrates as the precursor for Ce doping during TiO2 synthesis procedure are denoted as CR5 and CR10, respectively. Since the TiO2 nanorod/nanotube arrays cannot be completely dissolved in hot aqua regia (shown in Figure S1) for inductively coupled plasma mass spectrometry (ICP-MS) analysis [25], energy dispersive spectrometer (EDS) analysis was performed to determine the mass ratio of Ce and Ti, namely to determine the mass content of Ce in Ce-doped TiO2 nanorod array photoanodes. EDS results in Figure S2 show that mass contents of Ce in CR5 and CR10 are around 0.54wt% and 1.21wt%, respectively. The XRD patterns show distinct diffraction peaks corresponding to the rutile structure of TiO2, in addition to those from the FTO substrate. The peaks at 26.72°, 36.36°, 41.46°, and 54.54° are attributed to the (110), (101), (111), and (211) planes of rutile TiO2 (PDF#77-0041), respectively while the peaks at 33.92°, 37.96°, 51.74°, and 61.88° correspond to the (101), (200), (211), and (310) planes of SnO2 in the FTO substrate (PDF#71-0652).
It can be observed in Figure 1b that the rutile (110) plane peak (26.72°) shifts slightly with the Ce doping and moves to lower diffraction angles (2 θ) as the content of Ce increases. For the unmodified TiO2 and Ce-doped TiO2 nanorod array photoanodes, the rutile (110) plane peak shifts from 26.72° (R) to 26.68° (CR5) and 26.66° (CR10), indicating an increase in lattice spacing d. This shift is attributed to the larger ionic radius of Ce4+ (0.101 nm) compared to that of Ti4+ (0.068 nm), which causes lattice expansion upon Ce4+ ion incorporation into the TiO2 lattice [26]. Sibu et al. reported the substitutional doping of Ti4+ ions with La3+ ions despite the larger radius of La3+ [27]. Given the similar ionic radii of Ce4+ and La3+, it is plausible that Ce4+ ions may be inserted into the TiO2 lattice during growth [28]. No distinct peaks for CeO2 (28.5°) and Ce2O3 (28.7°) were observed, suggesting either the complete integration of Ce ions into the TiO2 structure or low Ce doping levels below the XRD detection limit [28]. The absence of a peak at 59.29° for Ce-Ti bonds confirms the successful incorporation of Ce into the TiO2 lattice [29].
Figure 2 shows SEM images of the photoanodes R, CR5, and CR10, which display the microstructure of TiO2 with different Ce doping levels. From Figure 2a–c, it can be observed that both the TiO2 and Ce-doped TiO2 photoanodes exhibit a well-ordered rod-shaped array structure. In Figure 2a, the original TiO2 (R) shows individual nanorods with a rectangular shape, and the magnified view reveals a fish scale-like morphology rather than simple rod growth. The average length of the rod arrays is around 3.4 µm with a width of approximately 300 nm. Figure 2b,c display Ce-doped TiO2 photoanodes prepared with different amounts of Ce precursor under the same conditions. The Ce doping accentuates the fish scale-like morphology.
Additionally, the cross-sectional images of the photoanodes illustrate that with increasing Ce doping content, the morphology of nanorods remains unchanged, with the width almost constant and the length decreasing from 3.4 µm to 2.2 µm and then rising to 3 µm. The HR-TEM images of the original TiO2 and Ce-doped TiO2 nanorod array photoanodes are depicted in Figure 2d–f, indicating high crystallinity consistent with the XRD results. The high-magnification transmission image in Figure 2d shows uniformly arranged lattice fringes with a specific orientation of (110) crystal planes and a lattice spacing of 0.326 nm. Figure 2e shows the HR-TEM image of the CR5 photoanodes, also exhibiting specific orientation of the (110) crystal planes with lattice spacings of 0.329 nm, indicating an increase in lattice spacing due to Ce doping. Moreover, lattice deformation is observed in Figure 2f, attributed to the partial substitution of Ti4+ ions by Ce4+ ions during doping. The larger ionic radius of Ce4+ ions compared to Ti4+ ions leads to lattice deformation. Finally, Figure 2i–k depict the elemental distribution of Ti, O, and Ce in the CR5 photoanode at high magnification, indicating the uniform distribution of these elements.
To further demonstrate the successful doping of Ce into the TiO2 nanorod arrays, XPS testing was conducted to analyze the specific valence states of various elements in the TiO2 photoanode [30,31,32]. The results were calibrated using the standard binding energy of C 1s (284.8 eV). From the full spectrum in Figure 3, it can be observed that the CR5 photoanodes are mainly composed of Ce, O, and Ti. Due to the low doping concentration of Ce ions, the characteristic peak of Ce is weak. Figure 3b presents the Ti 2p spectrum of the TiO2 photoanodes, featuring binding energy peaks at 458.5 eV and 464.2 eV, which correspond to the Ti 2p3/2 and Ti 2p1/2 states, respectively. As shown in Figure 3b, the splitting energy between Ti 2p1/2 and Ti 2p3/2 in both R and CR5 photoanodes is approximately 5.7 eV. This indicates that the Ti in the TiO2 photoanodes exists mainly in Ti4+ before and after Ce ion doping. Additionally, the binding energy of Ti 2p1/2 in the CR5 photoanodes (464.1 eV) is shifted negatively by 0.10 eV compared to the original TiO2 nanorods (464.2 eV). Considering that no cerium oxide phase was observed in the XRD spectrum (see Figure 1), the Ce-O bonds in the TiO2 nanorods are dispersed and do not aggregate into the cerium oxide phase.
Figure 3c presents the O 1s spectrum of the TiO2 photoanodes, with two fitted peaks appearing at 529.7 eV and 531.8 eV for the R photoanode. The prominent peak observed at 529.7 eV indicates the oxygen atoms within the TiO2 lattice, specifically those forming the Ti-O-Ti framework. In contrast, the peak identified at 531.8 eV signifies oxygen species that are adsorbed on the surface of the TiO2, not integrated within the bulk structure. In the case of the CR5 photoanodes, the analysis reveals three distinct peaks at 529.7 eV, 532.2 eV, and 533.6 eV. These peaks are associated with different oxygen species: the first peak corresponds to oxygen atoms within the material’s lattice, the second peak indicates oxygen that is adsorbed on the surface, and the third peak indicates the presence of a C=O bond. The increase in surface adsorbed oxygen for the CR5 photoanodes indicates the presence of oxygen vacancies, which facilitate the adsorption of O2− or O ions on the surface of the TiO2 photoanodes, resulting in the generation of more hydroxyl and superoxide radicals and enhance the photocatalytic activity of the semiconductor. Figure 3d shows the Ce 3d spectrum of the photoanodes, revealing the coexistence of Ce4+ and Ce3+ ions. Peaks at 900.7 eV, 907.4 eV, and 916.5 eV correspond to Ce 3d3/2 of Ce4+, while peaks at 882.4 eV, 889.6 eV, and 897.6 eV correspond to Ce 3d5/2 of Ce4+ [31], and the peak at 885.5 eV corresponds to Ce 3d5/2 of Ce3+ [31]. The electrochemical potential of Ce4+/Ce3+ is more positive than that of Ti4+/Ti3+, allowing the transfer of electrons from Ti3+ to Ce4+ and forming Ce3+. This suggests that some of the Ce ions in the CR5 photoanodes are not completely oxidized, leading to certain oxygen vacancies [32].

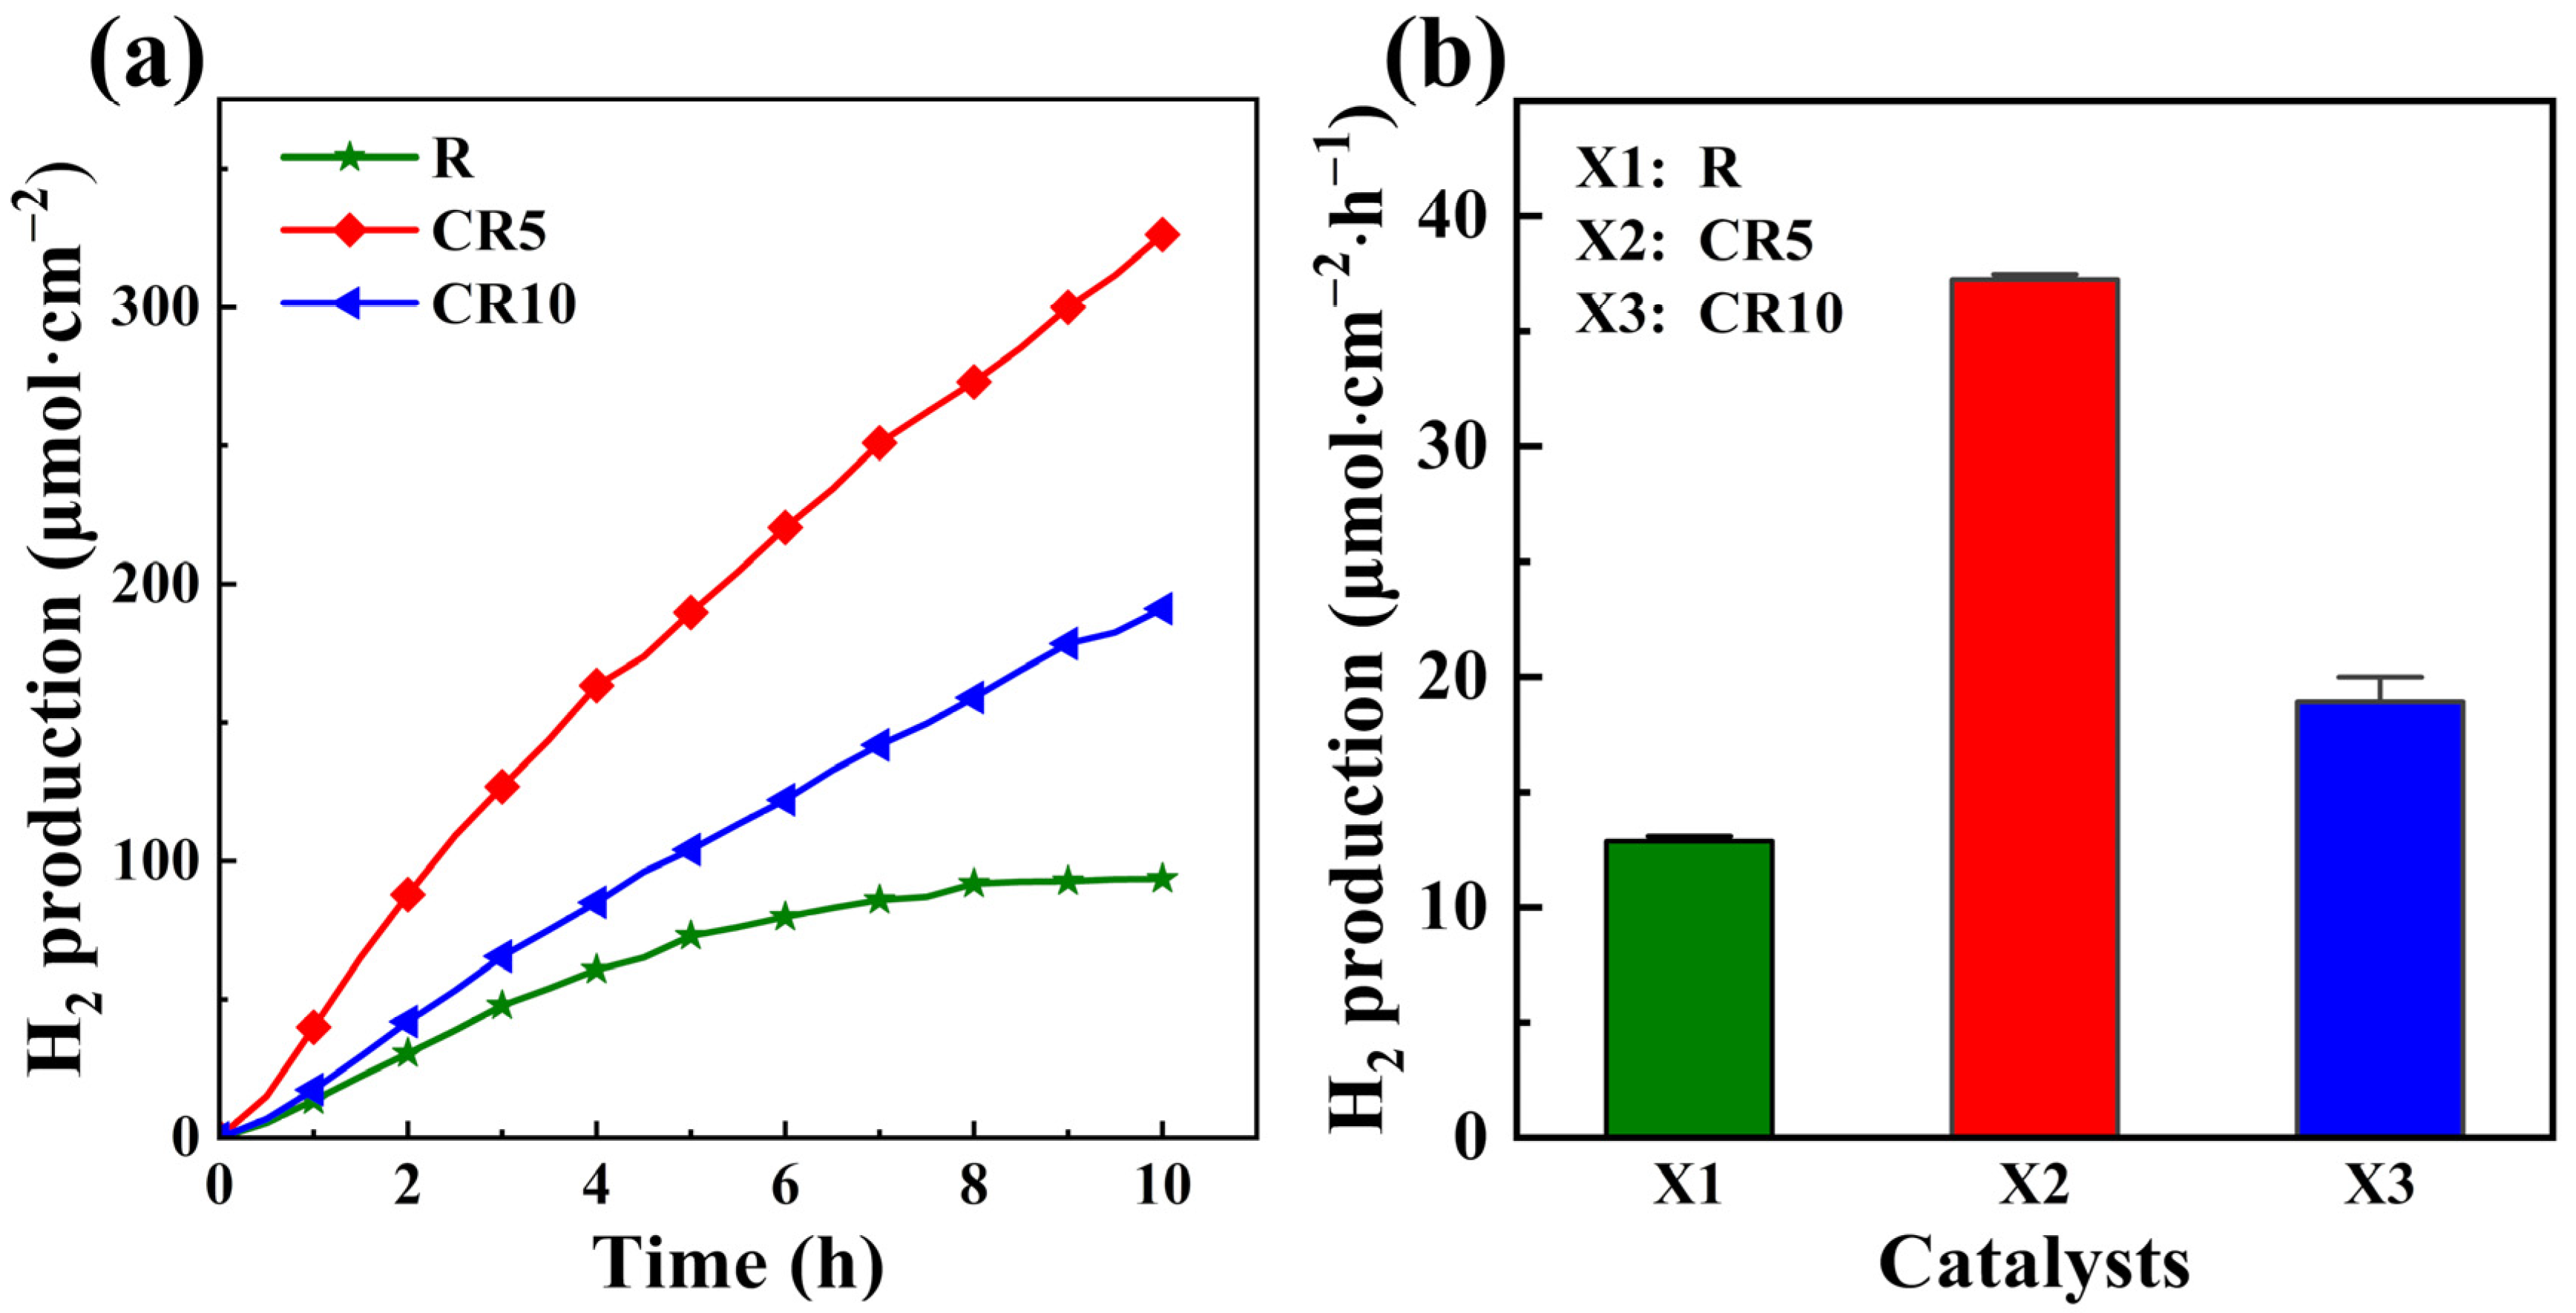
2.2. Photocatalytic Hydrogen Evolution Test of Ce-Doped TiO2 Photoanodes

To investigate the photoelectrochemical performance of the Ce-doped TiO2 photoanodes in greater detail, photocatalytic hydrogen evolution experiments were conducted in this study. The experiment used 0.1 M Na2SO4 as the electrolyte and carried out hydrogen production performance tests for up to 10 h, with automatic sampling every 30 min to measure the hydrogen production. Figure 4a illustrates the photoelectrochemical hydrogen generation capabilities of each kind of photoanode. The data reveal that the CR5 and CR10 photoanodes exhibit superior hydrogen production rates compared to the R photoanode. As shown in the electrochemical impedance spectroscopy of the photoanodes in Figure 4, the doping of Ce significantly reduces the interfacial charge transfer resistance of the TiO2 photoanodes, thereby accelerating the charge transfer and facilitating the improvement of the rate of photoelectrochemical water splitting for hydrogen production.
Figure 4b provides a detailed analysis of the hydrogen production rates of the R, CR5, and CR10 photoanodes over 10 h. The data indicate that the CR5 photoanodes outperform the others, achieving a hydrogen production rate of 37.03 µmol·cm−2·h−1. This rate is notably higher than that of the R photoanode, which stands at 12.64 µmol·cm−2·h−1 and also surpasses the CR10 photoanode, which records a rate of 17.86 µmol·cm−2·h−1. The superior performance of the CR5 photoanodes suggests that it possesses an efficient mechanism for photo-generated electron transfer, which is crucial for effective photocatalysis. The photoelectrolysis hydrogen production test results underscore the positive impact of cerium (Ce) doping on the TiO2 photoanodes’ ability to produce hydrogen through photocatalysis. The enhancement in photocatalytic hydrogen production efficiency is directly linked to the improved PEC performance, affirming the beneficial effects of Ce doping in optimizing the photoanodes’ functional capabilities. Table 1 shows the PEC performance of our prepared catalysts with other recently reported TiO2-based catalysts. The final comparison results show that the catalysts we prepared have excellent performance at a high level. In addition, the strategy of Ce doping can make better use of the relatively high abundance of the Ce element in rare earth elements, and our work also provides new insights into the application of Ce element in improving the performance of photoelectrocatalytic water decomposition.

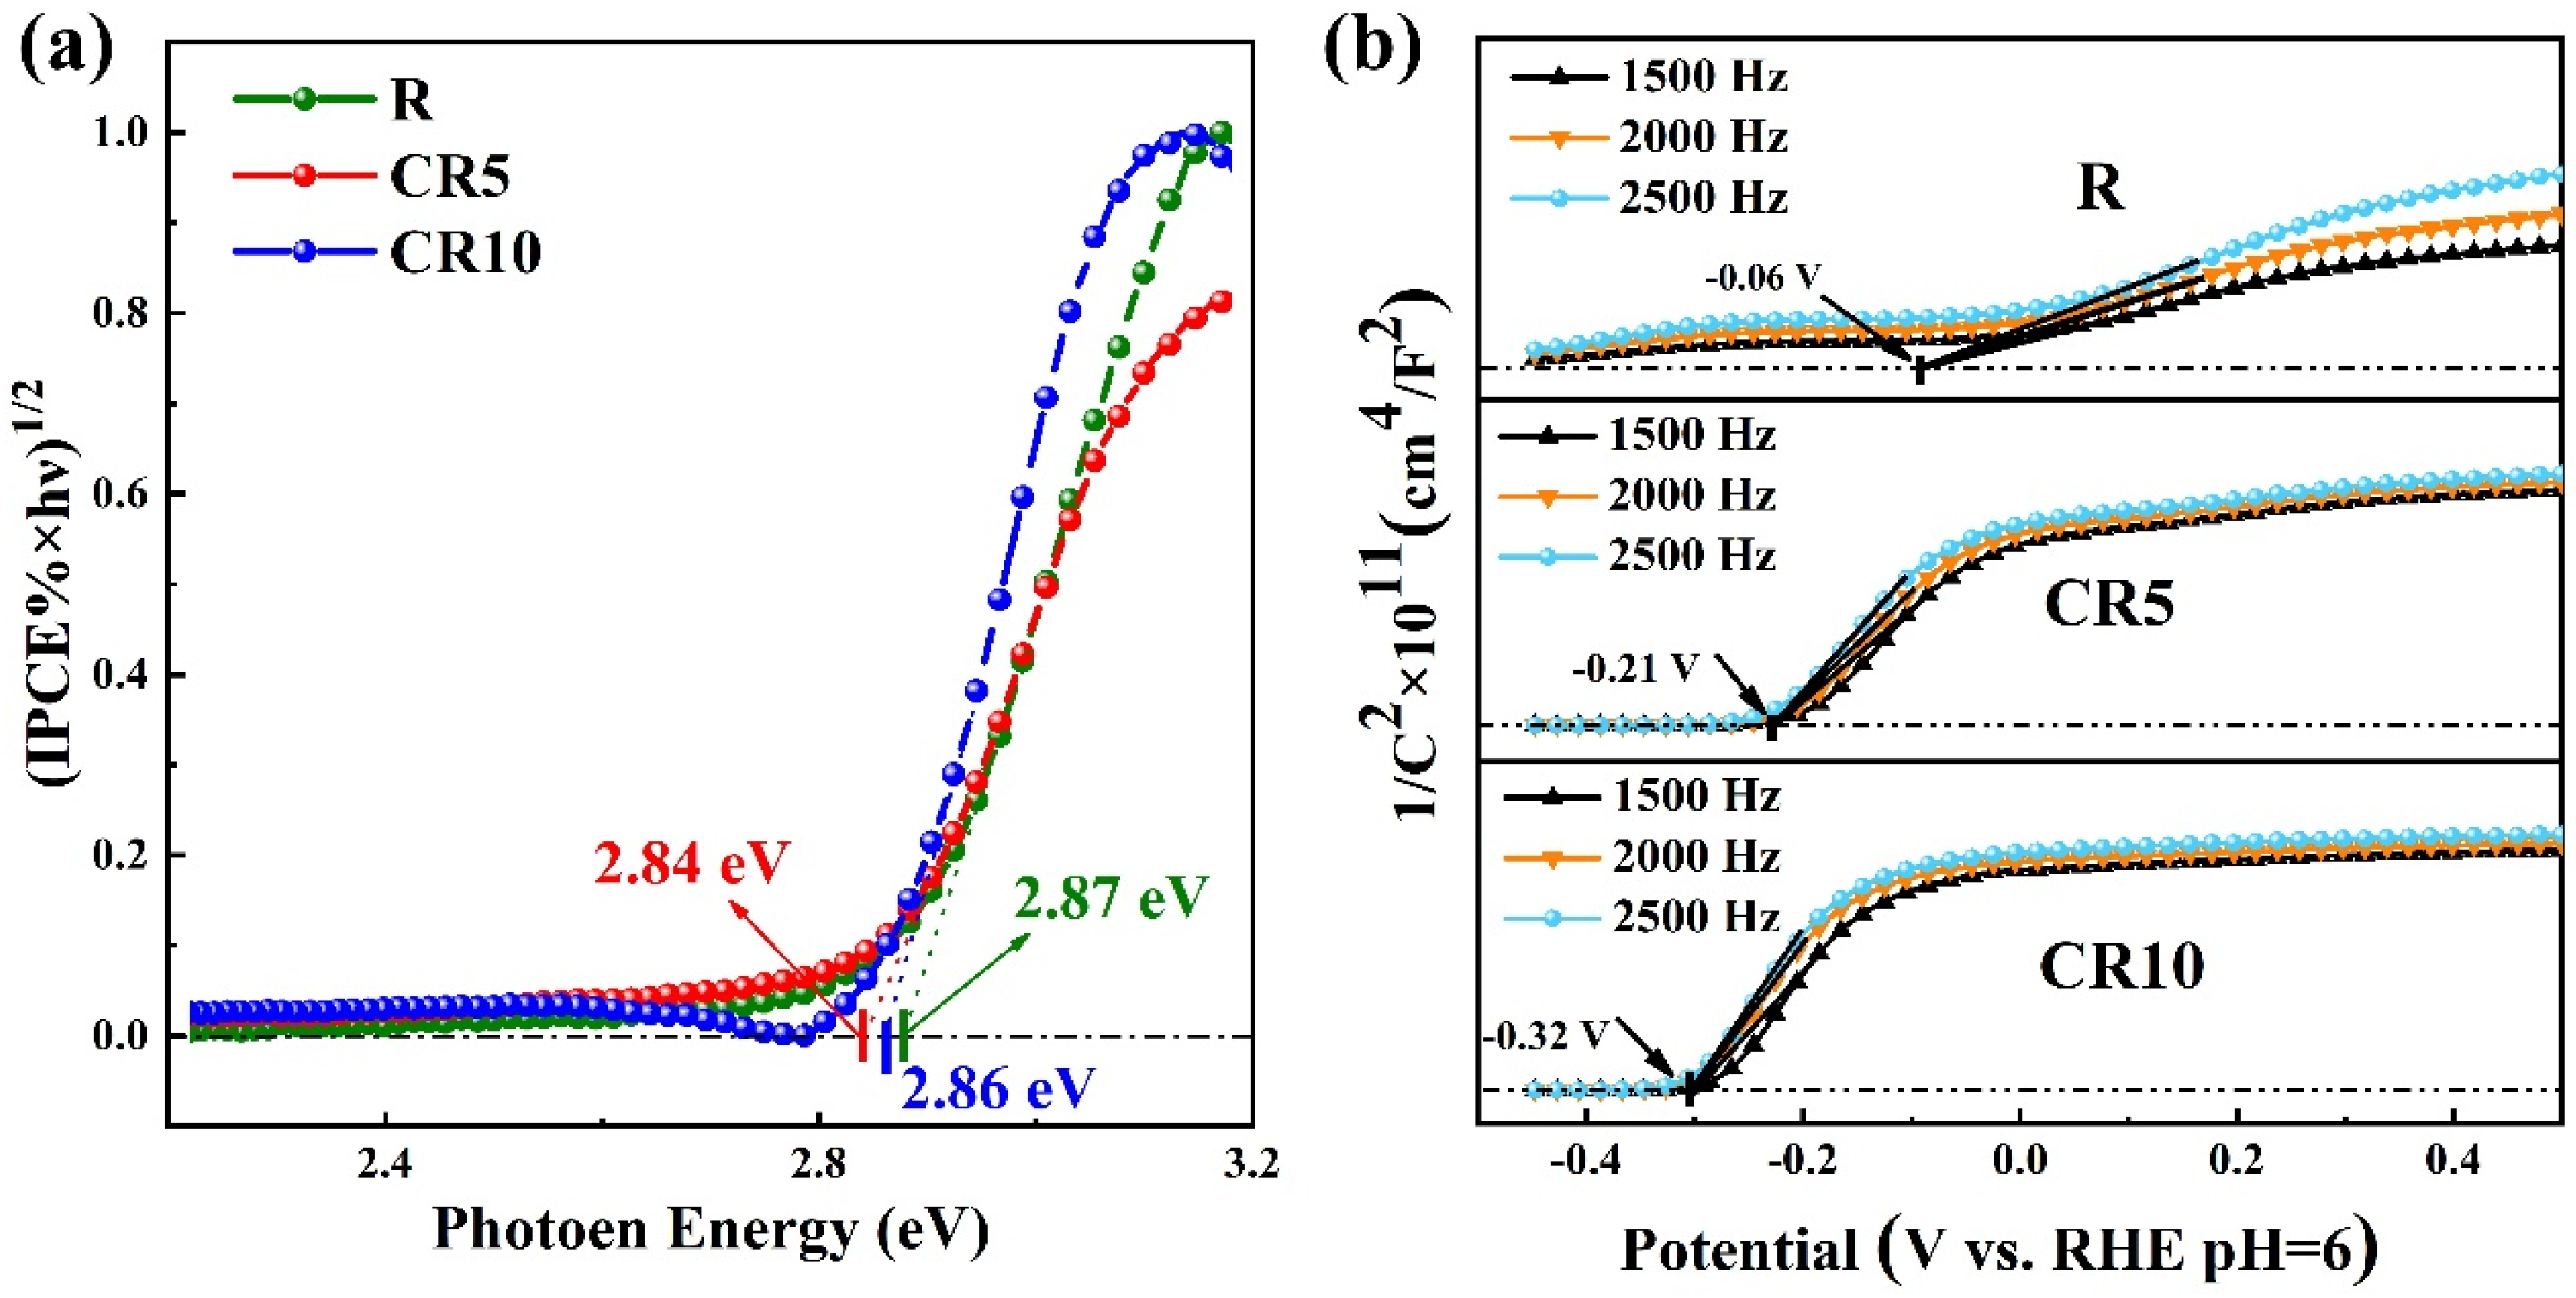
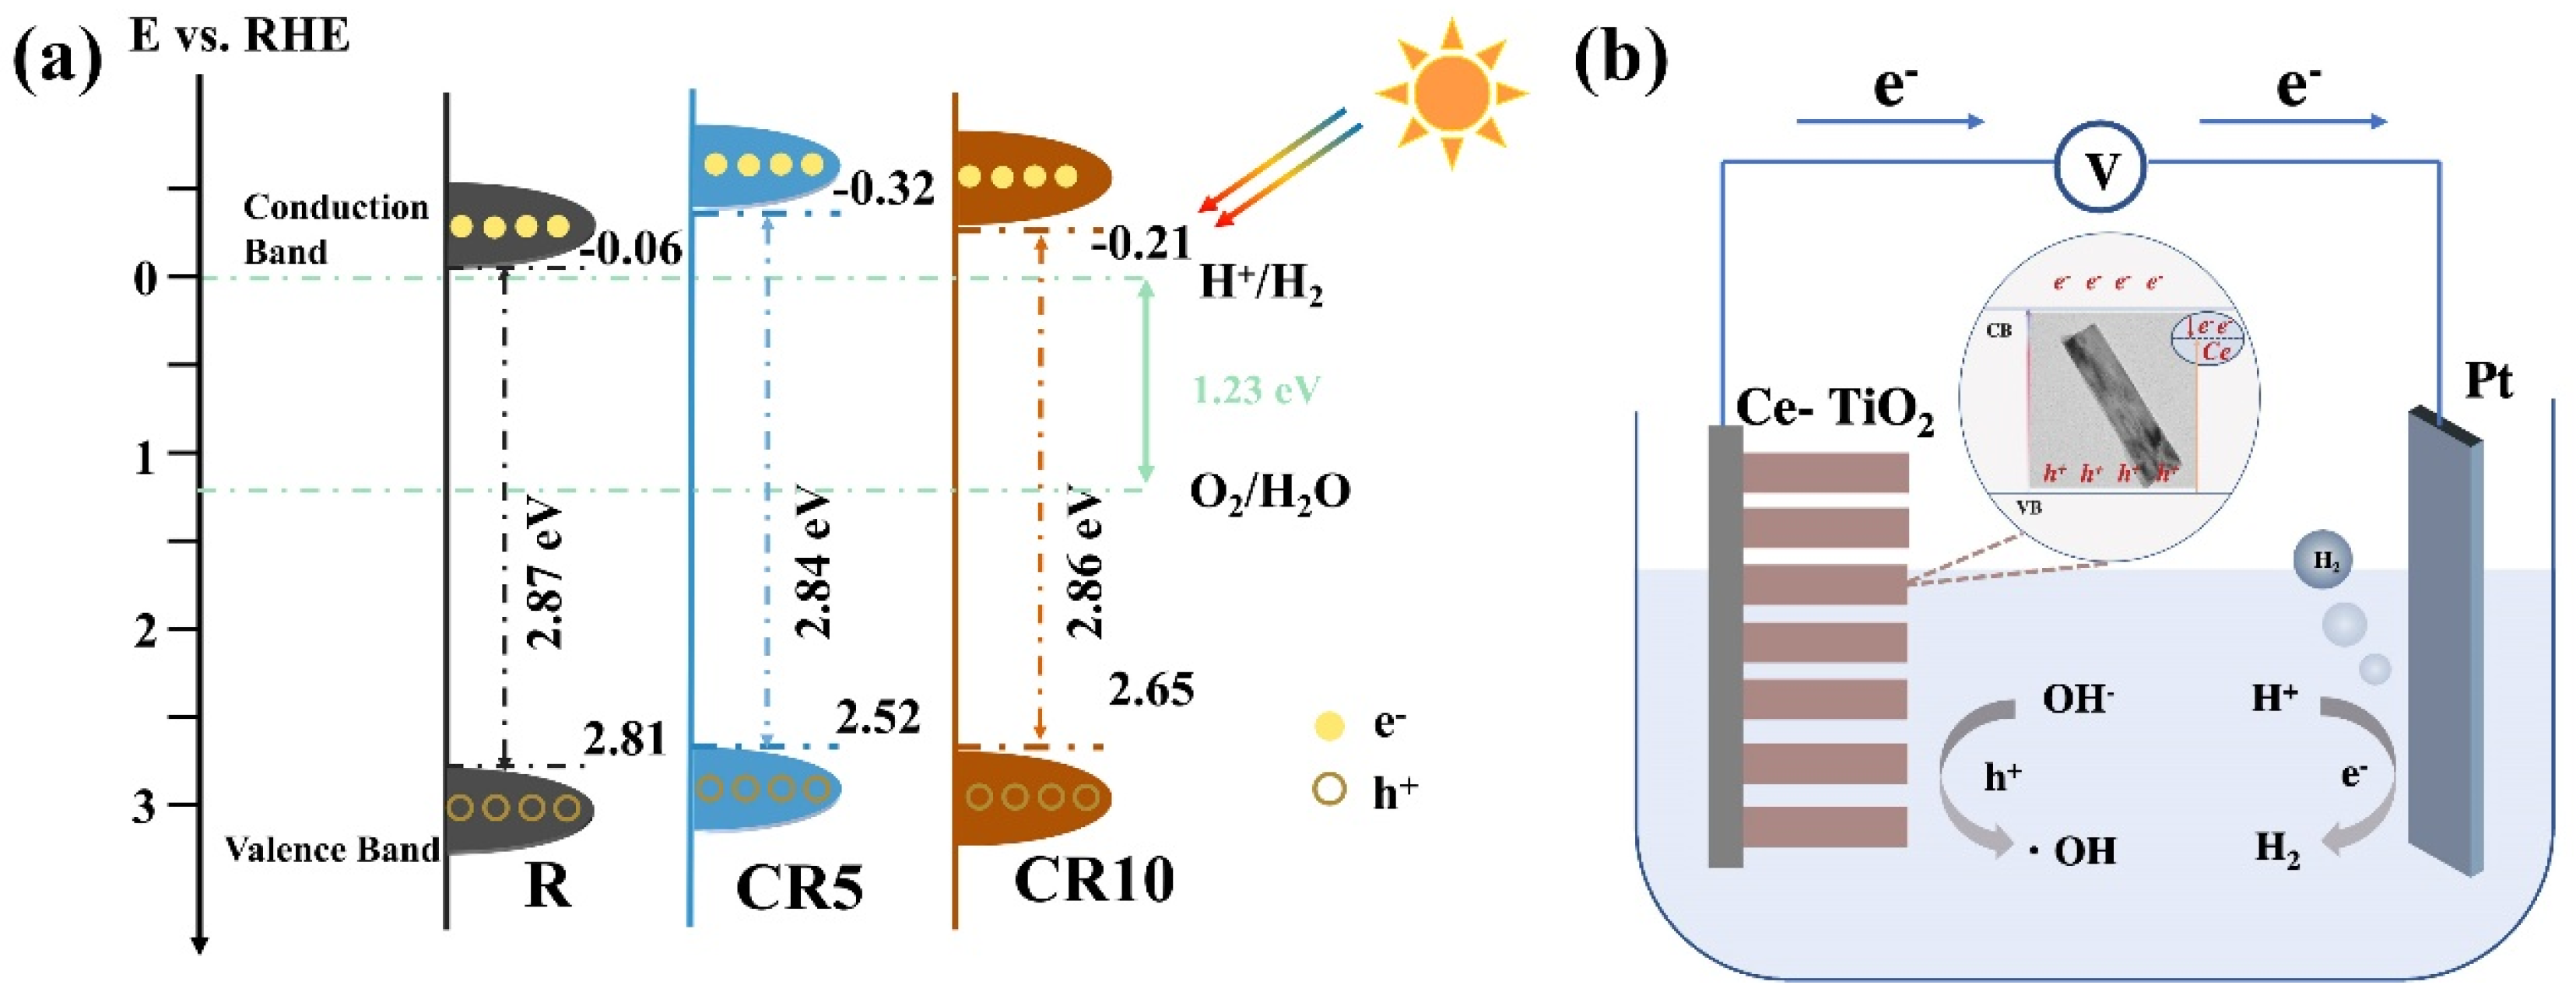
2.3. Photoelectrochemical Performance Analysis of Ce-Doped TiO2 Photoanode

Experiments were conducted using a standard three-electrode system to explore the influence of cerium (Ce) doping on the photoelectrochemical performance of TiO2 nanorod arrays. In these experiments, a 0.1 M Na2SO4 electrolyte was utilized to measure the photocurrent density of the photoanodes. This setup allows for a detailed assessment of how Ce doping affects the efficiency and effectiveness of TiO2 as a photoanode material in photoelectrochemical applications. The photoelectron conversion efficiency was calculated, and the results are shown in Figure 5. Figure 5a displays the linear sweep voltammetry (LSV) curves of R, CR5, and CR10 photoanodes under AM 1.5G full spectrum illumination. Both CR5 and CR10 photoanodes exhibit higher photocurrent density than the R photoanode, with CR5 demonstrating the highest photocurrent density. When a bias voltage of 1.23 V (vs. RHE) is applied, the CR5 photoanodes demonstrate a remarkable photocurrent density of 1.98 mA/cm2. This value is significantly higher—2.6 times—than the original TiO2 photoanodes, which achieve a photocurrent density of 0.77 mA/cm2 under identical conditions. This substantial increase in photocurrent density underscores the effectiveness of Ce doping in enhancing the photoelectrochemical performance of TiO2 nanorod arrays, making the CR5 photoanodes a superior choice for applications requiring efficient photocatalytic activity. Figure 5b shows the photoconversion efficiency of each photoanode at different bias voltages. The CR5 photoanode achieves its highest photoconversion efficiency of 0.43% at a bias voltage of 0.81 V (vs. RHE), notably superior to the other photoanode tested. Specifically, the CR10 photoanode reaches a photoconversion efficiency of 0.19% at a bias voltage of 0.86 V (vs. RHE).
In comparison, the R photoanode attains an efficiency of 0.14% at a bias voltage of 0.94 V (vs. RHE). This indicates that the CR5 photoanodes exhibit superior PEC water-splitting performance. Stability is an important indicator for evaluating catalyst performance. Therefore, the stability of Ce-doped TiO2 photoanodes under certain biases was explored. The testing conditions included an applied bias of 0.8 V (vs. Ag/AgCl) and a light-dark cycle time of 15 min. The results are presented in Figure 5c. It can be observed that the photoanodes maintain excellent stability under a bias voltage of 0.8 V (vs. Ag/AgCl), indicating the excellent stability of the hydrothermally synthesized Ce-doped TiO2 photoanodes. Even after 12 h of testing, the photoanodes retain high activity. At a bias voltage of 0.8 V (vs. Ag/AgCl), the CR5 photoanodes maintain a stable photocurrent density of 2.3 mA/cm2. In contrast, the original TiO2 photoanodes display a much lower photocurrent density of 0.8 mA/cm2 under the same conditions. This significant enhancement in photocurrent density—nearly three times greater—demonstrates the substantial improvement in photoelectrochemical performance achieved through Ce doping of the TiO2 photoanodes. The results highlight the effectiveness of Ce incorporation in boosting the photoactive properties of TiO2 nanorod array photoanodes.
To further investigate the influence of light illumination on the photoelectrochemical performance of the photoanodes, we conducted Incident Photon-to-Current Efficiency (IPCE) testing. The photoanodes designated as R, CR5, and CR10 were utilized as the working electrodes. Their monochromatic photocurrent responses were evaluated under Electrochemical Noise (ECN) conditions and applied bias. The findings from the ECN mode, without bias, are depicted in Figure 6a,c. These figures reveal that the photocurrent density for the CR5 and CR10 photoanodes surpasses that of the R photoanode. The IPCE testing results reveal a significant improvement in the performance of the Ce-doped TiO2 photoanodes in the ultraviolet (UV) region, with the CR5 photoanodes exhibiting the most pronounced light response. The IPCE values of CR5 photoanodes are 10.8% at 356 nm and 7.97% at 390 nm. Under applied bias conditions, IPCE testing was performed on the photoanodes, and the results are shown in Figure 6b,d. The testing conditions included a light source ranging from 300 nm to 600 nm with a wavelength resolution of 1 nm and applied bias voltages of 0.2 V, 0.4 V, 0.6 V, and 0.8 V (vs. Ag/AgCl). With increasing applied bias, the photocurrent density of R, CR5, and CR10 photoanodes all increase, indicating that bias promotes the enhancement of photoelectrochemical performance. When the bias increases from 0.2 V (vs. Ag/AgCl) to 0.4 V (vs. Ag/AgCl), the photocurrent of R, CR5, and CR10 photoanodes significantly increases. However, as the voltage increases, the increase in photocurrent density slows down, consistent with the trend observed in LSV. Furthermore, it can be observed that under applied bias, the CR5 photoanodes still exhibit the highest photocurrent density and IPCE. When the applied bias reaches 0.8 V (vs. Ag/AgCl), the CR5 photoanodes reach a maximum photocurrent density of 78 µA/cm2, with a quantum efficiency of 73% at a wavelength of 394 nm. This further confirms the significant effect of Ce doping on enhancing the photoelectrochemical performance of TiO2 photoanodes in the UV region.
The normalized IPCE curves in Figure 7a provide the bandgap values for Ce-doped TiO2 photoanodes, with R, CR5, and CR10 having bandgaps of 2.87 eV, 2.84 eV, and 2.86 eV, respectively. This indicates that the doping of Ce ions slightly reduces the bandgap of TiO2, possibly due to the introduction of Ce ions causing slight lattice distortions in TiO2, thus affecting its electronic structure. Figure 7b illustrates the Mott–Schottky (M-S) plots at different frequencies (1000 Hz, 1500 Hz, 2000 Hz) for R, CR5, and CR10 photoanodes under dark conditions. The positive slope of the M-S curves for R, CR5, and CR10 photoanodes indicates that they belong to n-type semiconductors. By determining the intersection of the slope with the x-axis, the flat-band potentials for R, CR5, and CR10 photoanodes are found to be −0.06 V, −0.32 V, and −0.21 V (vs. RHE), respectively. It can be observed that Ce-doped TiO2 photoanodes have more negative flat-band potentials compared to pristine TiO2 photoanodes, indicating enhanced electron reduction ability and favorability for catalyzing hydrogen evolution reactions. These results further confirm the positive impact of Ce doping on the electronic structure and photoelectrochemical performance of TiO2 photoanodes, particularly in improving electron reduction ability and catalytic hydrogen production. Through these analyses, we can conclude that Ce doping not only improves the light absorption characteristics of TiO2 photoanodes but also optimizes their electron transport and catalytic performance, thereby enhancing the efficiency of photocatalytic hydrogen evolution.
Electrochemical impedance spectroscopy (EIS) is a research technique that involves applying a small amplitude sinusoidal signal to the photoelectrode under a specific voltage bias and measuring the system’s response over a frequency range from 10 MHz to 100 kHz. This method produces Nyquist plots, which graph real versus imaginary impedance. In these plots, the X-axis represents real impedance, while the Y-axis represents imaginary impedance. Theoretically, a typical Nyquist plot can be divided into two parts: the high-frequency region, observable near the plot’s starting point, where photoelectrochemical processes are governed by the charge transfer rate, resulting in a semicircular curve that indicates the interface between the photoelectrode and the electrolyte, and the low-frequency region, which is farther from the origin and where the mass transfer rate determines processes. In practical EIS experiments, Nyquist plots may exhibit distorted semicircular or linear shapes due to the inherent electrochemical characteristics of the electrodes, electrolyte, and experimental conditions affecting the curve shape. Smaller semicircle radii indicate lower charge transfer impedance at the electrode, leading to the rapid separation of photo-generated electrons and holes. In dark conditions, we tested the electrochemical impedance spectra of photoanodes using a CS350H electrochemical workstation, as shown in Figure 8. The EIS curves for CR5 and CR10 photoanodes exhibit smaller semicircle radii compared to the R photoanode. This means that smaller semicircle radii correspond to lower charge transfer impedance at the electrodeelectrolyte interface, indicating that Ce doping can improve the charge transfer performance of TiO2 nanorods, consistent with the increase in photocurrent density. In the equivalent circuit model, Rs represents the resistance between the photoelectrode and the solution, also known as solution resistance, CPE represents the capacitive behavior at the interface between the photoelectrode and the solution, R represents the charge transfer resistance within the photoelectrode, and Zw represents the Warburg impedance associated with diffusion-controlled reactions, reflecting the impedance response of the photoelectrode.
The onset potentials of R, CR5, and CR10 photoanodes were tested and are visualized in Figure S3. From the figure, it can be observed that the onset potential for the CR5 photoanodes is 0.08 V (vs. RHE), and for the CR10 photoanodes, it is 0.176 V (vs. RHE), both of which are lower than that of the R photoanode (0.187 V vs. RHE). This more negative onset potential results in decreased charge transfer resistance at the semiconductor/electrolyte interface, facilitating charge transfer within the photoanodes. This is also corroborated by the impedance spectra presented in Figure 8.
To investigate the impact of the electrochemically active surface area (ECSA) of photoanodes on their performance, testing conditions were set with the open-circuit potential of the photoanodes at 0.16 V, centering around this potential within a ±50 mV range. The charging currents (Ic) obtained at different scan rates of 2 mV/s, 6 mV/s, and 8 mV/s indicate that the double-layer capacitance of the photoanodes, which is directly related to the ECSA, can be derived when the capacitance (Cs) is only associated with the electrolyte. According to Figure S4, the double-layer capacitance of the R photoanode is 0.0085 mF/cm2, while that of the CR5 photoanodes is 0.0094 mF/cm2. Hence, the ECSA of the CR5 photoanodes is 1.1 times that of the R photoanode, suggesting a greater exposure of active sites conducive to participation in reactions. For the n-type semiconductor–electrolyte interface, the flat-band potential approximates the conduction band position. Based on the specific bandgap diagram (Figure 7a) and the conduction band position diagram (Figure 7b) obtained for the photoanodes, the bandgap structure of the Ce-doped TiO2 photoanodes can be derived, as depicted in Figure 9.
To investigate the working mechanism of Ce-doped TiO2 photoanodes, this study constructed a schematic diagram of the energy band structure and the photoelectrocatalytic mechanism of the Ce-doped TiO2 photoanodes, as shown in Figure 9. The successful Ce doping into TiO2 nanorods introduces a new electronic level near the TiO2 conduction band, as illustrated in Figure 9b. When the photoanodes are exposed to light, electrons (e) and holes (h+) are generated internally. The newly introduced electronic level effectively inhibits the recombination of electrons and holes, allowing the photo-generated electrons to transfer to the platinum (Pt) electrode, which reacts with H+ to produce hydrogen. Meanwhile, the remaining holes can oxidize OH into hydroxyl radicals (⋅OH). Therefore, the Ce-doped TiO2 photoanodes not only significantly suppress the recombination of photo-generated electron-hole pairs but also reduce the interfacial transfer resistance, thereby effectively enhancing the photoelectrochemical (PEC) performance and hydrogen production efficiency of the TiO2 photoanode.

3. Materials and Methods

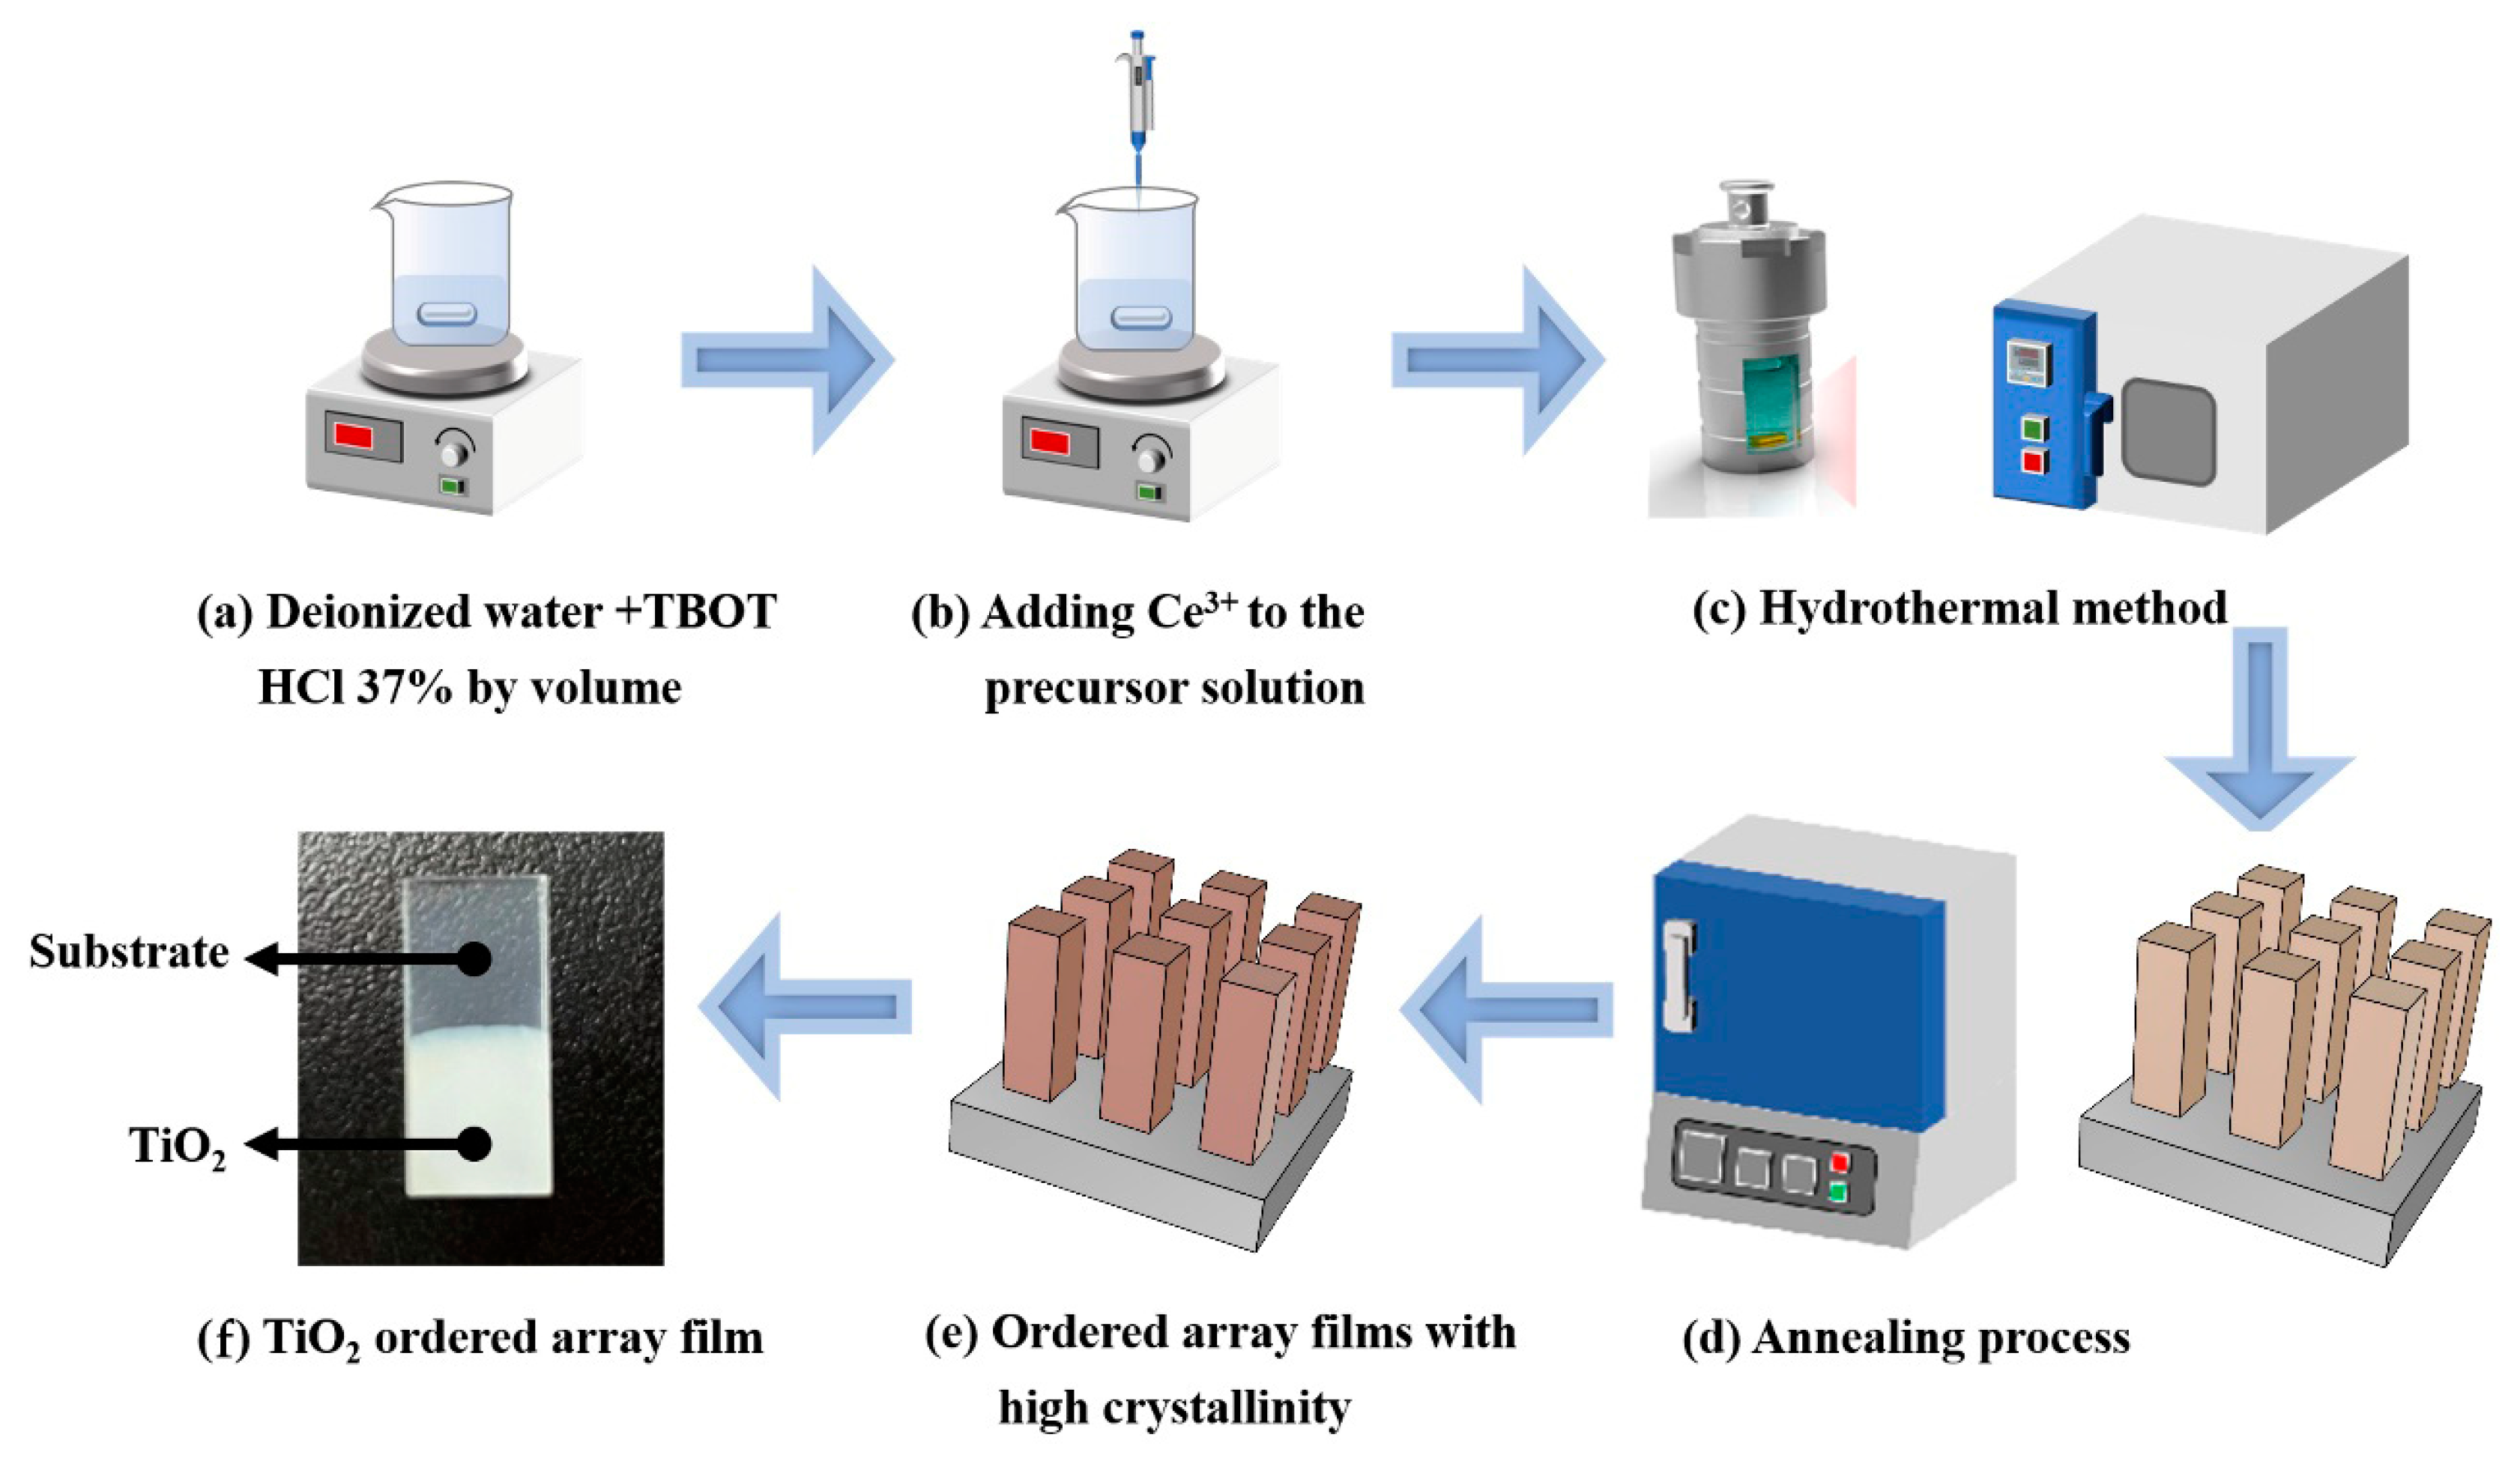
3.1. Synthesis Methods

The hydrothermal method was employed to prepare TiO2 nanorod array photoanodes, which were further optimized for their photoelectrochemical performance by doping them with cerium (Ce). Firstly, fluorine-doped tin oxide (FTO)-coated glass slides (1 × 2.3 cm2) were cleaned with acetone, ethanol, and ultrapure water using ultrasound to remove surface oils and dust, followed by drying under an N2 atmosphere. The cleaned FTO glass was used as the substrate for growing ordered TiO2 nanorod arrays via the hydrothermal method [37,38,39].
The specific procedure for preparing TiO2 nanorod array photoanodes via hydrothermal method is as follows: 15 mL of ultrapure water and 15 mL of concentrated hydrochloric acid (37% by volume) were mixed and stirred for 15 min until the solution became clear. Then, 0.36 mL of TBOT (titanium butoxide) solution was added, stirring continued for 30 min until the solution became clear and was labeled as Solution 1. Solution 1 was added to a 25 mL Teflon-lined autoclave, and the cleaned FTO glass was placed with the conductive side facing downward at a 45° angle to the tube wall. The autoclave was subjected to hydrothermal treatment at 170 °C for 6 h and then cooled naturally. Afterward, the photoanode was removed from the autoclave, rinsed with ethanol and water, and dried under an N2 atmosphere. To enhance the crystallinity of the titanium dioxide nanorod arrays, the dried photoanode was annealed from room temperature to 450 °C at a heating rate of 1 °C/min and held for 1 h. The as-prepared TiO2 nanorod array photoanodes sample is denoted as R. To prepare different contents Ce-doped TiO2 nanorod array photoanodes, and additional 21.7 mg and 43.4 mg cerium nitrate hexahydrates were added to Solution 1, respectively, resulting in hydrothermal solutions containing different concentrations of Ce ions. The following experimental procedure was the same as the preparation of R. The as-prepared two Ce-doped TiO2 nanorod array photoanodes are denoted as CR5 and CR10 (Figure 10).

3.2. Characterization

Various advanced instrumentation techniques were employed to gain a deeper understanding of the samples’ microstructure and chemical composition. Initially, the morphology and composition of the samples were thoroughly analyzed using a field emission scanning electron microscope equipped with an energy-dispersive spectroscope (Apreo SLoVac, Thermo Fisher, Waltham, MA, USA) and a high-resolution transmission electron microscope (TECNAI F30, Philips FEI, Eindhoven, The Netherlands). This combination of techniques provides high-resolution images of the sample surfaces along with elemental distribution information. Furthermore, the crystalline structure and phase of the synthesized materials were determined using X-ray diffraction (XRD) analysis with a Miniflex 600 system (Rigaku, Tokyo, Japan). For the XRD analysis, the samples were scanned in the 2 θ range of 20 to 80° at a rate of 5°/min using Cu Kα radiation (λ = 0.15406 nm) to obtain crystallographic information. To further investigate the surface chemical properties of the samples, including chemical species, states, and concentrations, X-ray photoelectron spectroscopy (XPS) was utilized. XPS measurements were conducted using a Thermo Scientific K-Alpha system (Waltham, MA, USA), providing detailed information on the chemical states of surface elements. Through these comprehensive instrumental characterization techniques, we were able to thoroughly assess the physical and chemical properties of the samples, providing a scientific basis for the application and optimization of material performance.

3.3. Catalytic Evaluation

To comprehensively evaluate the performance of TiO2 and different contents of Ce-doped TiO2 nanorod array photoanodes in photocatalytic hydrogen production, this study adopted a combination strategy using a Labsolar-6A photochemical reactor and an FL9790 gas chromatography instrument. For the photoelectrochemical hydrogen production experiment, a Squidstat Plus electrochemical workstation was used to apply the necessary bias, and 60 mL of 0.1 M Na2SO4 solution was used as the medium for the electrolyte. It is worth noting that no sacrificial agents were used in the experiment. Before the start of the experiment, nitrogen was used to pretreat and remove dissolved oxygen from the electrolyte solution, ensuring an oxygen-free environment for the experiment. In addition, a circulating cooling water system was used to maintain a stable temperature during the experiment to keep the reaction environment at a constant temperature of 5 °C. Every 30 min, the gas produced by the reaction was detected and analyzed using the equipped gas chromatograph to assess the photocatalytic activity and hydrogen production efficiency of the prepared photoanodes. This experimental procedure and equipment configuration aim to provide a reliable evaluation method for the performance of TiO2 and different contents of Ce-doped TiO2 nanorod array photoanodes in photocatalytic hydrogen production.

4. Conclusions

In this study, Ce-doped TiO2 photoanodes were successfully prepared, and the significant enhancement effect of Ce doping on TiO2 was revealed through in-depth investigations of their morphology, structure, photoelectrochemical performance, and photocatalytic hydrogen production efficiency. The results showed that Ce doping induced lattice distortion in TiO2 and optimized the material’s structure, which was crucial for improving its photoelectrical performance. Specifically, Ce doping significantly increased the photocurrent density and photoconversion efficiency of the TiO2 photoanodes. The CR5 sample achieved a photocurrent density of 1.98 mA/cm2 at a bias of 1.23 V (vs. RHE) and a photoconversion efficiency of 0.43%, significantly higher than the undoped TiO2 sample. These performance enhancements were mainly attributed to reduced charge recombination efficiency and improved charge transfer ability due to Ce doping. Moreover, Ce doping introduced new electronic energy levels in TiO2, which played an important role in promoting charge separation and increasing hydrogen gas production. In the photoelectrolysis of water, the CR5 sample achieved a hydrogen production rate of 37.03 µmol·cm−2·h−1, significantly higher than the 12.64 µmol·cm−2·h−1 of the pristine TiO2 sample. These results demonstrated the effectiveness of Ce doping in improving the photoelectrochemical (PEC) water splitting performance. They highlighted the crucial role of Ce doping in optimizing charge dynamics and enhancing photocatalytic activity.
In conclusion, Ce doping optimized the structure and electronic properties of TiO2 photoanodes and significantly enhanced their photoelectrochemical activity and hydrogen production performance. These findings provide a new strategy for improving the performance of TiO2-based photocatalysts and offer new insights into the application of rare earth elements in enhancing photoelectrocatalytic water splitting performance. Future research can further explore the influence of Ce doping on the properties of other semiconductor materials and optimize the PEC performance of these materials by controlling doping levels and conditions.

Supplementary Materials

The following supporting information can be downloaded at: https://www.mdpi.com/article/10.3390/catal14090639/s1. Figure S1: Optical images (a,c) and SEM images (b,d) of CR5 before and after being treated in aqua regia for ICP-MS analysis. Figure S2: SEM image (a) and the corresponding EDS elemental mapping image of Ti (b), O (c), and Ce (d) of the CR5. Figure S3: Onset potentials of R, CR5, and CR10 nanorod array photoanodes. Figure S4: ESCA spectra in 0.1 M Na2SO4 electrolyte: (a) R photoanode, (b) CR5 photoanode. Reference [25] was cited in Supplementary Materials.

Author Contributions

Conceptualization, X.-M.L. and Y.-X.C.; methodology, B.-L.L., M.-L.Z. and R.C.; investigation, W.C.; validation, A.-S.S.; formal analysis, B.-T.N., M.-L.Z. and R.C.; data curation, M.-L.Z. and R.C.; writing—original draft preparation, B.-L.L., R.C. and M.-L.Z.; writing, reviewing, and editing, X.-M.L. and Y.-X.C.; supervision, X.-M.L. and Y.-X.C.; project administration, X.-M.L. and Y.-X.C.; funding acquisition, X.-M.L. and Y.-X.C. All authors have read and agreed to the published version of the manuscript.

Funding

This research was funded by the National Natural Science Foundation of China (22272069), the Natural Science Foundation of Fujian Province (2021J01988 and 2023H0046), and the XMIREM autonomously deployment project (2023CX10, 2023GG01).

Data Availability Statement

The original contributions presented in the study are included in the article/Supplementary Materials, further inquiries can be directed to the corresponding author.

Conflicts of Interest

The authors declare no conflicts of interest.

References

  1. Eidsvåg, H.; Bentouba, S.; Vajeeston, P.; Yohi, S.; Velauthapillai, D. TiO2 as a Photocatalyst for Water Splitting—An Experimental and Theoretical Review. Molecules 2021, 26, 1687. [Google Scholar] [CrossRef] [PubMed]
  2. Purabgola, A.; Mayilswamy, N.; Kandasubramanian, B. Graphene-based TiO2 composites for photocatalysis & environmental remediation: Synthesis and progress. Environ. Sci. Pollut. Res. 2022, 29, 32305–32325. [Google Scholar] [CrossRef]
  3. Li, R.; Weng, Y.; Zhou, X.; Wang, X.; Mi, Y.; Chong, R.; Han, H.; Li, C. Achieving overall water splitting using titanium dioxide-based photocatalysts of different phases. Energy Environ. Sci. 2015, 8, 2377–2382. [Google Scholar] [CrossRef]
  4. Li, H.; Liu, H.; Wang, F.; Li, G.; Wang, X.; Tang, Z. Hot electron assisted photoelectrochemical water splitting from Au-decorated ZnO@TiO2 nanorods array. Nano Res. 2022, 15, 5824–5830. [Google Scholar] [CrossRef]
  5. Gao, C.; Wei, T.; Zhang, Y.; Song, X.; Huan, Y.; Liu, H.; Zhao, M.; Yu, J.; Chen, X. A Photoresponsive Rutile TiO2 Heterojunction with Enhanced Electron–Hole Separation for High-Performance Hydrogen Evolution. Adv. Mater. 2019, 31, e1806596. [Google Scholar] [CrossRef] [PubMed]
  6. Wang, H.; Jiang, H.; Huo, P.; Edelmannová, M.F.; Čapek, L.; Kočí, K. Hydrogen production from methanol-water mixture over NiO/TiO2 nanorods structure photocatalysts. J. Environ. Chem. Eng. 2022, 10, 106908. [Google Scholar] [CrossRef]
  7. Chen, S.; Liu, W.; Zhang, S.; Chen, Y. Preparation and activity evaluation of relative p–n junction photocatalyst Co-TiO2/TiO2. J. Sol-Gel Sci. Technol. 2010, 54, 258–267. [Google Scholar] [CrossRef]
  8. Prakash, J.; Samriti; Kumar, A.; Dai, H.; Janegitz, B.C.; Krishnan, V.; Swart, H.C.; Sun, S. Novel rare earth metal–doped one-dimensional TiO2 nanostructures: Fundamentals and multifunctional applications. Mater. Today Sustain. 2021, 13, 100066. [Google Scholar] [CrossRef]
  9. Li, J.; Yang, X.; Yu, X.; Xu, L.; Kang, W.; Yan, W.; Gao, H.; Liu, Z.; Guo, Y. Rare earth oxide-doped titania nanocomposites with enhanced photocatalytic activity towards the degradation of partially hydrolysis polyacrylamide. Appl. Surf. Sci. 2009, 255, 3731–3738. [Google Scholar] [CrossRef]
  10. Du, P.; Bueno-López, A.; Verbaas, M.; Almeida, A.; Makkee, M.; Moulijn, J.; Mul, G. The effect of surface OH-population on the photocatalytic activity of rare earth-doped P25-TiO2 in methylene blue degradation. J. Catal. 2008, 260, 75–80. [Google Scholar] [CrossRef]
  11. Pepin, P.A.; Lee, J.D.; Murray, C.B.; Vohs, J.M. Thermal and Photocatalytic Reactions of Methanol and Acetaldehyde on Pt-Modified Brookite TiO2 Nanorods. ACS Catal. 2018, 8, 11834–11846. [Google Scholar] [CrossRef]
  12. Pu, Y.-C.; Wang, G.; Chang, K.-D.; Ling, Y.; Lin, Y.-K.; Fitzmorris, B.C.; Liu, C.-M.; Lu, X.; Tong, Y.; Zhang, J.Z.; et al. Au Nanostructure-Decorated TiO2 Nanowires Exhibiting Photoactivity Across Entire UV-visible Region for Photoelectrochemical Water Splitting. Nano Lett. 2013, 13, 3817–3823. [Google Scholar] [CrossRef] [PubMed]
  13. Zhou, Q.; Chen, Y.; Shi, H.; Chen, R.; Ji, M.; Li, K.; Wang, H.; Jiang, X.; Lu, C. The Construction of p/n-Cu2O Heterojunction Catalysts for Efficient CO2 Photoelectric Reduction. Catalysts 2023, 13, 857. [Google Scholar] [CrossRef]
  14. Chen, R.; Wang, Y.-Y.; Jiang, X.; Ji, M.-H.; Li, K.-X.; Shi, H.-Y.; Wang, H.-L.; Chen, Y.-X.; Lu, C.-Z. Lotus pollen-derived nitrogen and phosphorus self-doped TiO2/carbon materials for photoelectrochemical application. J. Environ. Chem. Eng. 2024, 12, 112743. [Google Scholar] [CrossRef]
  15. Pal, B.; Bakr, Z.H.; Krishnan, S.G.; Yusoff, M.M.; Jose, R. Large scale synthesis of 3D nanoflowers of SnO2/TiO2 composite via electrospinning with synergistic properties. Mater. Lett. 2018, 225, 117–121. [Google Scholar] [CrossRef]
  16. Ghafourian, N.; Hosseini, S.N.; Mahmoodi, Z.; Masnabadi, N.; Thalji, M.R.; Abhari, A.R.; Al Zoubi, W.; Chong, K.F.; Ali, G.A.M.; Bakr, Z.H. TiO2-Mica 450 composite for photocatalytic degradation of methylene blue using UV irradiation. Emergent Mater. 2023, 6, 1527–1536. [Google Scholar] [CrossRef]
  17. Kisumi, T.; Tsujiko, A.; Murakoshi, K.; Nakato, Y. Crystal-face and illumination intensity dependences of the quantum efficiency of photoelectrochemical etching, in relation to those of water photooxidation, at n-TiO2 (rutile) semiconductor electrodes. J. Electroanal. Chem. 2003, 545, 99–107. [Google Scholar] [CrossRef]
  18. Hoang, S.; Berglund, S.P.; Hahn, N.T.; Bard, A.J.; Mullins, C.B. Enhancing Visible Light Photo-oxidation of Water with TiO2 Nanowire Arrays via Cotreatment with H2 and NH3: Synergistic Effects between Ti3+ and N. J. Am. Chem. Soc. 2012, 134, 3659–3662. [Google Scholar] [CrossRef]
  19. Fan, Z.; Meng, F.; Gong, J.; Li, H.; Ding, Z.; Ding, B. One-step hydrothermal synthesis of mesoporous Ce-doped anatase TiO2 nanoparticles with enhanced photocatalytic activity. J. Mater. Sci. Mater. Electron. 2016, 27, 11866–11872. [Google Scholar] [CrossRef]
  20. Tian, M.; Wang, H.; Sun, D.; Peng, W.; Tao, W. Visible light driven nanocrystal anatase TiO2 doped by Ce from sol–gel method and its photoelectrochemical water splitting properties. Int. J. Hydrogen Energy 2014, 39, 13448–13453. [Google Scholar] [CrossRef]
  21. de Lima, J.F.; Harunsani, M.H.; Martin, D.J.; Kong, D.; Dunne, P.W.; Gianolio, D.; Kashtiban, R.J.; Sloan, J.; Serra, O.A.; Tang, J.; et al. Control of chemical state of cerium in doped anatase TiO2 by solvothermal synthesis and its application in photocatalytic water reduction. J. Mater. Chem. A 2015, 3, 9890–9898. [Google Scholar] [CrossRef]
  22. Tong, M.-H.; Chen, Y.-X.; Wang, T.-M.; Lin, S.-W.; Li, G.; Zhou, Q.-Q.; Chen, R.; Jiang, X.; Liao, H.-G.; Lu, C.-Z. Cerium Synchronous Doping in Anatase for Enhanced Photocatalytic Hydrogen Production from Ethanol-Water Mixtures. Molecules 2023, 28, 2433. [Google Scholar] [CrossRef] [PubMed]
  23. Tong, M.-H.; Chen, Y.-X.; Lin, S.-W.; Zhao, H.-P.; Chen, R.; Jiang, X.; Shi, H.-Y.; Zhu, M.-L.; Zhou, Q.-Q.; Lu, C.-Z. Synchronous electrochemical anodization: A novel strategy for preparing cerium doped TiO2 nanotube arrays toward visible-light PEC water splitting. Electrochim. Acta 2023, 463, 142793. [Google Scholar] [CrossRef]
  24. Lin, S.-W.; Tong, M.-H.; Chen, Y.-X.; Chen, R.; Zhao, H.-P.; Jiang, X.; Yang, K.; Lu, C.-Z. CeO2/TiO2 Heterojunction Nanotube Arrays for Highly Efficient Visible-Light Photoelectrochemical Water Splitting. ACS Appl. Energy Mater. 2023, 6, 1093–1102. [Google Scholar] [CrossRef]
  25. Chen, Y.; Lavacchi, A.; Chen, S.; di Benedetto, F.; Bevilacqua, M.; Bianchini, C.; Fornasiero, P.; Innocenti, M.; Marelli, M.; Oberhauser, W.; et al. Electrochemical Milling and Faceting: Size Reduction and Catalytic Activation of Palladium Nanoparticles. Angew. Chem. Int. Ed. 2012, 51, 8500–8504. [Google Scholar] [CrossRef]
  26. Laczai, N.; Kovács, L.; Kocsor, L.; Bencs, L. Influence of LiF additive and cerium doping on photoluminescence properties of polycrystalline YSO and LYSO. Mater. Res. Bull. 2021, 133, 111018. [Google Scholar] [CrossRef]
  27. Sibu, C.P.; Kumar, S.R.; Mukundan, P.; Warrier, K.G.K. Structural Modifications and Associated Properties of Lanthanum Oxide Doped Sol−Gel Nanosized Titanium Oxide. Chem. Mater. 2002, 14, 2876–2881. [Google Scholar] [CrossRef]
  28. Nasir, M.; Bagwasi, S.; Jiao, Y.; Chen, F.; Tian, B.; Zhang, J. Characterization and activity of the Ce and N co-doped TiO2 prepared through hydrothermal method. Chem. Eng. J. 2014, 236, 388–397. [Google Scholar] [CrossRef]
  29. Padmini, E.; Miranda, L.R. Nanocatalyst from sol–sol doping of TiO2 with Vanadium and Cerium and its application for 3,4 Dichloroaniline degradation using visible light. Chem. Eng. J. 2013, 232, 249–258. [Google Scholar] [CrossRef]
  30. Mukhopadhyay, K.; Ghosh, U.C.; Sasikumar, P. Enhanced capacity of fluoride scavenging from contaminated water by nano-architectural reorientation of cerium-incorporated hydrous iron oxide with graphene oxide. Environ. Sci. Pollut. Res. 2019, 26, 26112–26133. [Google Scholar] [CrossRef]
  31. Zhao, H.-P.; Zhu, M.-L.; Shi, H.-Y.; Zhou, Q.-Q.; Chen, R.; Lin, S.-W.; Tong, M.-H.; Ji, M.-H.; Jiang, X.; Liao, C.-X.; et al. Cerium-Doped Iron Oxide Nanorod Arrays for Photoelectrochemical Water Splitting. Molecules 2022, 27, 9050. [Google Scholar] [CrossRef] [PubMed]
  32. Kotani, A.; Jo, T.; Parlebas, J. Many-body effects in core-level spectroscopy of rare-earth compounds. Adv. Phys. 1988, 37, 37–85. [Google Scholar] [CrossRef]
  33. Duquet, F.; Flaud, V.; Villeneuve-Faure, C.; Rivallin, M.; Rouessac, F.; Roualdès, S. Hybrid Photoelectrocatalytic TiO2-Co3O4/Co(OH)2 Materials Prepared from Bio-Based Surfactants for Water Splitting. Molecules 2023, 28, 7599. [Google Scholar] [CrossRef]
  34. Wang, Y.; Zhao, Y.; Zhu, P.; Wu, X.; Koshayeva, A.; Ding, L.; Wei, G.; Su, Y. A promising one-step carbothermal reduction nitridation strategy for enhancing photoelectrochemical performance of TiO2 nanowire array-based catalysts with stable nitrogen doping and desired core-double shell structure. Appl. Surf. Sci. 2023, 639, 158261. [Google Scholar] [CrossRef]
  35. Nada, A.A.; Bekheet, M.F.; Samélor, D.; Vergnes, H.; Villeneuve-Faure, C.; Cartier, J.; Charmette, C.; Tingry, S.; Caussat, B.; Vahlas, C.; et al. Photo-electrocatalytic performance of poly(3,4-ethylenedioxythiophene)/TiO2 nano-tree films deposited by oCVD/CVD for H2 production. Appl. Surf. Sci. 2023, 637, 157919. [Google Scholar] [CrossRef]
  36. Wang, J.; Zhuang, C.; Zhu, Y.; Wang, X.; Zhang, W.; Liu, Y.; Yang, D. Ternary TiO2/Ni–Ni(OH)2/NiPi nanotube arrays with synergetic effect for enhanced photoelectrocatalytic H2-evolution. Int. J. Hydrogen Energy 2022, 47, 22063–22077. [Google Scholar] [CrossRef]
  37. Feng, W.; Lin, L.; Li, H.; Chi, B.; Pu, J.; Li, J. Hydrogenated TiO2/ZnO heterojunction nanorod arrays with enhanced performance for photoelectrochemical water splitting. Int. J. Hydrogen Energy 2017, 42, 3938–3946. [Google Scholar] [CrossRef]
  38. Zhang, Z.; Shi, C.; Lv, K.; Ma, C.; Xiao, G.; Ni, L. 200-nm long TiO2 nanorod arrays for efficient solid-state PbS quantum dot-sensitized solar cells. J. Energy Chem. 2018, 27, 1214–1218. [Google Scholar] [CrossRef]
  39. Yang, C.; Lv, Y.; Zhang, H.; Zhou, X. Double-shelled ZnO/TiO2/CdS nanorod arrays for enhanced photoelectrocatalytic performance. J. Porous Mater. 2019, 26, 903–912. [Google Scholar] [CrossRef]
Figure 1. (a) XRD spectra and (b) magnified view of the R (110) diffraction peak of the R, CR5, and CR10 nanorod array photoanodes.
Catalysts 14 00639 g001
Figure 2. (ac) SEM images of the R, CR5, and CR10 nanorod array photoanodes. (d) HR-TEM image of the R nanorod array photoanodes. (e,f) HR-TEM images; (g) electron diffraction pattern; and (hk) elemental distribution of Ti, O, and Ce under the high magnification transmission of the CR5 nanorod array photoanodes.
Catalysts 14 00639 g002
Figure 3. XPS spectra of the R and CR5 nanorod array photoanodes. (a) the survey spectra, (b) Ti 2p, (c) O 1s; (d) Ce 3d.
Catalysts 14 00639 g003
Figure 4. (a) Hydrogen production over 10 h and (b) hydrogen production rate of the R, CR5, and CR10 nanorod array photoanodes.
Catalysts 14 00639 g004
Figure 5. (a) LSV curves under cyclic switching, (b) photoelectric conversion efficiency (η), and (c) I-t curves of the R, CR5, and CR10 nanorod array photoanodes.
Catalysts 14 00639 g005
Figure 6. Photocurrent spectra of the R, CR5, and CR10 nanorod array photoanodes under noise mode (a) and different biases (b). IPCE spectra of the R, CR5, and CR10 nanorod array photoanodes under noise mode (c) and different biases (d). The electrolyte is 0.1 M Na2SO4.
Catalysts 14 00639 g006
Figure 7. (a) Bandgap graphs calculated by IPCE (IPCE% × )1/2 vs. under ECN mode and (b) Mott–Schottky plots of the R, CR5, and CR10 nanorod array photoanodes.
Catalysts 14 00639 g007
Figure 8. Electrochemical impedance plots for R, CR5, and CR10 nanorod array photoanodes at 0 V (vs. Ag/AgCl) (a); (b) magnified view of the plot (a).
Catalysts 14 00639 g008
Figure 9. (a) Band gap diagram and (b) schematic diagram of the photocatalytic mechanism of Ce-doped TiO2 nanorod array photoanodes.
Catalysts 14 00639 g009
Figure 10. Synthesis procedure for different contents of Ce-doped TiO2 nanorod array photoanodes (CR5 and CR10) (af). And TiO2 nanorod array photoanodes (R) (a,cf).
Catalysts 14 00639 g010
Table 1. Comparison between this job and recent related works.
CatalystLight SourceCurrent DensityH2 ProductionRef.
Ce-TiO2300 W Xenon lamp-4972 µmol·g−1·h−1[21]
Ce-TiO2AM 1.5G0.0109 mA/cm20.33 μmol·g−1·h−1[22]
CeO2/TNTAM 1.5G2.11 mA/cm2 (1.55 V vs. RHE)17.86 µmol·cm−2·h−1[23]
Ce-TNTAM 1.5G3.5 mA/cm2 (1.0 V vs. Ag/AgCl)43.07 µmol·cm−2·h−1[24]
TiO2-Co3O4/Co(OH)275 W LOT Quantum1.570 mA/cm20.3 µmol·cm−2·min−1[33]
N-TiO2/Ti(CN)/N-C300 W Xenon lamp458.6 μA/cm2-[34]
PEDOT/TiO2100 W Xenon lamp0.26 mA/cm24.1 µmol·cm−2·h−1[35]
TNTAs/Ni–Ni(OH)2/NiPi500 W xenon lamp2.32 mA/cm256.65 µmol·cm−2·h−1[36]
Ce-Doped TiO2300 W xenon lamp1.98 mA/cm237.03 µmol·cm−2·h−1This work
TNT = TNTAs: TiO2 nanotube arrays.
Disclaimer/Publisher’s Note: The statements, opinions and data contained in all publications are solely those of the individual author(s) and contributor(s) and not of MDPI and/or the editor(s). MDPI and/or the editor(s) disclaim responsibility for any injury to people or property resulting from any ideas, methods, instructions or products referred to in the content.

