
In-Depth Study on Synergic Interactions and Thermo-Kinetic Analysis of (Wheat Straw and Woody Sawdust) Biomass Co-Pyrolysis over Mussel Shell-Derived CaO Catalyst Using Coats–Redfern Method


Abstract
1. Introduction
2. Results and Discussion
2.1. Physiochemical Characterization
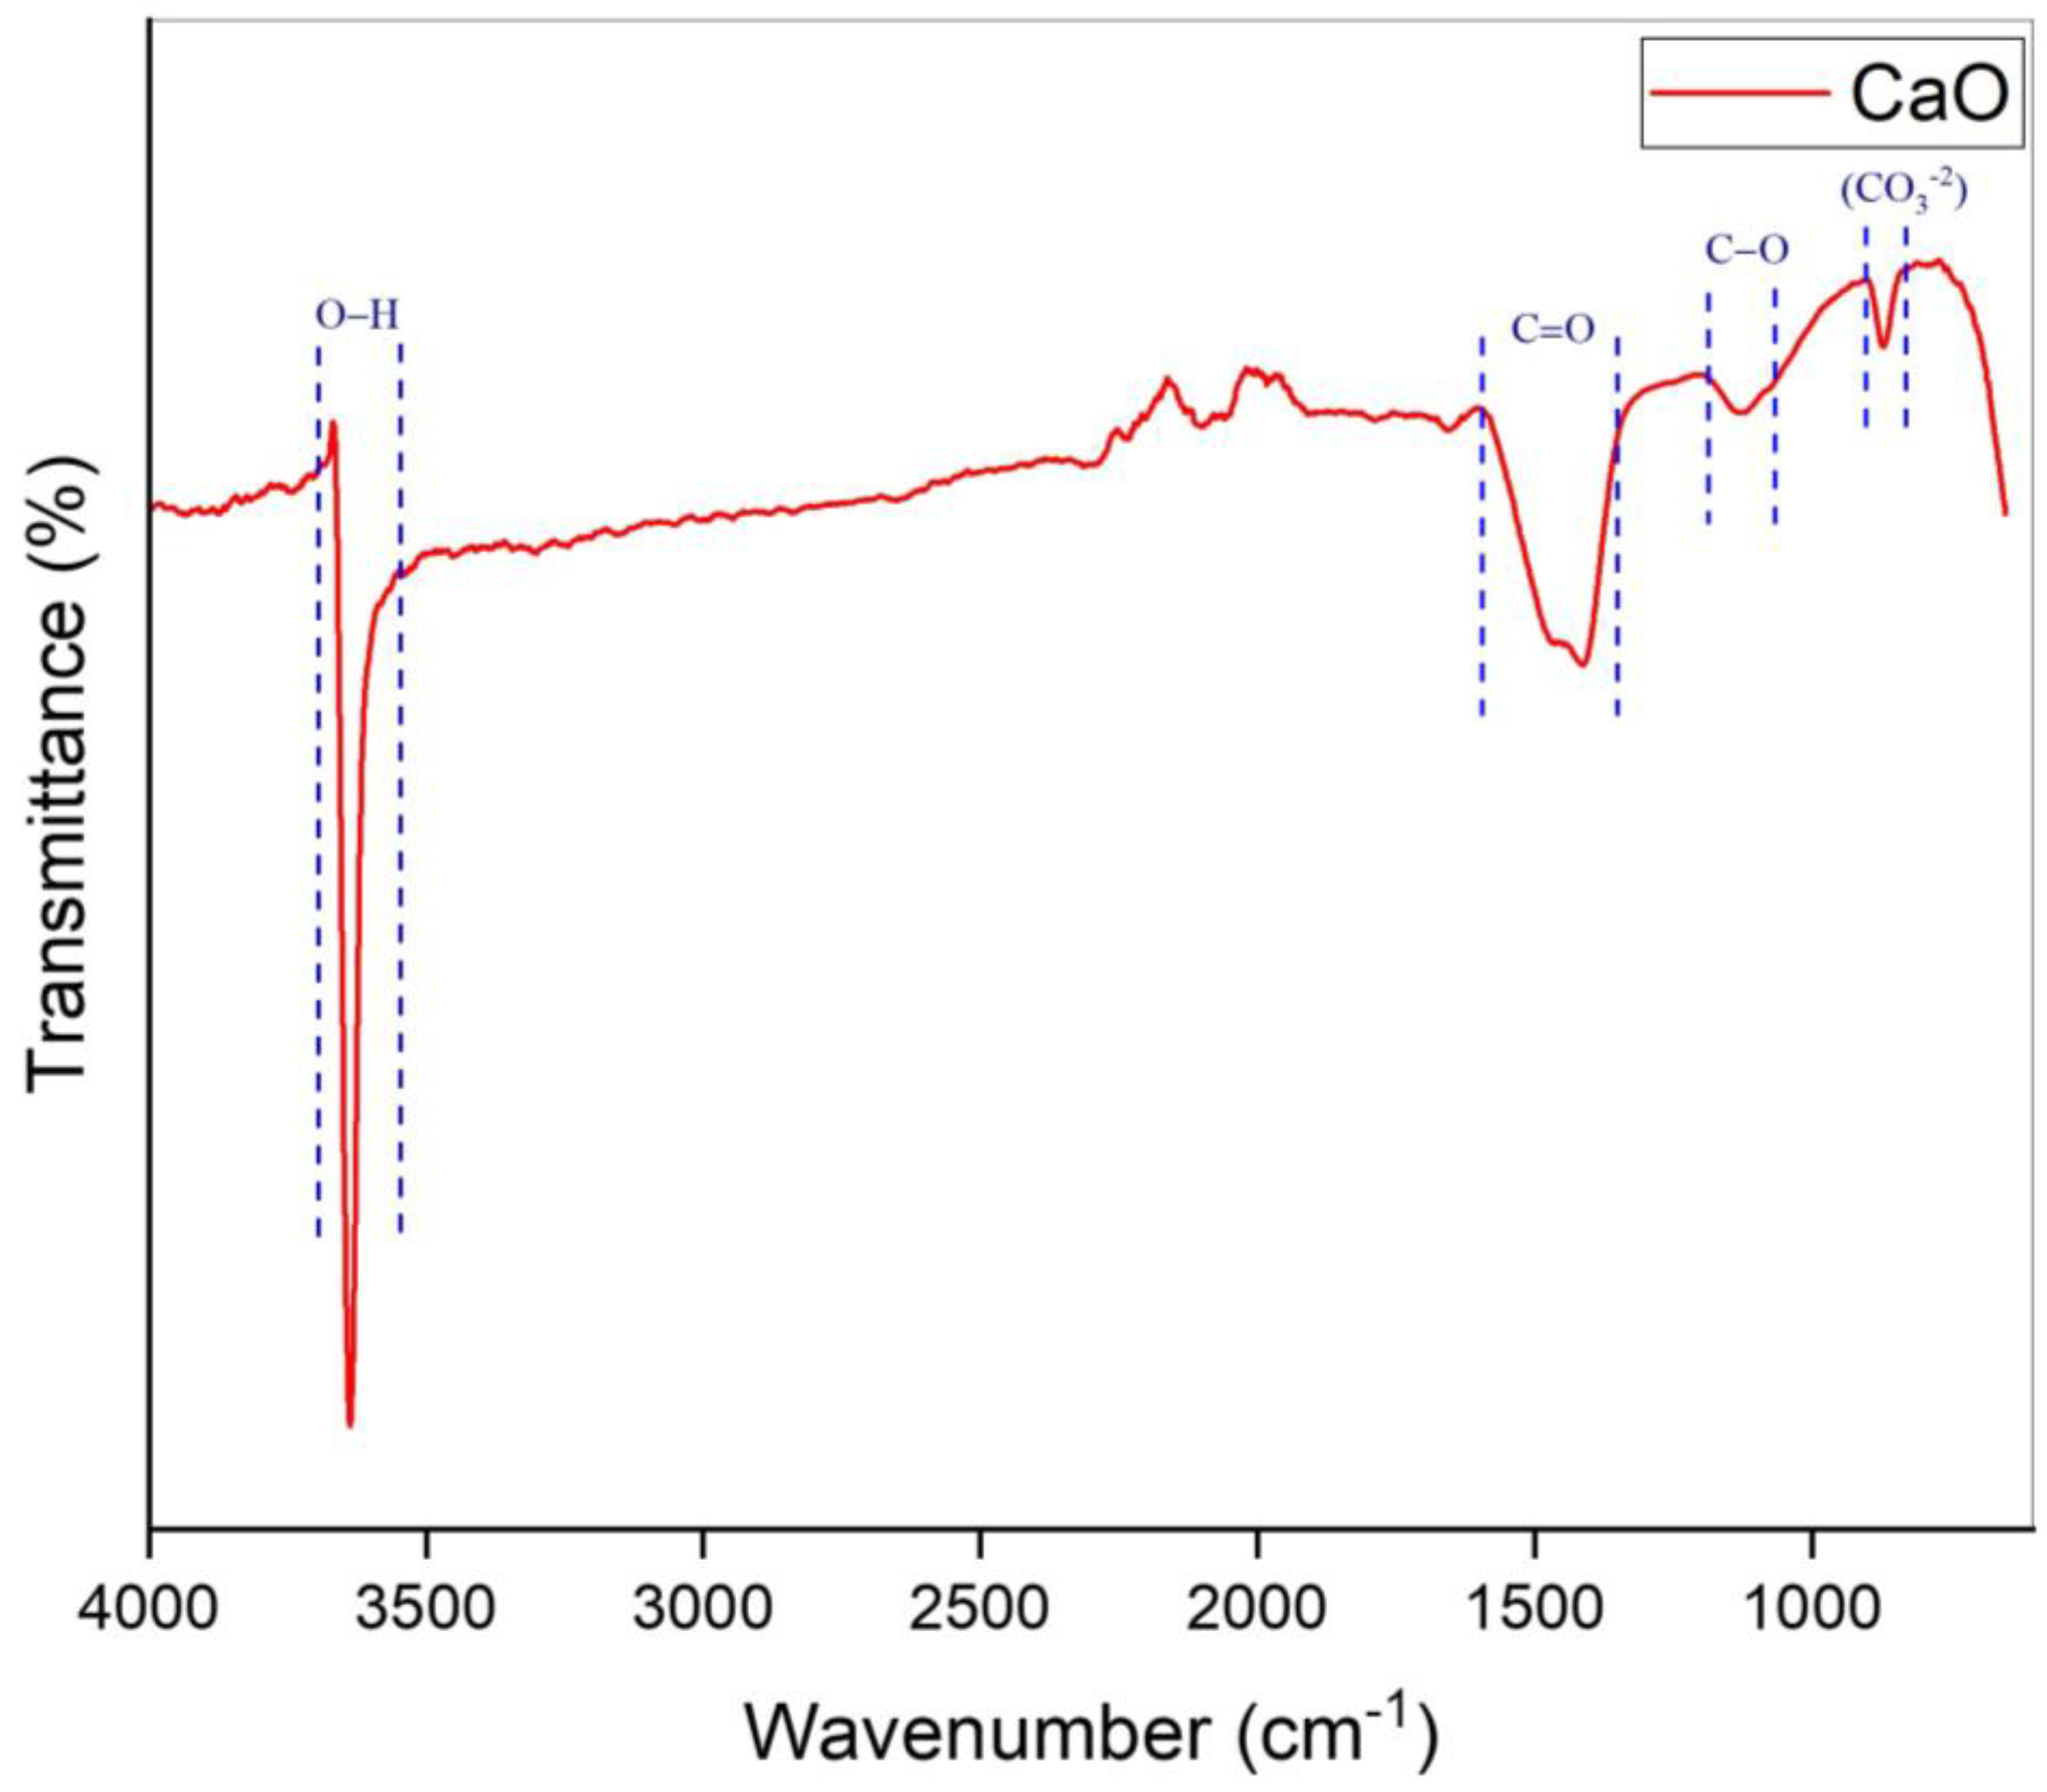
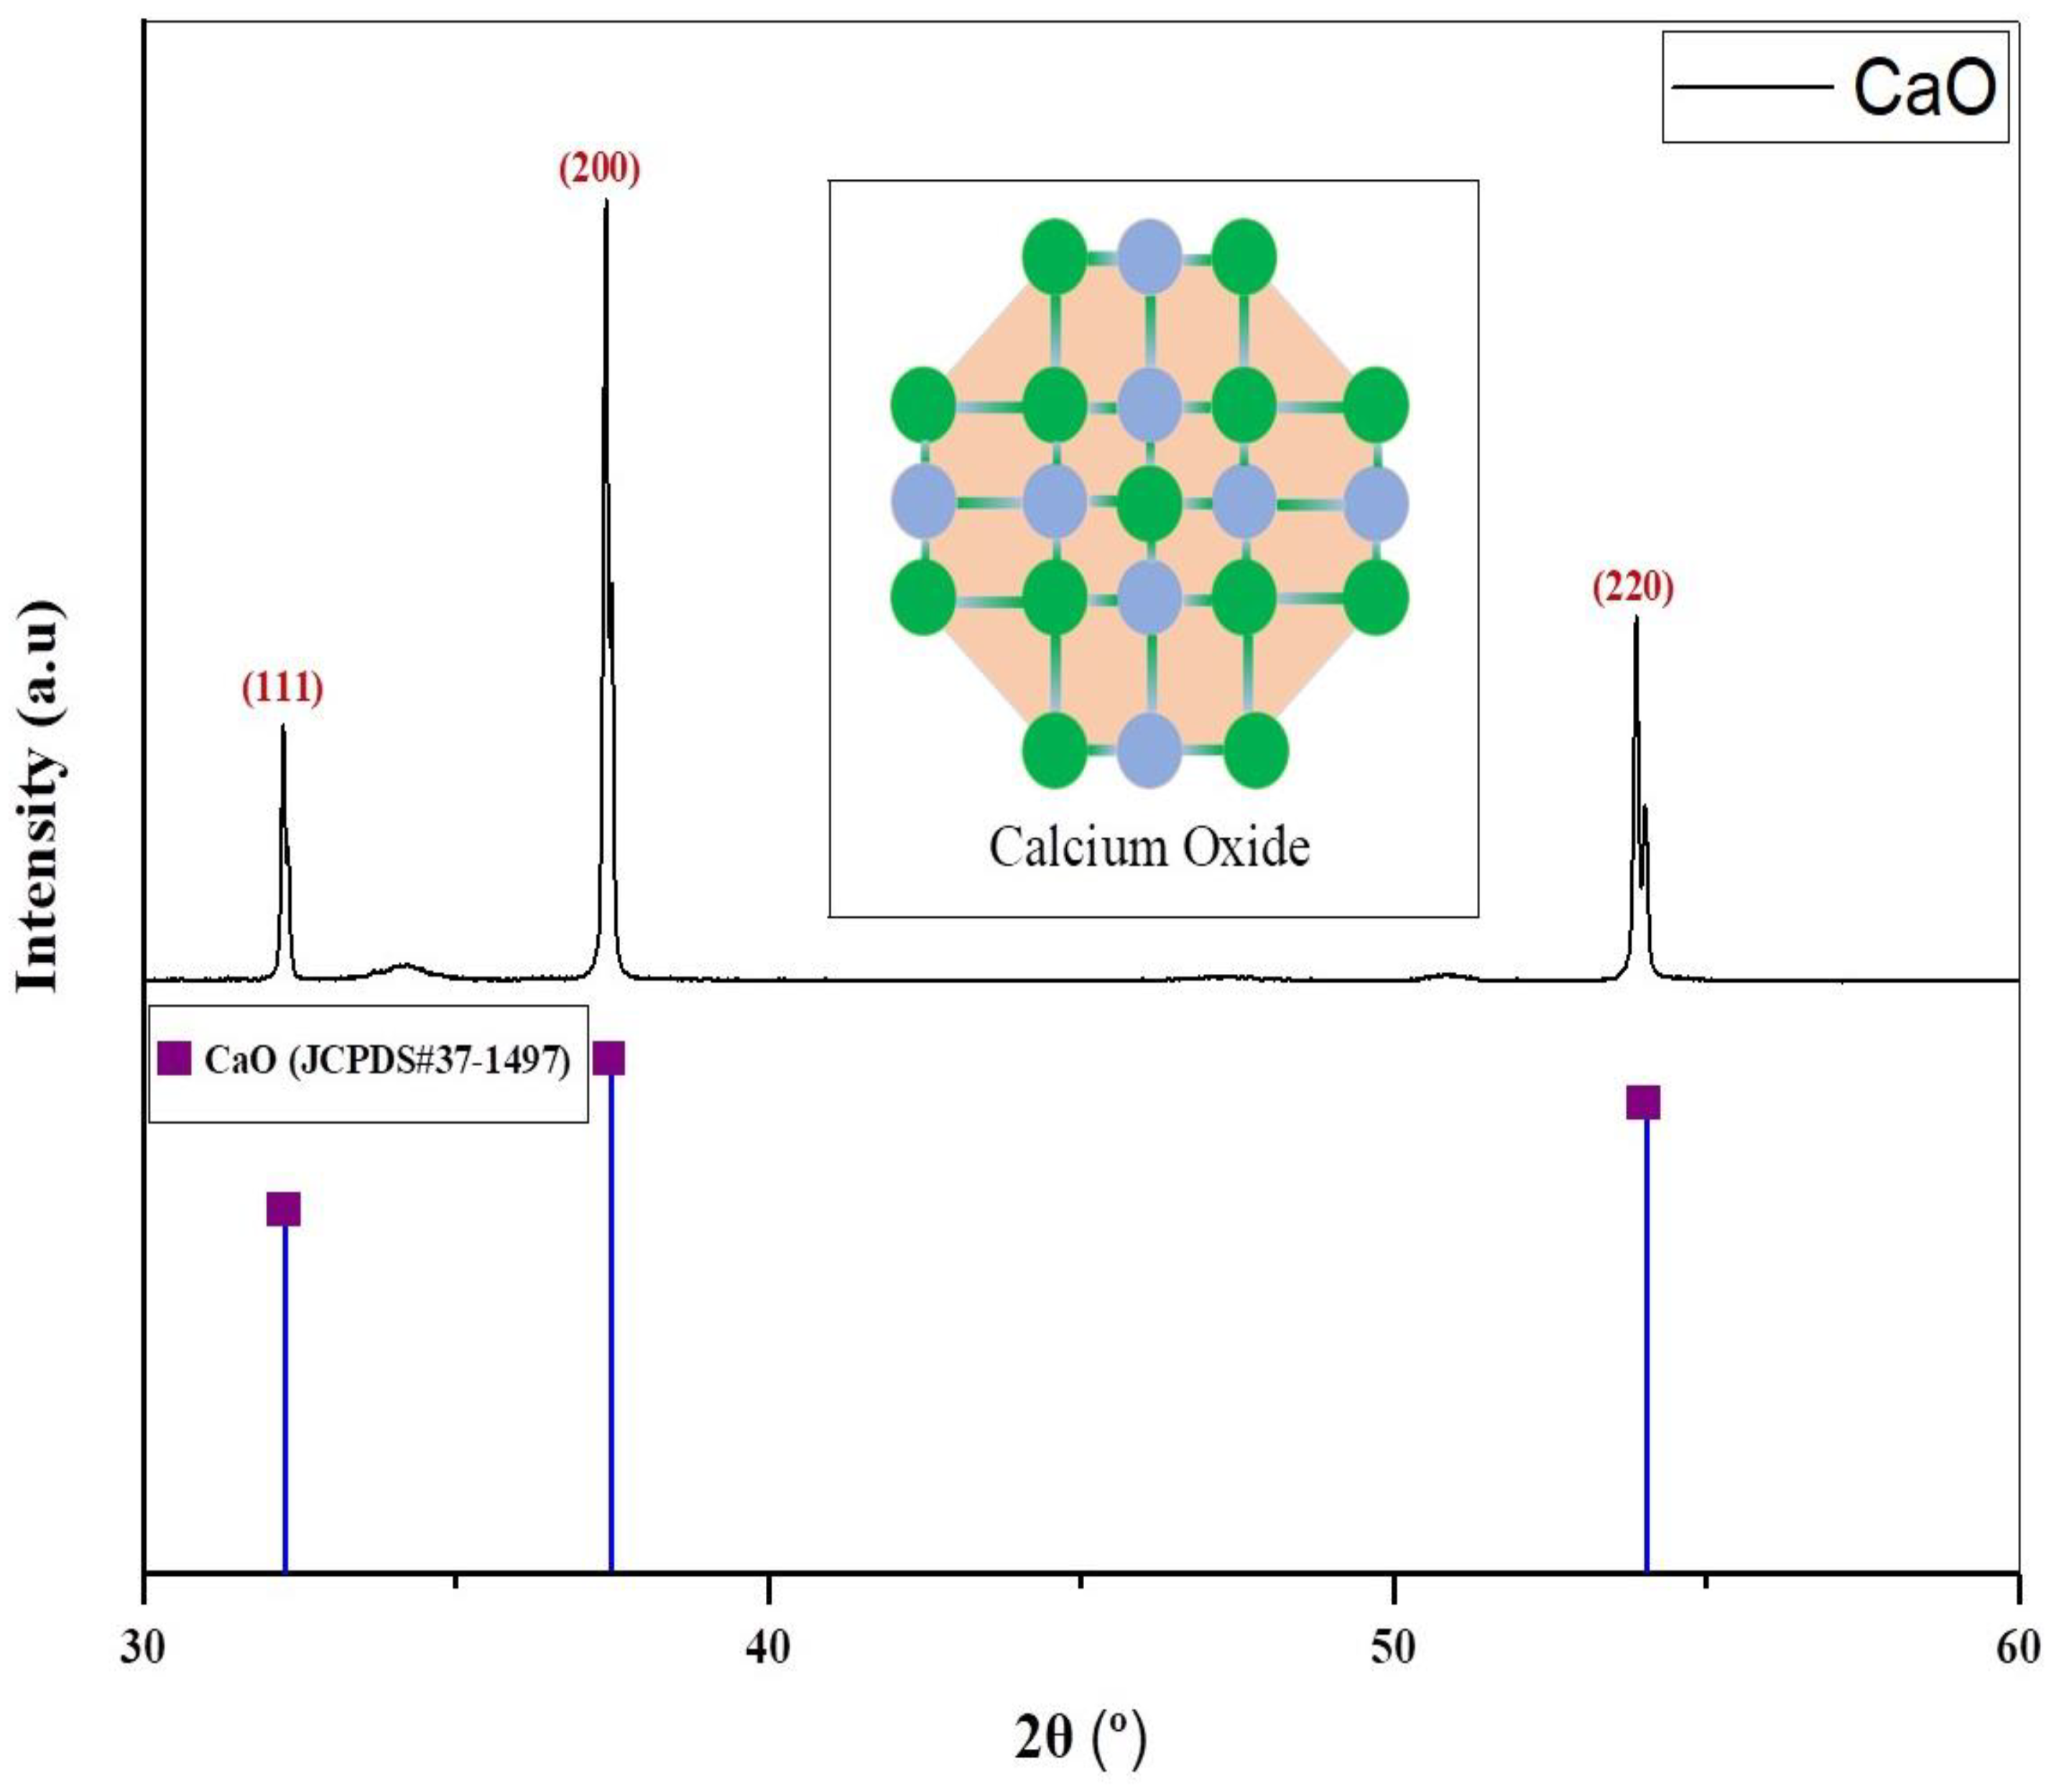
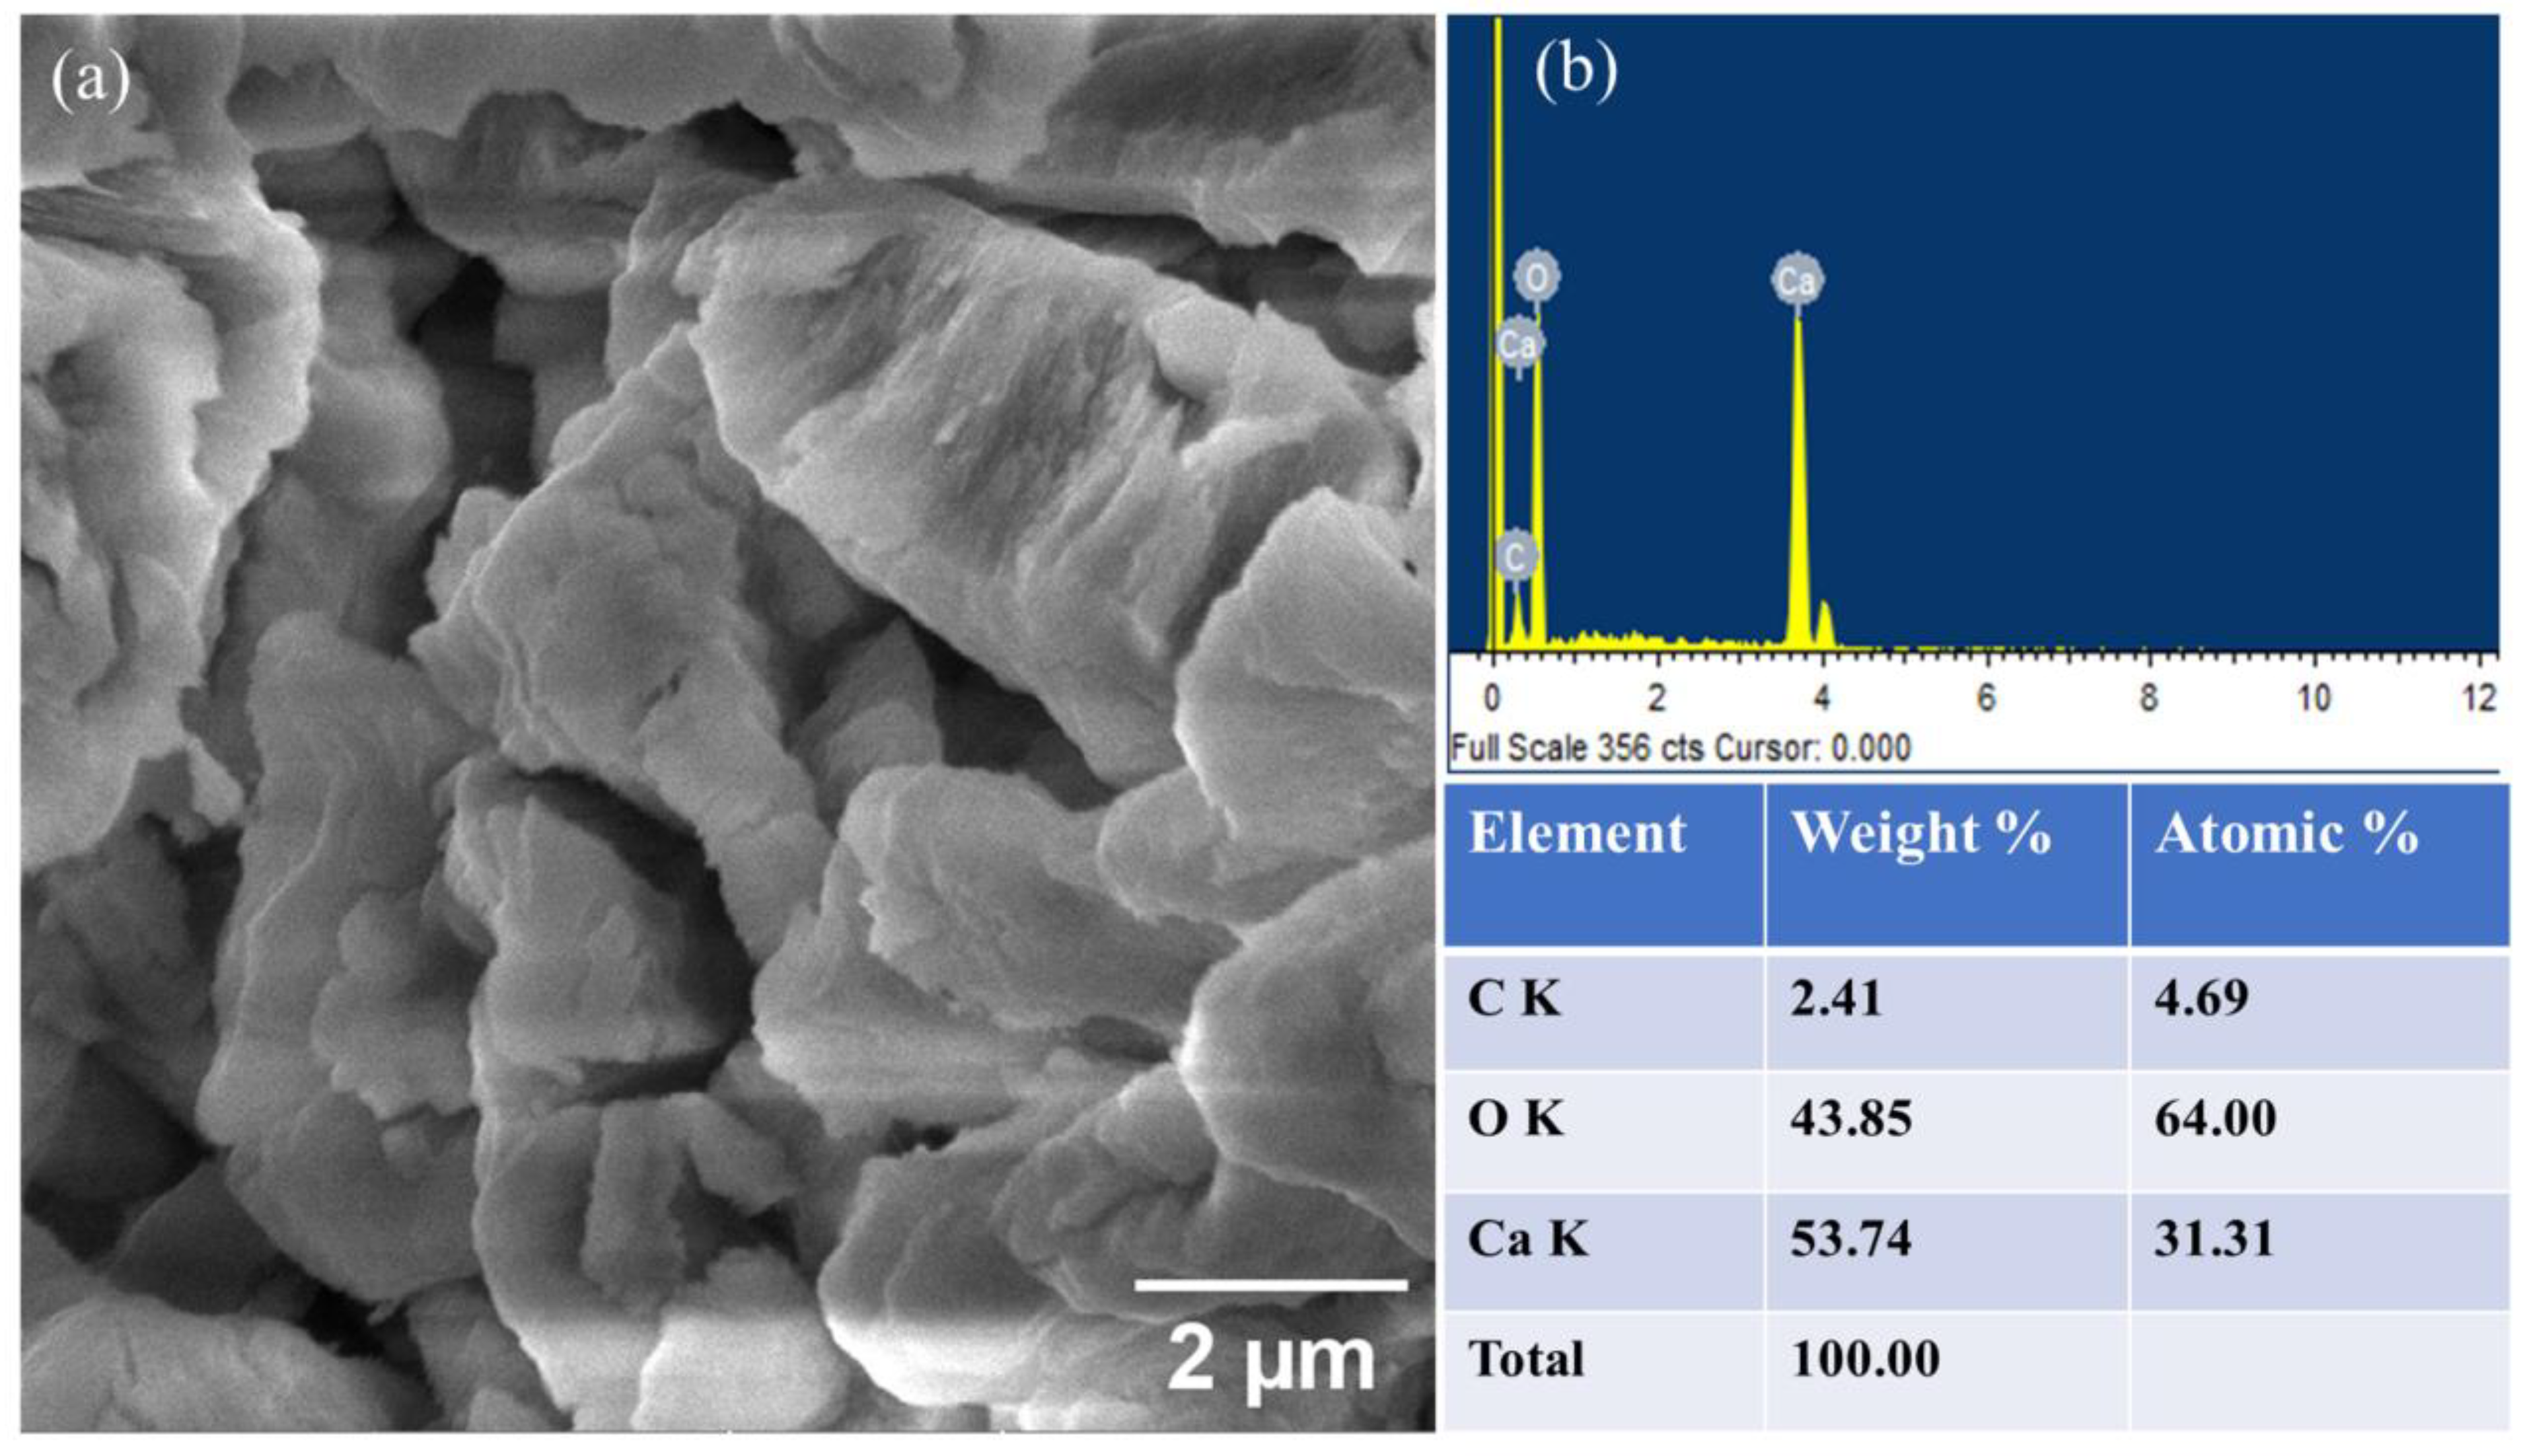
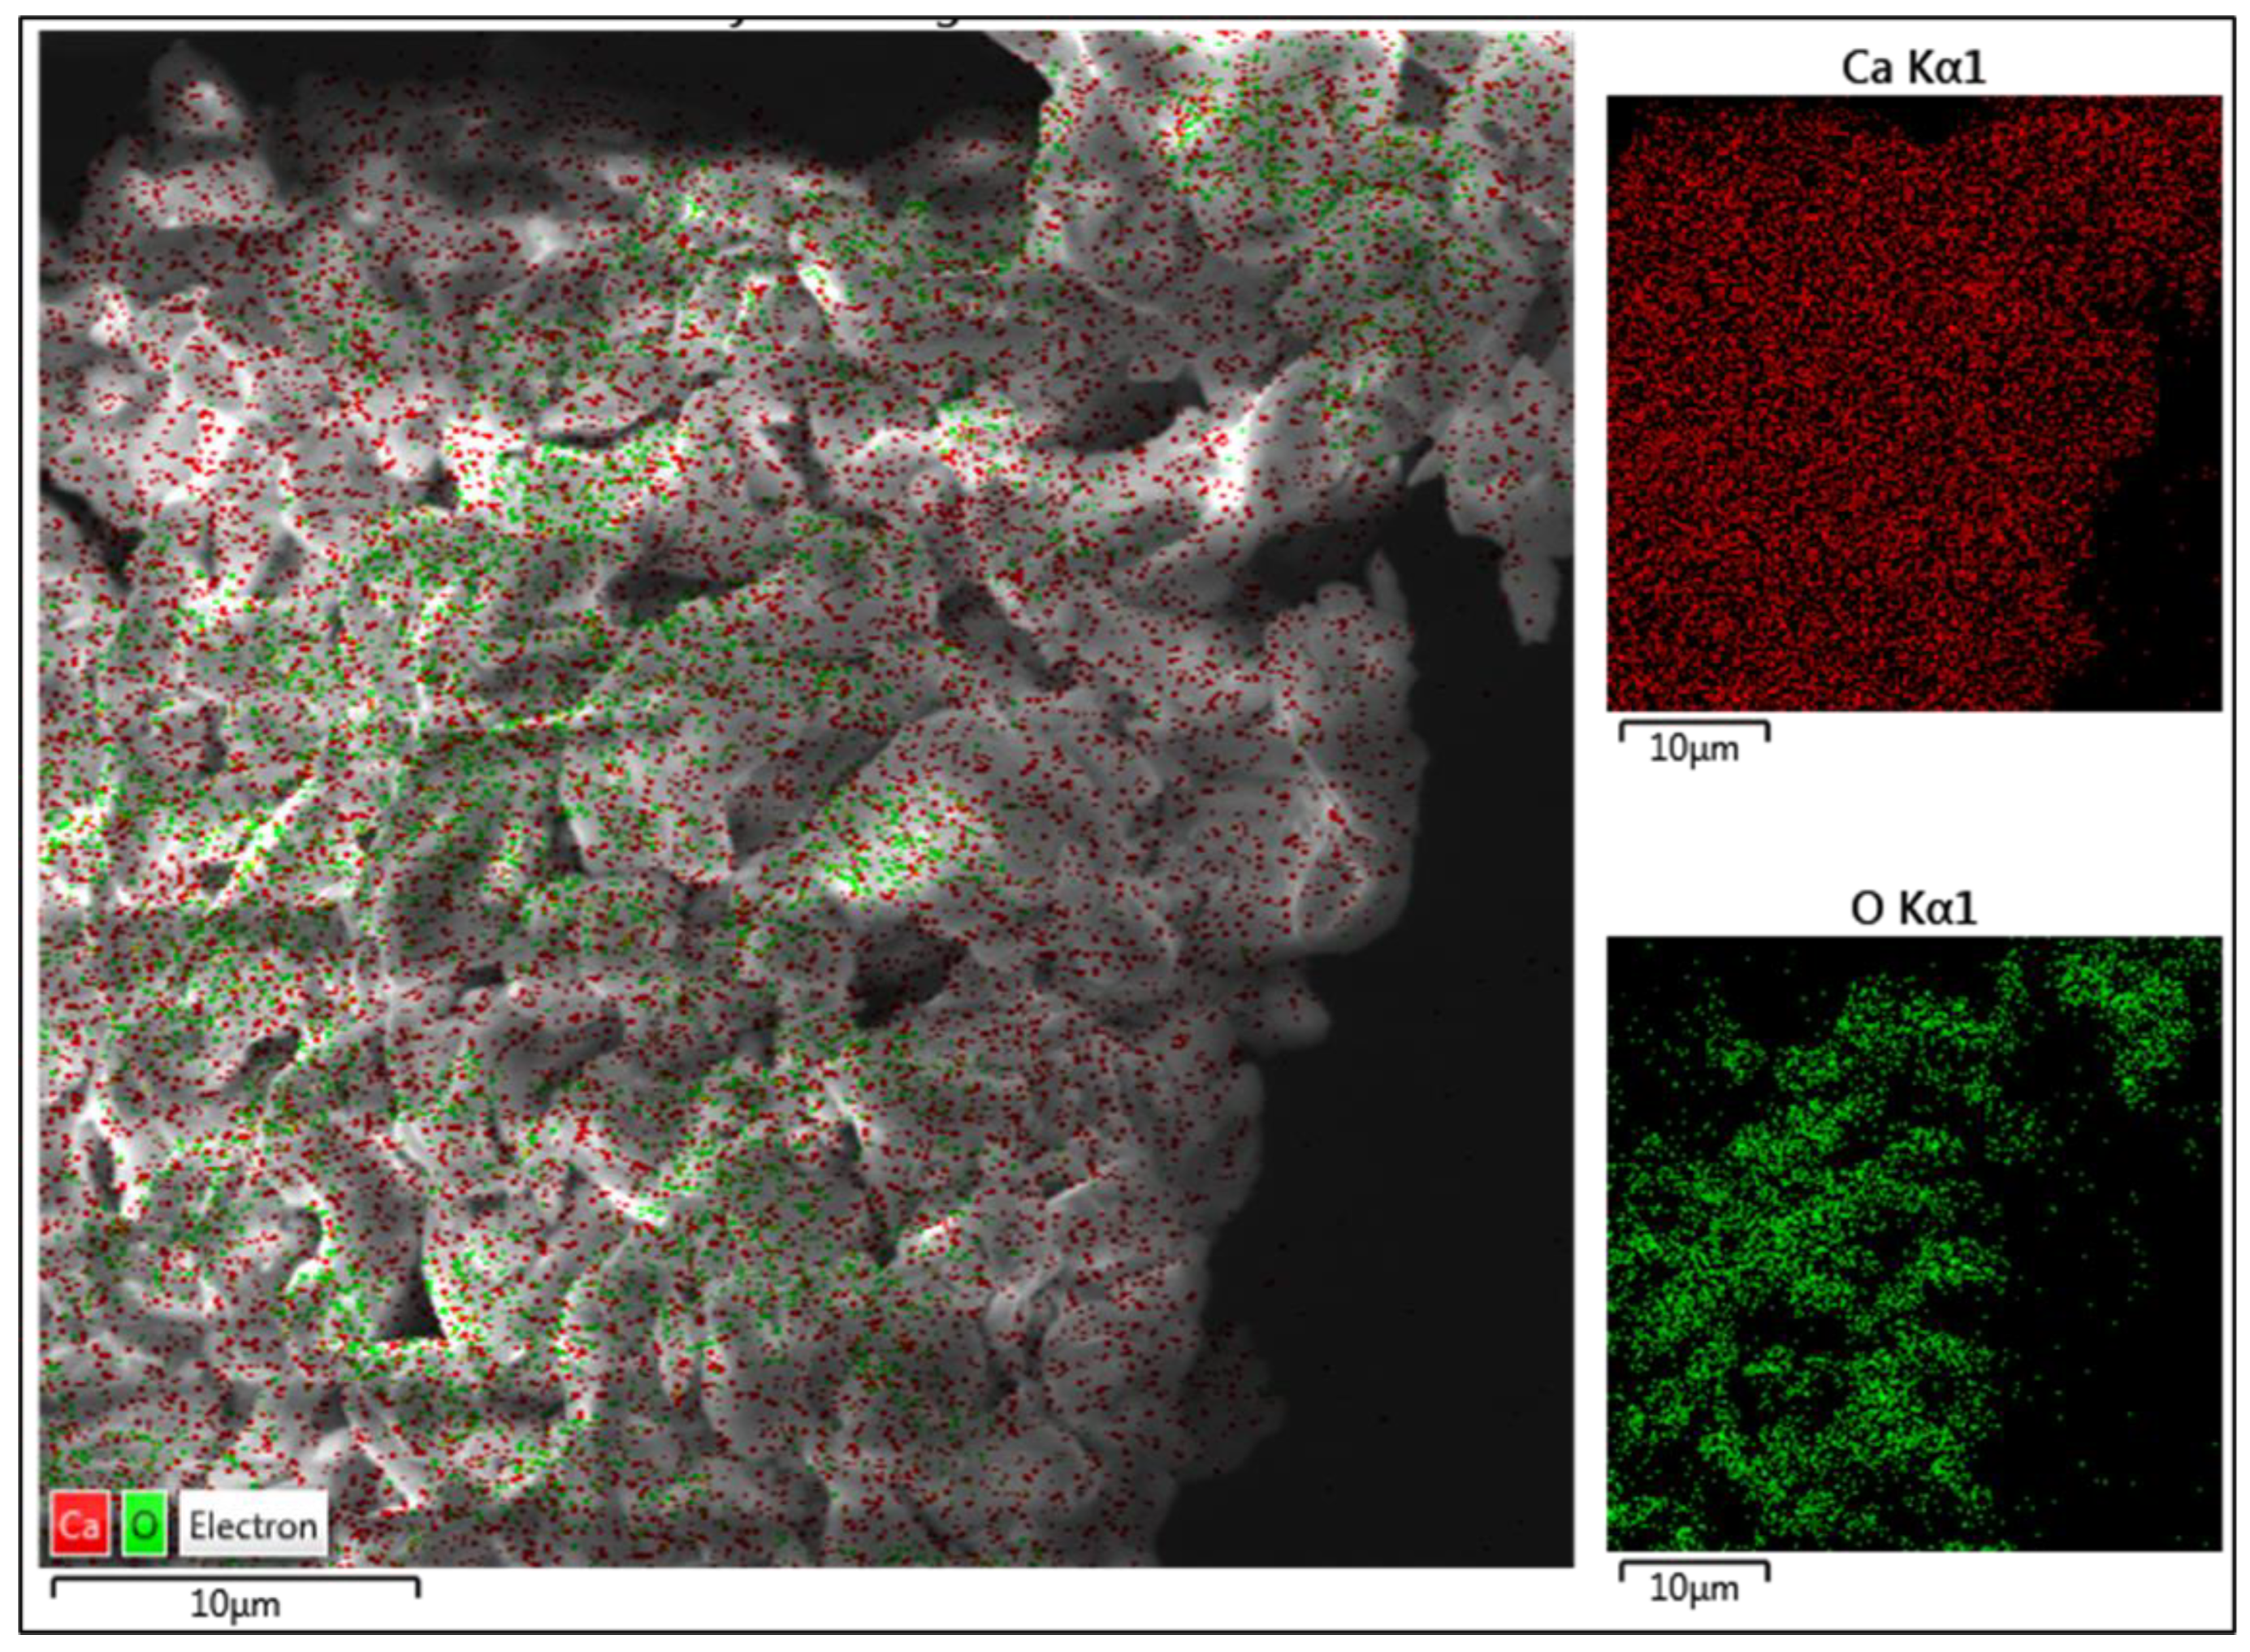
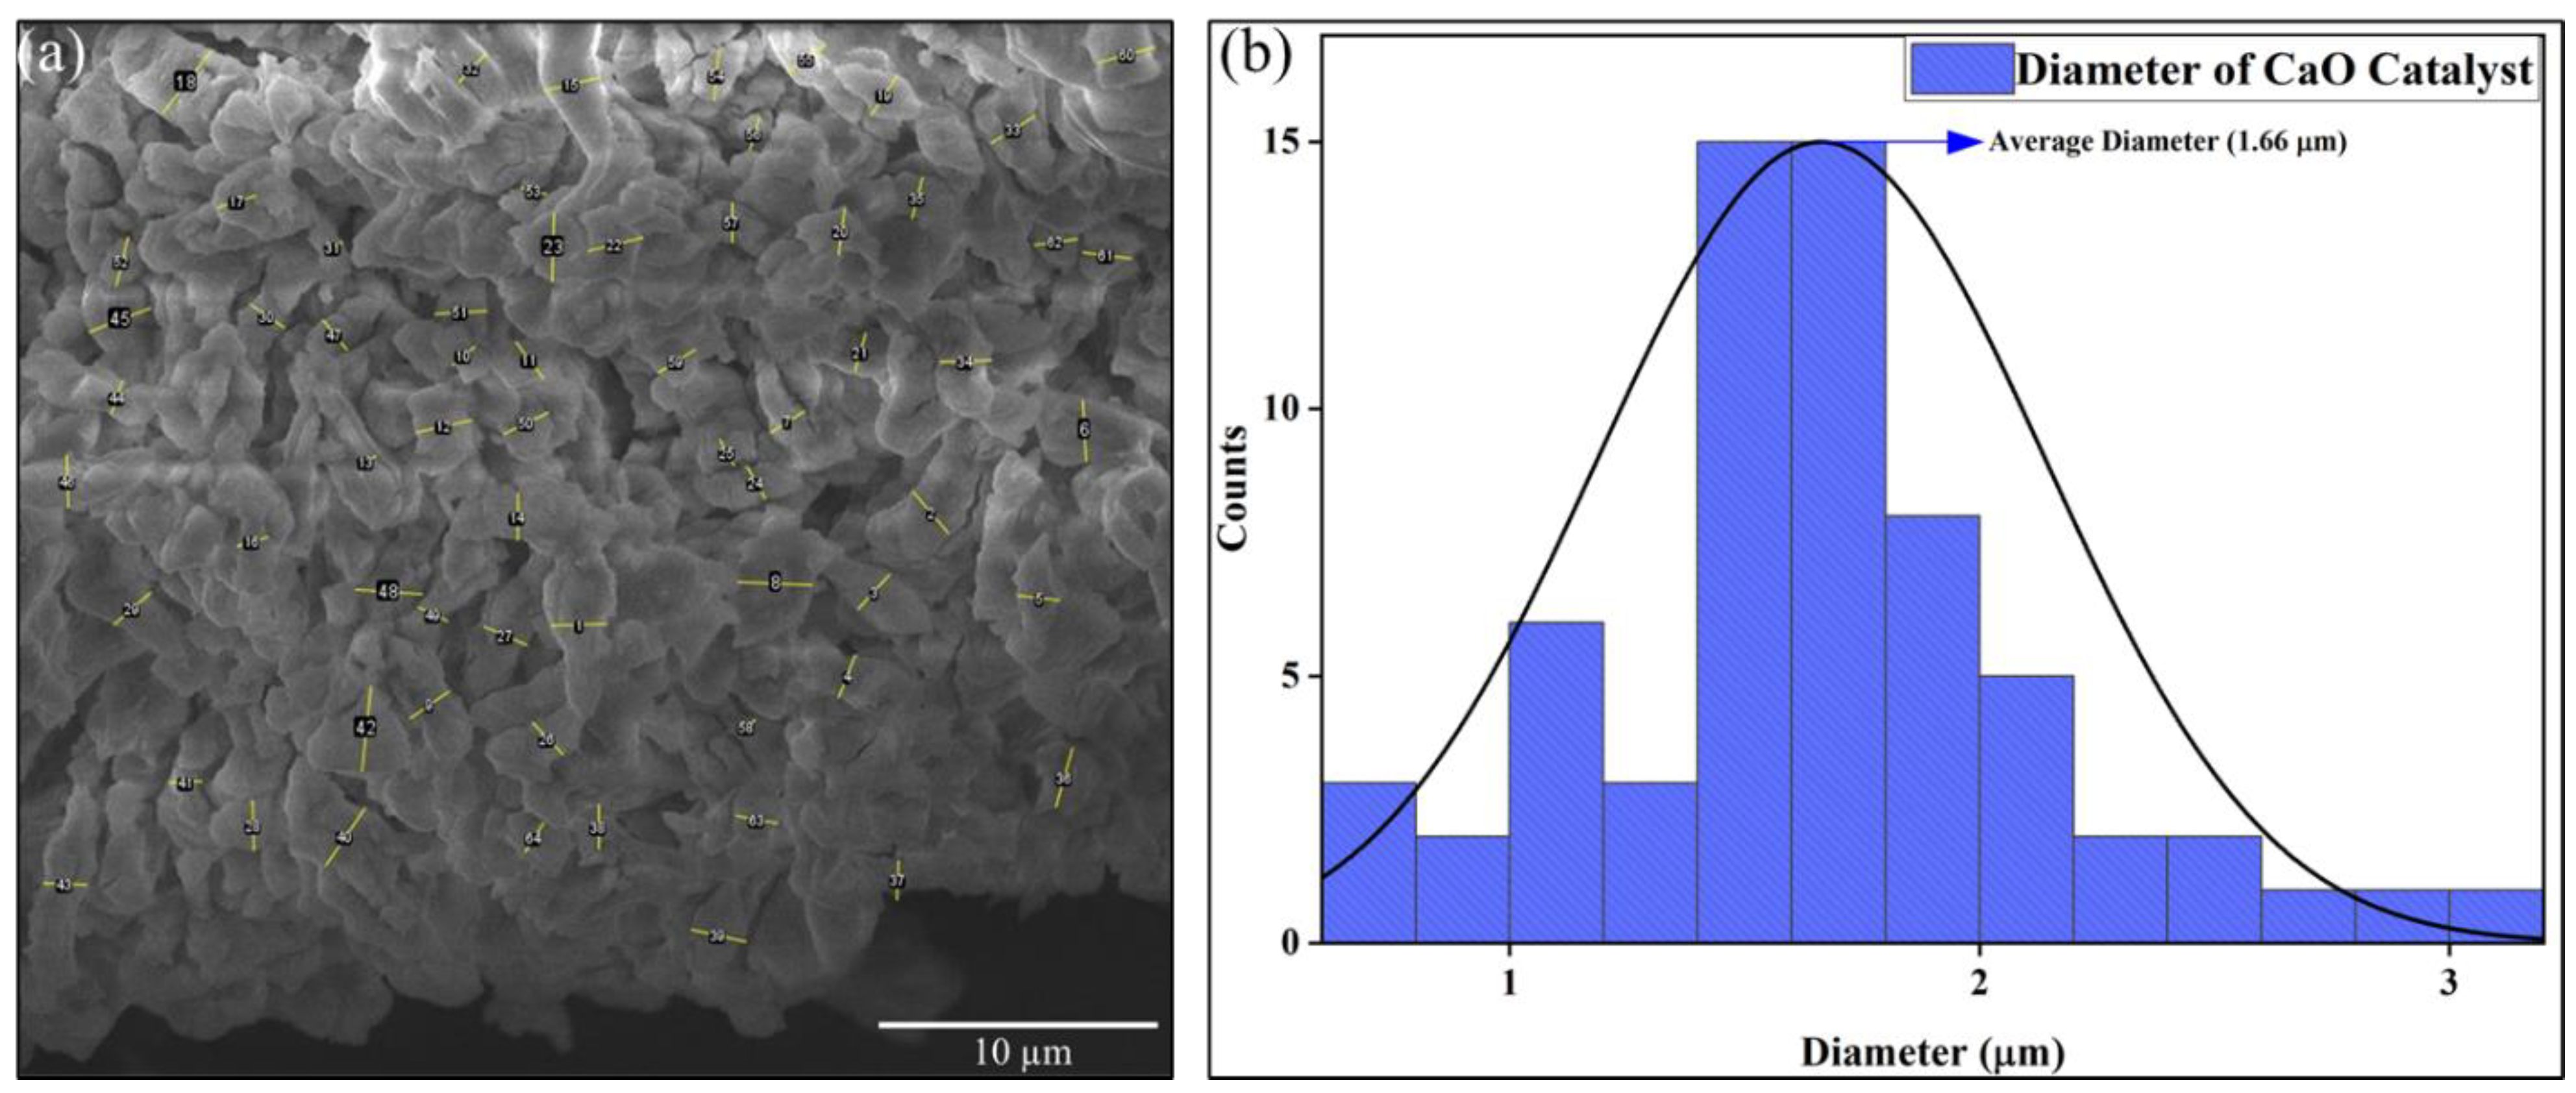
2.2. Catalyst Characterization
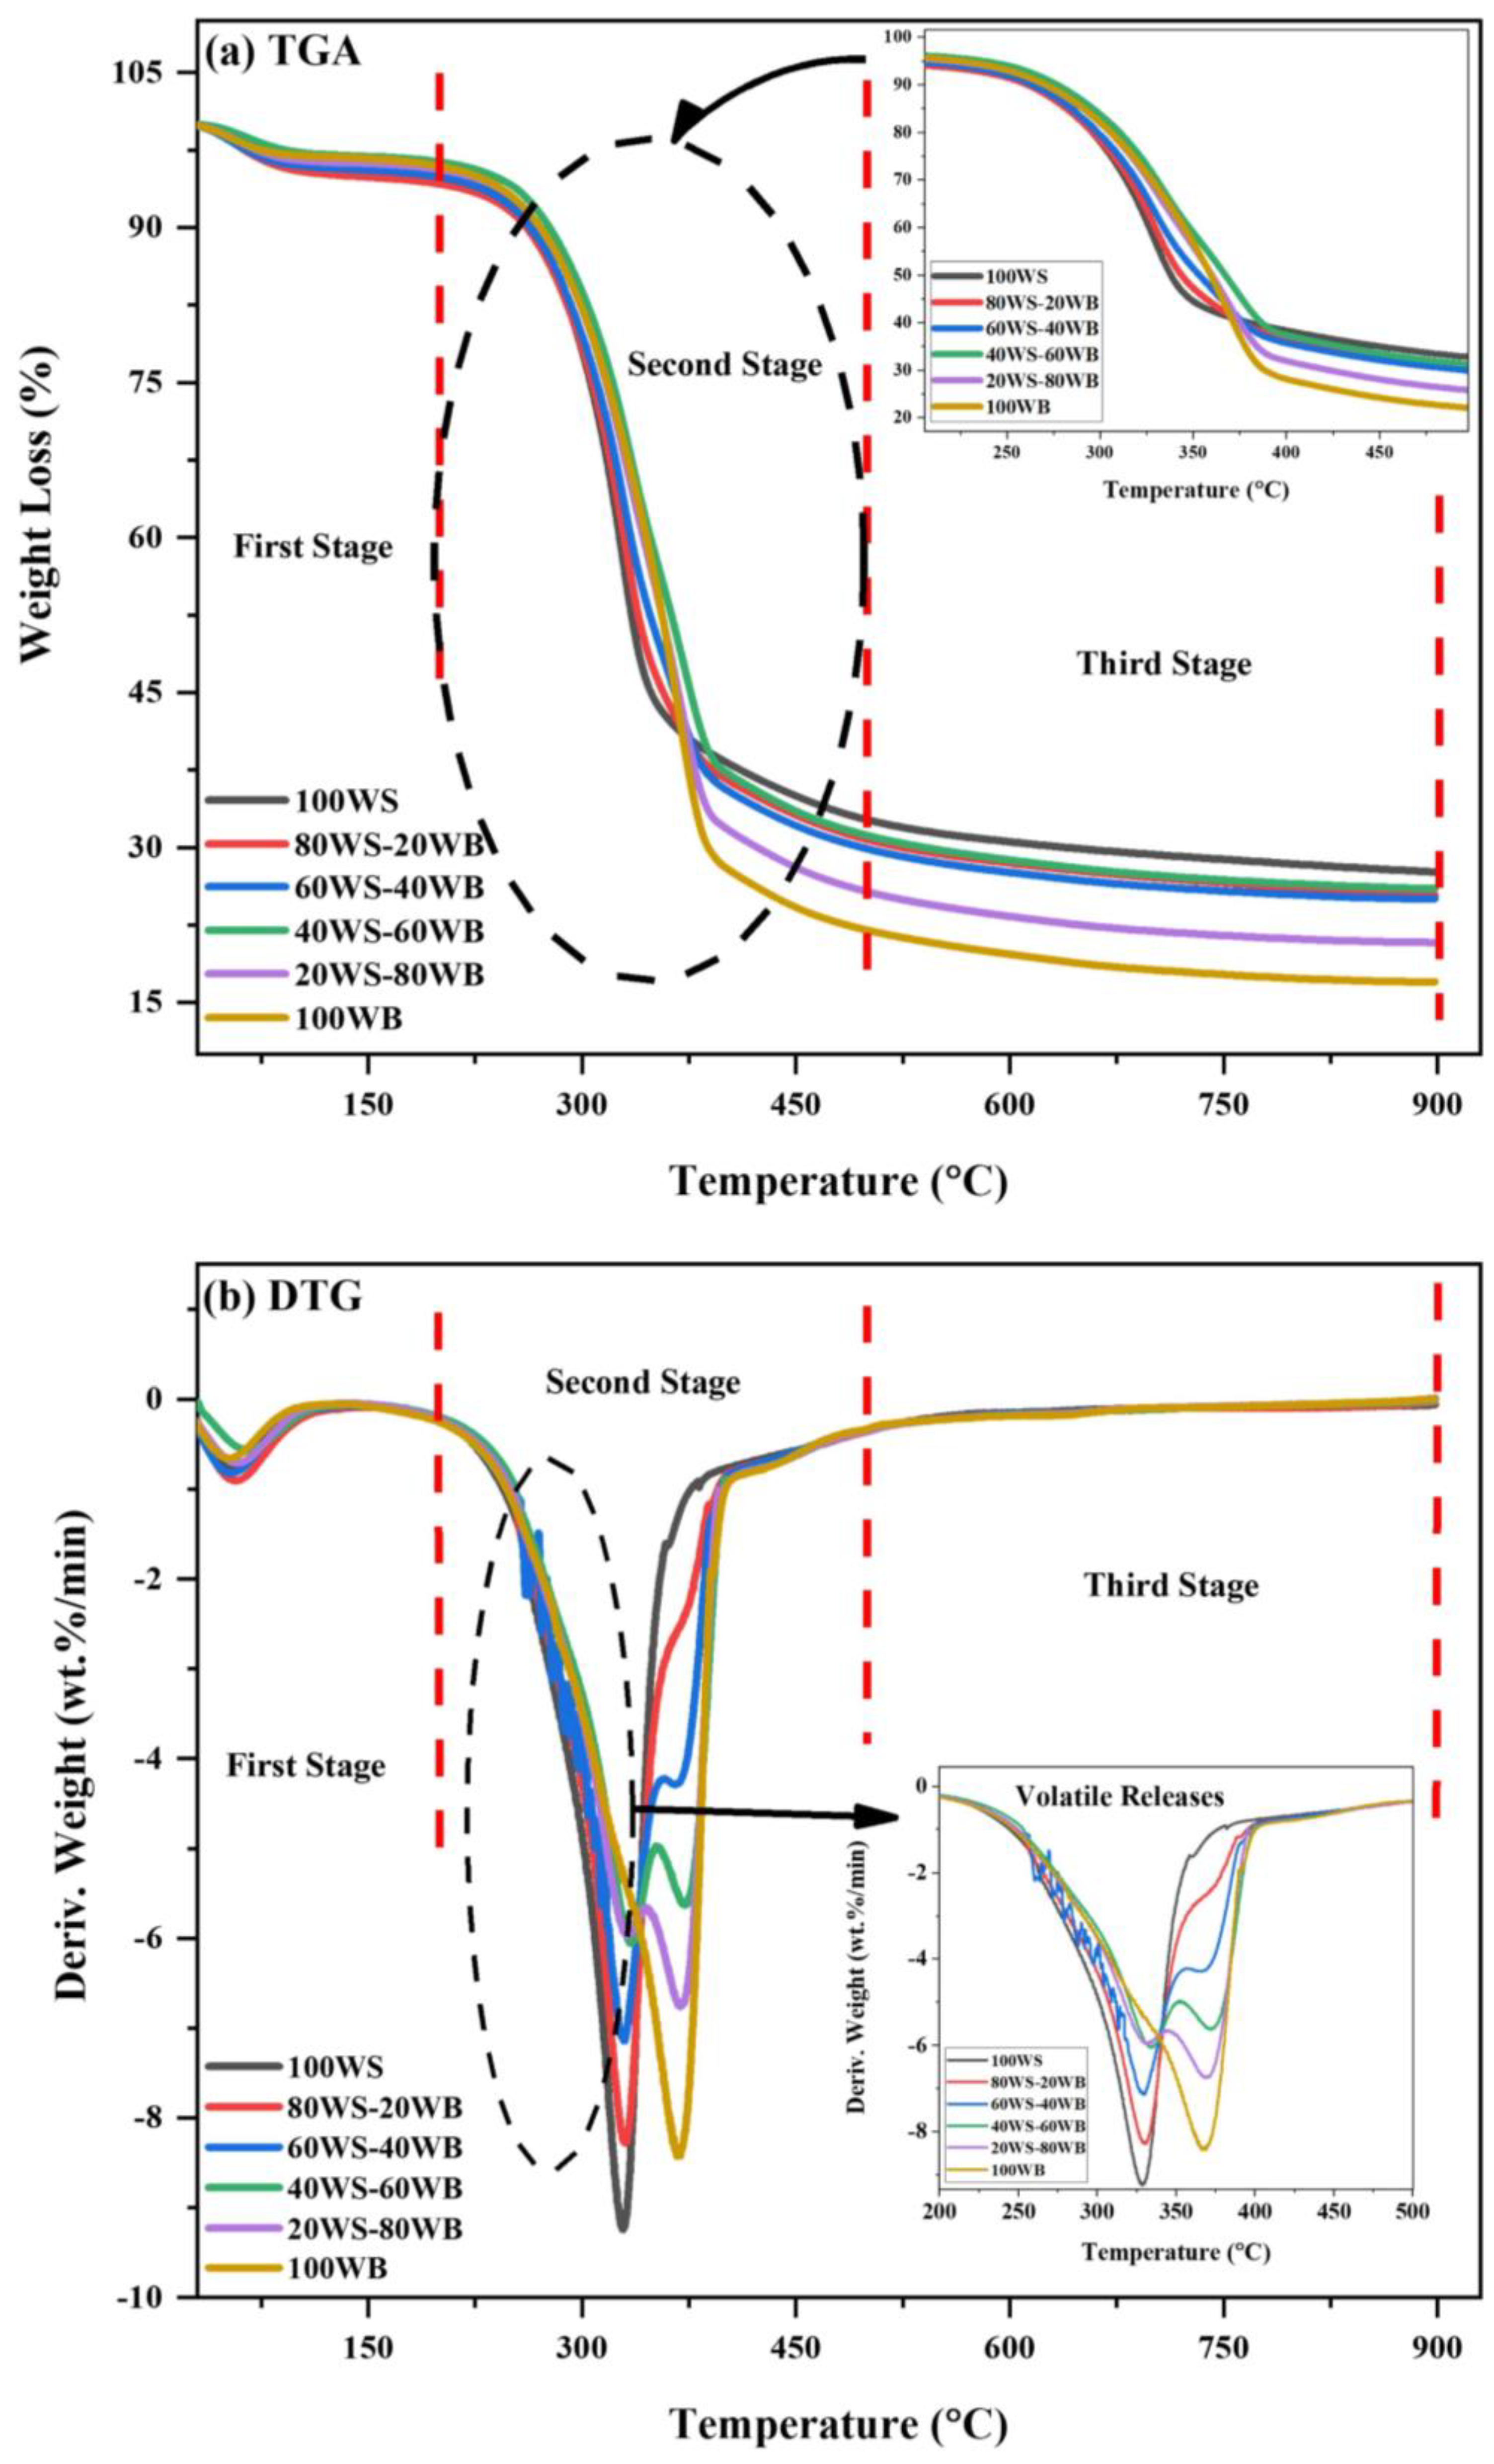
2.3. TGA
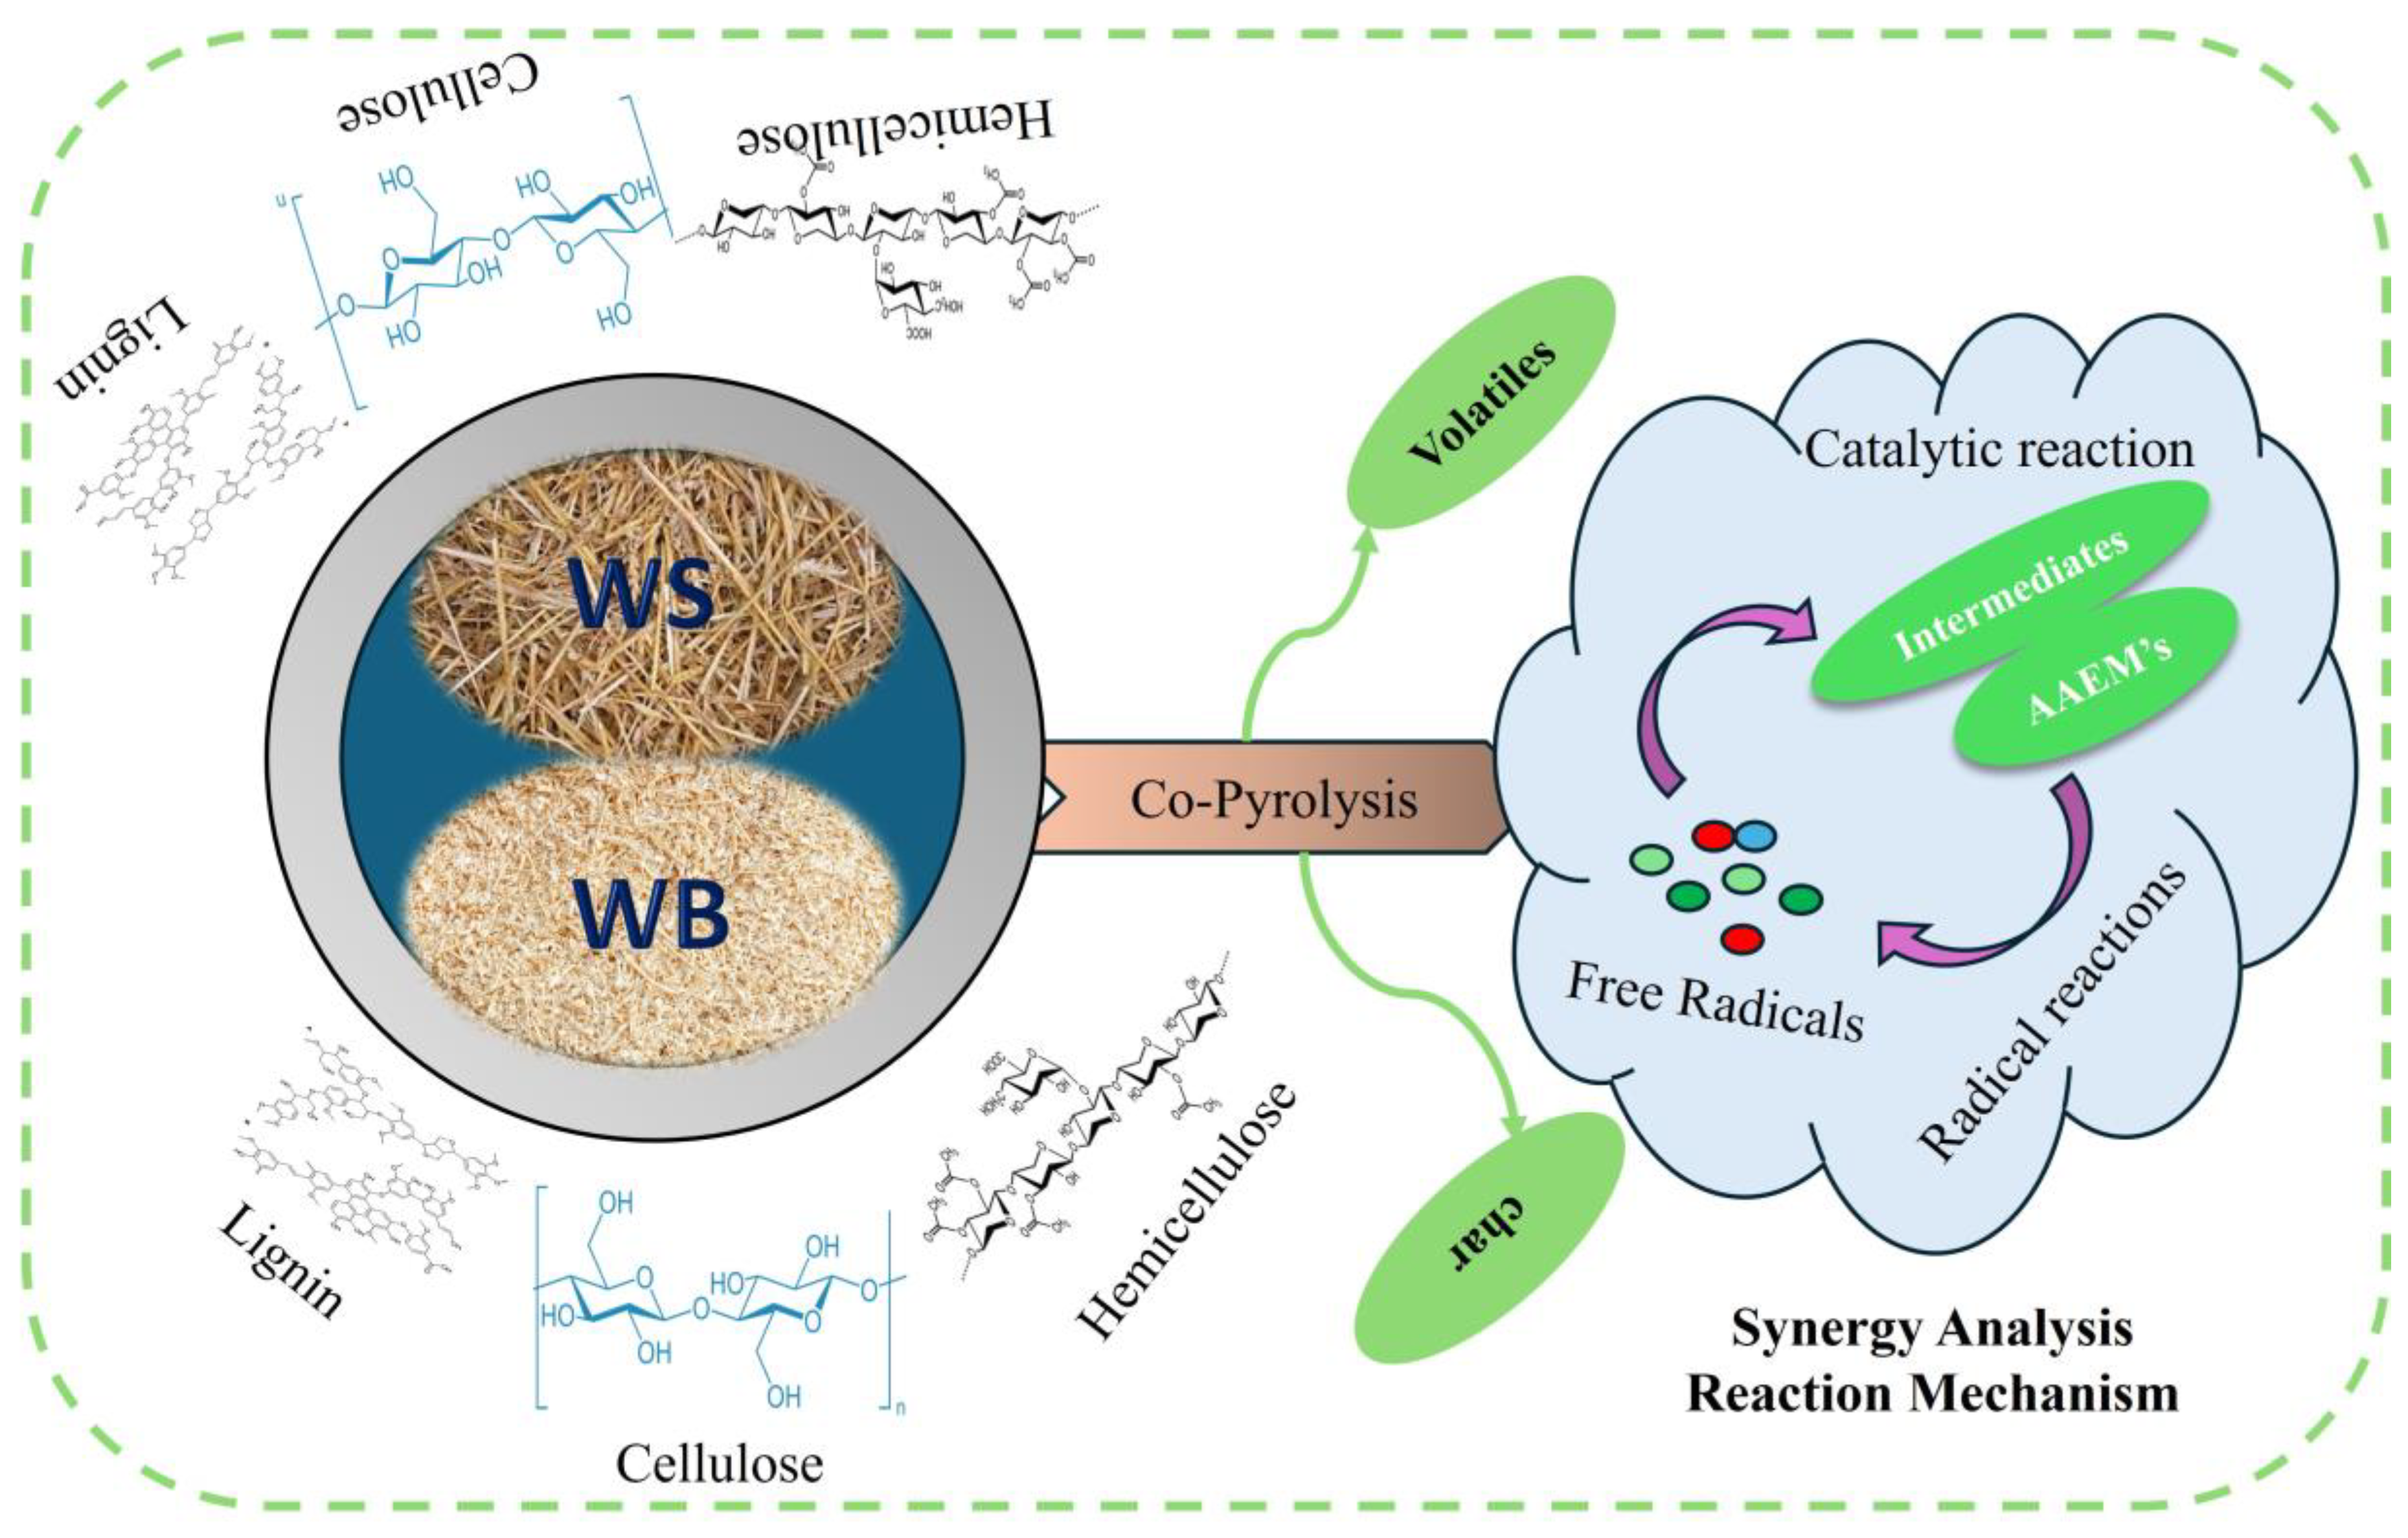
Synergy Analysis
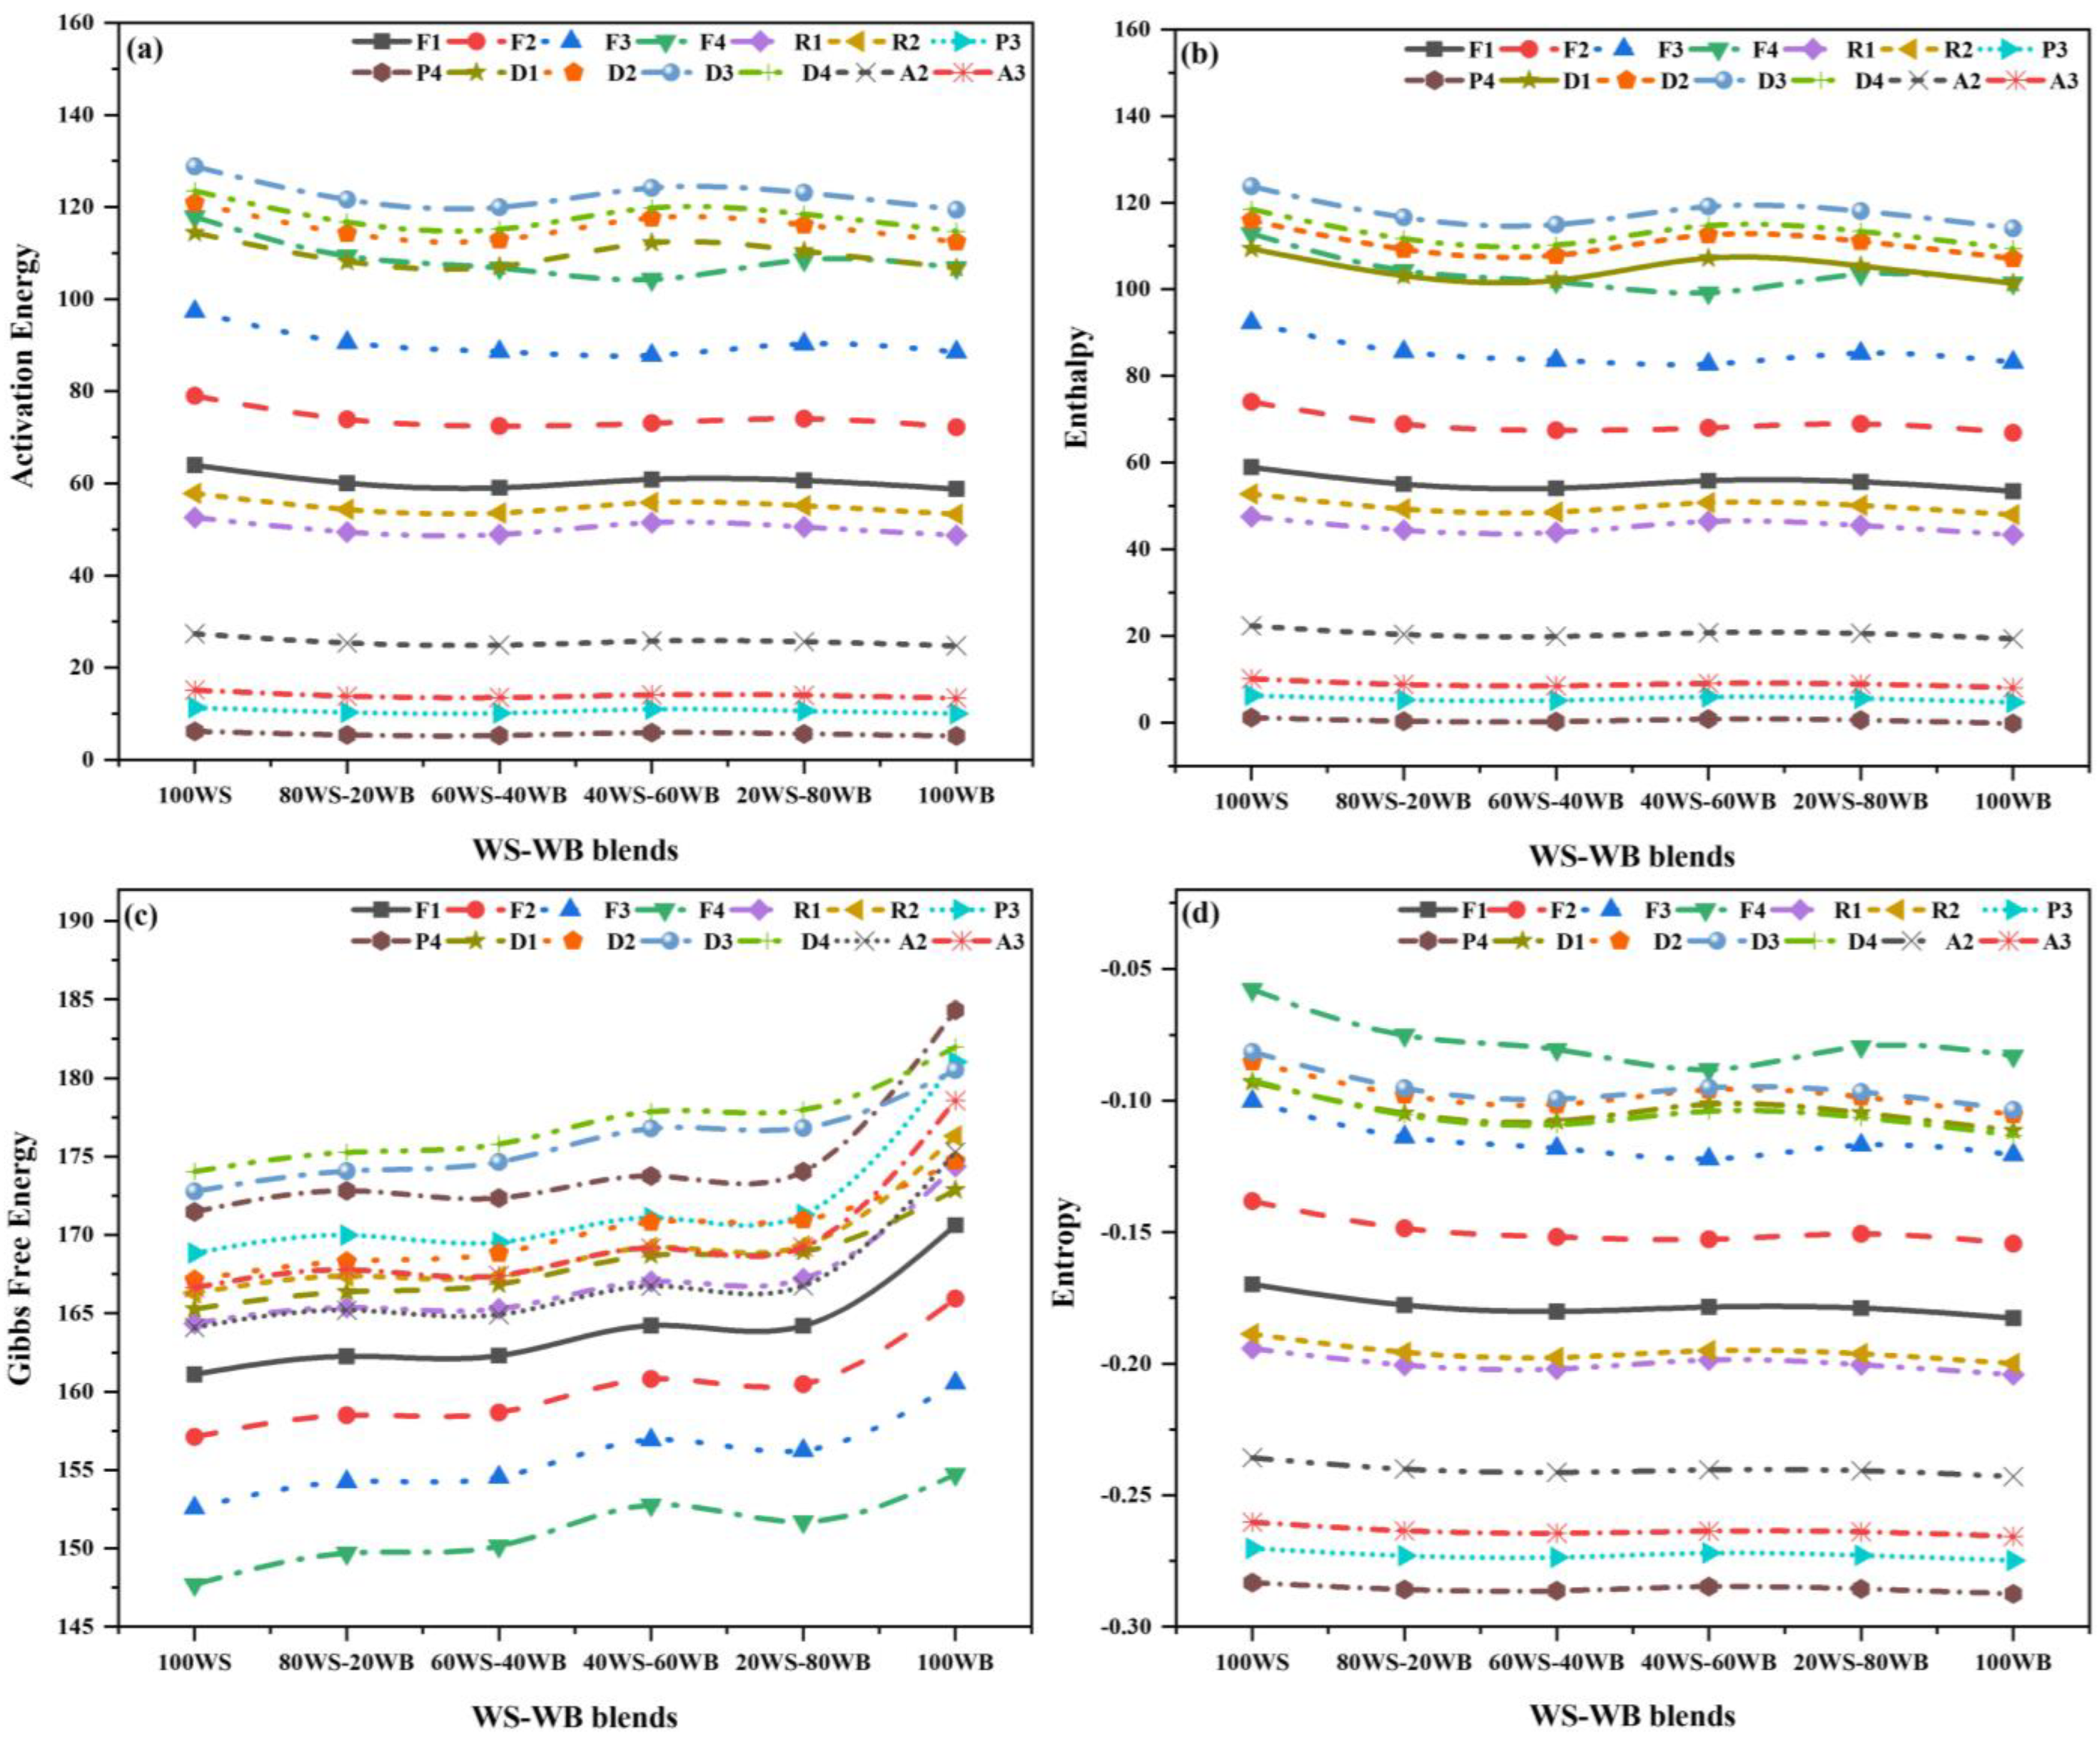
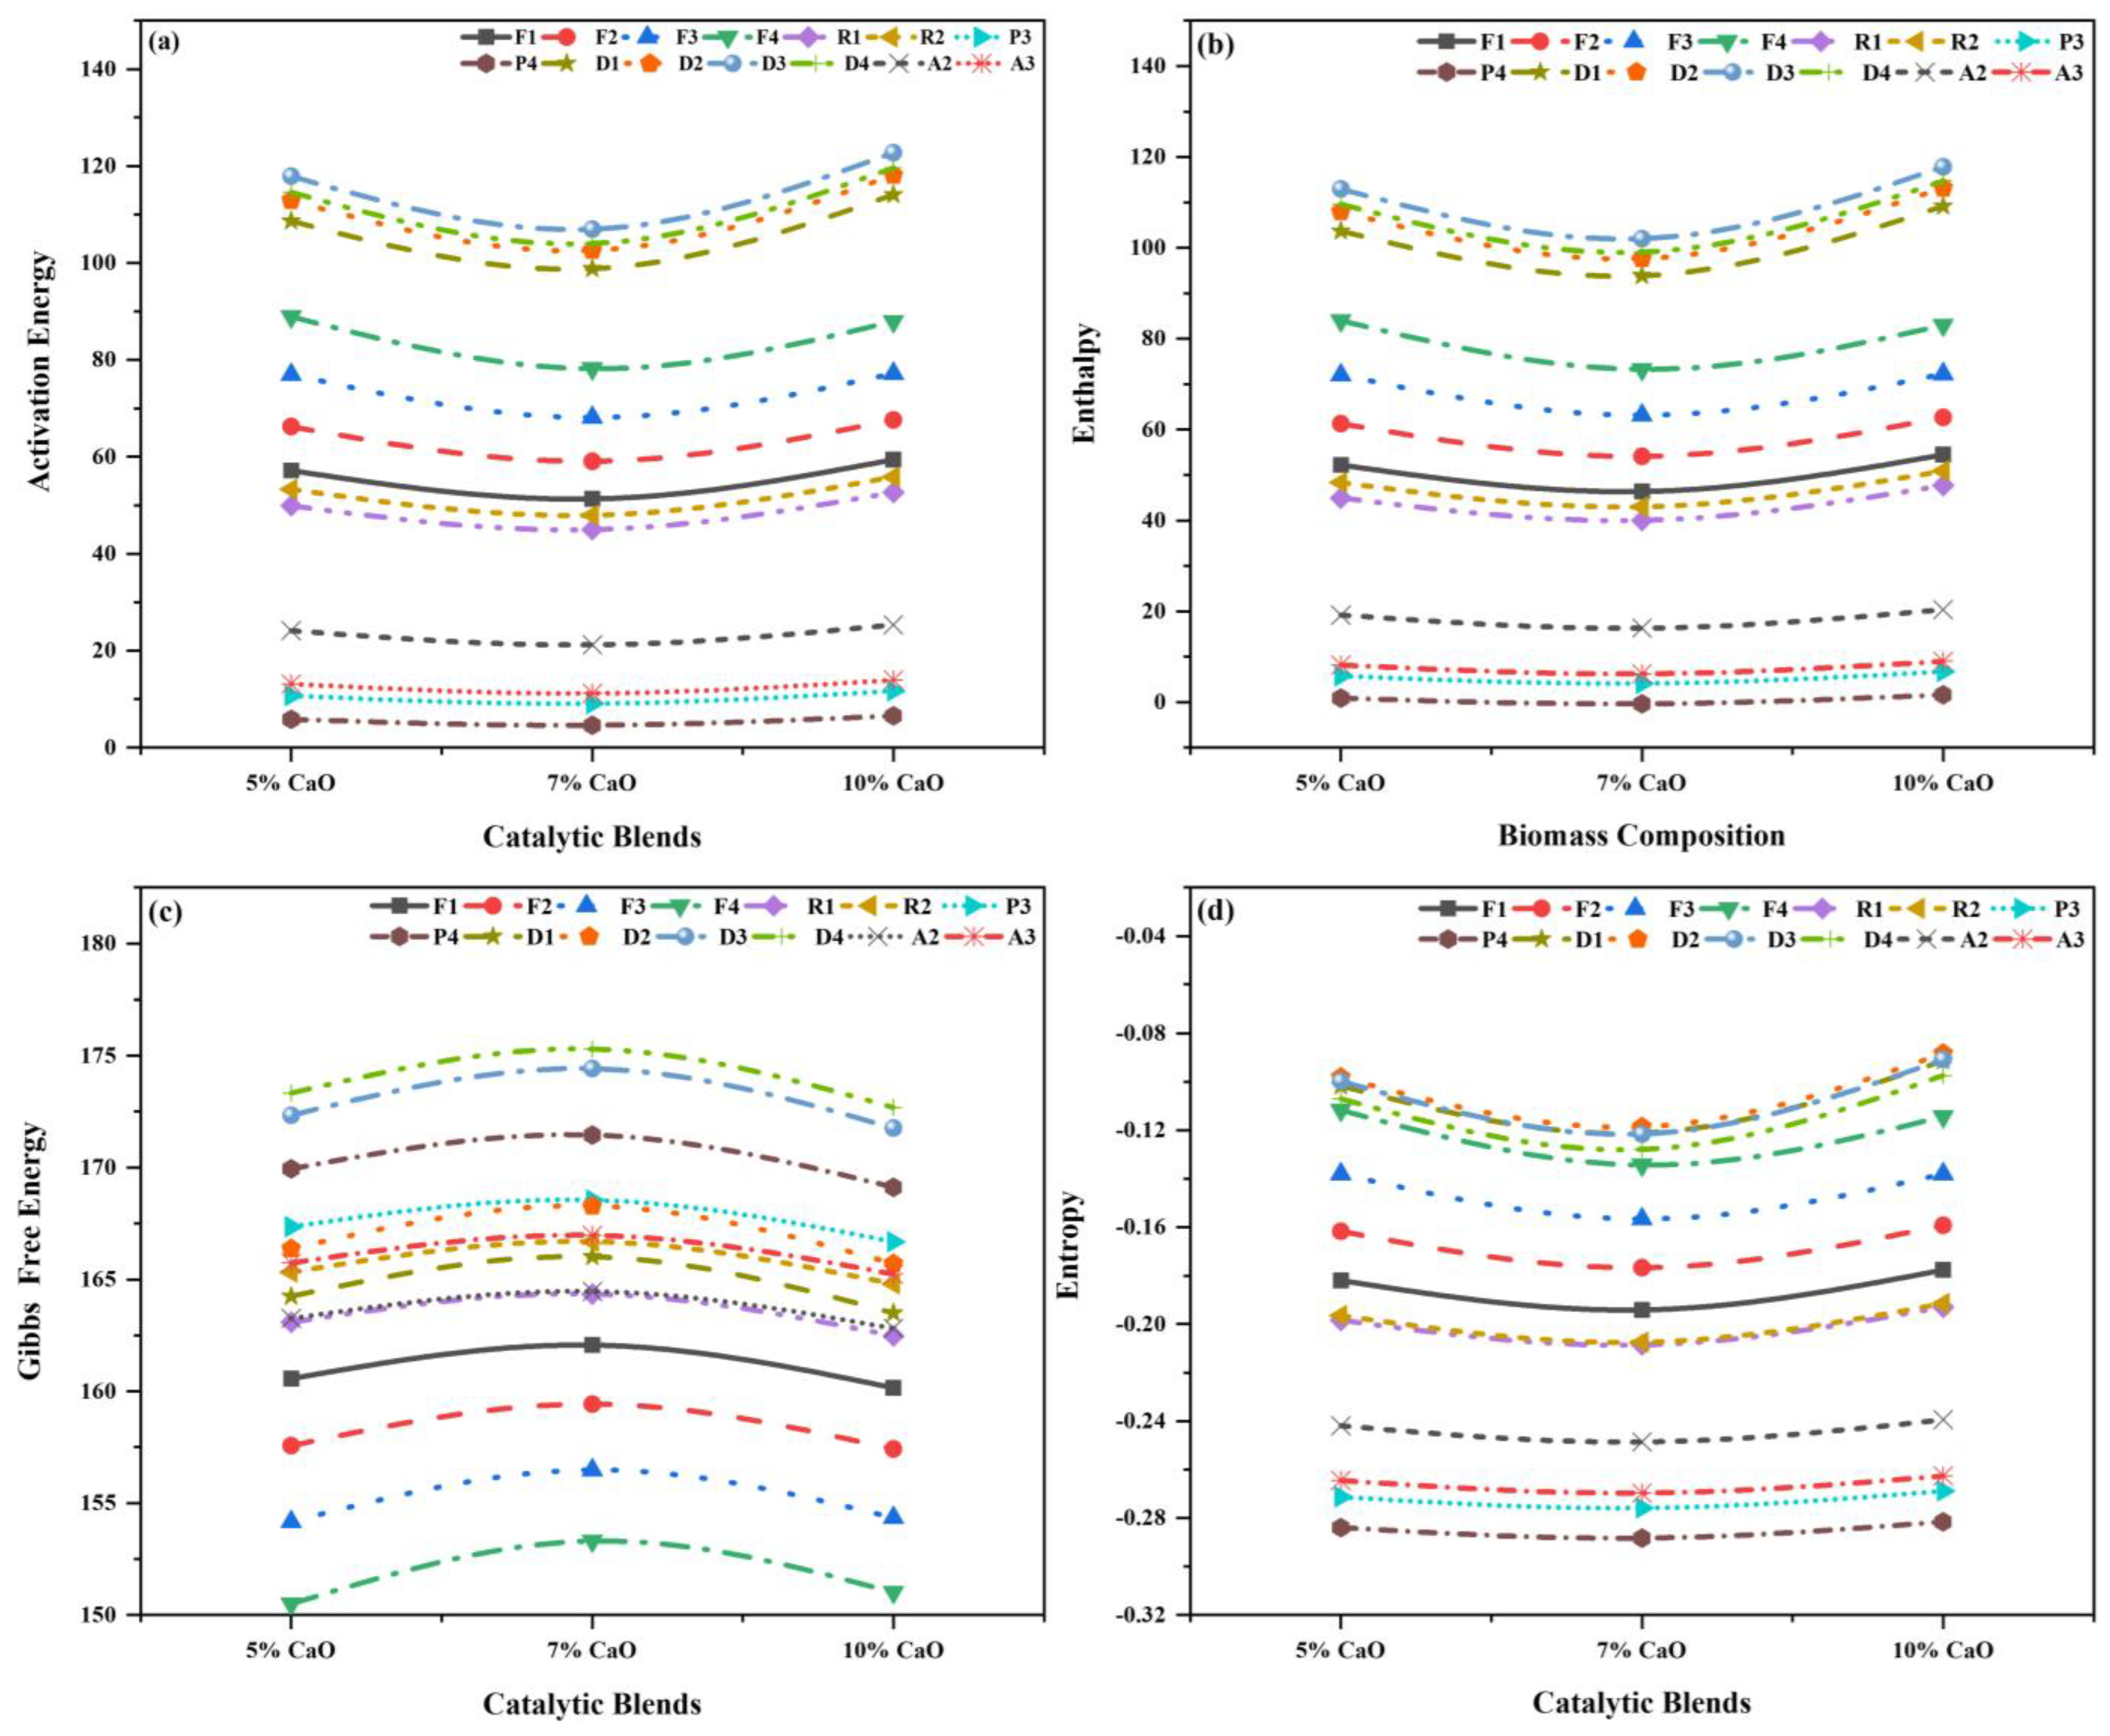
2.4. Thermo-Kinetic Modeling
2.5. Catalytic Co-Pyrolysis in TGA
Thermo-Kinetic
2.6. Significance of the Study
3. Materials and Methodology
3.1. Material and Catalyst Preparation
3.1.1. Material Preparation
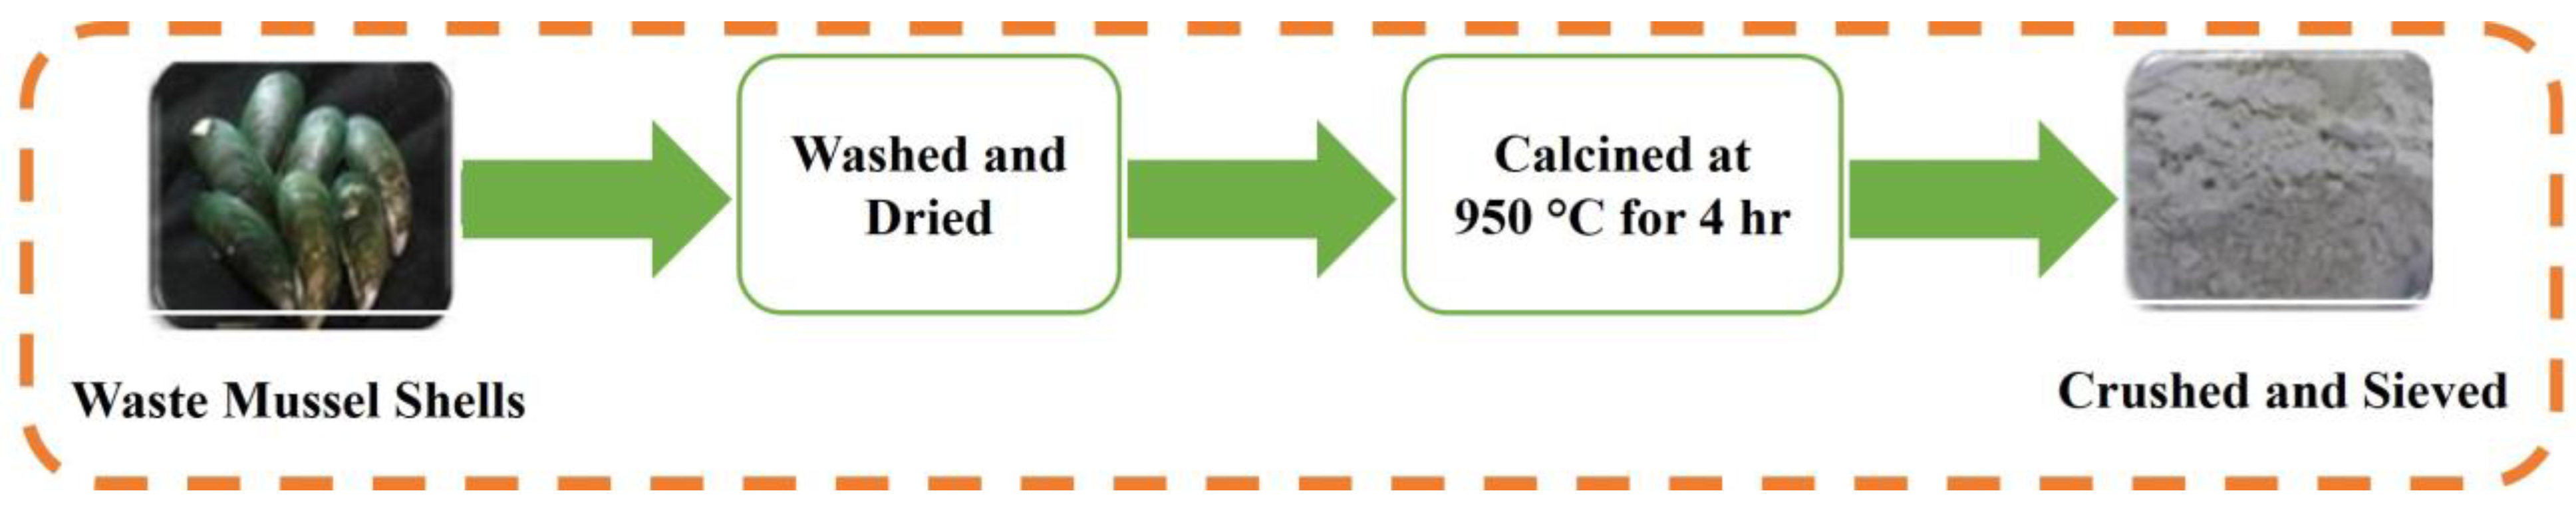
3.1.2. Catalyst Preparation
3.2. Catalytic Blend Preparation
3.3. Characterization
3.4. Synergy Analysis
3.5. Thermo-Kinetic Modeling
3.6. Catalytic Co-Pyrolysis in TGA
4. Conclusions
Supplementary Materials
Author Contributions
Funding
Data Availability Statement
Conflicts of Interest
Nomenclature
| A | Pre-exponential factor |
| CaO | Calcium oxide |
| CHNS-O | Carbon, Hydrogen, Nitrogen, Sulfur, and Oxygen |
| DTG | Derivative thermogravimetry |
| Ea | Activation energy |
| K | Rate constant |
| FTIR | Fourier transform infrared spectroscopy |
| h | Planck constant |
| GCV | Gross Calorific Value |
| R2 | Coefficient of Determination |
| TGA | Thermogravimetric analysis |
| R | Gas constant |
| SEM-EDS | Scanning Electron Microscopy and Energy Dispersive Spectroscopy |
| SRWC | Short-rotation-woody-crops |
| (WL%) | Weight loss % |
| 100WS | Wheat straw |
| (RL%) | Residue left % |
| 100WB | Woody sawdust biomass |
| WS-WB | Wheat straw and woody sawdust biomass |
| XRD | X-ray diffraction |
| β | Heating rate |
| α | Conversion Factor |
| ΔH | Enthalpy |
| ΔS | Entropy |
| ΔG | Gibbs free energy |
| kb | Boltzmann constant |
| f(α) | Reaction mechanism |
| g(α) | Integral Function |
| Tp | Peak degradation temperature |
| (wt.%/min) | Rate of weight loss % per min |
References
- Khalid, U.; Khoja, A.H.; Daood, S.S.; Khan, W.U.H.; Din, I.U.; Al-Anazi, A.; Petrillo, A. Experimental and numerical techniques to evaluate coal/biomass fly ash blend characteristics and potentials. Sci. Total Environ. 2024, 912, 169218. [Google Scholar] [CrossRef] [PubMed]
- Khan, L.A.; Liaquat, R.; Aman, M.; Kanan, M.; Saleem, M.; Khoja, A.H.; Bahadar, A.; Khan, W.U.H. Investigation of Novel Transition Metal Loaded Hydrochar Catalyst Synthesized from Waste Biomass (Rice Husk) and Its Application in Biodiesel Production Using Waste Cooking Oil (WCO). Sustainability 2024, 16, 7275. [Google Scholar] [CrossRef]
- IEA. World Energy Outlook 2022; IEA: Paris, France, 2022. [Google Scholar]
- Lee, J.; Kim, S.; You, S.; Park, Y.-K. Bioenergy generation from thermochemical conversion of lignocellulosic biomass-based integrated renewable energy systems. Renew. Sustain. Energy Rev. 2023, 178, 113240. [Google Scholar] [CrossRef]
- Gohar, H.; Khoja, A.H.; Ansari, A.A.; Naqvi, S.R.; Liaquat, R.; Hassan, M.; Hasni, K.; Qazi, U.Y.; Ali, I. Investigating the characterisation; kinetic mechanism, and thermodynamic behaviour of coal-biomass blends in co-pyrolysis process. Process Saf. Environ. Prot. 2022, 163, 645–658. [Google Scholar] [CrossRef]
- Ong, H.C.; Chen, W.-H.; Singh, Y.; Gan, Y.Y.; Chen, C.-Y.; Show, P.L. A state-of-the-art review on thermochemical conversion of biomass for biofuel production: A TG-FTIR approach. Energy Convers. Manag. 2020, 209, 112634. [Google Scholar] [CrossRef]
- Singh, R.K.; Patil, T.; Pandey, D.; Tekade, S.P.; Sawarkar, A.N. Co-pyrolysis of petroleum coke and banana leaves biomass: Kinetics, reaction mechanism, and thermodynamic analysis. J. Environ. Manag. 2022, 301, 113854. [Google Scholar] [CrossRef] [PubMed]
- Picchio, R.; Latterini, F.; Venanzi, R.; Stefanoni, W.; Suardi, A.; Tocci, D.; Pari, L. Pellet production from woody and non-woody feedstocks: A review on biomass quality evaluation. Energies 2020, 13, 2937. [Google Scholar] [CrossRef]
- Stolarski, M.J.; Stachowicz, P.; Dudziec, P. Wood pellet quality depending on dendromass species. Renew. Energy 2022, 199, 498–508. [Google Scholar] [CrossRef]
- Ahmed, A.; Bakar, M.S.A.; Sukri, R.S.; Hussain, M.; Farooq, A.; Moogi, S.; Park, Y.-K. Sawdust pyrolysis from the furniture industry in an auger pyrolysis reactor system for biochar and bio-oil production. Energy Convers. Manag. 2020, 226, 113502. [Google Scholar] [CrossRef]
- Wang, S.; Song, T.; Yin, S.; Hartge, E.-U.; Dymala, T.; Shen, L.; Heinrich, S.; Werther, J. Syngas, tar and char behavior in chemical looping gasification of sawdust pellet in fluidized bed. Fuel 2020, 270, 117464. [Google Scholar] [CrossRef]
- Taghizadeh-Alisaraei, A.; Tatari, A.; Khanali, M.; Keshavarzi, M. Potential of biofuels production from wheat straw biomass, current achievements and perspectives: A review. Biofuels 2023, 14, 79–92. [Google Scholar] [CrossRef]
- Gupta, S.; Mondal, P. Catalytic pyrolysis of pine needles with nickel doped gamma-alumina: Reaction kinetics, mechanism, thermodynamics and products analysis. J. Clean. Prod. 2021, 286, 124930. [Google Scholar] [CrossRef]
- Biswas, B.; Kumar, A.A.; Bisht, Y.; Singh, R.; Kumar, J.; Bhaskar, T. Effects of temperature and solvent on hydrothermal liquefaction of Sargassum tenerrimum algae. Bioresour. Technol. 2017, 242, 344–350. [Google Scholar] [CrossRef]
- El-Sayed, S.A.; Mostafa, M.E. Pyrolysis and co-pyrolysis of Egyptian olive pomace, sawdust, and their blends: Thermal decomposition, kinetics, synergistic effect, and thermodynamic analysis. J. Clean. Prod. 2023, 401, 136772. [Google Scholar] [CrossRef]
- Gouws, S.M.; Carrier, M.; Bunt, J.R.; Neomagus, H.W. Co-pyrolysis of torrefied biomass and coal: Effect of pressure on synergistic reactions. J. Anal. Appl. Pyrolysis 2022, 161, 105363. [Google Scholar] [CrossRef]
- Mariyam, S.; Zuhara, S.; Parthasarathy, P.; McKay, G. A Review on Catalytic Fast Co-Pyrolysis Using Analytical Py-GC/MS. Molecules 2023, 28, 2313. [Google Scholar] [CrossRef] [PubMed]
- Nandakumar, T.; Dwivedi, U.; Pant, K.K.; Kumar, S.; Balaraman, E. Wheat straw/HDPE co-reaction synergy and enriched production of aromatics and light olefins via catalytic co-pyrolysis over Mn, Ni, and Zn metal modified HZSM-5. Catal. Today 2023, 408, 111–126. [Google Scholar] [CrossRef]
- Khan, W.U.H.; Khoja, A.H.; Gohar, H.; Naqvi, S.R.; Din, I.U.; Lumbers, B.; Salem, M.A.; Alzahrani, A.Y. In depth thermokinetic investigation on Co-pyrolysis of low-rank coal and algae consortium blends over CeO2 loaded hydrotalcite (MgNiAl) catalyst. J. Environ. Chem. Eng. 2022, 10, 108293. [Google Scholar] [CrossRef]
- Shafaghat, H.; Lee, H.W.; Tsang, Y.F.; Oh, D.; Jae, J.; Jung, S.-C.; Ko, C.H.; Lam, S.S.; Park, Y.-K. In-situ and ex-situ catalytic pyrolysis/co-pyrolysis of empty fruit bunches using mesostructured aluminosilicate catalysts. Chem. Eng. J. 2019, 366, 330–338. [Google Scholar] [CrossRef]
- Lee, X.J.; Ong, H.C.; Gan, Y.Y.; Chen, W.-H.; Mahlia, T.M.I. State of art review on conventional and advanced pyrolysis of macroalgae and microalgae for biochar, bio-oil and bio-syngas production. Energy Convers. Manag. 2020, 210, 112707. [Google Scholar] [CrossRef]
- Das, P.; Chandramohan, V.; Mathimani, T.; Pugazhendhi, A. Recent advances in thermochemical methods for the conversion of algal biomass to energy. Sci. Total Environ. 2021, 766, 144608. [Google Scholar] [CrossRef] [PubMed]
- Xu, T.; Xu, J.; Wu, Y. Hydrogen-rich gas production from two-stage catalytic pyrolysis of pine sawdust with calcined dolomite. Catalysts 2022, 12, 131. [Google Scholar] [CrossRef]
- Jin, X.; Lee, J.H.; Choi, J.W. Catalytic co-pyrolysis of woody biomass with waste plastics: Effects of HZSM-5 and pyrolysis temperature on producing high-value pyrolytic products and reducing wax formation. Energy 2022, 239, 121739. [Google Scholar] [CrossRef]
- Wang, W.; Li, X.; Ye, D.; Cai, L.; Shi, S.Q. Catalytic pyrolysis of larch sawdust for phenol-rich bio-oil using different catalysts. Renew. Energy 2018, 121, 146–152. [Google Scholar] [CrossRef]
- Lu, Q.; Chen, X.; Li, K.; Meng, L.; Xie, X.; Yuan, S.; Gao, Y.; Zhou, X. Synergistic effect of volatile inherent minerals on catalytic pyrolysis of wheat straw over a Fe–Ca–Ni catalyst. Energy 2022, 253, 124216. [Google Scholar] [CrossRef]
- Zhang, H.; Luo, B.; Wu, K.; Zhao, B.; Yu, J.; Wang, S.; Tao, Y. Ex-situ catalytic pyrolysis of lignin using lignin-carbon catalyst combined with HZSM-5 to improve the yield of high-quality liquid fuels. Fuel 2022, 318, 123635. [Google Scholar] [CrossRef]
- Burra, K.; Gupta, A. Kinetics of synergistic effects in co-pyrolysis of biomass with plastic wastes. Appl. Energy 2018, 220, 408–418. [Google Scholar] [CrossRef]
- Seo, M.W.; Lee, S.H.; Nam, H.; Lee, D.; Tokmurzin, D.; Wang, S.; Park, Y.-K. Recent advances of thermochemical conversion processes for biorefinery. Bioresour. Technol. 2022, 343, 126109. [Google Scholar] [CrossRef]
- Xu, J.; Niu, C.-Y.; Zhang, D.-Y.; Gen, Y.-H.; Hou, Q.-M.; Xie, Y.-H.; Bappi, P. Co-pyrolysis of rice straw and water hyacinth: Characterization of products, yields and biomass interaction effect. Biomass Bioenergy 2019, 127, 105281. [Google Scholar]
- Mohadesi, M.; Aghel, B.; Gouran, A.; Razmehgir, M.H. Transesterification of waste cooking oil using Clay/CaO as a solid base catalyst. Energy 2022, 242, 122536. [Google Scholar] [CrossRef]
- Zhang, S.; Xiong, J.; Lu, J.; Zhou, N.; Li, H.; Cui, X.; Zhang, Q.; Liu, Y.; Ruan, R.; Wang, Y. Synthesis of CaO from waste shells for microwave-assisted catalytic pyrolysis of waste cooking oil to produce aromatic-rich bio-oil. Sci. Total Environ. 2022, 827, 154186. [Google Scholar] [CrossRef] [PubMed]
- Xue, X.; Zhang, C.; Xia, D.; Wang, Y.; Liang, J.; Sun, Y. Dual-catalyst catalytic pyrolysis of poplar sawdust: A systematic study on first-layered catalysts. Chem. Eng. J. 2022, 431, 134251. [Google Scholar] [CrossRef]
- Dzol, M.A.A.M.; Balasundram, V.; Shameli, K.; Ibrahim, N.; Manan, Z.A.; Isha, R. Catalytic pyrolysis of high-density polyethylene over nickel-waste chicken eggshell/HZSM-5. J. Environ. Manag. 2022, 324, 116392. [Google Scholar] [CrossRef] [PubMed]
- Chen, M.; Zhang, S.; Su, Y.; Niu, X.; Zhu, S.; Liu, X. Catalytic co-pyrolysis of food waste digestate and corn husk with CaO catalyst for upgrading bio-oil. Renew. Energy 2022, 186, 105–114. [Google Scholar] [CrossRef]
- Weng, J.; Cheng, Z.; Zhang, Y.; Jiang, C.; Long, L.; Wang, J.; Pan, J. Online evaluation of catalytic co-pyrolysis of hemicellulose and polypropylene over CaO catalyst. Fuel 2023, 332, 125993. [Google Scholar] [CrossRef]
- Vassilev, S.V.; Vassileva, C.G.; Vassilev, V.S. Advantages and disadvantages of composition and properties of biomass in comparison with coal: An overview. Fuel 2015, 158, 330–350. [Google Scholar] [CrossRef]
- Aqsha, A.; Tijani, M.M.; Moghtaderi, B.; Mahinpey, N. Catalytic pyrolysis of straw biomasses (wheat, flax, oat and barley) and the comparison of their product yields. J. Anal. Appl. Pyrolysis 2017, 125, 201–208. [Google Scholar] [CrossRef]
- Obernberger, I.; Thek, G. Physical characterisation and chemical composition of densified biomass fuels with regard to their combustion behaviour. Biomass Bioenergy 2004, 27, 653–669. [Google Scholar] [CrossRef]
- Lateef, H.U.; Kazmi, M.; Tabish, A.N.; Cheema, I.I.; Rashid, M.I. Effect of demineralization on physiochemical and thermal characteristics of wheat straw. Energy Sources Part A Recovery Util. Environ. Eff. 2020, 1–10. [Google Scholar] [CrossRef]
- Zhang, C.; Li, S.; Ouyang, S.; Tsang, C.-W.; Xiong, D.; Yang, K.; Zhou, Y.; Xiao, Y. Co-pyrolysis characteristics of camellia oleifera shell and coal in a TGA and a fixed-bed reactor. J. Anal. Appl. Pyrolysis 2021, 155, 105035. [Google Scholar] [CrossRef]
- Dhar, S.A.; Sakib, T.U.; Hilary, L.N. Biorefinery, Effects of pyrolysis temperature on production and physicochemical characterization of biochar derived from coconut fiber biomass through slow pyrolysis process. Biomass Convers. Biorefinery 2022, 12, 2631–2647. [Google Scholar] [CrossRef]
- Channiwala, S.A.; Parikh, P.P. A unified correlation for estimating HHV of solid, liquid and gaseous fuels. Fuel 2002, 81, 1051–1063. [Google Scholar] [CrossRef]
- Iftikhar, M.; Asghar, A.; Ramzan, N.; Sajjadi, B.; Chen, W.-Y. Biomass densification: Effect of cow dung on the physicochemical properties of wheat straw and rice husk based biomass pellets. Biomass Bioenergy 2019, 122, 1–16. [Google Scholar] [CrossRef]
- Rajinipriya, M.; Nagalakshmaiah, M.; Astruc, J.; Robert, M.; Elkoun, S. Single stage purification of flax, hemp, and milkweed stem and their physical and morphological properties. Int. J. Polym. Anal. Charact. 2018, 23, 78–88. [Google Scholar] [CrossRef]
- Bhattacharyya, M.; Shadangi, K.P.; Mahanta, P.; Mohanty, K. Co-pyrolysis of coal-biomass: Study on reaction kinetics and thermodynamics. Biofuels Bioprod. Biorefining 2022, 16, 725–742. [Google Scholar] [CrossRef]
- Dai, L.; He, C.; Wang, Y.; Liu, Y.; Ruan, R.; Yu, Z.; Zhou, Y.; Duan, D.; Fan, L.; Zhao, Y. Hydrothermal pretreatment of bamboo sawdust using microwave irradiation. Bioresour. Technol. 2018, 247, 234–241. [Google Scholar] [CrossRef]
- Cholapandian, K.; Gurunathan, B.; Rajendran, N. Investigation of CaO nanocatalyst synthesized from Acalypha indica leaves and its application in biodiesel production using waste cooking oil. Fuel 2022, 312, 122958. [Google Scholar] [CrossRef]
- Jitjamnong, J.; Luengnaruemitchai, A.; Samanwonga, N.; Chuaykarn, N. Biodiesel production from canola oil and methanol using Ba impregnated calcium oxide with microwave irradiation-assistance. Chiang Mai J. Sci. 2019, 46, 987–1000. [Google Scholar]
- Sari, E.P.; Wijaya, K.; Trisunaryanti, W.; Syoufian, A.; Hasanudin, H.; Saputri, W.D. The effective combination of zirconia superacid and zirconia-impregnated CaO in biodiesel manufacturing: Utilization of used coconut cooking oil (UCCO). Int. J. Energy Environ. Eng. 2022, 13, 967–978. [Google Scholar] [CrossRef]
- Arana, J.T.; Torres, J.J.; Acevedo, D.F.; Illanes, C.O.; Ochoa, N.A.; Pagliero, C.L. One-Step Synthesis of CaO-ZnO Efficient Catalyst for Biodiesel Production. Int. J. Chem. Eng. 2019, 2019, 1806017. [Google Scholar]
- Smith, B.C. Infrared Spectral Interpretation: A Systematic Approach; CRC Press: Boca Raton, FL, USA, 2018. [Google Scholar]
- Griffiths, P.R. Fourier transform infrared spectrometry. Science 1983, 222, 297–302. [Google Scholar] [CrossRef] [PubMed]
- Maache, A.; Chergui, A.; Djouadi, D.; Benhaoua, B.; Chelouche, A.; Boudissa, M. Effect of La doping on ZnO thin films physical properties: Correlation between strain and morphology. Optik 2019, 180, 1018–1026. [Google Scholar] [CrossRef]
- Ahmed, N.; Iqbal, M.A.; Khan, Z.S.; Qayyum, A.A. DC Magnetron-Sputtered Mo Thin Films with High Adhesion, Conductivity and Reflectance. J. Electron. Mater. 2020, 49, 4221–4230. [Google Scholar] [CrossRef]
- Khan, S.G.; Hassan, M.; Anwar, M.; Zeshan; Khan, U.M.; Zhao, C. Mussel shell based CaO nano-catalyst doped with praseodymium to enhance biodiesel production from castor oil. Fuel 2022, 330, 125480. [Google Scholar] [CrossRef]
- Klug, H.P.; Alexander, L.E. X-ray Diffraction Procedures: For Polycrystalline and Amorphous Materials; Wiley: New York, NY, USA, 1974. [Google Scholar]
- Goldstein, J.I.; Newbury, D.E.; Michael, J.R.; Ritchie, N.W.; Scott, J.H.J.; Joy, D.C. Scanning Electron Microscopy and X-ray Microanalysis; Springer: New York, NY, USA, 2017. [Google Scholar]
- Atkins, P. Shriver and Atkins’ Inorganic Chemistry; Oxford University Press: Oxford, NY, USA, 2010. [Google Scholar]
- Adewole, B.Z.; Adeboye, B.S.; Malomo, B.O.; Obayopo, S.O.; Mamuru, S.A.; Asere, A.A. CO-pyrolysis of bituminous coal and coconut shell blends via thermogravimetric analysis. Energy Sources Part A Recovery Util. Environ. Eff. 2020, 1–14. [Google Scholar] [CrossRef]
- Han, B.; Chen, Y.; Wu, Y.; Hua, D.; Chen, Z.; Feng, W.; Yang, M.; Xie, Q. Co-pyrolysis behaviors and kinetics of plastics–biomass blends through thermogravimetric analysis. J. Therm. Anal. Calorim. 2014, 115, 227–235. [Google Scholar] [CrossRef]
- Carpio, R.B.; Zhang, Y.; Kuo, C.-T.; Chen, W.-T.; Schideman, L.C.; de Leon, R.L. Characterization and thermal decomposition of demineralized wastewater algae biomass. Algal Res. 2019, 38, 101399. [Google Scholar] [CrossRef]
- Idris, S.S.; Rahman, N.A.; Ismail, K.; Alias, A.B.; Rashid, Z.A.; Aris, M.J. Investigation on thermochemical behaviour of low rank Malaysian coal, oil palm biomass and their blends during pyrolysis via thermogravimetric analysis (TGA). Bioresour. Technol. 2010, 101, 4584–4592. [Google Scholar] [CrossRef]
- Alam, M.; Bhavanam, A.; Jana, A.; Viroja, J.K.S.; Peela, N.R. Co-pyrolysis of bamboo sawdust and plastic: Synergistic effects and kinetics. Renew. Energy 2020, 149, 1133–1145. [Google Scholar] [CrossRef]
- Vhathvarothai, N.; Ness, J.; Yu, Q.J. An investigation of thermal behaviour of biomass and coal during copyrolysis using thermogravimetric analysis. Int. J. Energy Res. 2014, 38, 1145–1154. [Google Scholar] [CrossRef]
- Yang, Z.; Wu, Y.; Zhang, Z.; Li, H.; Li, X.; Egorov, R.I.; Strizhak, P.A.; Gao, X. Recent advances in co-thermochemical conversions of biomass with fossil fuels focusing on the synergistic effects. Renew. Sustain. Energy Rev. 2019, 103, 384–398. [Google Scholar] [CrossRef]
- Merdun, H.; Laougé, Z.B. Kinetic and thermodynamic analyses during co-pyrolysis of greenhouse wastes and coal by TGA. Renew. Energy 2021, 163, 453–464. [Google Scholar] [CrossRef]
- Hameed, Z.; Aman, Z.; Naqvi, S.R.; Tariq, R.; Ali, I.; Makki, A.A. Kinetic and Thermodynamic Analyses of Sugar Cane Bagasse and Sewage Sludge Co-pyrolysis Process. Energy Fuels 2018, 32, 9551–9558. [Google Scholar] [CrossRef]
- Uzoejinwa, B.B.; He, X.; Wang, S.; Abomohra, A.E.-F.; Hu, Y.; He, Z.; Wang, Q. Co-pyrolysis of seaweeds with waste plastics: Modeling and simulation of effects of co-pyrolysis parameters on yields, and optimization studies for maximum yield of enhanced biofuels. Energy Sources Part A: Recovery Util. Environ. Eff. 2020, 42, 954–978. [Google Scholar] [CrossRef]
- Naqvi, S.R.; Hameed, Z.; Tariq, R.; Taqvi, S.A.; Ali, I.; Niazi, M.B.K.; Noor, T.; Hussain, A.; Iqbal, N.; Shahbaz, M. Synergistic effect on co-pyrolysis of rice husk and sewage sludge by thermal behavior, kinetics, thermodynamic parameters and artificial neural network. Waste Manag. 2019, 85, 131–140. [Google Scholar] [CrossRef]
- Naqvi, S.R.; Ali, I.; Nasir, S.; Taqvi, S.A.A.; Atabani, A.; Chen, W.-H. Assessment of agro-industrial residues for bioenergy potential by investigating thermo-kinetic behavior in a slow pyrolysis process. Fuel 2020, 278, 118259. [Google Scholar] [CrossRef]
- Qi, P.; Chang, G.; Wang, H.; Zhang, X.; Guo, Q. Production of aromatic hydrocarbons by catalytic co-pyrolysis of microalgae and polypropylene using HZSM-5. J. Anal. Appl. Pyrolysis 2018, 136, 178–185. [Google Scholar] [CrossRef]
- Ming, X.; Xu, F.; Jiang, Y.; Zong, P.; Wang, B.; Li, J.; Qiao, Y.; Tian, Y. Thermal degradation of food waste by TG-FTIR and Py-GC/MS: Pyrolysis behaviors, products, kinetic and thermodynamic analysis. J. Clean. Prod. 2020, 244, 118713. [Google Scholar] [CrossRef]
- Gao, W.; Chen, K.; Zeng, J.; Xu, J.; Wang, B. Thermal pyrolysis characteristics of macroalgae Cladophora glomerata. Bioresour. Technol. 2017, 243, 212–217. [Google Scholar] [CrossRef]
- Badshah, S.L.; Shah, Z.; Alves, J.L.F.; da Silva, J.C.G.; Iqbal, A. Pyrolysis of the freshwater macroalgae Spirogyra crassa: Evaluating its bioenergy potential using kinetic triplet and thermodynamic parameters. Renew. Energy 2021, 179, 1169–1178. [Google Scholar] [CrossRef]
- Saeed, S.; Saleem, M.; Durrani, A.; Haider, J.; Riaz, M.; Saeed, S.; Qyyum, M.A.; Nizami, A.-S.; Rehan, M.; Lee, M. Determination of Kinetic and Thermodynamic Parameters of Pyrolysis of Coal and Sugarcane Bagasse Blends Pretreated by Ionic Liquid: A Step towards Optimization of Energy Systems. Energies 2021, 14, 2544. [Google Scholar] [CrossRef]
- Badshah, S.L.; Shah, Z.; Alves, J.L.F.; da Silva, J.C.G.; Noreen, N.; Iqbal, A. Kinetic and thermodynamics study of the pyrolytic process of the freshwater macroalga, Chara vulgaris. J. Appl. Phycol. 2021, 33, 2511–2521. [Google Scholar] [CrossRef]
- Florentino-Madiedo, L.; Vega, M.F.; Díaz-Faes, E.; Barriocanal, C. Evaluation of synergy during co-pyrolysis of torrefied sawdust, coal and paraffin. A kinetic and thermodynamic study. Fuel 2021, 292, 120305. [Google Scholar] [CrossRef]
- Parthasarathy, P.; Fernandez, A.; Al-Ansari, T.; Mackey, H.R.; Rodriguez, R.; McKay, G. Thermal degradation characteristics and gasification kinetics of camel manure using thermogravimetric analysis. J. Environ. Manag. 2021, 287, 112345. [Google Scholar] [CrossRef]
- Vasudev, V.; Ku, X.; Lin, J. Pyrolysis of algal biomass: Determination of the kinetic triplet and thermodynamic analysis. Bioresour. Technol. 2020, 317, 124007. [Google Scholar] [CrossRef] [PubMed]
- Ni, Z.; Bi, H.; Jiang, C.; Wang, C.; Tian, J.; Zhou, W.; Sun, H.; Lin, Q. Investigation of the co-pyrolysis of coal slime and coffee industry residue based on machine learning methods and TG-FTIR: Synergistic effect, kinetics and thermodynamic. Fuel 2021, 305, 121527. [Google Scholar] [CrossRef]
- Chen, X.; Li, S.; Liu, Z.; Chen, Y.; Yang, H.; Wang, X.; Che, Q.; Chen, W.; Chen, H. Pyrolysis characteristics of lignocellulosic biomass components in the presence of CaO. Bioresour. Technol. 2019, 287, 121493. [Google Scholar] [CrossRef]
- Veses, A.; Sanahuja-Parejo, O.; Navarro, M.V.; López, J.M.; Murillo, R.; Callén, M.S.; García, T. From laboratory scale to pilot plant: Evaluation of the catalytic co-pyrolysis of grape seeds and polystyrene wastes with CaO. Catal. Today 2021, 379, 87–95. [Google Scholar] [CrossRef]
- Lu, Q.; Zhang, Z.-F.; Dong, C.-Q.; Zhu, X.-F. Catalytic Upgrading of Biomass Fast Pyrolysis Vapors with Nano Metal Oxides: An Analytical Py-GC/MS Study. Energies 2010, 3, 1805–1820. [Google Scholar] [CrossRef]
- Wang, D.; Xiao, R.; Zhang, H.; He, G. Comparison of catalytic pyrolysis of biomass with MCM-41 and CaO catalysts by using TGA–FTIR analysis. J. Anal. Appl. Pyrolysis 2010, 89, 171–177. [Google Scholar] [CrossRef]
- Lin, X.; Zhang, Z.; Zhang, Z.; Sun, J.; Wang, Q.; Pittman, C.U. Catalytic fast pyrolysis of a wood-plastic composite with metal oxides as catalysts. Waste Manag. 2018, 79, 38–47. [Google Scholar] [CrossRef] [PubMed]
- Liew, J.X.; Loy, A.C.M.; Chin, B.L.F.; AlNouss, A.; Shahbaz, M.; Al-Ansari, T.; Govindan, R.; Chai, Y.H. Synergistic effects of catalytic co-pyrolysis of corn cob and HDPE waste mixtures using weight average global process model. Renew. Energy 2021, 170, 948–963. [Google Scholar] [CrossRef]
- Park, Y.-K.; Siddiqui, M.Z.; Karagöz, S.; Han, T.U.; Watanabe, A.; Kim, Y.-M. In-situ catalytic co-pyrolysis of kukersite oil shale with black pine wood over acid zeolites. J. Anal. Appl. Pyrolysis 2021, 155, 105050. [Google Scholar] [CrossRef]
- Zhang, X.; Lei, H.; Zhu, L.; Zhu, X.; Qian, M.; Yadavalli, G.; Wu, J.; Chen, S. Thermal behavior and kinetic study for catalytic co-pyrolysis of biomass with plastics. Bioresour. Technol. 2016, 220, 233–238. [Google Scholar] [CrossRef]
- Xu, S.; Cao, B.; Uzoejinwa, B.B.; Odey, E.A.; Wang, S.; Shang, H.; Li, C.; Hu, Y.; Wang, Q.; Nwakaire, J.N. Synergistic effects of catalytic co-pyrolysis of macroalgae with waste plastics. Process Saf. Environ. Prot. 2020, 137, 34–48. [Google Scholar] [CrossRef]
- Dai, M.; Yu, Z.; Fang, S.; Ma, X. Behaviors, product characteristics and kinetics of catalytic co-pyrolysis spirulina and oil shale. Energy Convers. Manag. 2019, 192, 1–10. [Google Scholar] [CrossRef]
- Shahdan, N.A.; Balasundram, V.; Ibrahim, N.; Isha, R.; Manan, Z.A. Catalytic Co-pyrolysis of empty fruit bunch and high-density polyethylene mixtures over rice husk ash: Thermogravimetric, kinetic and thermodynamic analyses. Clean. Eng. Technol. 2022, 9, 100538. [Google Scholar] [CrossRef]
- Rasam, S.; Azizi, K.; Moraveji, M.K.; Akbari, A.; Soria-Verdugo, A. Insights into the co–pyrolysis of olive stone, waste polyvinyl chloride and Spirulina microalgae blends through thermogravimetric analysis. Algal Res. 2022, 62, 102635. [Google Scholar] [CrossRef]
- Wu, Z.; Zhang, J.; Zhang, B.; Guo, W.; Yang, G.; Yang, B. Synergistic effects from co-pyrolysis of lignocellulosic biomass main component with low-rank coal: Online and offline analysis on products distribution and kinetic characteristics. Appl. Energy 2020, 276, 115461. [Google Scholar] [CrossRef]
- Wang, Z.; Burra, K.G.; Lei, T.; Gupta, A.K. Co-pyrolysis of waste plastic and solid biomass for synergistic production of biofuels and chemicals-A review. Prog. Energy Combust. Sci. 2021, 84, 100899. [Google Scholar] [CrossRef]
- Park, D.K.; Kim, S.D.; Lee, S.H.; Lee, J.G. Co-pyrolysis characteristics of sawdust and coal blend in TGA and a fixed bed reactor. Bioresour. Technol. 2010, 101, 6151–6156. [Google Scholar] [CrossRef] [PubMed]
- Tauseef, M.; Ansari, A.A.; Khoja, A.H.; Naqvi, S.R.; Liaquat, R.; Nimmo, W.; Daood, S.S. Thermokinetics synergistic effects on co-pyrolysis of coal and rice husk blends for bioenergy production. Fuel 2022, 318, 123685. [Google Scholar] [CrossRef]
- Ali, I.; Naqvi, S.R.; Bahadar, A. Kinetic analysis of Botryococcus braunii pyrolysis using model-free and model fitting methods. Fuel 2018, 214, 369–380. [Google Scholar] [CrossRef]
- Ashraf, A.; Sattar, H.; Munir, S. A comparative applicability study of model-fitting and model-free kinetic analysis approaches to non-isothermal pyrolysis of coal and agricultural residues. Fuel 2019, 240, 326–333. [Google Scholar] [CrossRef]
- Zhou, L.; Zhang, G.; Zhang, L.; Klinger, D.; Meyer, B. Effects of Contact Conditions between Particles and Volatiles during Co-Pyrolysis of Brown Coal and Wheat Straw in a Thermogravimetric Analyzer and Fixed-Bed Reactor. Processes 2019, 7, 179. [Google Scholar] [CrossRef]
- Nyoni, B.; Duma, S.; Bolo, L.; Shabangu, S.; Hlangothi, S.P. Co-pyrolysis of South African bituminous coal and Scenedesmus microalgae: Kinetics and synergistic effects study. Int. J. Coal Sci. Technol. 2020, 7, 807–815. [Google Scholar] [CrossRef]
- Lu, K.-M.; Lee, W.-J.; Chen, W.-H.; Lin, T.-C. Thermogravimetric analysis and kinetics of co-pyrolysis of raw/torrefied wood and coal blends. Appl. Energy 2013, 105, 57–65. [Google Scholar] [CrossRef]
- Balasundram, V.; Ibrahim, N.; Kasmani, R.M.; Hamid, M.K.A.; Isha, R.; Hasbullah, H.; Ali, R.R. Thermogravimetric catalytic pyrolysis and kinetic studies of coconut copra and rice husk for possible maximum production of pyrolysis oil. J. Clean. Prod. 2017, 167, 218–228. [Google Scholar] [CrossRef]
- Ding, G.; He, B.; Yao, H.; Kuang, Y.; Song, J.; Su, L. Synergistic effect, kinetic and thermodynamics parameters analyses of co-gasification of municipal solid waste and bituminous coal with CO2. Waste Manag. 2021, 119, 342–355. [Google Scholar] [CrossRef]
- Ali, I.; Tariq, R.; Naqvi, S.R.; Khoja, A.H.; Mehran, M.T.; Naqvi, M.; Gao, N. Kinetic and thermodynamic analyses of dried oily sludge pyrolysis. J. Energy Inst. 2021, 95, 30–40. [Google Scholar] [CrossRef]
- Banyhani, Z.M.; Khan, W.U.H.; El-Gawad, H.H.A.; Anwar, M.; Khoja, A.H.; Hassan, M.; Liaquat, R.; El-Bahy, Z.M. Synergistic transformation: Kinetic and thermodynamic evaluation of co-pyrolysis for low-rank bituminous coal and polyurethane foam waste. Process Saf. Environ. Prot. 2024, 184, 907–921. [Google Scholar] [CrossRef]
- Khoja, A.H.; Gohar, H.; Khan, W.U.H.; Qazi, U.Y.; Din, I.U.; Al-Anazi, A.; Ashraf, W.M.; Mujtaba, M.A.; Riaz, F.; Daood, S.S. Exploring copyrolysis characteristics and thermokinetics of peach stone and bituminous coal blends. Energy Sci. Eng. 2023, 11, 4302–4323. [Google Scholar] [CrossRef]


| Sample Code | Carbon (%) | Hydrogen (%) | Nitrogen (%) | Sulfur (%) | Oxygen a (%) | O/C (%) | H/C (%) | GCV (MJ/kg) |
|---|---|---|---|---|---|---|---|---|
| 100WS | 41.25 | 5.85 | 0.62 | 0.16 | 52.12 | 0.95 | 1.69 | 17.92 |
| 100WB | 47.20 | 7.20 | 0.12 | 0.02 | 45.46 | 0.72 | 1.82 | 20.80 |
| CaO Catalyst | ||||
|---|---|---|---|---|
| Sr No. | Range | Peak | Functional Group | Reference |
| 1 | 833–896 | 866 | CO3−2 | [48] |
| 2 | 1064–1186 | 1132 | C−O | [49] |
| 3 | 1337–1580 | 1411 | C=O | [50,51] |
| 4 | 3551–3691 | 3636 | O−H | [31] |
| Angle “2θ” (°) | Interplanar Spacing “d” (Å) | FWHM (Radians) | Crystallite Size “Ds” (nm) | Lattice Parameters “a = b = c” (Å) |
|---|---|---|---|---|
| 32.20 | 2.78 | 0.059 | 146.4 | 1.079852 |
| 37.35 | 2.40 | 0.072 | 121.7 | 1.662741 |
| 53.85 | 1.70 | 0.096 | 97.02 | 4.700846 |
| Sample Code | ) | ) | Deviation (%) | |||
|---|---|---|---|---|---|---|
| (WL%) | (RL%) | (WL%) | (RL%) | (WL%) | (RL%) | |
| 100WS | 72.35 | 27.65 | - | - | - | - |
| 80WS−20WB | 74.62 | 25.38 | 74.48 | 25.52 | 0.19 | −0.54 |
| 60WS−40WB | 74.95 | 25.05 | 76.60 | 23.40 | −2.15 | 7.05 |
| 40WS−60WB | 73.96 | 26.04 | 78.73 | 21.27 | −6.06 | 22.43 |
| 20WS−80WB | 79.18 | 20.82 | 80.85 | 19.15 | −2.07 | 8.72 |
| 100WB | 82.98 | 17.02 | - | - | - | - |
| S.No | Blends with Catalyst | Catalytic Blends | Best Catalytic Blend | Reaction Condition in TGA | Activation Energy-Ea (kJ/mol) | Synergy Analysis Deviation (%) | Ref. |
|---|---|---|---|---|---|---|---|
| 1. | Wheat straw biomass (WS), woody sawdust biomass (WB) using mussel shell-derived CaO catalyst | 5% CaO (0.05:0.95), 7% CaO (0.07:0.93), and 10% CaO (0.10:0.90), | 5% CaO | T = 25–900 °C Heating rate = 20 °C/min | 117.93 kJ/mol | 0.19% | Present work |
| 2. | Corncob biomass with HDPE waste plastic using chicken and duck eggshell catalysts | Corncob:HDPE = 0.9:0.1 Corncob:HDPE:Chicken eggshell = 0.8:0.1:0.1 Corncob:HDPE:Duck eggshell = 0.8:0.1:0.1 | All the catalytic blends showed better performance with chicken eggshell, which shows it as a more favorable one | T = (373 K–1173 K) 100–900 °C Heating rate = 10, 20, 50, 100, 200 K/min | 59.64 kJ/mol | NR | [87] |
| 3. | 10%CeO2@MNA/(20 BCE-80 AC) | 3 wt% and 5 wt% | 3 wt% with an increase in WL% from 45.9% to 68.7% | T = 25–900 °C Heating rate = 20 °C/min | 67.82 kJ/mol | 3.55% | [19] |
| 4. | Kukersite oil shale and black pine wood with HZSM-5(23), HBETA(25), and HY(30) | (BPW/KOS: 1/1) and catalyst-to-sample weight ratio (3/1) | - | T = 25–800 °C Heating rate = 10 °C/min | 22.8 kJ/mol 20.3 kJ/mol 22.2 kJ/mol | NR | [88] |
| 5. | Cellulose, Douglas fir, and LDPE with HZSM-5 | Ratio of 4:1 | DF-LDPE-catalyst | T = 25–600 °C, Heating rate = 20 °C/min | 54.51 kJ/mol | NR- | [89] |
| 6. | Seaweeds and HDPE with HZSM-5 | Ratio of 1:1:2 | Seaweeds-HDPE-HZSM-5, | T = 25–800 °C, Heating rate = 10, 20, 30 and 40 °C/min | (104.21–113.78) kJ/mol | NR | [90] |
| 7. | Spirulina and oil shale with CaO and HZSM-5 | 3CaO1HZSM-5 1CaO1HZSM-5 1CaO3HZSM-5 | SP and OS with 1CaO3HZSM-5 | T = 25–900 °C, Heating rate = 20 °C/min | 192.53 kJ/mol | NR | [91] |
| 8. | Empty fruit bunch (EFB) biomass and recycled (HDPE) plastic with rice husk ash (RHA) and HZSM-5 catalyst | EFB-to-HDPE mass ratio of 1:1, catalyst-to-feedstock mass ratio of 1:1 (Raw RHA, RHA-T, HZSM-5) | Rice husk ash catalyst | T = 30–700 °C Heating rate = 20 °C/min | 70.04 kJ/mol | NR | [92] |
| Sample Code | Weight (%) Composition of Blends | |||||
|---|---|---|---|---|---|---|
| 100WS | 80WS−20WB | 60WS−40WB | 40WS−60WB | 20WS−80WB | 100WB | |
| Wheat Straw (WS) | 100 | 80 | 60 | 40 | 20 | 0 |
| Woody Sawdust (WB) | 0 | 20 | 40 | 60 | 80 | 100 |
| Symbols | Reaction Mechanism | Algebraic Expressions | |
|---|---|---|---|
| Geometric Contraction Models | |||
| R1 | Contracting disk | 1 | |
| R2 | Contracting cylinder | 2 | |
| Power Law | |||
| P3 | Power law; P3 | 3 | |
| P4 | Power law; P4 | 4 | |
| Reaction Order Models | |||
| F1 | First-order | ||
| F2 | Second-order | ||
| F3 | Third-order | ||
| F4 | Fourth-order | ||
| Nucleation Models | |||
| A2 | Avarami–Erofe’ev for n = 2 | ||
| A3 | Avarami–Erofe’ev for n = 3 | ||
| Diffusivity Models | |||
| D1 | Parabolic law | ||
| D2 | Valansi equation | ||
| D3 | Jander equation | ||
| D4 | Ginstling Brounstein equation | ||
Disclaimer/Publisher’s Note: The statements, opinions and data contained in all publications are solely those of the individual author(s) and contributor(s) and not of MDPI and/or the editor(s). MDPI and/or the editor(s) disclaim responsibility for any injury to people or property resulting from any ideas, methods, instructions or products referred to in the content. |
© 2024 by the authors. Licensee MDPI, Basel, Switzerland. This article is an open access article distributed under the terms and conditions of the Creative Commons Attribution (CC BY) license (https://creativecommons.org/licenses/by/4.0/).
Share and Cite
Saleem, M.; Bahadar, A. In-Depth Study on Synergic Interactions and Thermo-Kinetic Analysis of (Wheat Straw and Woody Sawdust) Biomass Co-Pyrolysis over Mussel Shell-Derived CaO Catalyst Using Coats–Redfern Method. Catalysts 2024, 14, 655. https://doi.org/10.3390/catal14090655
Saleem M, Bahadar A. In-Depth Study on Synergic Interactions and Thermo-Kinetic Analysis of (Wheat Straw and Woody Sawdust) Biomass Co-Pyrolysis over Mussel Shell-Derived CaO Catalyst Using Coats–Redfern Method. Catalysts. 2024; 14(9):655. https://doi.org/10.3390/catal14090655
Chicago/Turabian StyleSaleem, Muhammad, and Ali Bahadar. 2024. "In-Depth Study on Synergic Interactions and Thermo-Kinetic Analysis of (Wheat Straw and Woody Sawdust) Biomass Co-Pyrolysis over Mussel Shell-Derived CaO Catalyst Using Coats–Redfern Method" Catalysts 14, no. 9: 655. https://doi.org/10.3390/catal14090655
APA StyleSaleem, M., & Bahadar, A. (2024). In-Depth Study on Synergic Interactions and Thermo-Kinetic Analysis of (Wheat Straw and Woody Sawdust) Biomass Co-Pyrolysis over Mussel Shell-Derived CaO Catalyst Using Coats–Redfern Method. Catalysts, 14(9), 655. https://doi.org/10.3390/catal14090655