Article

Photocatalytic Cement Mortar with Durable Self-Cleaning Performance

1
Department of Civil and Environmental Engineering, Case Western Reserve University, 2104 Adelbert Road, Bingham 279, Cleveland, OH 44106, USA
2
Michael Baker International Inc., 500 Grant Street, Suite 5400, Pittsburgh, PA 15219, USA
*
Author to whom correspondence should be addressed.
Catalysts 2025, 15(3), 249; https://doi.org/10.3390/catal15030249
Submission received: 29 December 2024 / Revised: 21 February 2025 / Accepted: 25 February 2025 / Published: 6 March 2025
(This article belongs to the Special Issue TiO2 Photocatalysts: Design, Optimization and Application)

Abstract

:
Nano-TiO2-modified mortars are fabricated by introducing TiO2 nanoparticles to the conventional mortar mix with designed mixing and curing procedures. It was found that additional TiO2 nanoparticles can accelerate hydration and improve the air void distribution in the mortar matrix. The experiments also showed that 0.5 wt.% and 1 wt.% TiO2-modified mortar has a comparable mechanical strength to traditional cement mortar. The abrasion resistance is improved with nanoparticles at 0.5 wt.% TiO2 concentration. The photocatalytic performance of photocatalytic mortar was confirmed by a methylene blue decomposition test. Finally, a multi-physics computational model was constructed to assess the effects of photocatalytic mortar coated on building in air quality improvements in the neighboring area. The benefits are affected by different nano-TiO2 concentrations, as well as wind conditions in the neighborhood. Overall, this study shows that properly designed nano-TiO2-modified mortar is promising to achieve multifunctional performance in terms of mechanical strength and durability as well as autogenous self-cleaning of surrounding environment.

1. Introduction

Concrete is one of the most commonly used construction materials. There are a significant number of efforts and strategies to improve the performance and functionality of concrete materials for transportation applications [1]. With the rapid development of nanoscience and nanotechnology, the use of nanoparticles, such as nano silica fume and titanium dioxide, have received particular interest as potential additives in cement-based materials. Titanium dioxide (TiO2) is a well-known photocatalyst with various applications, especially in environmental and energy-related areas [2,3]. Once activated by ultraviolet, TiO2 has a strong oxidizing ability to break down organic pollutants present both in air and water, thus it has been widely used as a self-cleaning material. Nano-sized TiO2 possesses a higher specific surface area than micro-sized particles, and it significantly increases the effective contact area between TiO2 and pollutants and further facilitates the photocatalytic activity of TiO2.
TiO2 photocatalyst has been applied as an additive to many materials for self-cleaning performance [4,5,6,7,8]. TiO2 either forms a thin film on the substrate or is homogeneously distributed throughout the matrix. For instance, researchers have loaded nano-TiO2 on the surface of polymer nanofiber to maximize the photocatalytic activity of TiO2 [9,10,11,12]. Nanofiber has the advantage of a high surface area, and TiO2-covered nanofiber can greatly increase the contact area between TiO2 and pollutants. Moreover, TiO2 thin film not only provides a self-cleaning function, but also has the benefits of long-term stability and corrosion resistance [13,14,15,16]. A. Folli et al. [17] also studied how the size of TiO2 aggregates influence the photocatalytic performance of TiO2-containing cementitious materials.
Except for self-cleaning performance, additional TiO2 can also influence the mechanical properties of concrete material. Reports have been published and showed the positive effects of nano Fe2O3 and SiO2 particles on improving the mechanical properties of the hydrated materials, and the hydration durations decreased with the addition of nanoparticles [18,19,20,21,22]. Various technologies, such as differential thermal analysis, helium inflow, X-ray diffraction, scanning electron microscopy, nuclear magnetic resonance, etc., have been used to study the influences of nanoparticles on hydration characteristics and microstructures of cement-based materials [23,24,25].
In this study, nano-TiO2-modified mortar was fabricated by introducing TiO2 nanoparticles into Portland cement mortar, making TiO2 particles well-distributed in the mortar matrix. In this way, nano-TiO2 are embedded into the mortar matrix and certain parts can always be exposed, even after the surface layer is worn off by traffic or other abrasive loads. The mechanical properties, including the compressive strength, splitting strength, and abrasive resistance of modified mortars, were measured and compared with traditional mortar. The photocatalytic performance of modified mortar samples after seven years of aging was measured to investigate the long-term photocatalytic activity of nano-TiO2 in modified mortar. The results demonstrate the positive influence of TiO2 on the hydration and mechanical properties of mortar, as well as on the development of self-cleaning capabilities. Finally, to evaluate the feasibility of nano-TiO2-modified cementitious materials coated on building surface, a holistic multi-physics model which couples air flow and chemical reaction was built. Considering a tradeoff between air cleaning efficiency and material cost, a sensitivity study was conducted to find out the optimal TiO2 coverage under different wind speeds. This study demonstrates the potential of integrating photocatalysts into building materials to achieve multifunctional performance, a novel strategy that bridges catalyst with construction materials.

2. Results and Discussions

2.1. Monitoring of Hydration-Induced Thermal Process

TDR measures the dielectric constant and electrical conductivity of materials, and therefore the monitored TDR signals directly reflect the change in the amount of the free water content (that changes the dielectric constant) and the development of microstructure (i.e., that changes the electrical conductivity) in the Portland cement mortar. Figure 1 compares the TDR signals at different curing times. The changes of TDR signals over time indicate the change in the mortar samples as the hydration process evolves. The free moisture content in the mortar decreases with hydration over time for all three types of mortar samples. The signals are similar at the beginning as shown in Figure 1a and start to show some differences over time. Comparing TDR signals of the plain mortar and two nano-TiO2 modified mortars at the same hydration stage, the cement mortar with 0.5 wt.% nano-TiO2 has a higher hydration rate than the other two. This implies that the addition of nano-TiO2 accelerated the cement hydration. Such observation is consistent with other documented studies.

2.2. Microstructures of Nano-TiO2-Modified Mortars

The first subfigure of Figure 2 shows the surface morphologies with SEM of mortar sample modified with 1 wt.% nano-TiO2. The other subfigures show the distributions of a few elements across the sample using the EDX technique. The contours show that the mortar contains various chemical elements, including calcium, silicon, aluminum, iron and oxygen, which are consistent with the mineral and oxide compositions of Portland cement and sand. The major components of Portland cement are CaO, SiO2, Al2O3, and Fe2O3, and sand is made of SiO2 present in quartz form. The elemental distribution image of titanium, solely sourced by TiO2, implies that the TiO2 particles are reasonably well distributed on the cement mortar. However, agglomerates were formed in some areas. The size of the agglomerates reaches as much as tens of micrometers. The agglomeration of colloid nanoparticles cn spontaneously occur mainly due to a high specific surface area [26].

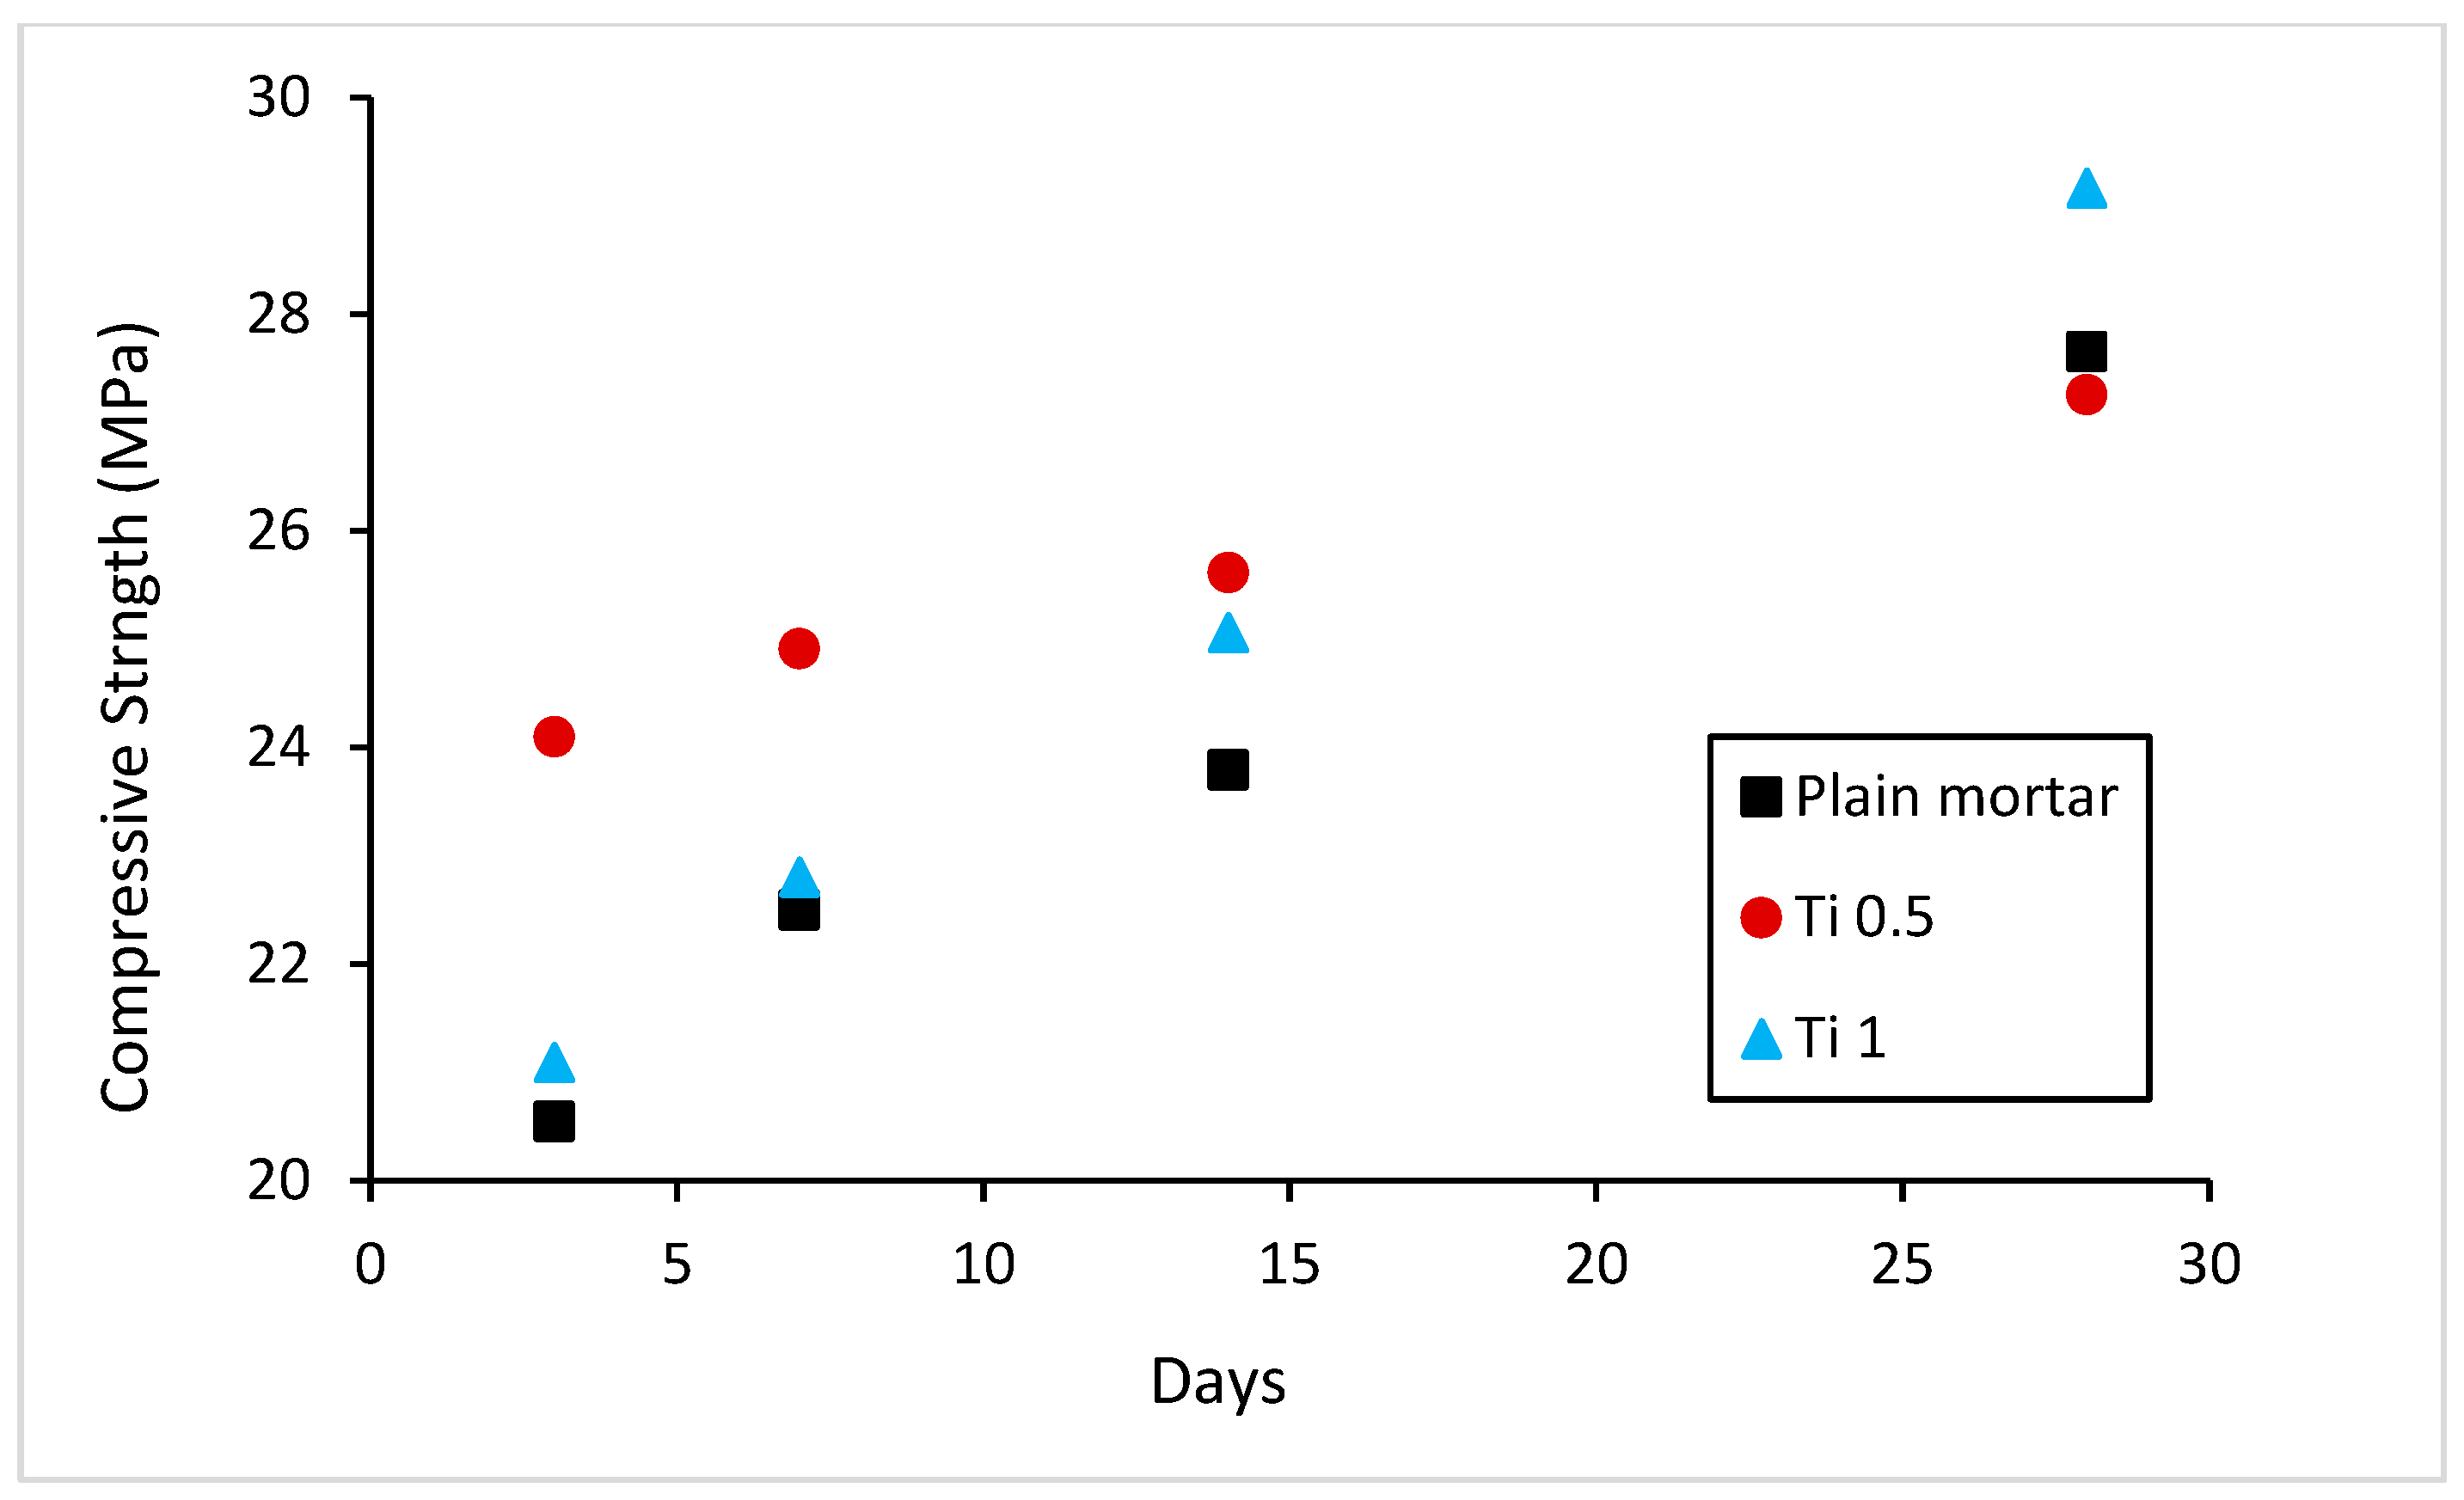
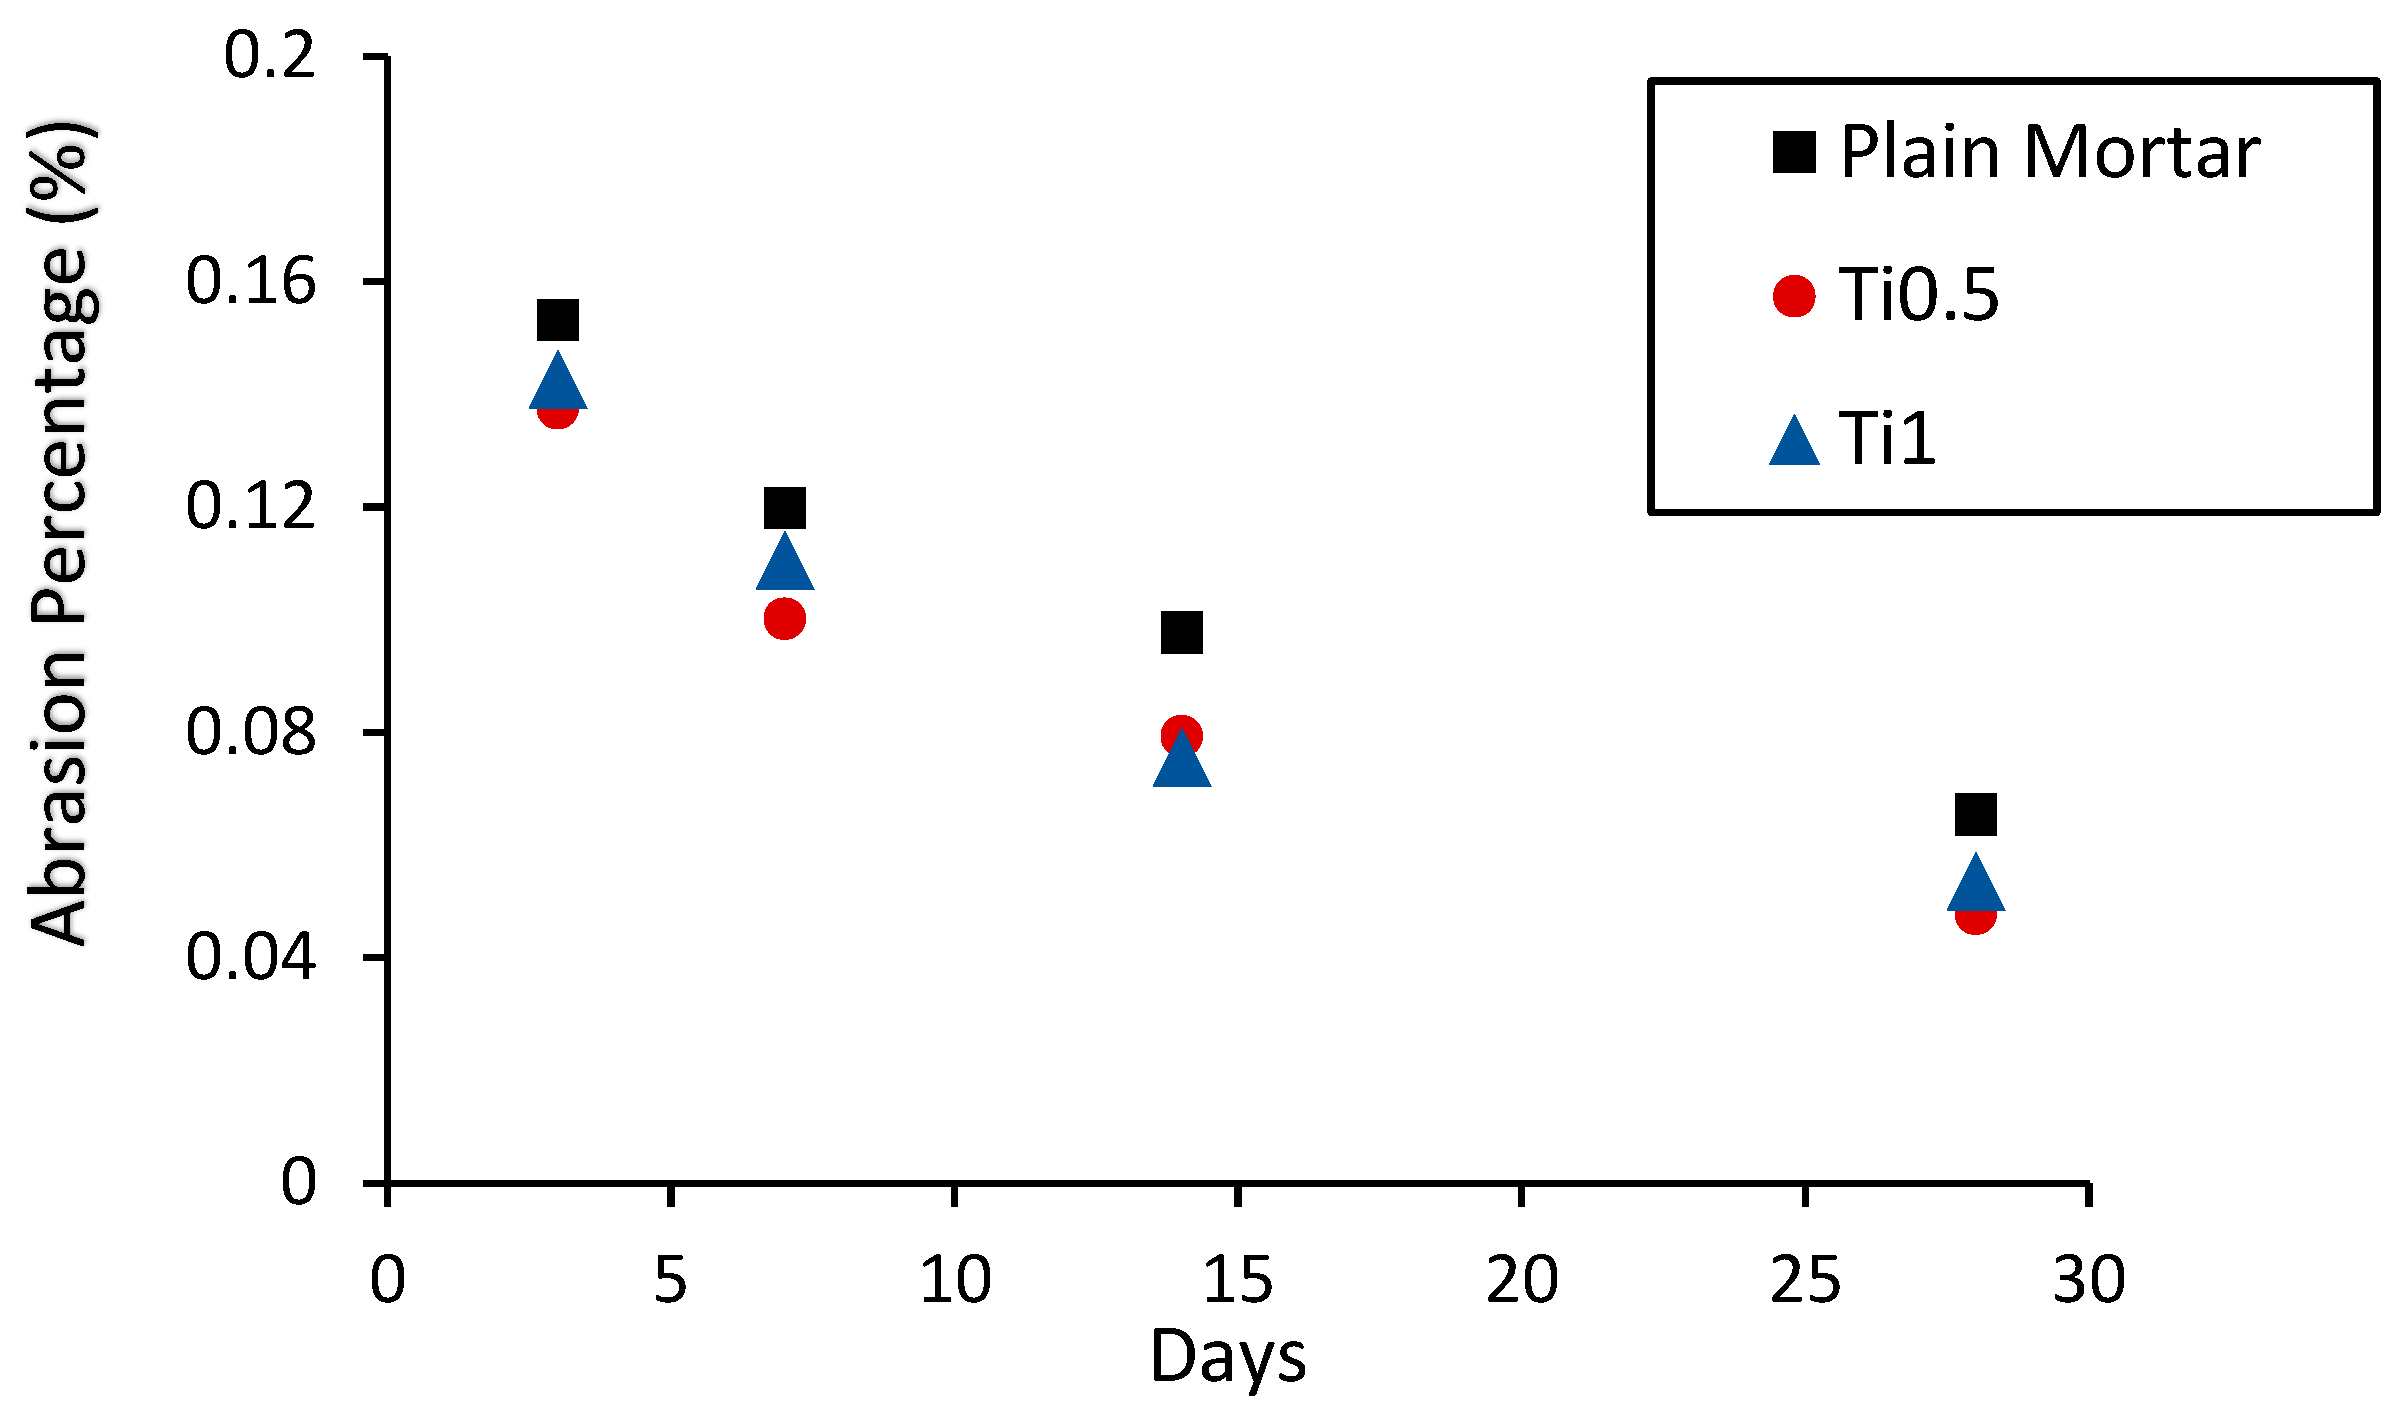
2.3. Mechanical Strength Analysis

The mechanical properties of TiO2-modified mortars, including compressive strength, tensile strength, and abrasive resistance, were analyzed. The compressive strength measured at various curing ages is presented in Figure 3. The results represent the average values from tests conducted on three duplicate specimens. Mortar containing 1 wt.% nano-TiO2 exhibited a slightly higher compressive strength than plain mortar at all curing times. Additionally, 0.5 wt.% nano-TiO2 mortar demonstrated the highest compressive strength compared to the other two mortars during the early hydration stage. However, beyond this point, there was no significant difference in compressive strengths between 0.5 wt.% nano-TiO2-modified mortar and plain mortar.
Splitting tests were conducted to measure the tensile strength of the mortar specimens, with the results summarized in Figure 4. Similar trends were observed from the splitting tests as in the compression tests. TiO2-modified mortars exhibited higher splitting strength compared to plain mortar at all curing times. Mortar containing 0.5 wt.% nano-TiO2 mortar showed the highest splitting strength at 3 and 7 days. However, after 7 days, the splitting strengths of all three specimens became comparable.
The reduction in splitting and compressive strengths at higher nanoparticle concentration may be attributed to the formation of weak zones in the nano-TiO2-modified mortar. These weak zones, caused by the agglomeration of nano-TiO2 particles, act as structural defects that can facilitate the initiation of damage.
Figure 5 summarizes the results of the abrasion test, showing the abrasion percentages of three mortar specimens at different hydration stages. The nano-TiO2-modified mortars demonstrated better abrasive resistance compared to traditional cement mortar, and the modified mortar treated with 0.5 wt.% TiO2 showed a slightly better abrasion resistance over 1 wt.% TiO2. The reduced effectiveness at a higher nano-TiO2 concentration may result from such issues as non-uniform dispersion and particle conglomeration. This finding highlights the importance of selecting an appropriate proportion of nano-TiO2 and employing effective dispersion techniques to maximize the benefits of nano-TiO2 in enhancing the abrasion performance of cement mortar.

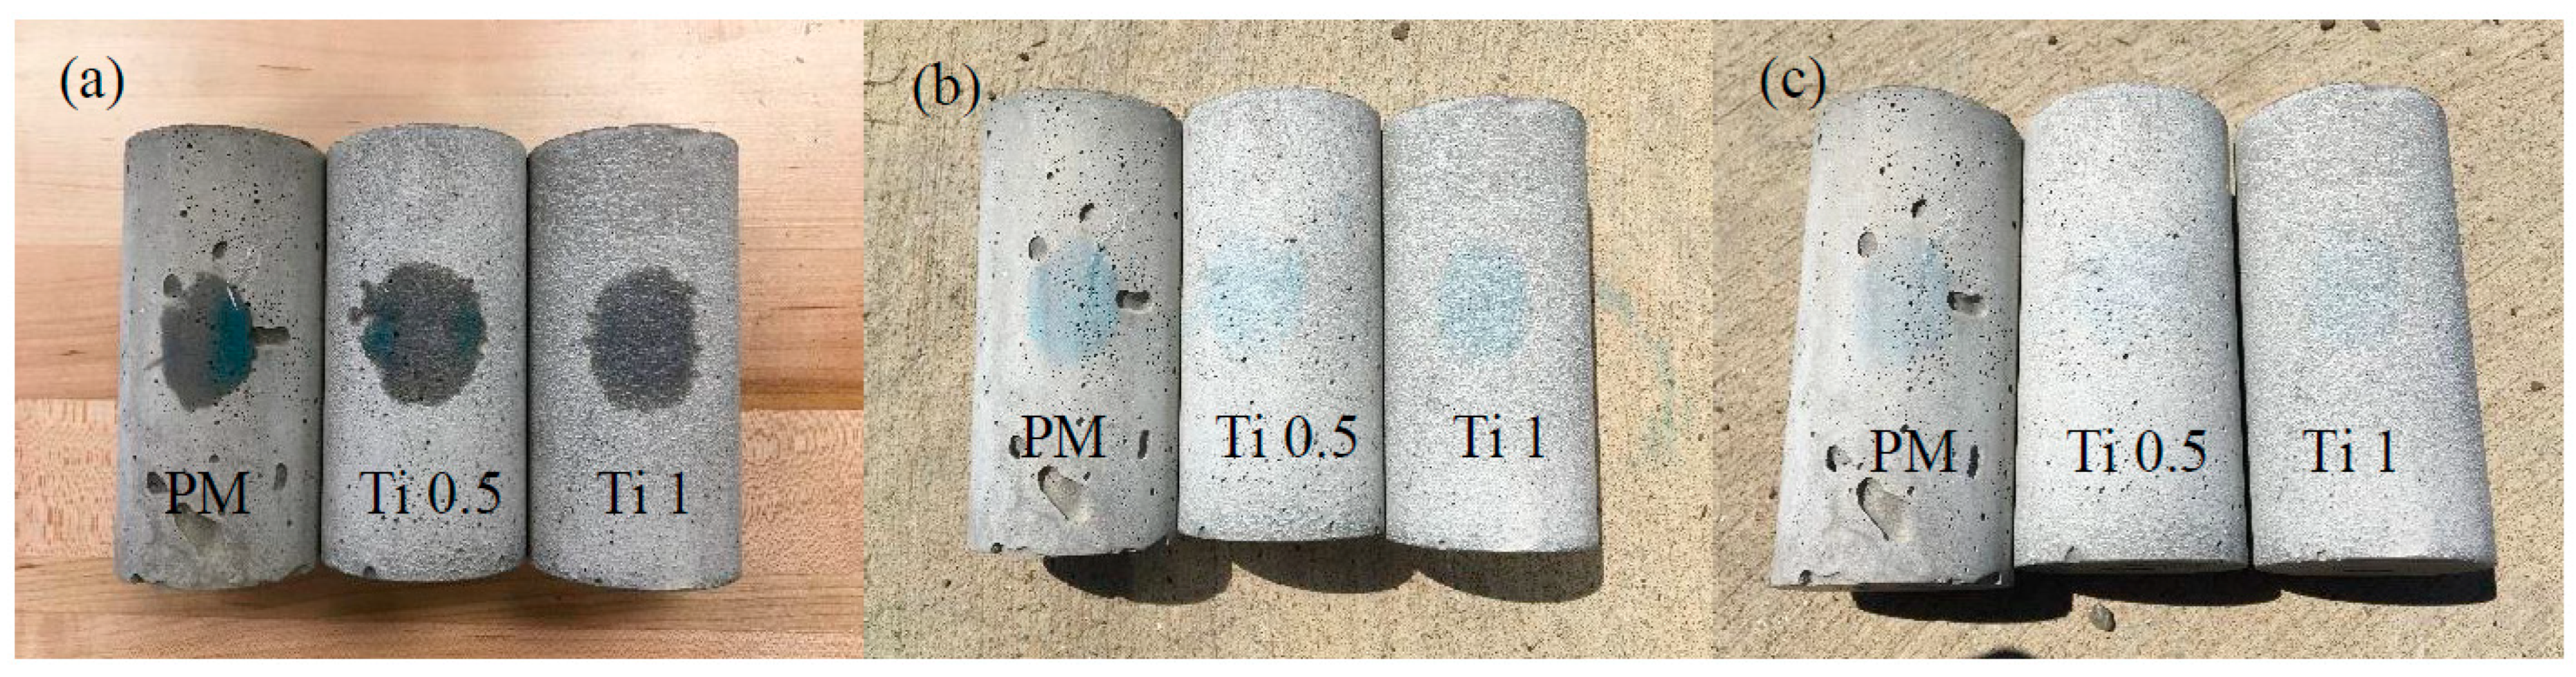
2.4. Photocatalytic Performance Measurements

The photocatalytic performance of modified mortars was measured. The mortars used in the experiment were initially fabricated seven years earlier. The purpose of this measurement is to investigate the long-term photocatalytic capability of nano-TiO2 in modified mortar. Figure 6 and Figure 7 show the color change of methylene blue on mortar specimens under the irradiation of the sunlight. The same amount of methylene blue solution was dropped on the side surface of the mortar specimens. Once the methylene blue solution was dripped onto the mortar surface, the liquid was found to be easily spread out on TiO2-modified mortar. It is possible because the hydrophilic TiO2 particles are exposed to the mortar surface.
The photocatalytic activity of TiO2 in modified mortars was measured with two diluted methylene blue solutions. Methylene blue is treated as a stain in practical applications. Both experiments show that methylene blue on modified mortar is lighter in color than that on plain mortar after the same period of illumination time under the sunlight. This indicates that TiO2 on mortar surface is capable of decomposing methylene blue molecules. Regardless of stains with a high or a low concentration, modified mortar has the ability to break down the contaminates, performing a spontaneous self-cleaning role.
The methylene blue decomposition test was also conducted on mortars with surface grounded to emulate the abrasion effects. The mortar specimens that were ground with sandpaper had rough surfaces full of scratches, as shown in Figure 8. After dripping with the methylene blue solution, the liquid quickly spread out due to the deep scratches serving as flow channels. After one day’s irradiation by sunlight, the blue color on two TiO2-modified mortar specimens faded more than that on the plain mortar specimen. This implies that modified mortars maintain good photocatalytic activity after the abrasion wear, as the TiO2 embedded inside the matrix is exposed. Introducing TiO2 particles into the mortar mix maintains the self-cleaning function in both mortars with and without a wear loss. This is an advantage as compared with applying the TiO2 as a coating layer, particularly when it is subjected to abrasive service loads.

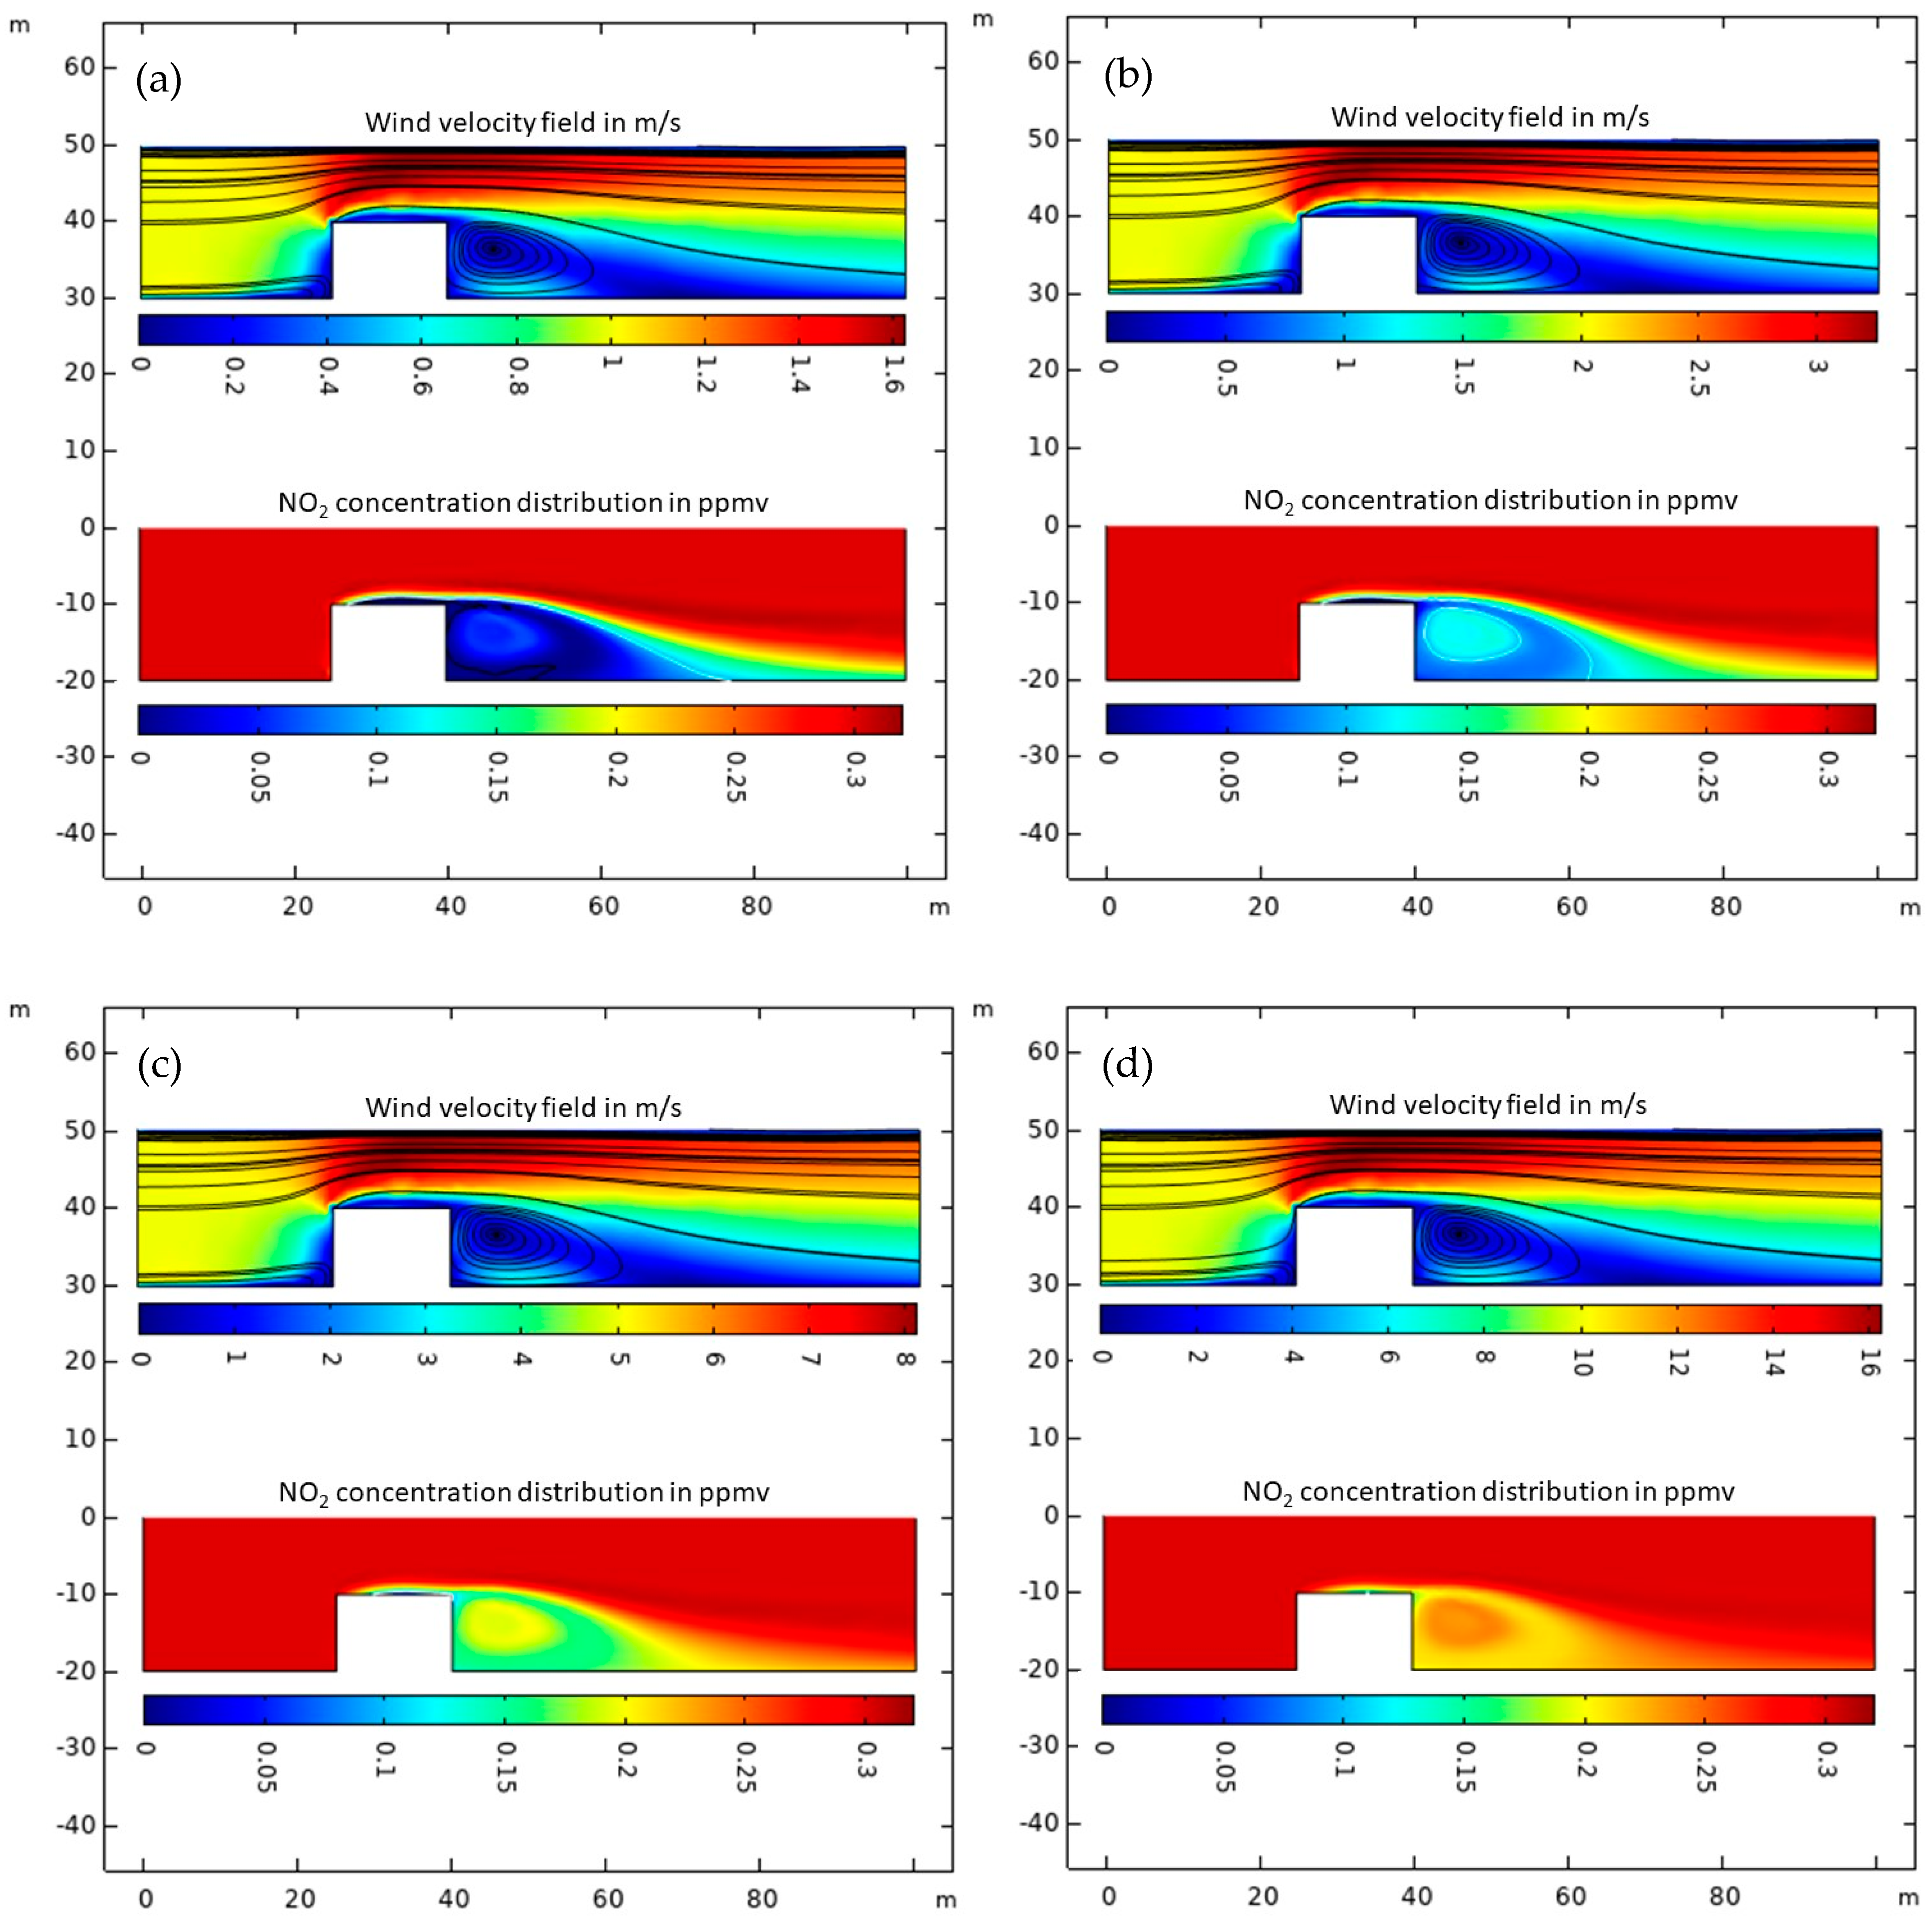
2.5. Air Cleaning Field Test Modeling

The air-cleaning capability of the nano-TiO2-modified exterior building surface was further evaluated using multi-physics modeling. The ambient air quality improvement near the nano-TiO2-coated building was analyzed with different TiO2 coverages and different wind speeds. To create an environment with some degree of air pollution, the initial concentration of NO2 was set to be 0.3 ppmv, which is three times higher than the EPA standard of 0.1 ppmv [27]. The TiO2 coverage ranged from a relatively low dosage, 5 g/m2, to a very high dosage, 100 g/m2. The wind speeds at the inlet varied from calm air, 1 m/s, to a strong breeze, 10 m/s. Figure 9 shows the modeling results of the central cut planes along x–z plane with a medium TiO2 coverage of 40 g/m2 under different wind speeds. The upper diagrams reveal the wind velocity fields near the nano-TiO2-coated building as the inlet velocities are set as 1, 2, 5, and 10 m/s. The lower diagrams show the NO2 concentration distributions with different wind speeds in the stationary phase. The white contour lines represent the boundaries where NO2 concentration equals 0.1 ppmv. It is clearly observed from the contours that, with the same TiO2 coverage of 40 g/m2, the nano-TiO2-coated building can provide a healthy air environment for about 40 m and 20 m under wind speeds of 1 m/s and 2 m/s, respectively. However, under moderate and strong breezes, the NO2 concentration is still higher than the EPA standards, and thus, 40 g/m2 nano-TiO2 coated building cannot provide good protection for residents’ health.
To provide a good reference for the TiO2 coverage in different wind regions, the air quality improvement with combinations of TiO2 coverages and wind speeds was assessed. It is worth noticing that a higher light intensity that activates TiO2 can promote the air-cleaning efficiency. In this modeling, the decomposition rate corresponds to the sunlight UV intensity during partial cloudy days in Central Europe. In an actual application, the air-cleaning efficiency could be improved during sunny days. The NO2 contaminant levels at a height of 1.5 m on the cut plane along the x–z plane (the red cut line as shown in Figure 10a) are shown in Figure 10. This cut line corresponds to the vertical height of a person’s nose from the ground. The air quality at this altitude is crucial to residents’ health, since most people breathe at this height. Figure 10b–e plots the NO2 concentration change at z = 1.5 m along x axis under different wind speeds. In the calm air region where the wind speed is about 1 m/s, a small TiO2 coverage of 10 g/m2 can reduce more than half of the contaminant near the nano-TiO2-coated house. A higher dosage, i.e., larger than 20 g/m2, can maintain the NO2 contaminant below the EPA standard. In the light breeze with a speed of 2 m/s, a medium coverage of 40 g/m2 is required to achieve a lower NO2 concentration than the EPA standard. As the wind speed increases to 5 m/s, a very high TiO2 coverage, i.e., about 100 g/m2, is needed to maintain good air quality near the house. As a strong breeze blows through the neighborhood and more contaminants are brought into the neighboring area, even very high TiO2 coverage is not able to effectively reduce the NO2 contaminant below the EPA standard. In summary, neighboring areas with faster wind speeds require higher TiO2 coverage outside the nano-TiO2-coated house.

3. Materials and Methods

3.1. Specimen Preparations

The mortar mix includes the Type I Portland cement and fine sand. The diameters of fine sand range from 30 μm to 1 mm. The nano-TiO2 particles used were purchased from NanoAmor, Inc., Thousand Oaks, CA, USA. The detailed technical information of nano-TiO2 is listed in Table 1, where APS represents average particle size, and SSA is specific surface area.
Three types of mortars were prepared to evaluate the performance of nano-TiO2-modified mortar, that is, plain mortar (PM), cement mortar with 0.5 wt.% nano-TiO2 (Ti 0.5) and cement mortar with 1 wt.% nano-TiO2 (Ti 1). Note that 0.5 wt.% and 1 wt.% indicate the weight ratio of nano-TiO2 to cement. Table 2 shows the weight proportions of each component for these three types of mortars.
The mixing process began by adding nano-TiO2 particles into water and blending for 2 min using an ultrasonic dispersion tank. The TiO2-water suspension was then stirred at a high speed of 120 rpm for 3 min. The high-speed procedure was applied since high energy is required in order to achieve a uniform distribution of nanoparticles in water. Next, Portland cement was added to the mixture and blended at a medium speed of approximately 80 rpm for 1 min. Sand was gradually incorporated and mixed at the same medium speed. A superplasticizer was then introduced and mixed at a high mixing speed of 120 rpm for 30 s. The mixture was allowed to rest for 1 min before being blended again for 1 min at high speed [28]. The plain mortar was prepared without the addition of nano-TiO2. Mortar specimens with a diameter of 2 inches and a height of 4 inches were produced using standard 2 by 4 inches molds upon accomplishing the mixing procedures. A total of 42 specimens were cast for each design recipe to ensure there were three duplicate specimens for each type of test.

3.2. Specimen Characterization and Experimental Procedure

Microstructures of nano-TiO2-modified mortar were determined by a scanning electron microscope (SEM) equipped with energy-dispersive X-ray analysis (EDX). The hydration of cement mortar was monitored by time domain reflectometry (TDR). TDR is a guided wave electromagnetic wave technology that can be used to study hydration behaviors of materials. TDR signals are direct indicators of the amount of free water and the conductivity of cement mortar [29,30]. The compressive strength, tensile strength, and abrasive resistance of mortars were evaluated using a compression test, splitting test, and an abrasion test, respectively. The abrasion tests were performed on mortar specimens at various curing ages. The standard 60# sandpaper was applied in the abrasion tests. During the tests, the specimens were subjected to a surcharge force of 15 lbs. The rotation speed was set at 150 rpm, with a test duration of 1 min. The specimens were weighed before and after the abrasion test to calculate the abrasion rates.
The long-term photocatalytic functionality of the modified mortar was characterized by the methylene blue decomposition method under the sunlight. The specimens were conserved for over seven years prior to conducting photocatalytic tests. With the presence of activated TiO2, methylene blue as a dye material can be completely decomposed and it turns the blue color to transparent [31].
C 16 H 18 N 3 S C l + 25 1 2 O 2 T i O 2 ,     h v     3.2   e V H C l + H 2 S O 4 + 3 H N O 3 + 16 C O 2 + 6 H 2 O
The methylene blue aqueous solution (1.5 g/100 mL) was purchased from Sigma-Aldrich (St. Louis, MO, USA), and it was further diluted 100 times (15 mg/100 mL) or 1000 times (1.5 mg/100 mL) for the experiments. Diluted methylene blue solutions of 0.25 mL were dropped on the surface of both the plain mortar and the modified mortar, which were then placed outside under the illumination of the sunlight. The color change of the methylene blue stain was recorded and compared after several days’ illumination. Another methylene blue decomposition test was conducted on mortars with the same procedures after surface grinding, which emulates the abrasive wear in practice. The specimens were ground using #80 sandpaper.

3.3. Modeling Method

One practical application of the nano-TiO2 modified cement mortar was proposed as the exterior building surface for the air-cleaning purpose [32]. Here, a three-dimensional multi-physics model was built to evaluate the air-cleaning capability of the nano-TiO2-modified cement mortar in the dimensions of an actual house. The model consisted of two parts: a cubic house (15 m in length, 15 m in width, and 10 m in height) and an air domain (100 m in length, 30 m in width, and 20 m in height), as shown in Figure 1. The house was 25 m away from the left side of the air domain. This model assumes that the exterior surfaces of the house are incorporated with the nano-TiO2-modified cementitious materials, which can decompose the surrounding air contaminant. The air contaminant is blown through the domain by the wind. The wind blows in from the left entrance, where a wind speed was given, and flows out from the right outlet, where the absolute pressure was set to be 1 atm. Since both the geometry and physics are symmetrical along the x–z plane, and thus the size of the model as shown in Figure 11 was reduced to one-half by using symmetry condition without losing any information.
The model was solved in two steps. In the first step, the wind velocity field in the air domain was solved by using a laminar flow module in COMSOL5.0. The normal inflow velocity at the inlet was given with different values ranging from 1 m/s to 10 m/s to simulate quiet days and windy days. In the second step, the transport of a diluted species module and a chemical reaction module in COMSOL were coupled to simulate the transport and decomposition of the air contaminant. In the model, NO2 was used as the air contaminant that can be decomposed by the TiO2-based material and turns into harmless soluble nitrate salts after the decomposition. The initial concentration of NO2 from the inlet was set at 0.3 ppmv, which is higher than the EPA standard of 0.1 ppmv [33], in order to simulate a neighboring area with some degrees of the air pollution. NO2 migrates as the velocity field simulated in the first step. As NO2 reaches the exterior surfaces of the house, it can be decomposed at a decomposition rate, and this photocatalytic decomposition surface reaction follows a pseudo-first-order kinetics [34,35,36].
r = k C
where C is the concentration of NO2 on the surface of nano-TiO2 modified cementitious materials and k is the surface decomposition rate constant. The k value varies with the TiO2 coverage on the house surfaces. Table 3 lists the k value of NO2 with different TiO2 coverages, and the k value was extrapolated from the experimental measurement [31].

4. Conclusions

This study examines the mechanical properties and photocatalytic self-cleaning performance of mortars modified by the introduction of TiO2 nanoparticles. SEM and EDX measurements confirmed that nano-TiO2 particles were well distributed in the mortar matrix. The mechanical properties, including compressive strength, splitting strength, and abrasive resistance, were slightly improved in both 0.5 wt.% and 1 wt.% nano-TiO2-modified mortars compared to the plain cement mortar, with the 0.5 wt.% nano-TiO2-modified mortar achieving higher mechanical performance possibly due to the agglomeration of nanoparticles at a higher percentage. The long-term self-cleaning performance was evaluated using the methylene blue decomposition method. Both modified mortar specimens with 0.5 wt.% and 1 wt.% TiO2 exhibited good photocatalytic activity under the irradiation of the sunlight. Modified mortars after the abrasion still maintained good photocatalytic performance. These results indicate that nano-TiO2-modified mortars have good durability in the self-cleaning function. Using multi-physics computational simulations, nano-TiO2-modified cementitious materials coated on the building exterior surface demonstrate a considerable air quality improvement in the neighborhood. A TiO2 coverage of 20 to 100 g/m2 can maintain the NO2 contaminant level lower than the EPA standard; neighboring areas with a faster wind speed require a higher content of TiO2 in the surface coating. The study demonstrates that incorporating photocatalysts into building materials (i.e., nano-TiO2 modification of mortar) not only improves the mechanical performance of mortar, but also achieves sustained environmental improvements.

Author Contributions

Conceptualization, X.Y.; methodology, X.Y.; software, Z.J.; validation, X.Y.; formal analysis, Z.J.; investigation, B.Z. and Z.J.; resources, X.Y.; data curation, B.Z. and Z.J.; writing—original draft preparation, Z.J. and B.Z.; writing—review and editing, X.Y.; visualization, B.Z. and Z.J.; supervision, X.Y.; project administration, X.Y.; funding acquisition, X.Y. All authors have read and agreed to the published version of the manuscript.

Funding

This research is partially funded by the US National Science Foundation (NSF grant No. 1563238).

Data Availability Statement

Dataset available on request from the authors.

Acknowledgments

The authors appreciate the assistant of Department Technician Jim Berilla during this research.

Conflicts of Interest

Author Bin Zhang was employed by the company Michael Baker International Inc. The remaining authors declare that the research was conducted in the absence of any commercial or financial relationships that could be construed as a potential conflict of interest.

References

  1. Zailan, S.N.; Mahmed, N.; Abdullah, M.M.A.B.; Sandu, A.V. Self-cleaning geopolymer concrete-A review. IOP Conf. Ser. Mater. Sci. 2016, 133, 012026. [Google Scholar] [CrossRef]
  2. Nakata, K.; Fujishima, A. TiO2 photocatalysis: Design and applications. J. Photochem. Photobiol. C 2012, 13, 169–189. [Google Scholar] [CrossRef]
  3. Schneider, J.; Matsuoka, M.; Takeuchi, M.; Zhang, J.; Horiuchi, Y.; Anpo, M.; Bahnemann, D.W. Understanding TiO2 photocatalysis: Mechanisms and materials. Chem. Rev. 2014, 114, 9919–9986. [Google Scholar] [CrossRef]
  4. Adebanjo, A.U.; Abbas, Y.M.; Shafiq, N.; Khan, M.I.; Farhan, S.A.; Masmoudi, R. Optimizing nano-TiO2 and ZnO integration in silica-based high-performance concrete: Mechanical, durability, and photocatalysis insights for sustainable self-cleaning systems. Constr. Build. Mater. 2024, 446, 138038. [Google Scholar] [CrossRef]
  5. Ayappan, C.; Xing, R.; Zhang, X.; Luo, D.; Liu, S.; Fujishima, A. TiO2-based photocatalysts for emerging gaseous pollutants removal: From photocatalysts to reactors design. Coord. Chem. Rev. 2024, 515, 215960. [Google Scholar] [CrossRef]
  6. Liao, G.; Yao, W.; She, A.; Shi, C.; Zuo, J.; Wu, D. Interfacial design of nano-TiO2 modified recycled concrete powder for building self-cleaning. Colloids Surf. A Physicochem. Eng. Asp. 2023, 661, 130925. [Google Scholar] [CrossRef]
  7. Franzoni, E.; Pizzigatti, C.; Fabris, R. Developing inorganic coatings with nano-TiO2 for heritage concrete and assessing their self-cleaning performance by a new laboratory test. Constr. Build. Mater. 2024, 449, 138282. [Google Scholar] [CrossRef]
  8. Mostafa, F.E.Z.M.; Smarzewski, P.; El Hafez, G.M.A.; Farghali, A.A.; Morsi, W.M.; Faried, A.S.; Tawfik, T.A. Analyzing the effects of nano-titanium dioxide and nano-zinc oxide nanoparticles on the mechanical and durability properties of self-cleaning concrete. Materials 2023, 16, 6909. [Google Scholar] [CrossRef] [PubMed]
  9. Neubert, S.; Pliszka, D.; Thavasi, V.; Wintermantel, E.; Ramakrishna, S. Conductive electrospun PANi-PEO/TiO2 fibrous membrane for photo catalysis. Mater. Sci. Eng. B 2011, 176, 640–646. [Google Scholar] [CrossRef]
  10. Lee, B.Y.; Behler, K.; Kurtoglu, M.E.; Wynosky-Dolfi, M.A.; Rest, R.F.; Gogotsi, Y. Titanium dioxide-coated nanofibers for advanced filters. J. Nanopart. Res. 2010, 12, 2511–2519. [Google Scholar] [CrossRef]
  11. Czech, T.; Ramakrishna, S.; Sundarrajan, S. Electrospinning and electrospraying techniques for nanocomposite non-woven fabric production. Fibres Text. East. Eur. 2009, 17, 77–81. [Google Scholar]
  12. Zhang, Y.; Lee, M.W.; An, S.; Sinha-Ray, S.; Khansari, S.; Joshi, B.; Hong, S.; Hong, J.H.; Kim, J.J.; Pourdeyhimi, B.; et al. Antibacterial activity of photocatalytic electrospun titania nanofiber mats and solution-blown soy protein nanofiber mats decorated with silver nanoparticles. Catal. Commun. 2013, 34, 35–40. [Google Scholar] [CrossRef]
  13. Impellizzeri, G.; Scuderi, V.; Romano, L.; Napolitani, E.; Sanz, R.; Carles, R.; Privitera, V. C ion-implanted TiO2 thin film for photocatalytic applications. J. Appl. Phys. 2015, 117, 105308. [Google Scholar] [CrossRef]
  14. Li, Z.; Ding, S.; Kong, L.; Wang, X.; Ashour, A.; Han, B.; Ou, J. Nano TiO2-engineered anti-corrosion concrete for sewage system. J. Clean. Prod. 2022, 337, 130508. [Google Scholar] [CrossRef]
  15. Kajitvichyanukul, P.; Ananpattarachai, J.; Pongpom, S. Sol–gel preparation and properties study of TiO2 thin film for photocatalytic reduction of chromium (VI) in photocatalysis process. Sci. Technol. Adv. Mater. 2005, 6, 352–358. [Google Scholar] [CrossRef]
  16. Bai, X.; Yang, S.; Tan, C.; Jia, T.; Guo, L.; Song, W.; Jian, M.; Zhang, X.; Zhang, Z.; Wu, L.; et al. Synthesis of TiO2 based superhydrophobic coatings for efficient anti-corrosion and self-cleaning on stone building surface. J. Clean. Prod. 2022, 380, 134975. [Google Scholar] [CrossRef]
  17. Folli, A.; Pochard, I.; Nonat, A.; Jakobsen, U.H.; Shepherd, A.M.; Macphee, D.E. Engineering photocatalytic cements: Understanding TiO2 surface chemistry to control and modulate photocatalytic performances. J. Am. Ceram. Soc. 2010, 93, 3360–3369. [Google Scholar] [CrossRef]
  18. Jennings, H.M. A model for the microstructure of calcium silicate hydrate in cement paste. Cem. Concr. Res. 2000, 30, 101–116. [Google Scholar] [CrossRef]
  19. Jo, B.W.; Kim, C.H.; Tae, G.H.; Park, J.B. Characteristics of cement mortar with nano-SiO2 particles. Constr. Build. Mater. 2007, 21, 1351–1355. [Google Scholar] [CrossRef]
  20. Li, H.; Xiao, H.G.; Yuan, J.; Ou, J. Microstructure of cement mortar with nano-particles. Compos. Part B 2004, 35, 185–189. [Google Scholar] [CrossRef]
  21. Monteiro, P.J.; Kirchheim, A.P.; Chae, S.; Fischer, P.; MacDowell, A.A.; Schaible, E.; Wenk, H.R. Characterizing the nano and micro structure of concrete to improve its durability. Cem. Concr. Compos. 2009, 31, 577–584. [Google Scholar] [CrossRef]
  22. Li, H.; Zhang, M.H.; Ou, J.P. Abrasion resistance of concrete containing nano-particles for pavement. Wear 2006, 260, 1262–1266. [Google Scholar] [CrossRef]
  23. Qing, Y.; Zenan, Z.; Deyu, K.; Rongshen, C. Influence of nano-SiO2 addition on properties of hardened cement paste as compared with silica fume. Constr. Build. Mater. 2007, 21, 539–545. [Google Scholar] [CrossRef]
  24. Sanchez, F.; Ince, C. Microstructure and macroscopic properties of hybrid carbon nanofiber/silica fume cement composites. Compos. Sci. Technol. 2009, 69, 1310–1318. [Google Scholar] [CrossRef]
  25. Senff, L.; Labrincha, J.A.; Ferreira, V.M.; Hotza, D.; Repette, W.L. Effect of nano-silica on rheology and fresh properties of cement pastes and mortars. Constr. Build. Mater. 2009, 23, 2487–2491. [Google Scholar] [CrossRef]
  26. Li, G.; Lv, L.; Fan, H.; Ma, J.; Li, Y.; Wan, Y.; Zhao, X.S. Effect of the agglomeration of TiO2 nanoparticles on their photocatalytic performance in the aqueous phase. J. Colloid Interface Sci. 2010, 348, 342–347. [Google Scholar] [CrossRef] [PubMed]
  27. Nanostructured & Amorphous Materials, Inc. (NanoAmor). Available online: http://nanoamor.com (accessed on 9 February 2025).
  28. Schossler, R.T.; Ojo, S.; Jiang, Z.; Hu, J.; Yu, X. A novel interpretable machine learning model approach for the prediction of TiO2 photocatalytic degradation of air contaminants. Sci. Rep. 2024, 14, 13070. [Google Scholar] [CrossRef]
  29. Yu, X.; Drnevich, V.P. Soil Water Content and Dry Density by Time Domain Reflectometry. ASCE 2004, 130, 922–934. [Google Scholar] [CrossRef]
  30. Yu, X.; Drnevich, V.P. Density Compensation of TDR Calibration for Geotechnical Applications. J. ASTM Int. 2005, 2, 16. [Google Scholar] [CrossRef]
  31. Mills, A. An overview of the methylene blue ISO test for assessing the activities of photocatalytic films. Appl. Catal. B 2012, 128, 144–149. [Google Scholar] [CrossRef]
  32. Hamidi, F.; Aslani, F. TiO2-based photocatalytic cementitious composites: Materials, properties, influential parameters, and assessment techniques. Nanomaterials 2019, 9, 1444. [Google Scholar] [CrossRef] [PubMed]
  33. U.S. Environmental Protection Agency. Air Quality Guide for Nitrogen Dioxide; EPA-456/F-11-003; U.S. Environmental Protection Agency: Washington, DC, USA, 2011. Available online: https://document.airnow.gov/air-quality-guide-for-nitrogen-dioxide.pdf (accessed on 9 February 2025).
  34. Rochetto, U.L.; Tomaz, E. Degradation of volatile organic compounds in the gas phase by heterogeneous photocatalysis with titanium dioxide/ultraviolet light. J. Air Waste Manag. Assoc. 2015, 65, 810–817. [Google Scholar] [CrossRef] [PubMed]
  35. Dhada, I.; Nagar, P.K.; Sharma, M. Challenges of TiO2-based photooxidation of volatile organic compounds: Designing, coating, and regenerating catalyst. Ind. Eng. Chem. Res. 2015, 54, 5381–5387. [Google Scholar] [CrossRef]
  36. Jiang, Z.; Hu, J.; Zhang, X.; Zhao, Y.; Fan, X.; Zhong, S.; Zhang, H.; Yu, X. A generalized predictive model for TiO2–Catalyzed photo-degradation rate constants of water contaminants through artificial neural network. Environ. Res. 2020, 187, 109697. [Google Scholar] [CrossRef] [PubMed]
Figure 1. TDR signals of cement mortars at. (a) 1 min; (b) 61 min; (c) 121 min; (d) 200 min; (e) 355 min; (f) 751 min. (The horizonal axis is the No. of sampling data points, which can be converted to represent the scaled distance or the distance EM wave travels; the vertical axis is the normalized amplitude of signal).
Catalysts 15 00249 g001
Figure 2. SEM images and chemical components of nano-TiO2 modified concrete.
Catalysts 15 00249 g002
Figure 3. Compressive strength of the nano-TiO2 mortar and plain mortar at different stages of hydration.
Catalysts 15 00249 g003
Figure 4. Splitting tensile strengths of the nano-TiO2 mortars and plain mortars at different hydration stages.
Catalysts 15 00249 g004
Figure 5. Abrasion percentages of the nano-TiO2 mortar and plain mortar at different hydration stages.
Catalysts 15 00249 g005
Figure 6. Methylene blue decomposition test with ×100 diluted solution (a) after dripping; (b) after 45 min; (c) after 3 h.
Catalysts 15 00249 g006
Figure 7. Methylene blue decomposition test with ×1000 diluted solution. (a): after dripping, (b): after 45 min, and (c) after 3 h.
Catalysts 15 00249 g007
Figure 8. Methylene blue decomposition test with ×100 diluted solutions on the ground mortars. (a): after dripping, (b): after one day, and (c): after two days.
Catalysts 15 00249 g008
Figure 9. The central cut planes in x–z plane with TiO2 coverage of 40 g/m2 under different wind speeds. (a) 1 m/s, (b) 2 m/s, (c) 5 m/s, and (d) 10 m/s. The white contour lines represent the boundaries where NO2 concentration equals 0.1 ppmv.
Catalysts 15 00249 g009
Figure 10. The NO2 concentration changes at z = 1.5 m along x axis under different wind speeds. (a) The cut line of the analyzed NO2 concentration, (b) Wind speed: 1 m/s, (c) Wind speed: 2 m/s, (d) Wind speed: 5 m/s, (e) Wind speed: 10 m/s.
Catalysts 15 00249 g010aCatalysts 15 00249 g010b
Figure 11. The geometry of the symmetric model.
Catalysts 15 00249 g011
Table 1. Technical information about the nano-TiO2 [27].
PurityAPSSSAColorMorphologyBulk DensityTrue Density
>99%30–40 nm30 m2 g−1whitespherical0.4 g cm−33.94 g cm−3
Table 2. Weight proportions of three mortars.
SpecimenWater (g)Cement (g)Sand (g)Nano-TiO2 (g)Water-Reducer (g)Total (g)
PM6513032000.39515.39
Ti 0.5651303200.650.52516.17
Ti 1651303201.30.65516.95
Table 3. The surface decomposition rate constant k of NO2 with different TiO2 coverages.
TiO2 Coverage (g/m2)Rate Constant k (m/s)UV Intensity (W/m2)Source
504.02 × 10−310 (corresponds to the sunlight UV intensity on partial cloudy days in the Middle Europe)[35]
54.02 × 10⁻⁴Extrapolate from [35]
108.04 × 10⁻⁴
201.61 × 10⁻³
403.22 × 10⁻³
1008.04 × 10−3
Disclaimer/Publisher’s Note: The statements, opinions and data contained in all publications are solely those of the individual author(s) and contributor(s) and not of MDPI and/or the editor(s). MDPI and/or the editor(s) disclaim responsibility for any injury to people or property resulting from any ideas, methods, instructions or products referred to in the content.

