Abstract
MnO2 catalysts are recognized as highly efficient materials for ozone decomposition at room temperature. However, the conventional preparation methods, such as the hydrothermal method, typically require critical conditions (100–200 °C for 6–48 h). Moreover, the prepared catalysts are almost powders, which makes them difficult to apply as monolithic catalysts. In this work, a simple pH-adjusted method was developed to in situ prepare MnO2 with different crystal phases (α, amorphous, and δ) under ambient conditions. XRD analysis revealed that decreasing the pH from 13 to 3 induced a gradual phase transformation from δ-MnO2 to amorphous MnO2, while the α-phase appeared at pH = 1.5. The combination of XPS and O2-TPD results shows that amorphous MnO2 exhibited the lowest average oxidation state (AOS) and highest oxygen vacancy concentration. The optimized amorphous MnO2 catalyst (Cat. 2) achieved the highest ozone removal efficiency of 98% with a high relative humidity of 90%. Furthermore, in situ DRIFTS experiments further demonstrated that the prepared Cat. 2 maintained minimal OH accumulation under humid conditions, confirming its excellent water resistance. Finally, the preparation method of amorphous MnO2 was effectively applied to cordierite honeycomb carrier (CHC). The a(amorphous)-MnO2/CHC catalyst module (100 mm × 100 mm × 20 mm) showed stable ozone removal efficiency of 60% during a 60 h evaluation in an air duct (O3: 400 ± 30 ppb, T: 25 ± 5 °C, gas velocity: 1 m s−1). This study innovatively developed a simple pH-adjusted method to prepare MnO2 with different crystal phases under ambient conditions and successfully applied it to the cordierite honeycomb carrier for monolithic catalyst development.
1. Introduction
Ozone (O3) plays a crucial role in the atmosphere [1], but in the troposphere, it poses significant threats to the environment and human health as a harmful gas [2,3,4]. High concentrations of ground-level ozone can inhibit plant photosynthesis, affect crop yields [5], and threaten the respiratory system [6] and cardiovascular health [7,8]. Ground-level ozone is typically formed through reactions between nitrogen oxides (NOX) and volatile organic compounds (VOCs) under sunlight [9]. In addition, certain indoor equipment, including high-voltage discharge devices and ultraviolet disinfection systems [10], can increase indoor ozone concentrations [11]. Therefore, designing efficient ozone removal technologies that can adapt to varying environmental conditions has emerged as a critical research focus for addressing ozone pollution.
Catalytic ozone decomposition has emerged as a favorable strategy for ozone removal due to its high efficiency and low energy consumption [12,13]. Although noble metals (e.g., Ag [14,15], Au [16], and Pd [17]) exhibit excellent catalytic performances, their widespread application is hindered by prohibitive costs and scarcity. Transition metal oxides (e.g., Co [18], Cu [19]) offer cost-effective alternatives, yet their activity under humid conditions remains suboptimal due to limited oxygen vacancy tunability. MnO2 exists in multiple polymorphs (α, β, γ, δ) with distinct [MnO6] octahedral arrangements (tunnel/layered structures), enabling the targeted optimization of active site accessibility [20,21,22]. Moreover, the mixed Mn3+/Mn4+ redox system facilitates the formation of oxygen vacancies [23].
It is worth noting that different crystal phases of MnO2 exhibited significant differences in catalytic ability. In particular, α, γ, and δ-MnO2 have attracted much attention due to their rich catalytic active sites. However, they are prone to deactivation in high humidity conditions [24,25,26]. Based on the mechanism of ozone decomposition [23,27], many efforts have been made to enhance oxygen vacancy content in well-crystallized MnOx catalysts to improve their ozone decomposition efficiency, such as metal-doping [28,29,30], modulation of crystal structure [24], and acid-treatment [31,32,33]. However, efforts have been limited in terms of studying the modulating effect of VO on structurally ordered and well-crystallized MnOx [34]. Amorphous MnOx prepared by a redox method exhibited higher catalytic activity of ozone decomposition than crystalline MnOx [35]. Due to the unsaturated coordination of surface atoms, amorphous MnOx possesses a higher density of defects, particularly oxygen vacancies. These defects provide abundant active sites for ozone catalytic reactions. For instance, Liu et al. [35] and Zhao et al. [36] obtained highly effective amorphous MnO2 with abundant surface oxygen vacancies by manipulating the ratio of precursors. Yu et al. [37] demonstrated that calcining can maintain the average oxidation state of amorphous manganese dioxide and improve its water resistance. However, most syntheses of amorphous manganese dioxide require relatively harsh conditions, such as long reaction times and extreme temperatures and pressure. In addition, the prepared MnOx catalysts are mostly powders, which makes it difficult to directly form monolithic catalysts, limiting their use in actual large-area applications. It is of great significance for catalyst scaling to realize the rapid preparation of catalysts under mild conditions. Monolithic catalysts, such as cordierite honeycomb carriers (CHC) [38,39], address the limitations of powder catalysts for practical applications. Their high geometric surface area and low pressure drop enable scalable deployment in air-purification systems. Compared to coated catalysts like ceramic fibers [40] and metal-based catalysts [41], CHC-supported MnO2 allows the in situ synthesis of active phases, ensuring strong adhesion and high ozone decomposition efficiency.
In this work, a series of MnO2 catalysts with different crystal phases (α, δ, and amorphous) were prepared by adjusting pH under ambient conditions. Firstly, XRD was employed to investigate the crystal phase transformation mechanism of MnO2 affected by pH adjustments. The morphology and pore structure of the catalysts were characterized by SEM and BET. Secondly, the average Mn oxidation states and oxygen vacancy concentrations of MnO2 with different crystalline phases were thoroughly investigated by XPS, H2-TPR, and O2-TPD. Then, the ozone decomposition performance of different MnO2 phases using the pH adjustment method was systematically evaluated under various humidity ranges (0–90%). In situ DRIFTS experiments were performed to further elucidate the differences in water resistance of the samples. Finally, the preparation method for amorphous MnO2 was applied to a cordierite honeycomb carrier (CHC), and samples of the a(amorphous)-MnO2/CHC monolithic catalyst were assembled in an air duct to evaluate its catalytic performance and durability.
2. Results and Discussion
2.1. The Formation Mechanism and Morphological Structure Characterization of the Different MnO2 Phase via pH Adjustment
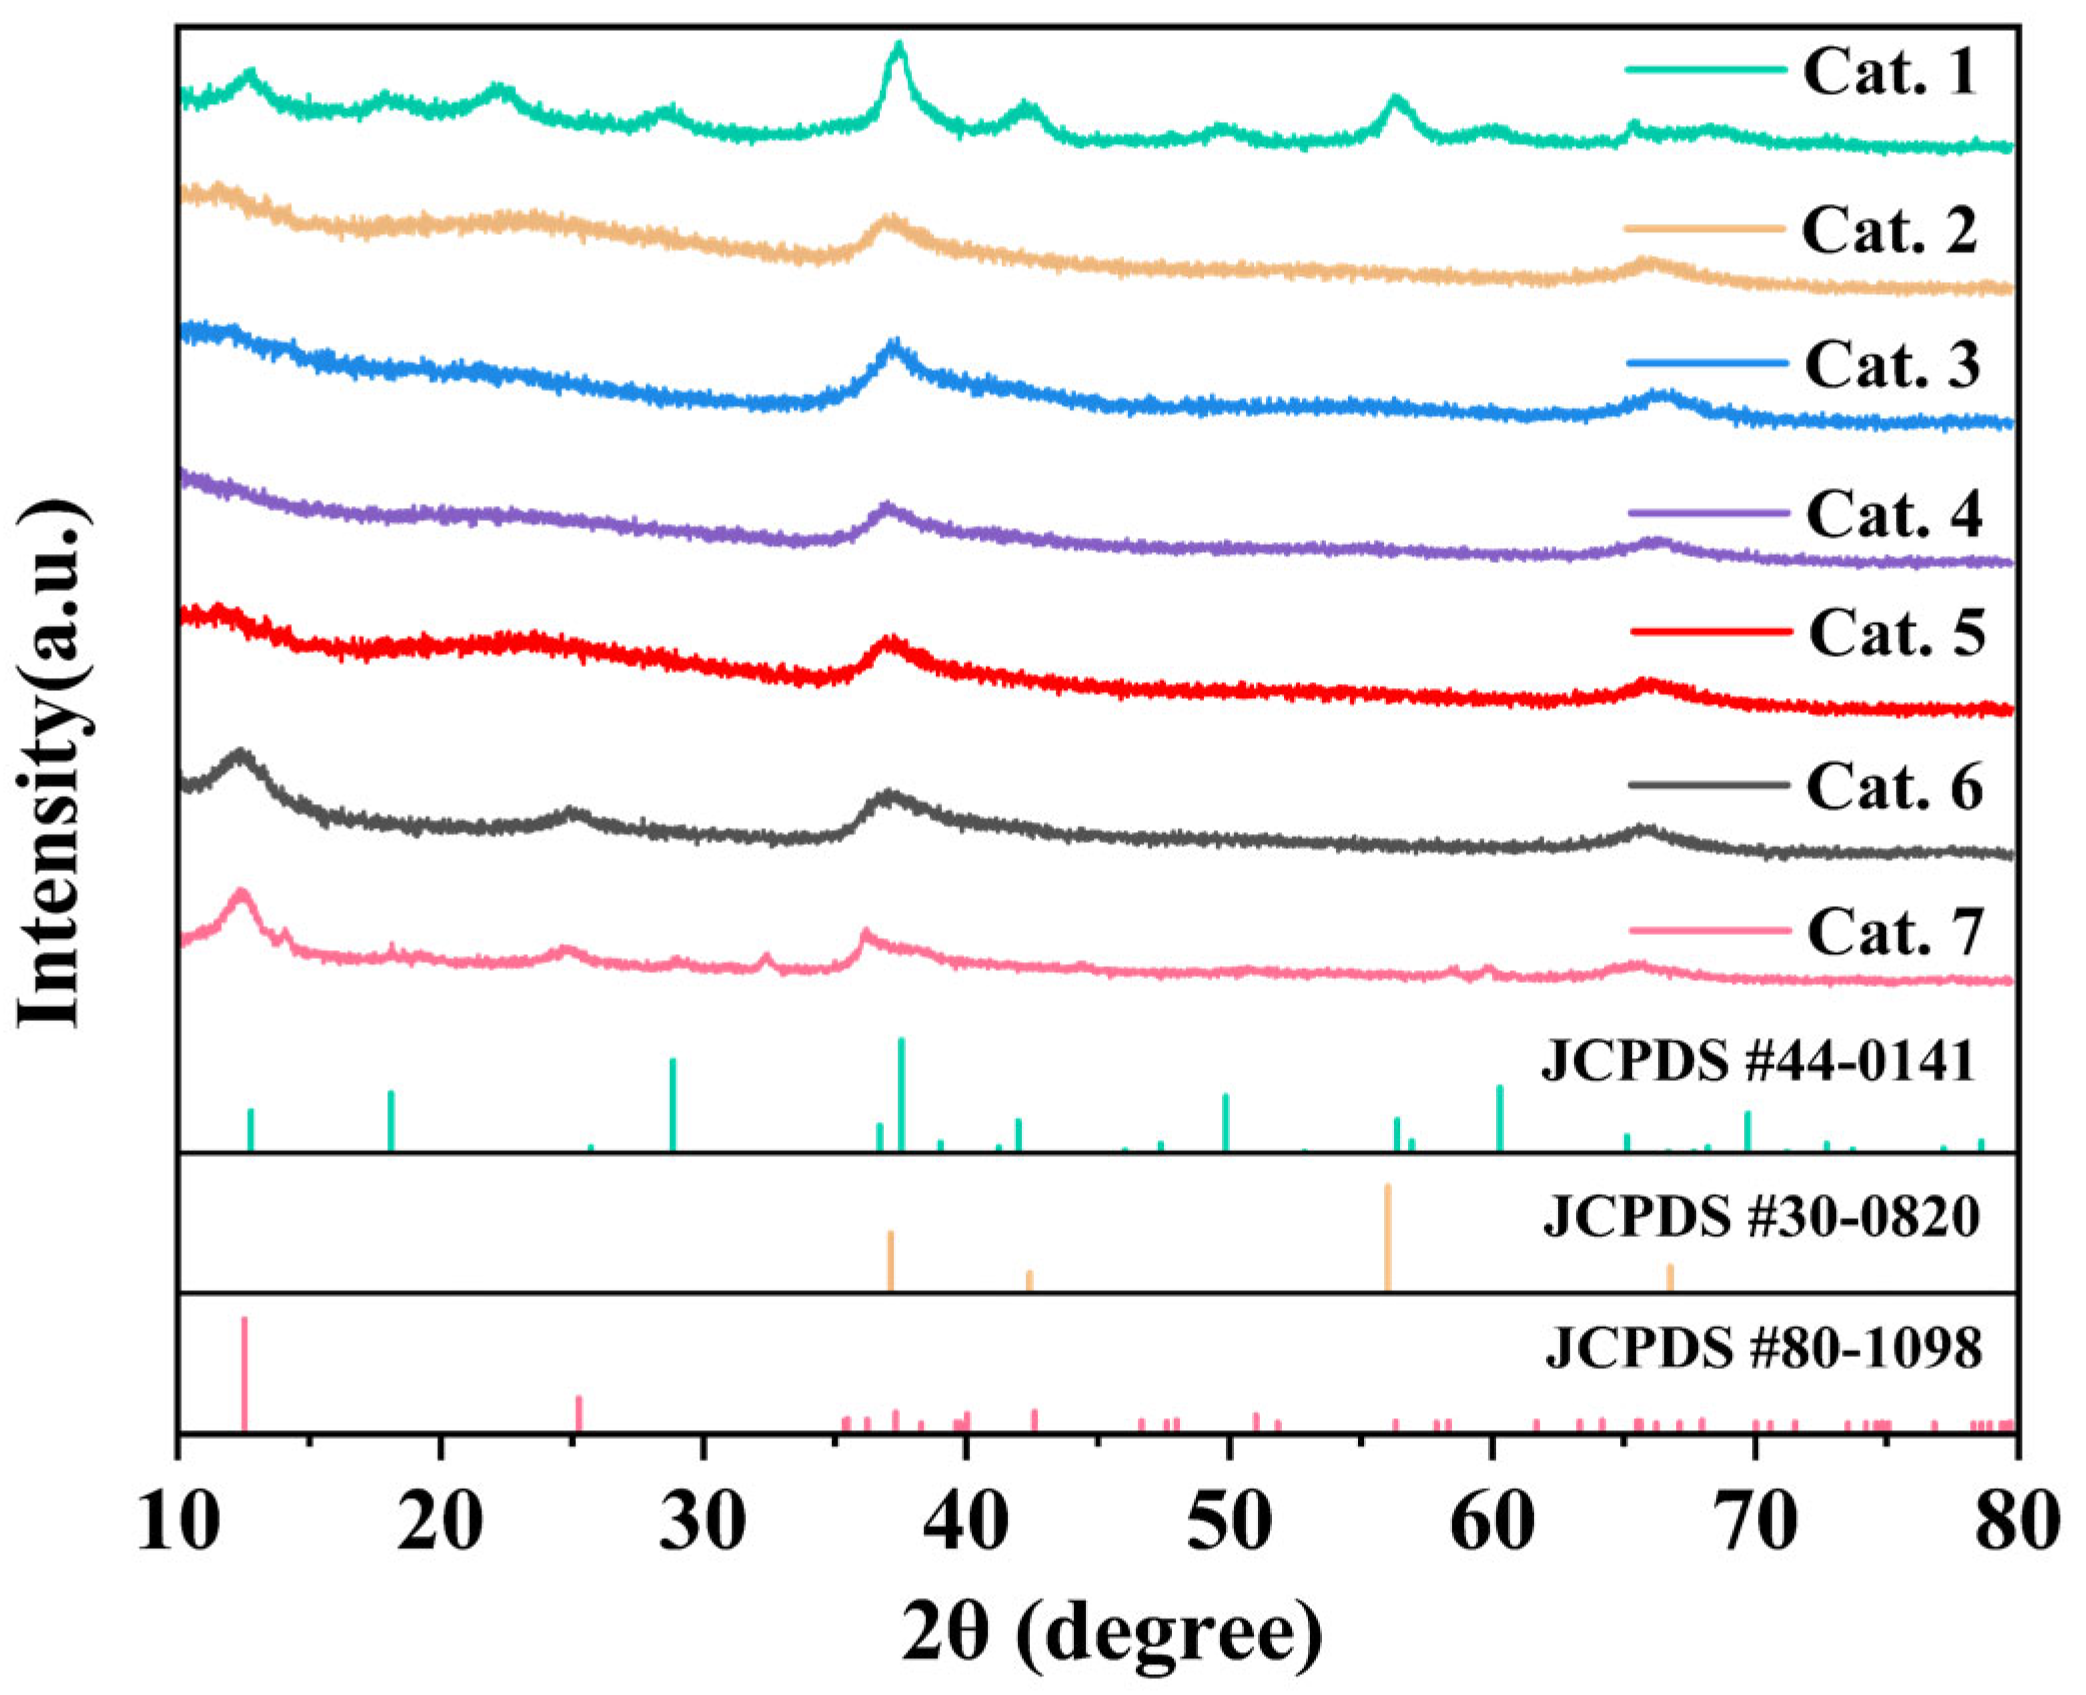
Figure 1 shows the crystal phases of MnO2 prepared at various pH values. The synthesis conditions of the experiments are summarized in Table 1. XRD analysis confirmed the successful formation of different phases, with the diffraction patterns matching the reference standards for α-MnO2 (JCPDS 44-0141), δ-MnO2 (JCPDS 80-1098), and ε-MnO2 (JCPDS 30-0820). Under acidic conditions (pH = 1.5), α-MnO2 was preferentially generated (Table 1). When the pH ranged from 3 to 9, amorphous MnO2 was formed. Further increasing the alkalinity (pH = 11 or 13) facilitated the formation of δ-MnO2.
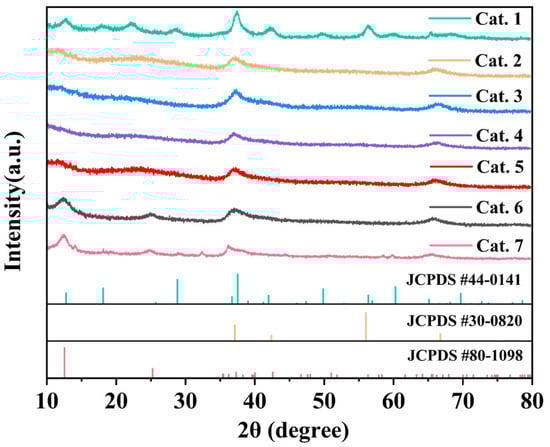
Figure 1.
XRD of MnO2 catalysts.

Table 1.
Overview of Synthesis Conditions of Experiments.
During the preparation of the MnO2 catalyst, KMnO2 was first premixed with KOH, making the overall solution alkaline. The pH of the mixed solution was adjusted by controlling the dropwise addition of MnSO4 solution to generate sulfuric acid. It has been reported that excess K+ can stabilize the layered structure of MnO2 [42]. In addition, the K+ adsorbed in the layered manganese dioxide can be replaced by H+ with a smaller radius [43]. As the amount of K+ decreased, the layered structure became damaged. An excess of H+ in MnO2 can facilitate the formation of the tunnel structure of α-MnO2 [44].
A formation mechanism for the different phases of MnO2 through pH adjustment was proposed based on the XRD results and previous reports [42,43,44] (Figure 2). In the initial stage of MnSO4 addition, the mixed solution contained excess KMnO4, and the K+-rich environment facilitated the formation of MnO2 with a layered structure. Consequently, δ-MnO2 first emerged at the pH values of 13 and 11. As MnSO4 continued to be added, the generated H+ replaced the K+ originally present in the layered structure, leading to the collapse of the layered structure. The crystalline form of MnO2 was then transformed into amorphous MnO2 (pH = 9, 7, 5, and 3). With a continued increase in H+ concentration, the solution exhibited strong acidity (pH = 1.5). Excess H+ promoted the arrangement of the [MnO6] octahedra into a tunnel structure, leading to the formation of α-MnO2.
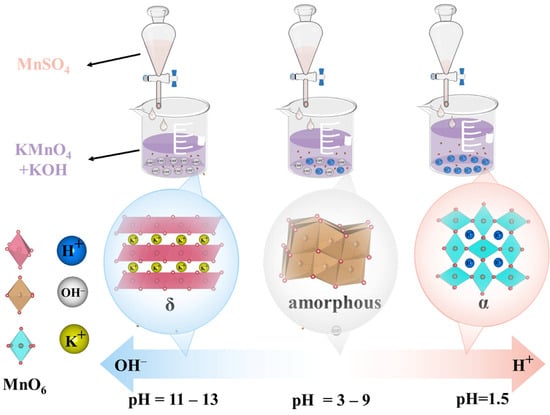
Figure 2.
The formation mechanism diagram of different MnO2 crystal structures via pH adjustment.
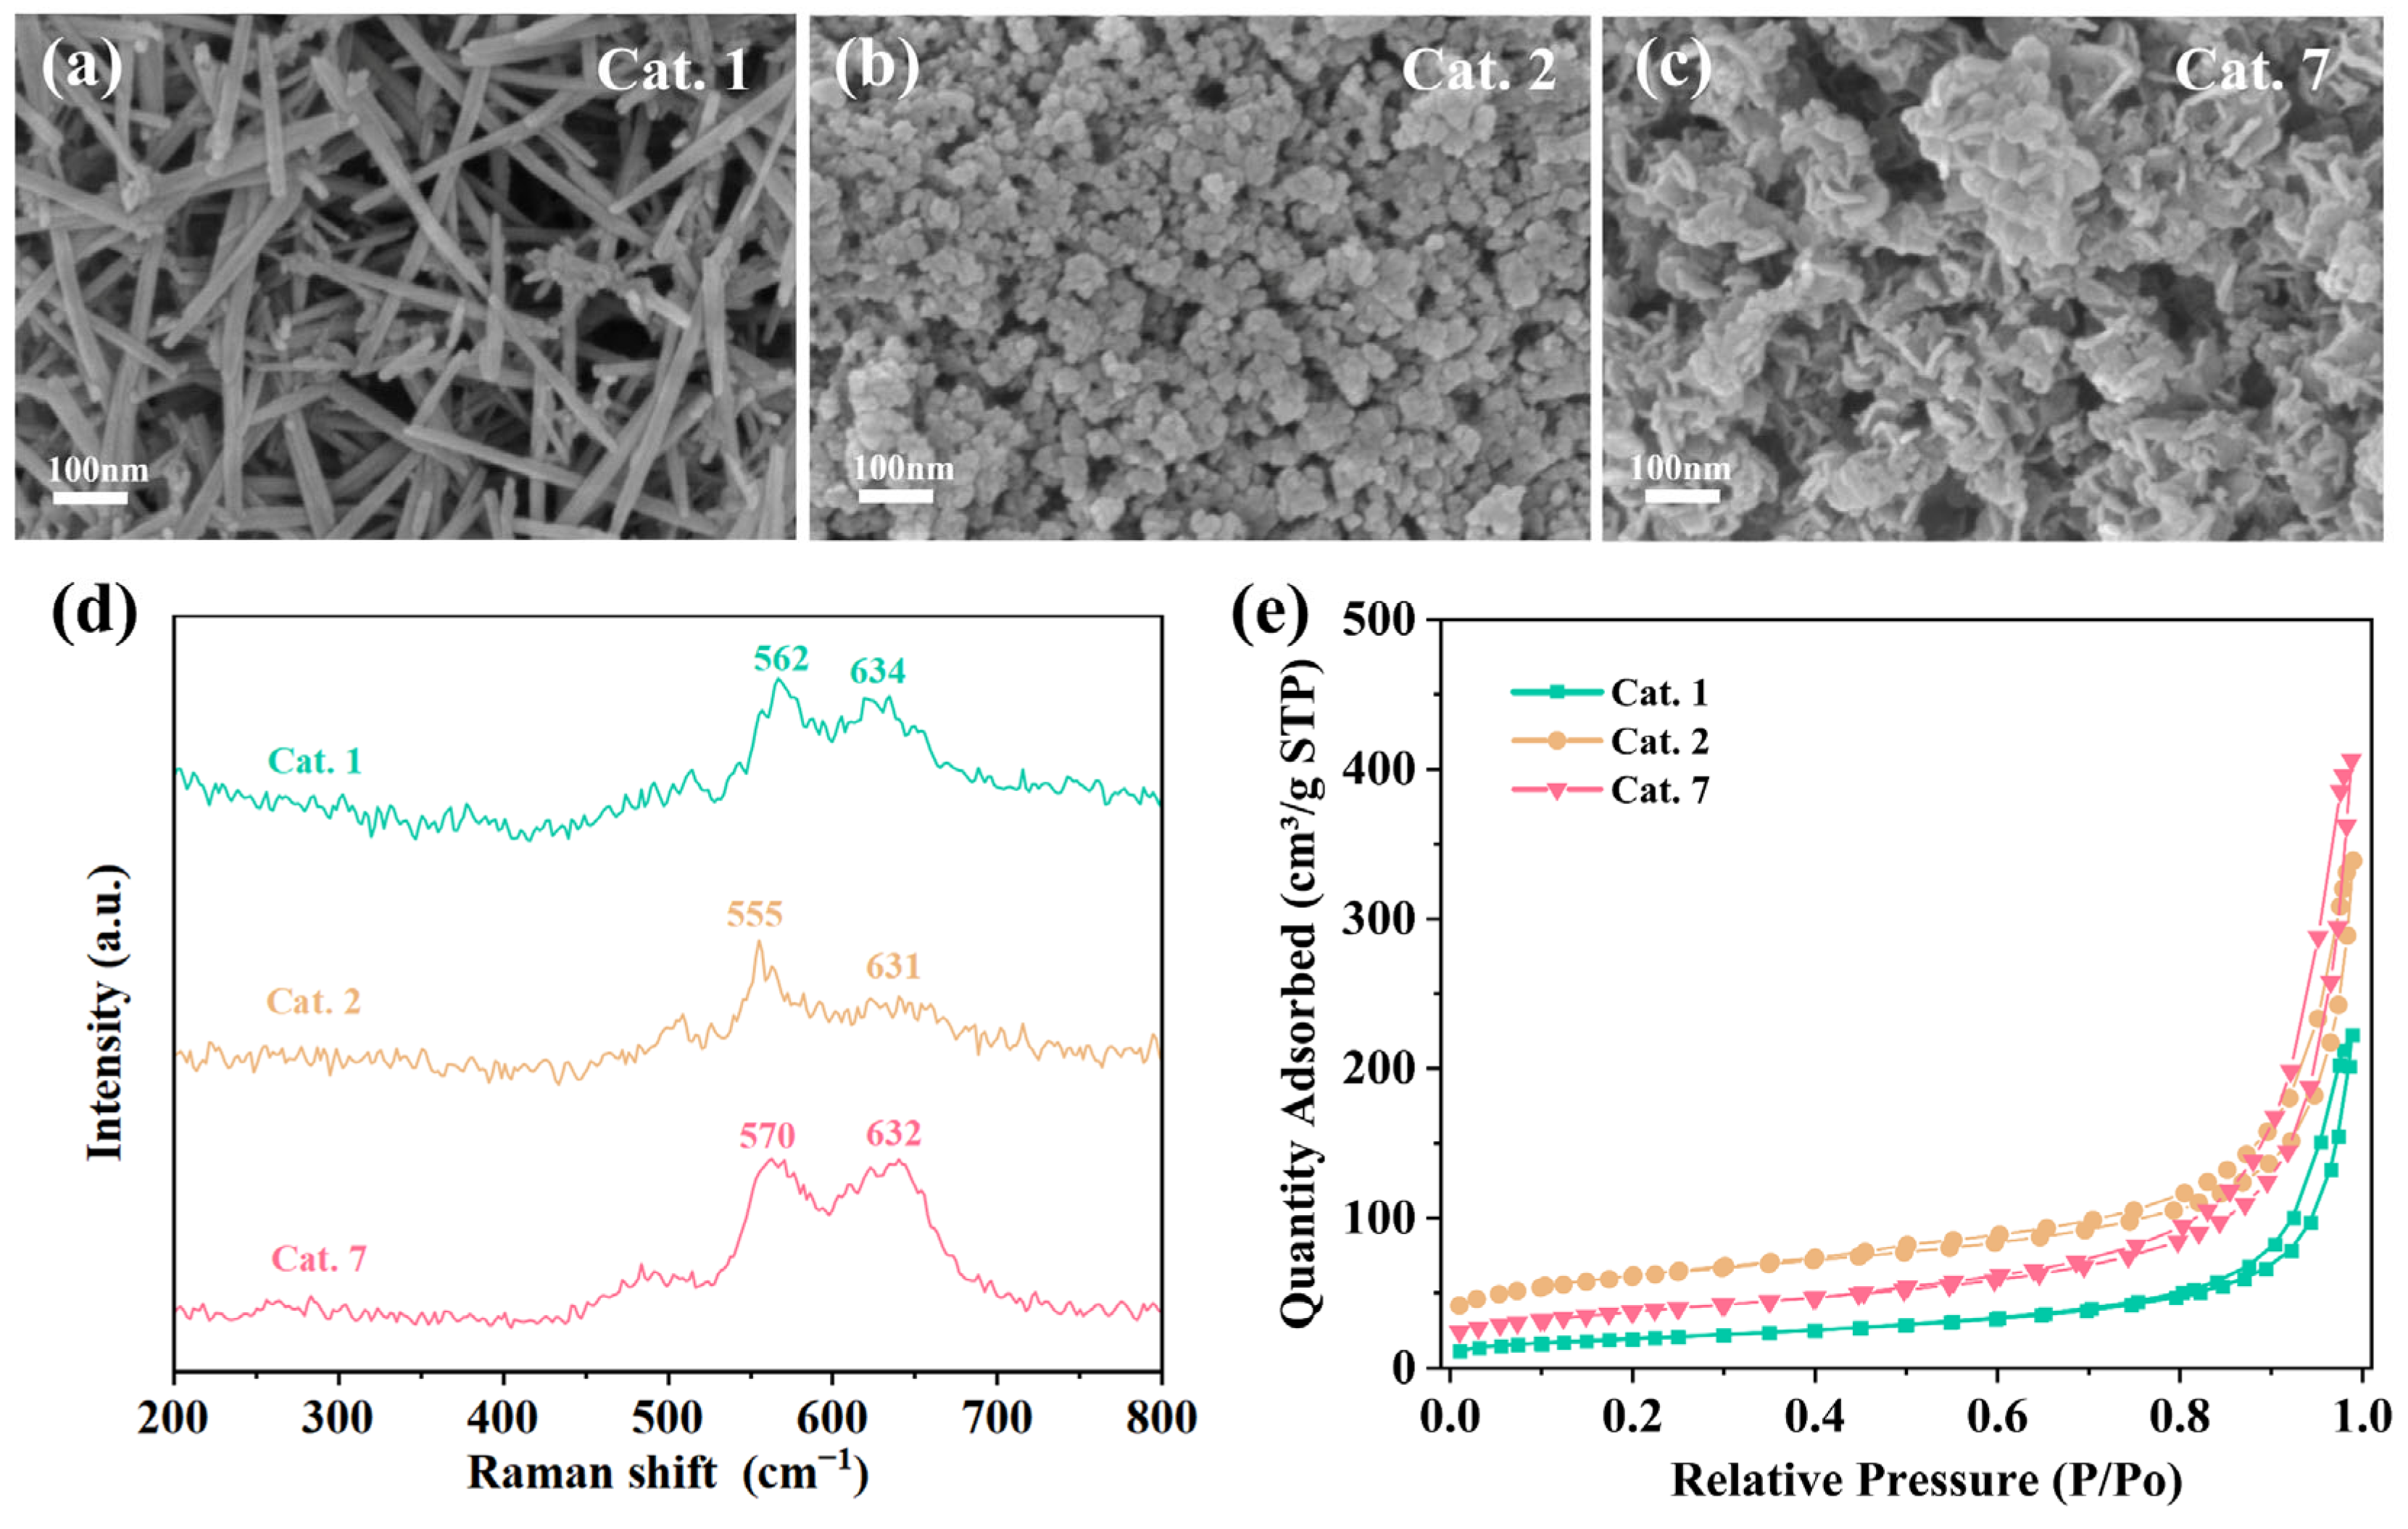
To further understand the morphological and structural differences between the different MnO2 crystal phases, characterization tests were conducted on representative α-phase MnO2 (Cat. 1), amorphous MnO2 (Cat. 2), and δ-phase MnO2 (Cat. 7). The morphologies of the catalysts were analyzed by FESEM, and the images are shown in Figure 3a–c. Cat. 1 displayed a disordered accumulation of nanorods with a diameter of 10–20 nm and lengths ranging from 200 nm to 500 nm. Conversely, compared to Cat. 7, which showed stacked nanosheets, Cat. 2 exhibited a more dispersed nanosphere morphology with lower crystallinity.
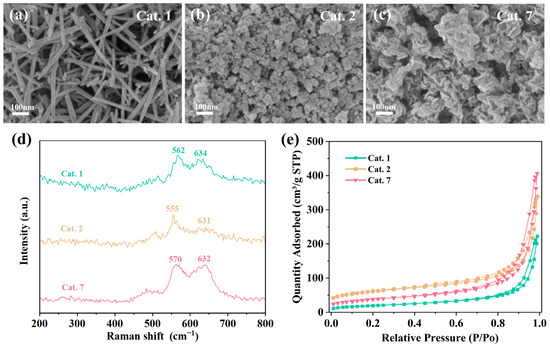
Figure 3.
Preparation routes of different MnO2 crystal structures; Scanning electron microscope (SEM) images of (a) Cat. 1, (b) Cat. 2, (c) Cat. 7; (d) Raman spectra; (e) N2 adsorption–desorption isotherms of the samples.
The structure of the samples was analyzed by Raman scattering spectroscopy to further investigate the structural properties of the different MnO2 phases (Figure 3d). The Raman peaks around 630 cm−1 and 560–570 cm−1 are attributed to the asymmetric and symmetric stretching vibrations of the [MnO6] octahedral framework, respectively [45]. It was found that the Raman peaks of Cat. 2 shifted to lower frequencies. The weaker peak intensities indicate lower Mn-O bond strength, which can enhance the surface lattice oxygen activity and favor the formation of oxygen vacancies (VO).
All samples displayed typical mesoporous structures with type IV isotherms and H3 hysteresis loops (Figure 3e). Among them, the Cat. 1 with the best crystallinity exhibited the smallest specific surface area of 68.8 m2·g−1. The Cat. 7 and Cat. 2 with relatively poor crystallinity had specific surface areas of 133.6 m2·g−1 and 215.6 m2·g−1, respectively. The specific surface area of Cat. 2 was much higher than that of the other samples, which facilitates the exposure of more adsorption and active sites. For Mn-based catalysts, the competitive adsorption of water molecules and ozone molecules at active sites is usually considered the main reason for deactivation under high humidity conditions. On the other hand, Cat. 2 and Cat. 7 exhibited larger average pore volumes compared to Cat. 1 (Table 2). This can effectively inhibit the condensation of water vapor, thus avoiding competition with O3 for adsorption.
Table 2.
Specific surface area, pore volume, and average pore size of the samples.
2.2. Surface Oxidation State and Oxygen Vacancies of the Different MnO2 Phases
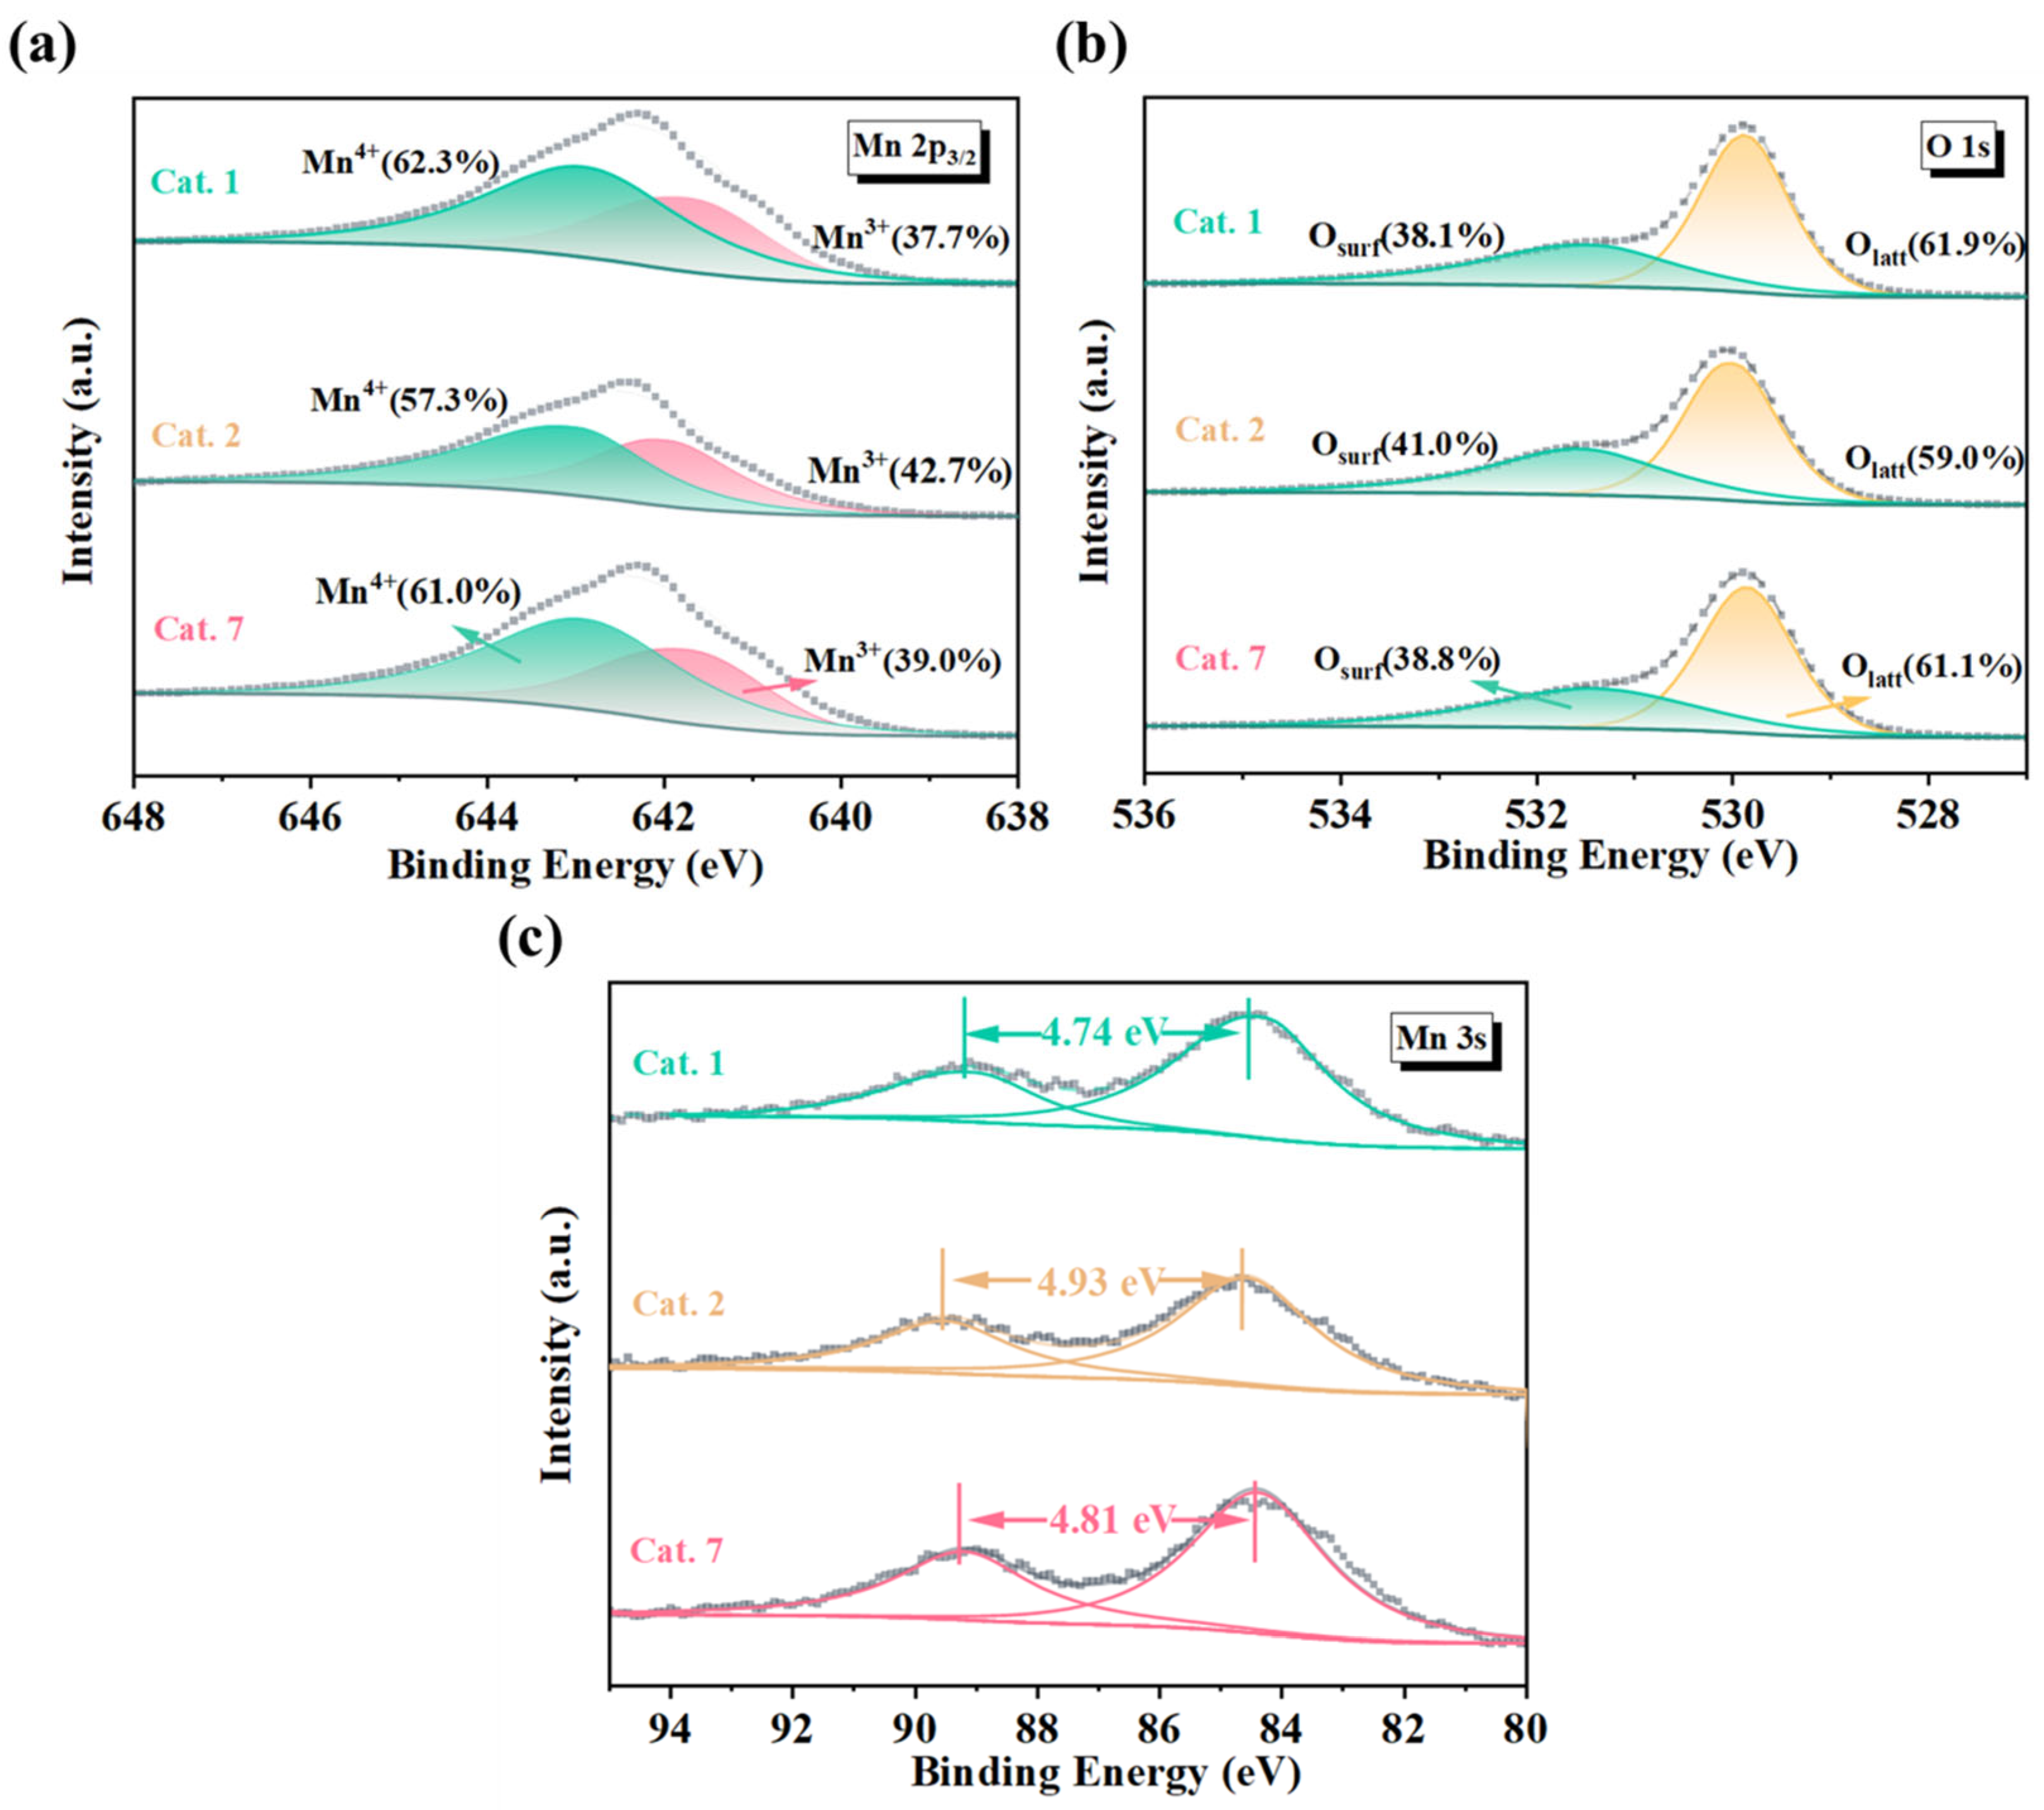
XPS spectra of the catalysts were analyzed to further investigate the composition and oxidation states of the surface atoms. As shown in Figure 4a, the Mn 2p3/2 peaks of the catalyst were observed at 641.9 eV and 642.9 eV, which correspond to Mn3+ and Mn4+ in MnO2, respectively. Compared to well-crystallized Cat. 1 and Cat. 7, amorphous Cat. 2 exhibited a higher Mn3+ content (42.7%) (Table 3). This means that Cat. 2 requires more oxygen vacancies to maintain charge balance, indirectly supporting the hypothesis of a higher oxygen vacancy concentration. Figure 4b shows the Mn 3s spectrum and the average oxidation state (AOS) of the sample can be calculated using Equation (1):
where ΔES represents the binding energy difference between the two Mn 3s peaks. The analysis results are summarized in Table 3. According to the calculated results, the average oxidation states of MnO2 with different crystal structures are as follows: Cat. 2 (3.40) < Cat. 7 (3.54) < Cat. 1 (3.62). Cat. 2 exhibited the lowest average oxidation state, which was consistent with the analysis of the Mn 2p2/3 spectra. Furthermore, the O 1s spectrum of the samples can be deconvoluted into two peaks centered at binding energies of 529.8 eV and 531.6 eV, which can be assigned to lattice oxygen (Olatt) and surface oxygen (Osurf), respectively (Figure 4c). The results indicated that the surface oxygen content (Osurf) of Cat. 2 (41.0%) exceeded that of Cat. 1 (38.1%) and Cat. 7 (38.8%). This implies that Cat. 2 contains more oxygen vacancies (VO), consistent with the previous analysis.
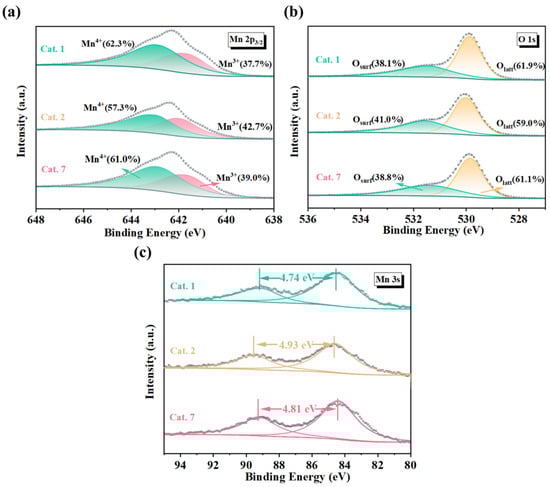
Figure 4.
(a) Mn 2p, (b) Mn 3s, and (c) O 1s X-ray photoelectron spectra (XPS) of MnO2 samples. AOS: the average oxidation state of Mn; ΔE: the binding energy difference between two Mn 3s peaks. Osurf: lattice oxygen; Olatt: adsorbed oxygen species.
Table 3.
XPS results of surface Mn and O elements.
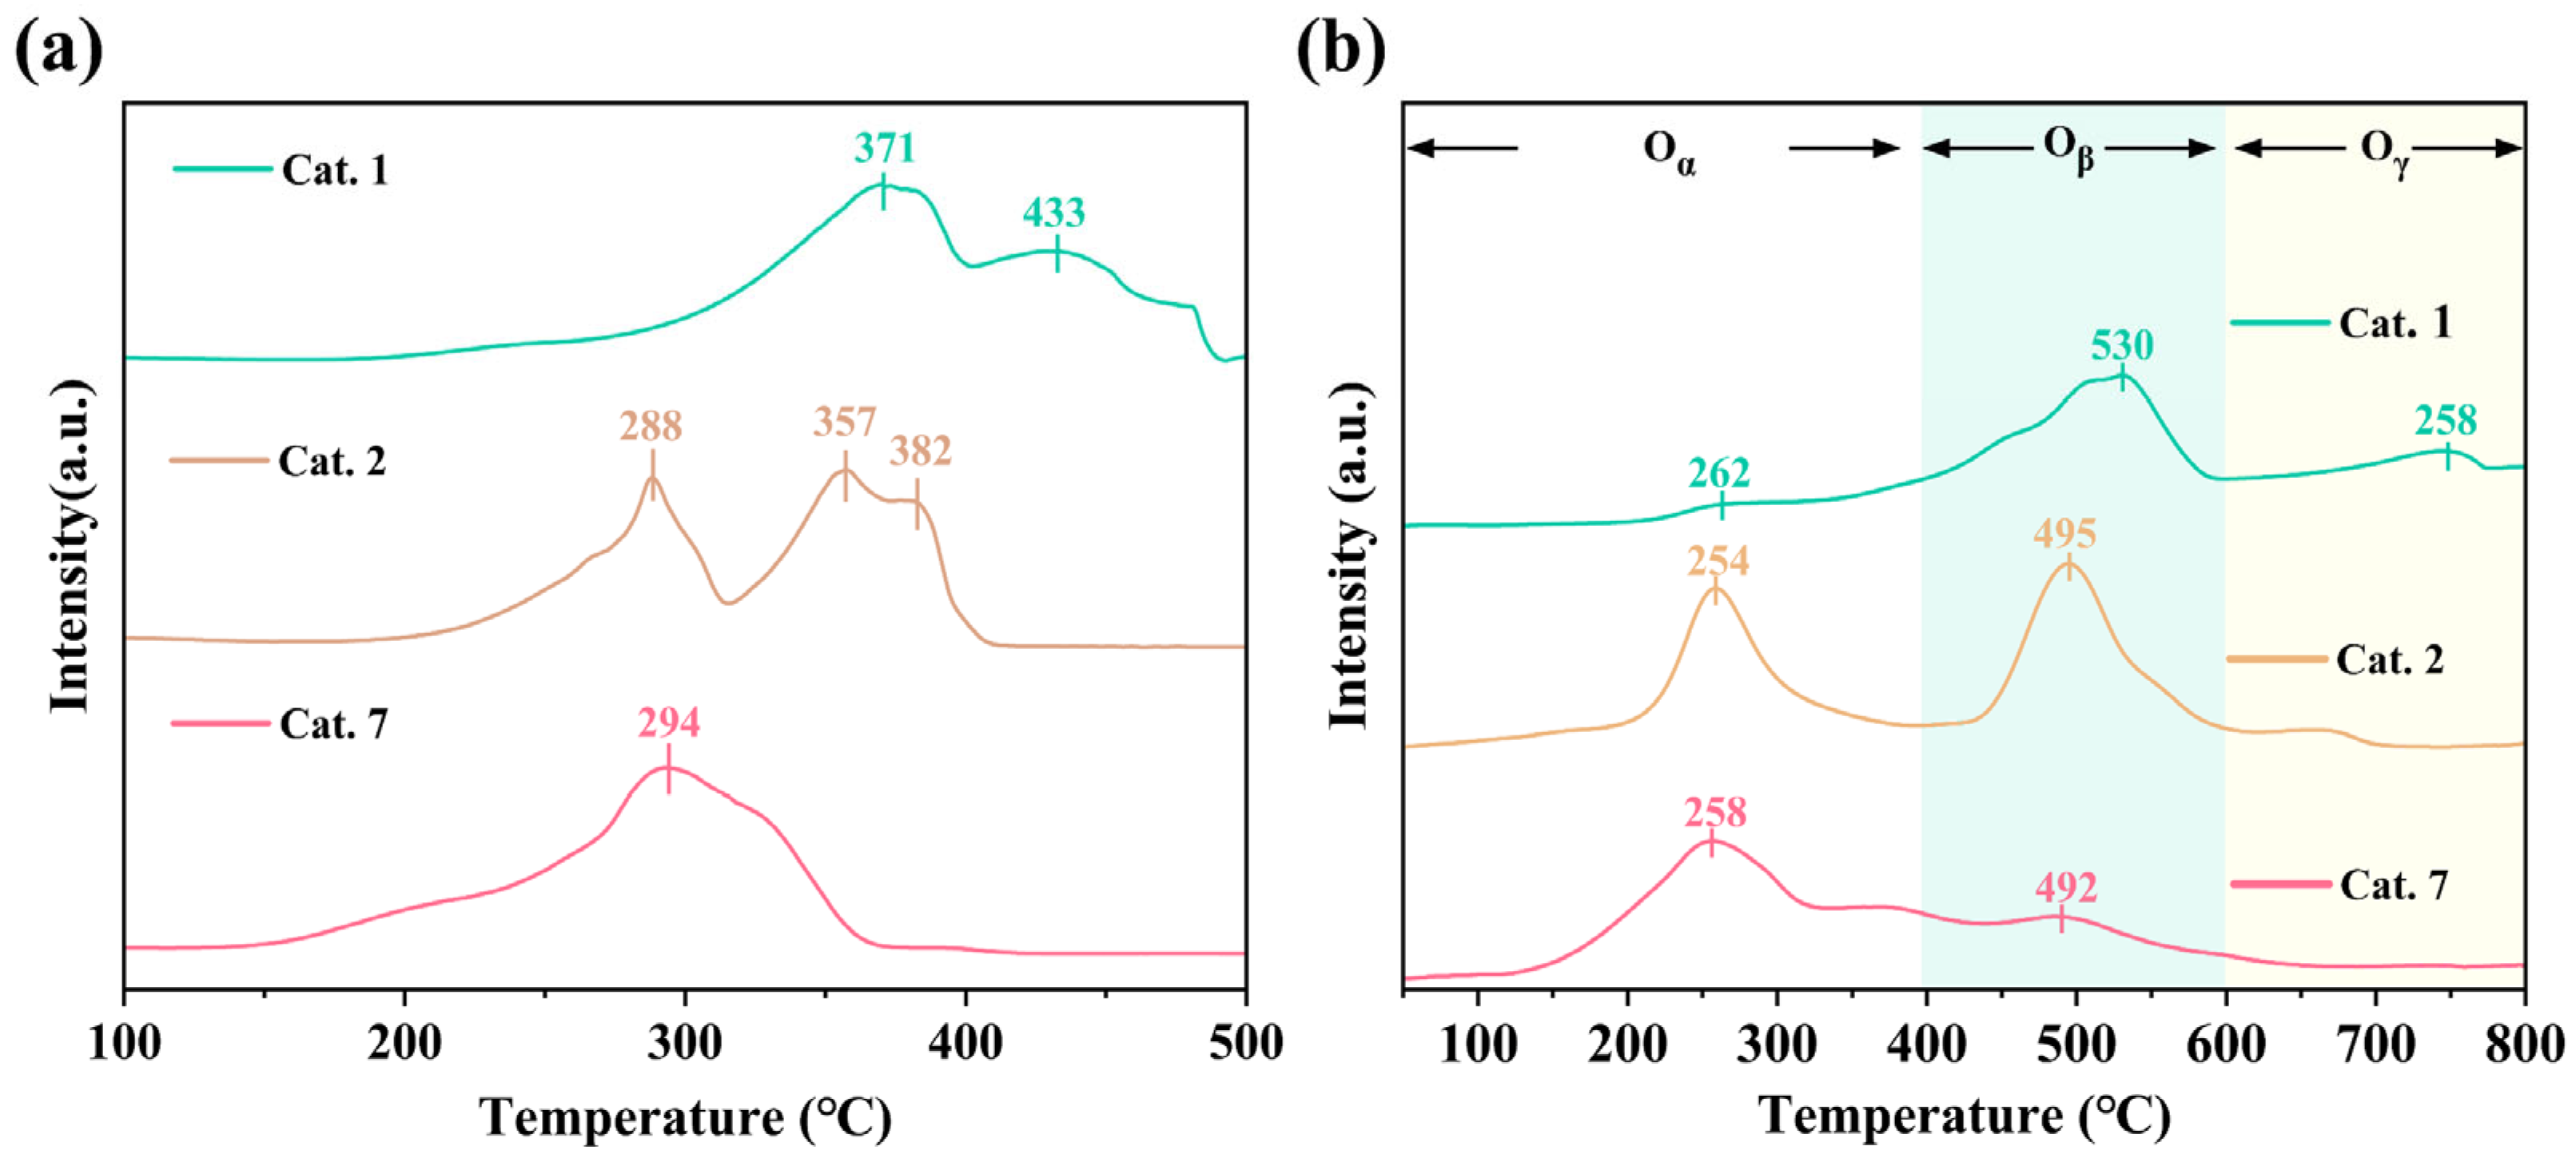
Surface-adsorbed oxygen species are generally associated with oxygen vacancies and catalytic oxidation performance [46,47]. The reducibility of the MnO2 samples was investigated using H2-TPR (Figure 5a). The observed reduction peaks are primarily involved in different reduction pathways that result in the transformation of MnO2 to MnO. In the reduction process, intermediate substances such as Mn2O3 and Mn3O4 may be produced, which affects the reaction path. As shown in Figure 5a, the lower onset reduction temperatures of Cat. 2 (288 °C) and Cat. 7 (294 °C), compared to that of Cat. 1 (371 °C), indicating the enhanced reducibility of the amorphous and δ-phase catalysts, which aligns with the higher oxygen vacancy concentrations revealed by XPS. In the typical ozone reduction mechanism (Equations (2)–(4)) [27], oxygen species desorption is the rate-limiting step in O3 decomposition, which corresponds to the catalyst reduction process.
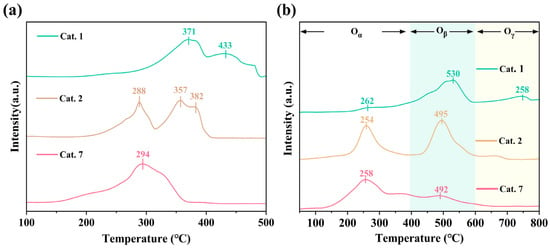
Figure 5.
The (a) H2-TPR and (b) the O2-TPD images of samples.
The lower reduction temperatures of Cat. 2 and Cat. 7 implies weaker Mn–O bonding, thereby accelerating the desorption and enhancing the catalytic turnover. Additionally, Cat. 2 consumed more hydrogen (393.3 μmol g−1) than Cat. 7 (325.5 μmol g−1), indicating a higher content of active oxygen species.
The O2-TPD spectrum signal (Figure 5b) can be divided into three parts: active oxygen species (<300 °C), subsurface lattice oxygen (300–600 °C), and bulk lattice oxygen (>600 °C) [48]. The surface active oxygen content of Cat. 2 and Cat. 7 is significantly higher than that of Cat. 1, indicating that they have superior oxygen storage capacities. Meanwhile, Cat. 2 has the lowest desorption temperature (254 °C), and a lower desorption temperature usually means that it is easier to recover the occupied VO. Cat. 2 has the largest desorption peak area of subsurface lattice oxygen (400–600 °C), indicating that the surface lattice oxygen finds it easier to escape from the framework. The lattice oxygen mobility was enhanced, enhancing the likelihood of the formation of oxygen vacancies. The H2-TPR and O2-TPD results indicated that Cat. 2 possesses a higher oxygen vacancy content and superior oxygen mobility, which is consistent with the Raman and XPS results.
2.3. The Behavior of Different MnO2 Phases for O3 Decomposition Under Various Conditions
To better understand the differences in ozone decomposition capabilities of different crystal phases (α, amorphous, δ) MnO2 at room temperature, the ozone decomposition performance of the samples was evaluated under relative humidity (RH) conditions of 0%, 50%, and 70% (Figure 6a–c) and a weight hourly space velocity (WHSV) of 600,000 mL g−1 h−1. All MnO2 catalysts achieved 100% ozone conversion after continuous testing for 6 h under dry conditions (Figure 6a). In contrast, the ozone conversion rates of Cat. 1 and Cat. 7 decreased to 29% and 87% when the relative humidity increased to 50%, respectively, while Cat. 2 maintained high activity (≈100%) (Figure 6b). When the relative humidity increased to 70%, Cat. 2 still maintained over 98% catalytic activity, which is much higher than the catalytic performance of Cat. 1 (27%) and Cat. 7 (42%) (Figure 6c).
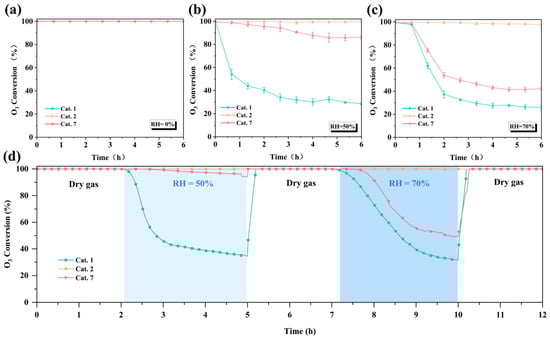
Figure 6.
The performance of different catalysts for ozone decomposition under (a) dry, (b) RH = 50%, and (c) RH = 70% conditions for 6 h, (d) ozone decomposition performance in alternating humid and dry conditions (O3: 40 ppm, T: 25 °C, WHSV: 600,000 mL g−1·h−1).
Water molecules compete with ozone for catalytic active sites, resulting in large differences in the activity [49]. To address this, humidity gradient and cycling tests were conducted (Figure 6d). The activities of Cat. 1 and Cat. 7 decreased quickly in the humid state (RH = 50%, 70%) but recovered after a 15 min dry gas purging. The results show that the occupation of active sites by water molecules is the main factor for the deactivation of the catalysts, and the dry gas purging removes the surface water molecules, enabling the activity of the catalysts to recover. However, Cat. 2 maintained high activity (100%) throughout the entire process, which implied that on the surface of Cat. 2, water molecules exhibited a significantly smaller competitive ability against ozone for the catalytic active sites.
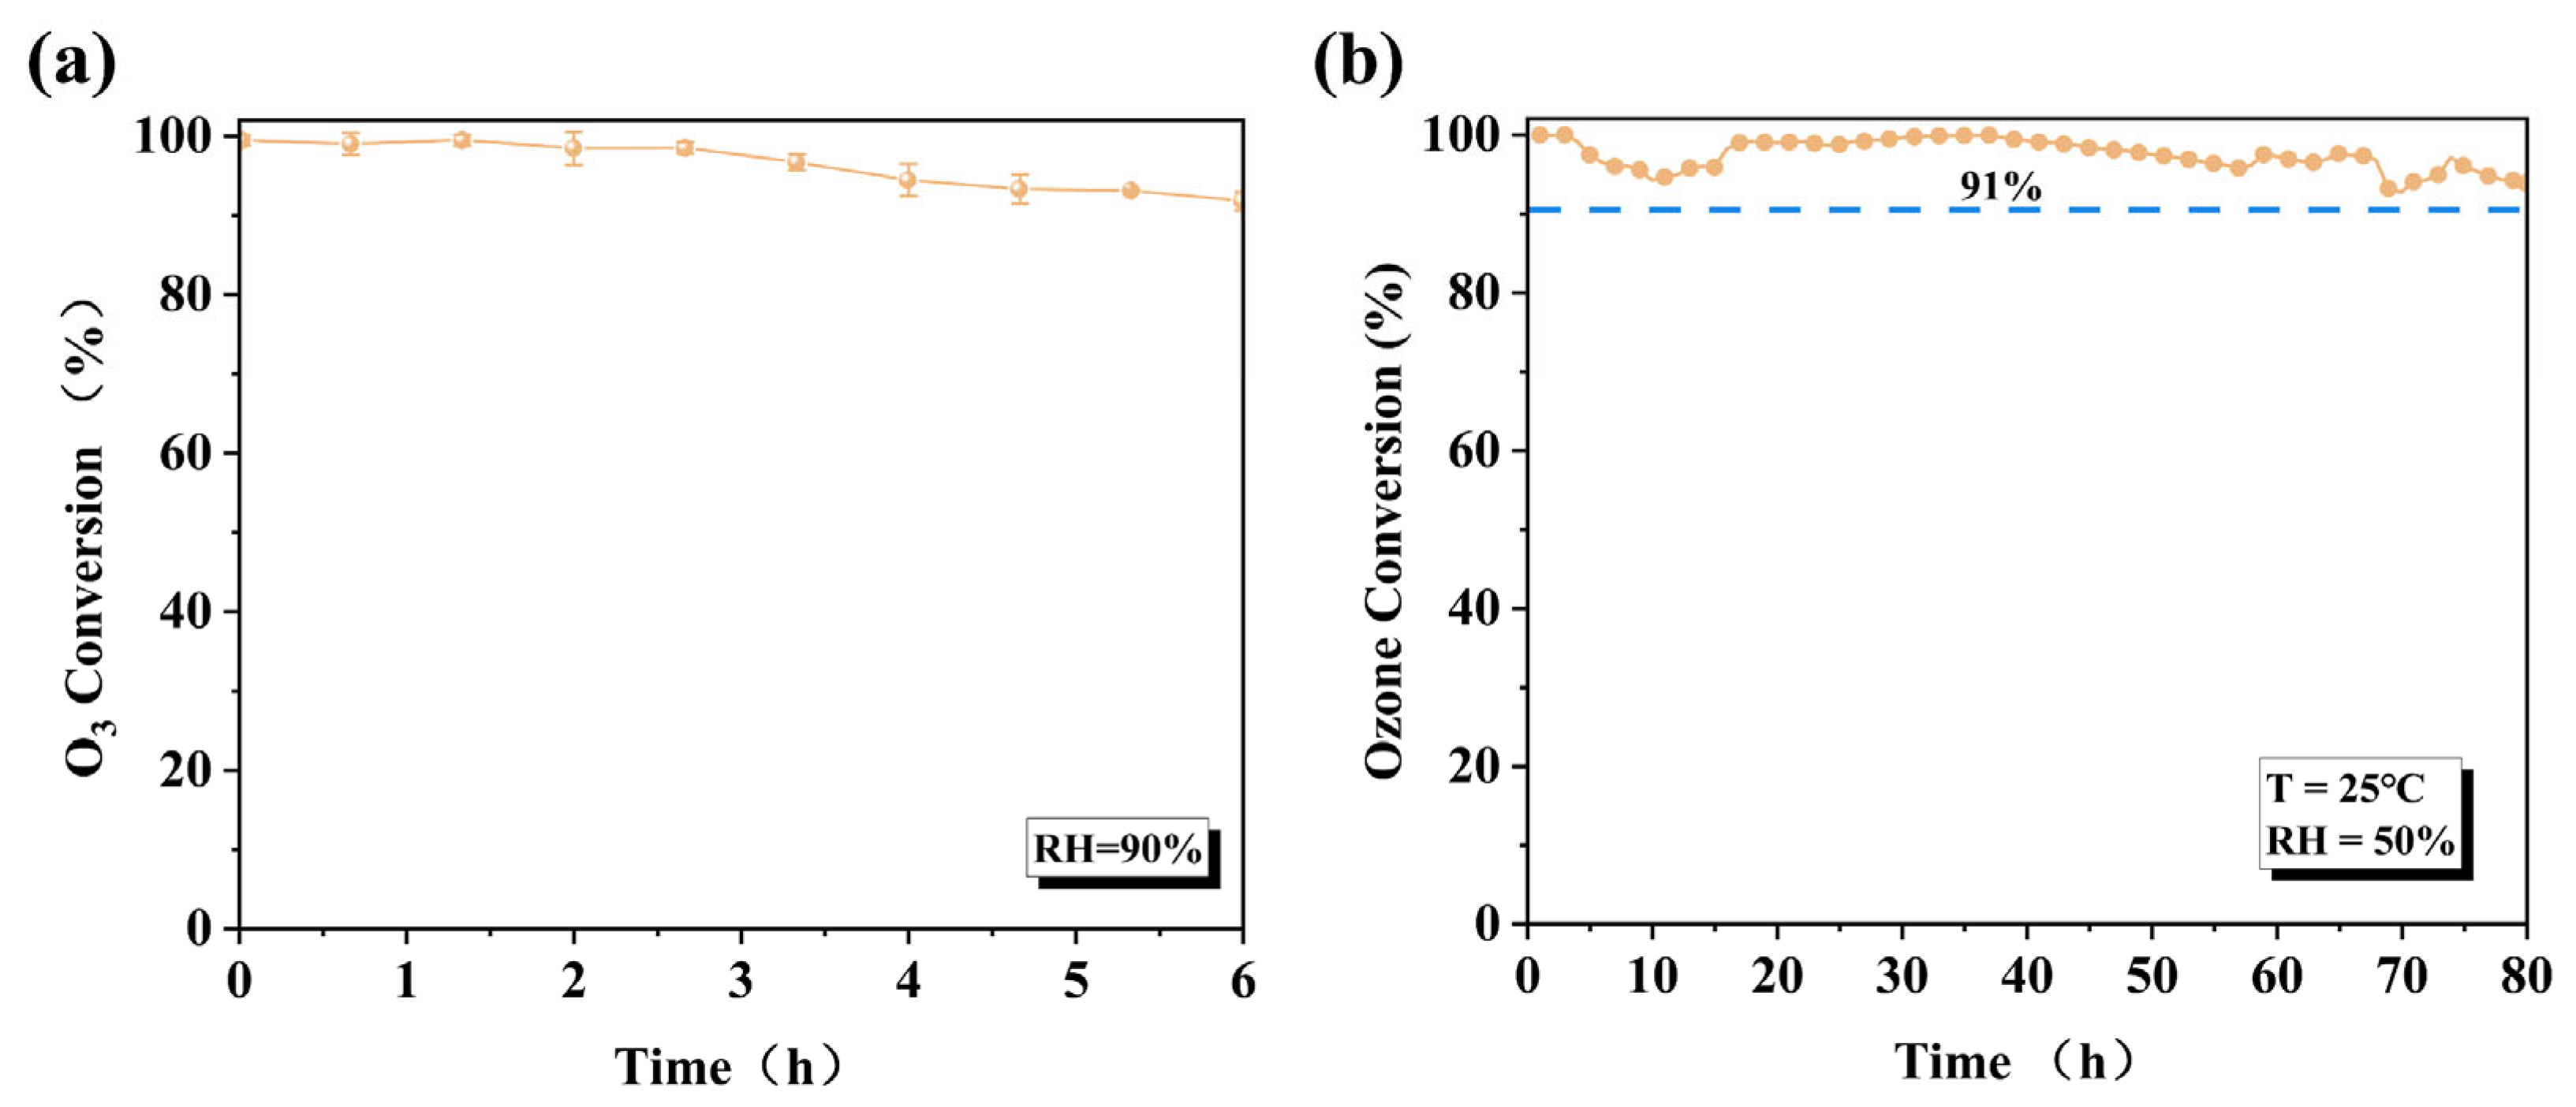
Furthermore, even under more stringent conditions (RH = 90%), the amorphous Cat. 2 maintained 92% catalytic activity after 6 h of continuous testing (Figure 7a), which further demonstrates its weak competitive adsorption capacity for water molecules on its surface. With the equilibrium constant being extremely large, ozone should theoretically decompose completely (Xeq ≈ 100%). The calculation process is described in the Supporting Materials. Subsequently, to simulate actual domestic conditions, long-term stability tests were performed on the Cat. 2 catalyst (Figure 7b). Under conventional conditions (RH = 50%, T = 25 °C, WHSV = 600,000 mL g−1 h−1), the ozone removal rate remained 91% after 80 h of continuous testing. The catalytic performance of Cat. 2 surpasses that of most previously reported catalysts (Table S2).
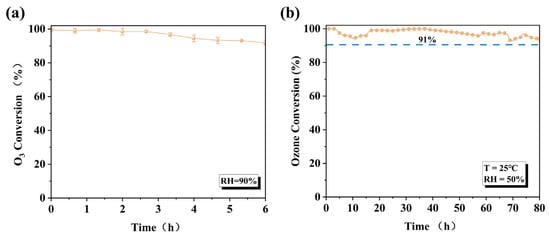
Figure 7.
(a) Ozone decomposition efficiency of Cat. 2 under RH = 90% conditions for 6 h; (b) durability test in fixed-bed reactor under RH = 50% (O3: 40 ppm, T: 25 °C, WHSV: 600,000 mL g−1·h−1).
Overall, the experimental results demonstrated that the prepared Cat. 2 catalyst exhibited strong water resistance and high catalytic performance across the entire humidity range, along with excellent long-term stability. The outstanding performance of Cat. 2 in ozone decomposition can be ascribed to its superior reducibility, large specific surface area, and abundant oxygen vacancies, as illustrated in Section 2.1 and Section 2.2.
2.4. The Variation of OH Revealed by In Situ Drifts
Under various relative humidity conditions, Cat. 2 maintains superior activity over Cat. 1 and Cat. 7. To elucidate the evolution of surface-bound water molecules during the reaction, in situ DRIFTS experiments were conducted to monitor the changes in the surface hydroxyl groups. The in situ spectra of Cat. 1, Cat. 2, and Cat. 7 under dry ozone conditions are shown in Figure 8. The hydroxyl peak was observed in the 3000–3600 cm−1 region. In the dry gas state, the increasing negative peak of hydroxyl absorbance in Cat. 2 indicated a gradual consumption of surface hydroxyl groups during the reaction. Studies have suggested that the surface hydroxyl groups of MnO2 may react with ozone to form relatively stable oxygen species, such as HO2 or water molecules (O3 + OH → H2O) [50,51]. However, the peak intensity of surface hydroxyl groups in Cat. 1 and Cat. 7 remained relatively stable, indicating that surface water was difficult to remove.
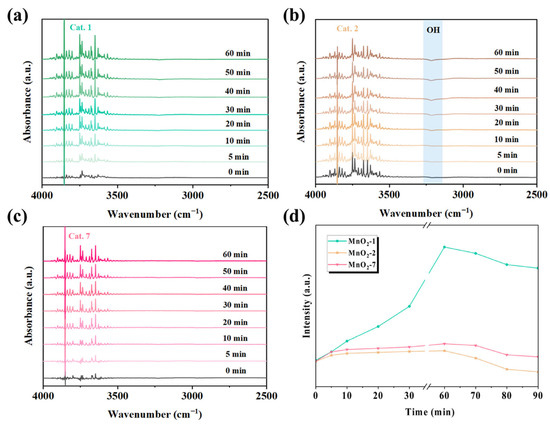
Figure 8.
In situ DRIFTS of (a) Cat. 1, (b) Cat. 2, (c) Cat. 7 under dry flow and (d) hydroxyl-related species as a function of time. Reaction conditions: gas flow 80 mL/min, [O3] = 20 ppm, and temperature 25 °C.
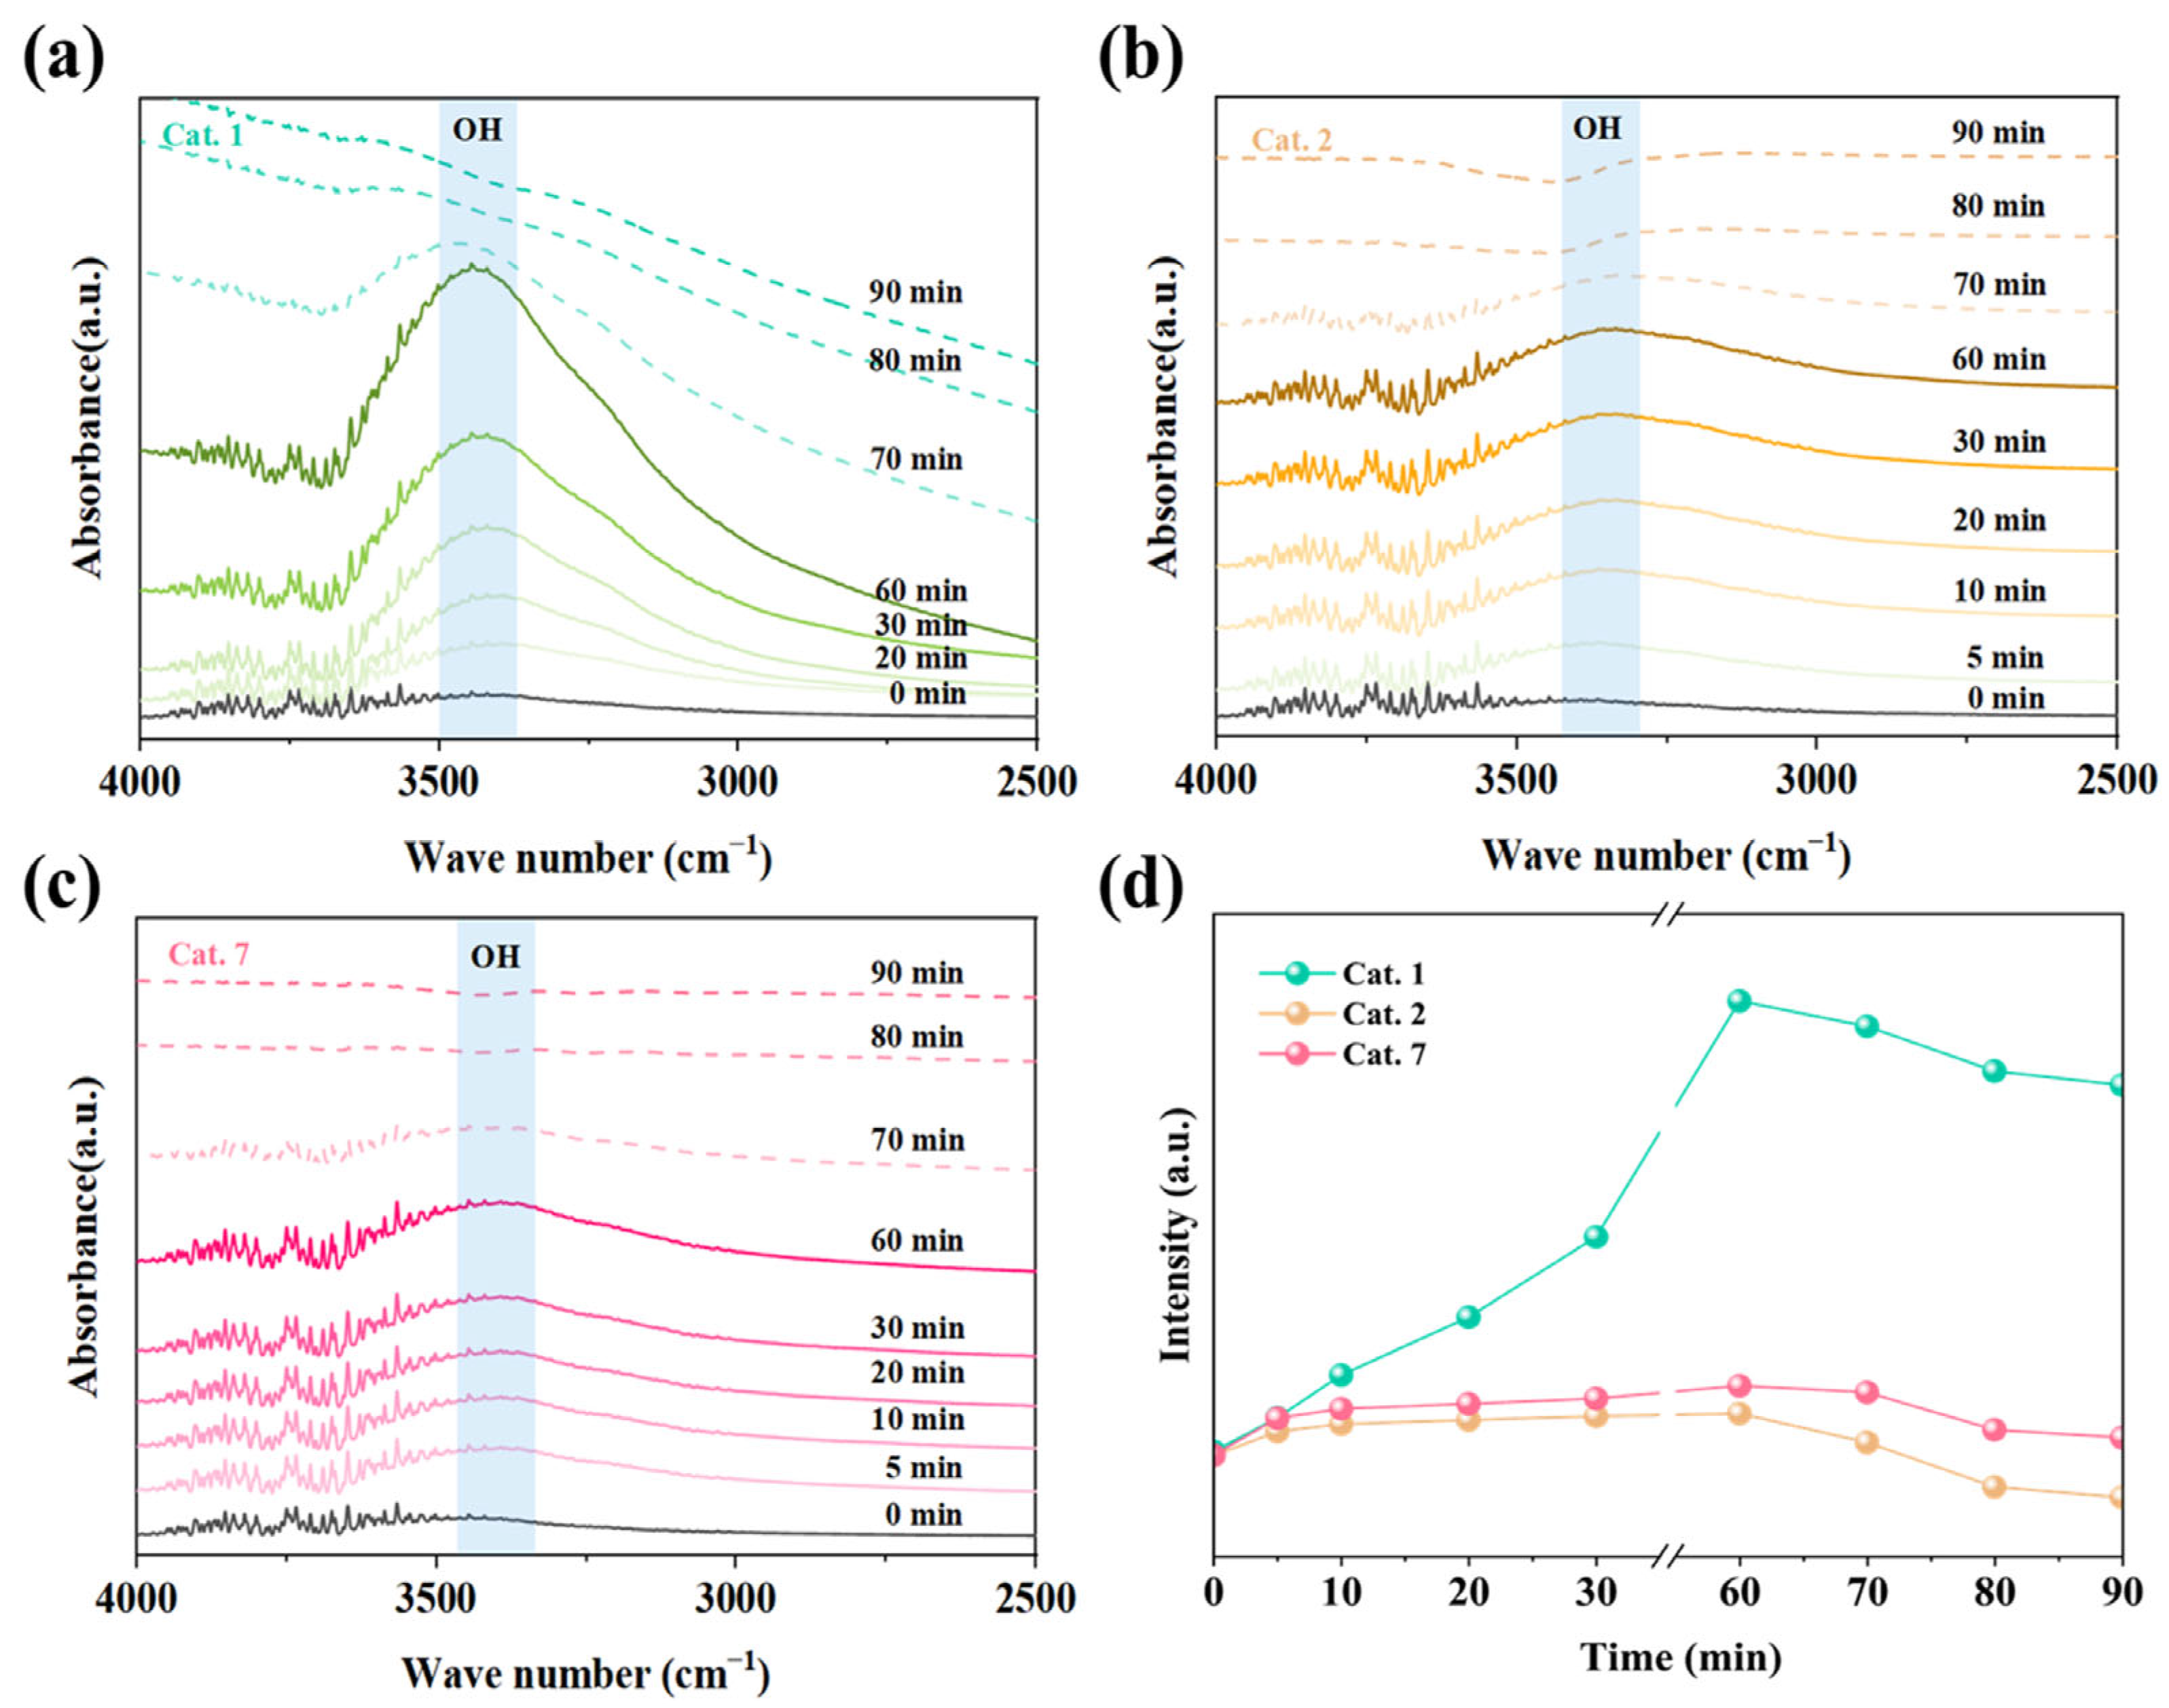
Figure 9 shows the in situ DRIFTS spectra of MnO2 with different crystal structures under wet and dry gas conditions. Under wet conditions, the MnO2 crystal phases exhibited an increase in the hydroxyl peak (~3400 cm−1), indicating the accumulation of hydroxyl groups on the MnO2 surface (Figure 9a–c). The OH peak intensities of Cat. 1 exhibited the most significant variation, indicating poor resistance to humidity. Excess hydroxyl groups block the surface active sites, negatively affecting ozone decomposition [51]. In contrast, Cat. 2 shows a small variation in OH peak intensity under humid conditions, indicating a superior water resistance (Figure 9d). When the wet gas was further converted into dry gas, the OH peak of Cat. 2 gradually weakened and eventually shifted to a negative peak, suggesting further consumption of hydroxyl groups. In contrast, the OH peak intensities of Cat. 1 and Cat. 7 did not continue to decrease, which is consistent with the in situ DRIFTS results under dry conditions (Figure 8). Some hydroxyl groups participate in the ozone catalytic reaction, promoting ozone decomposition.
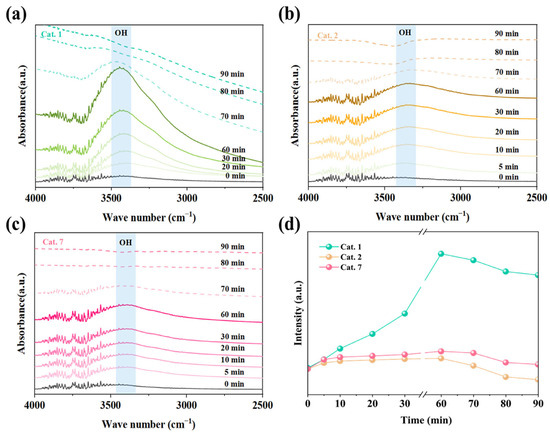
Figure 9.
In situ DRIFTS of (a) Cat. 1, (b) Cat. 2, (c) Cat. 7 under wet and dry flow and (d) hydroxyl-related species as a function of time. Reaction conditions: gas flow 80 mL/min, [O3] = 20 ppm, and temperature 25 °C.
These results suggest that the Cat. 2 exhibited optimal humidity resistance. Furthermore, the hydroxyl groups of Cat. 2 are consumed during the reaction, alleviating the competitive adsorption of water molecules, which is beneficial for ozone decomposition. Therefore, Cat. 2 demonstrates excellent ozone decomposition activity under both dry and humid conditions.
2.5. The Development and Low-Concentration Ozone Decomposition Performance in an Air Duct of the Monolithic Catalyst
The overall structure of a catalyst is very important for practical applications. Ozone pollution exceeding the standard often occurs in a large space range, with ozone concentration at the ppb level [4]. This requires the catalyst to exhibit low wind resistance and minimal pressure drop to facilitate air circulation. Typically, the catalytically active component is synthesized separately and then coated on substrates such as ceramic fibers [52], honeycomb monoliths [41], and metal foams [53]. However, these methods suffer from complex fabrication.
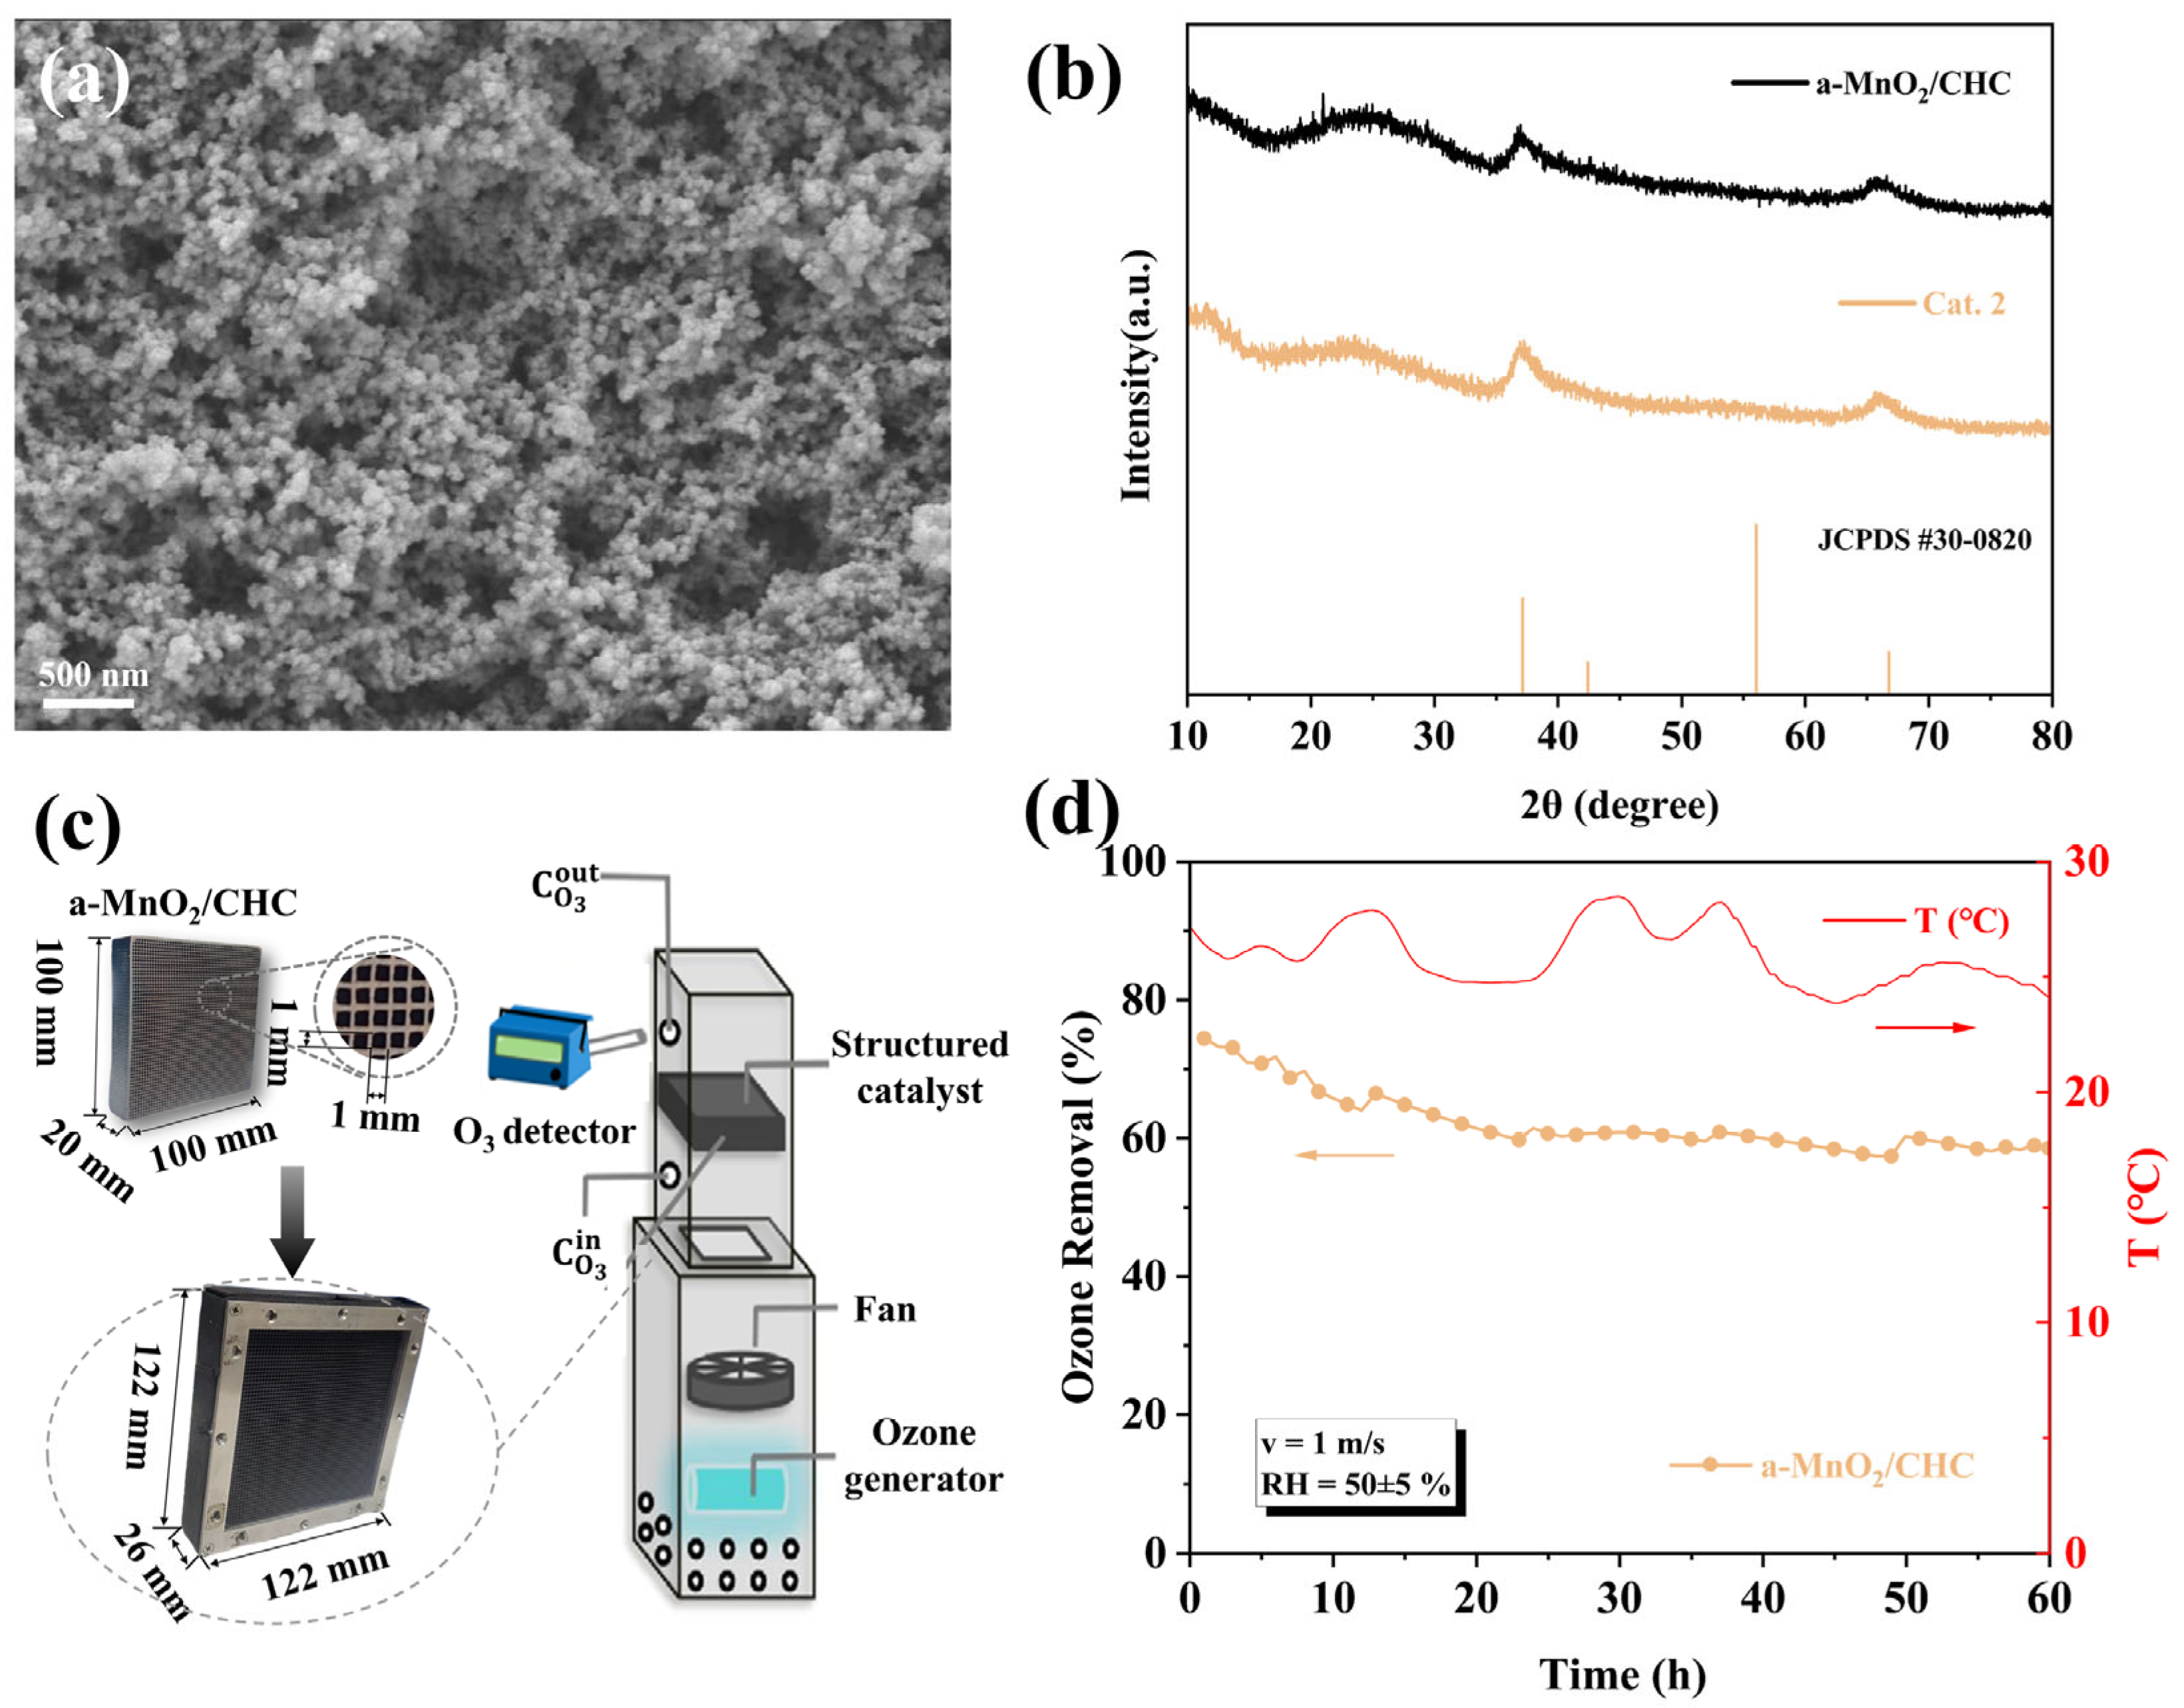
To address this, we developed a monolithic a(amorphous)-MnO2/cordierite honeycomb ceramic (CHC) catalyst via one-step spray-coating, leveraging the rapid in situ growth of amorphous MnO2. The cordierite support, a porous material with a loose structure, exhibits structural stability, high porosity, and a large specific surface area, making it well-suited for catalyst loading [54]. Figure 10a shows the morphology and image of a-MnO2 grown on the cordierite honeycomb ceramic substrate, where nano-sized MnO2 particles were uniformly distributed on the surface of the support. XRD analysis (Figure 10b) confirmed the amorphous structure, preserving the high oxygen vacancy density that is critical for humidity-resistant ozone decomposition.
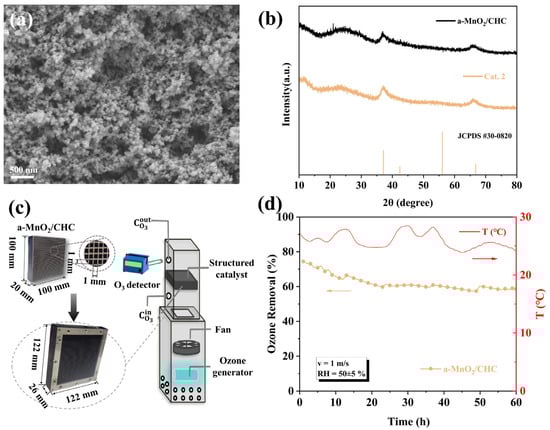
Figure 10.
(a) SEM images, and (b) XRD spectra of a-MnO2/CHC. (c) Preparation and test method of a-MnO2/CHC. (d) Durability test of a-MnO2/CHC in an air duct (O3: 400 ± 30 ppb, cross-section velocity: 1 m/s, T: 20 ± 5 °C, RH = 50 ± 5%, catalyst area: 0.01 m2).
Figure 10c shows the preparation of the catalyst and the test methods. The method for preparing amorphous (a-)MnO2 was effectively applied to achieve in situ growth on a cordierite honeycomb carrier (CHC). In addition, a simulated air duct was designed to test the single-pass ozone degradation efficiency of the monolithic catalyst under low ozone concentration and high airflow conditions. The air duct shell was made of PVC foam board, and the entire duct was divided into two regions: the generation and testing regions. In the generation region, air was drawn from the bottom of the duct by a fan, passed through the ozone generator (UV lamp) to produce ozone ([O3] = 400 ± 30 ppb), and then the fan-blown air was mixed into the testing region. In the testing region, the reaction contact area was 100 × 100 mm2, and the superficial velocity was controlled at 1 m s−1. The cordierite honeycomb catalyst was assembled into a reaction module and installed in the testing duct. The initial and outlet ozone concentrations were measured at distances of 100 mm above and below the reaction module, and the single-pass ozone removal efficiency was calculated using Equation (1).
In order to verify its ozone decomposition activity, the monolithic a-MnO2/CHC catalyst was integrated into a module (122 mm × 122 mm × 26 mm) and tested in an air purification channel (Figure 10c). The test conditions were as follows: inlet concentration of 400 ± 30 ppb, face velocity of 1 m/s, and RH = 50 ± 5%. The a-MnO2/CHC demonstrated a sustained 60% ozone removal efficiency over 60 h of continuous testing, demonstrating excellent stability (Figure 10d). These results indicated that the monolithic catalyst a-MnO2/CHC holds great potential for practical low-concentration ozone removal applications.
3. Materials and Methods
3.1. Preparation of MnO2 Catalysts
The potassium permanganate (KMnO4), manganese (II) sulfate monohydrate (MnSO4·H2O), potassium hydroxide (KOH), and hydrochloric acid (HCl) used in this study were of analytical grade without further purification. Different crystal phases of MnO2 were synthesized by adjusting the amount of KOH added and the acid-washing and water-washing methods.
In a typical preparation process, 2.937 g of KMnO4 and 1.5 g of KOH were dissolved in 50 mL of deionized water under magnetic stirring (600 rpm) at room temperature. Subsequently, 0.57 M MnSO4·H2O solution (50 mL) was introduced via peristaltic pump (2 mL/min) into the alkaline mixture., and the pH of the reaction solution was adjusted to 1.5 before stopping the addition. The precipitate was filtered and washed repeatedly with HCl solution (pH = 1) until the supernatant became clear, followed by rinsing with deionized water to neutrality and ethanol. The precipitate was dried at 80 °C for 18 h to yield Cat. 1. The preparation of Cat. X (X = 2, 3, 4, 5, 6, 7) followed a similar process as above, with the only difference being that the final adjusted pH values were 3, 5, 7, 9, 11, and 13 respectively.
The cordierite honeycomb carrier (CHC) was pre-cleaned through ultrasonication in deionized water and then dried at 80 °C. Then, the cordierite honeycomb carrier was immersed in a mixed solution of 0.37 M KMnO4 and 0.75 M KOH for 2 min. Subsequently, a 0.54 mol/L KMnO4 solution was atomized using a spray gun and uniformly sprayed onto the surface and internal pores of the carrier to ensure complete redox reaction with the substrate. The process was repeated for several spray cycles to achieve in situ growth of amorphous(a) MnO2 on the carrier surface. After the spraying process, the catalyst was washed with deionized water and dried at 80 °C for 24 h. The resulting catalyst was designated as a-MnO2/CHC.
The dimensions and pressure drop of the a-MnO2/CHC catalyst are provided in the Supplementary Materials.
3.2. Characterizations and Measurements
X-ray diffraction (XRD) was used to analyze the crystalline phases of the samples on a powder X-ray diffractometer (SmartLab SE, Rigaku, Tokyo, Japan) with a Cu Kα radiation source (λ = 0.15406 nm). The data were collected in the 2θ range of 10~80° with a 2 °/min scanning rate. The Raman spectra were acquired on a Laser Micro-Raman Spectrometer (Xplra plus, Hrobia, Kyoto, Japan) from 100~1500 cm–1, and the excitation wavelength was 532 nm. The morphology of the samples was characterized using a Field Emission Scanning Electron Microscope (FESEM, Quanta FEG250, FEI, Hillsboro, OR, USA). N2 adsorption–desorption isotherms were tested at 77 K using a Micromeritics physical adsorption instrument (ASAP 2020-M, Micromeritics, Norcross, GE, USA). The specific surface area was calculated by the Brunauer–Emmett–Teller (BET) method. All the samples were degassed at 350 °C for 12 h before N2 adsorption. X-ray photoelectron spectroscopy (XPS, Thermo-ESCALAB 250XI, Thermo Fisher Scientific, Waltham, MA, USA) was carried out to examine the chemical states of Mn and O. Sample charge values were corrected using the C 1s peak at 284.8 eV as reference. In order to identify the reducibility and oxygen mobility of MnOx catalysts, H2 temperature-programmed reduction (H2-TPR) and O2 temperature-programmed desorption (O2-TPD) were carried out using an AutoChem 2720 chemisorption analyzer (Micromeritics, Norcross, GE, USA). For H2-TPR analysis, about 50 mg of sample was treated at 200 °C in a flow of He (20 mL min−1) for 60 min, followed by cooling down to 40 °C. Then, the sample was further treated in a flow of a 5 vol% H2/Ar gas mixture (20 mL min−1) between 40 and 600 °C at a heating rate of 10 °C min−1. In a typical O2-TPD analysis, about 50 mg of sample was pretreated at 80 °C in a flow of He (20 mL min−1) for 60 min, followed by cooling down to 40 °C. The oxidation process was carried out under 5 vol% O2-He (20 mL min−1) and kept for 30 min. After that, the sample was purged under He (30 mL min−1) for 1 h, followed by desorption performed between 40 and 800 °C at a heating rate of 10 °C min−1.
In situ DRIFTS (Thermo Fisher, Waltham, MA, USA) was used to detect the accumulation and consumption of surface hydroxyl species during ozone decomposition. The system was equipped with an MCT detector and operated at a resolution of 4 cm−1 for 64 scans. The samples were pretreated by N2 stream at 80 °C for 1 h to remove adsorbed surface water and other contaminants. After the reaction cell cooled to room temperature, the pretreated samples were exposed to dry or wet O2/O3 (20 ppm) at a flow rate of 80 mL min−1.
Instrumental errors were propagated using manufacturer-specified accuracies.
3.3. Evaluation of Activity for Ozone Decomposition
As shown in Figure 11, the ozone removal experiment for the catalyst was conducted in a fixed-bed reactor (internal diameter: 4 mm). The catalyst powder (0.1 g, 40–60 mesh) was thoroughly mixed with quartz sand (0.45 g, 40–60 mesh) and loaded into a quartz tube. High-purity air was used as the gas source, and the total flow rate through the reactor was controlled at 1 L·min−1 (WHSV = 600,000 mL·g−1·h−1), with the temperature set to 25 °C. Relative humidity was controlled by adjusting the ratio of dry to wet gas flow. The wet gas flow was bubbled to carry water vapor, with a constant-temperature water bath maintained at 25 °C. The humidity in the gas stream was monitored using a humidity meter (SE-572, Sndway, Dongguan, Guangdong, China). The blended gas stream was directed through an ozone generator equipped with a low-pressure UV lamp (UV-M2, Beijing Tonglin, China), maintaining an inlet ozone concentration of 40 ± 1 ppm. The ozone concentration change at the outlet was monitored in real-time using an ozone analyzer (Model 106L, 2B Technologies, Boulder, Colorado, USA). The ozone degradation rate of the catalyst was calculated using Equation (5):
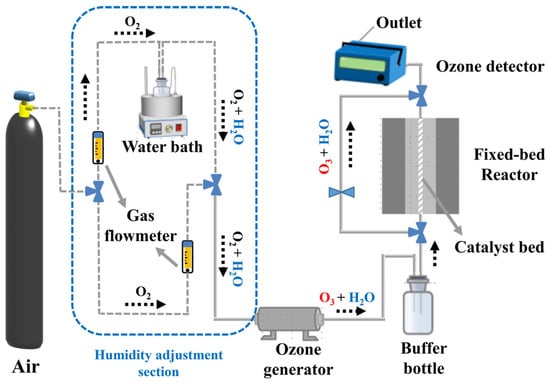
Figure 11.
Catalyst evaluation system fixed-bed reactor.
Here, “Cin” denotes the initial O3 inlet concentration (ppm), and “Cout” denotes the outlet concentration. Uncertainties were calculated as standard deviations from three independent experiments.
4. Conclusions
In this work, MnO2 samples with different crystal phases (α, δ, and amorphous) were successfully synthesized under ambient conditions by pH adjustment during the redox reaction. Under thermodynamic constraints, the optimized amorphous MnO2 (Cat. 2) exhibited excellent ozone decomposition activity over the entire humidity range. This remarkable performance was demonstrated through its largest specific surface area, lowest average Mn oxidation state, high number of exposed oxygen vacancies, and superior oxygen mobility. In situ DRIFTS experiments further demonstrated that the prepared Cat. 2 exhibited outstanding water resistance. Furthermore, the method for preparing amorphous (a-)MnO2 was effectively applied to achieve in situ growth on a cordierite honeycomb carrier (CHC). The a-MnO2/CHC catalyst demonstrated excellent catalytic activity and stability in the presence of low-concentration ozone (400 ± 30 ppb) at room temperature. This study provides a novel strategy for the design and development of monolithic catalysts for effective ozone decomposition.
Supplementary Materials
The following supporting information can be downloaded at: https://www.mdpi.com/article/10.3390/catal15030290/s1, Figure S1:The pressure drop between downstream and upstream on the air duct at different air velocities; Table S1: Pressure drop between downstream and upstream on the air duct, Table S2: Comparison of catalytic activity of reported Mn-based catalysts for catalytic O3 decomposition. Refs. [36,55,56,57,58,59,60,61,62,63].
Author Contributions
Conceptualization, methodology, writing-original draft preparation, writing—review and editing H.B.; software, H.B. and Z.X.; supervision, project administration, funding acquisition, review and editing Q.Z. All authors have read and agreed to the published version of the manuscript.
Funding
This research received no external funding.
Data Availability Statement
The raw data supporting the conclusions of this article will be made available by the authors on request.
Conflicts of Interest
The authors declare no conflicts of interest.
References
- Stenke, A. Natural Control on Ozone Pollution. Nat. Clim. Change 2020, 10, 101–102. [Google Scholar] [CrossRef]
- Hewitt, C.N.; MacKenzie, A.R.; Di Carlo, P.; Di Marco, C.F.; Dorsey, J.R.; Evans, M.; Fowler, D.; Gallagher, M.W.; Hopkins, J.R.; Jones, C.E.; et al. Nitrogen Management Is Essential to Prevent Tropical Oil Palm Plantations from Causing Ground-Level Ozone Pollution. Proc. Natl. Acad. Sci. USA 2009, 106, 18447–18451. [Google Scholar] [CrossRef] [PubMed]
- Ji, J.; Xu, Y.; Huang, H.; He, M.; Liu, S.; Liu, G.; Xie, R.; Feng, Q.; Shu, Y.; Zhan, Y.; et al. Mesoporous TiO2 under VUV Irradiation: Enhanced Photocatalytic Oxidation for VOCs Degradation at Room Temperature. Chem. Eng. J. 2017, 327, 490–499. [Google Scholar] [CrossRef]
- Chen, Y.; Wang, M.; Yao, Y.; Zeng, C.; Zhang, W.; Yan, H.; Gao, P.; Fan, L.; Ye, D. Research on the Ozone Formation Sensitivity Indicator of Four Urban Agglomerations of China Using Ozone Monitoring Instrument (OMI) Satellite Data and Ground-Based Measurements. Sci. Total Environ. 2023, 869, 161679. [Google Scholar] [CrossRef] [PubMed]
- Wu, R.; Agathokleous, E.; Yung, D.H.Y.; Tai, A.P.K.; Shang, B.; Feng, Z. Joint Impacts of Ozone Pollution and Climate Change on Yields of Chinese Winter Wheat. Atmos. Pollut. Res. 2022, 13, 101509. [Google Scholar] [CrossRef]
- Valavanidis, A.; Vlachogianni, T.; Fiotakis, K.; Loridas, S. Pulmonary Oxidative Stress, Inflammation and Cancer: Respirable Particulate Matter, Fibrous Dusts and Ozone as Major Causes of Lung Carcinogenesis through Reactive Oxygen Species Mechanisms. Int. J. Environ. Res. Public Health 2013, 10, 3886–3907. [Google Scholar] [CrossRef]
- Li, M.; Dong, H.; Wang, B.; Zhao, W.; Zare Sakhvidi, M.J.; Li, L.; Lin, G.; Yang, J. Association between Ambient Ozone Pollution and Mortality from a Spectrum of Causes in Guangzhou, China. Sci. Total Environ. 2021, 754, 142110. [Google Scholar] [CrossRef]
- Meo, S.A.; Almutairi, F.J.; Abukhalaf, A.A.; Alessa, O.M.; Al-Khlaiwi, T.; Meo, A.S. Sandstorm and Its Effect on Particulate Matter PM 2.5, Carbon Monoxide, Nitrogen Dioxide, Ozone Pollutants and SARS-CoV-2 Cases and Deaths. Sci. Total Environ. 2021, 795, 148764. [Google Scholar] [CrossRef]
- Sicard, P.; Agathokleous, E.; Anenberg, S.C.; De Marco, A.; Paoletti, E.; Calatayud, V. Trends in Urban air Pollution over the Last Two Decades: A global Perspective. Sci. Total Environ. 2023, 858, 160064. [Google Scholar] [CrossRef]
- Wang, H.; He, C.; Morawska, L.; McGarry, P.; Johnson, G. Ozone-Initiated Particle Formation, Particle Aging, and Precursors in a Laser Printer. Environ. Sci. Technol. 2012, 46, 704–712. [Google Scholar] [CrossRef]
- Fadeyi, M.O. Ozone in Indoor Environments: Research Progress in the Past 15 Years. Sustain. Cities Soc. 2015, 18, 78–94. [Google Scholar] [CrossRef]
- Ma, J.; Cao, R.; Dang, Y.; Wang, J. A Recent Progress of Room–Temperature Airborne Ozone Decomposition Catalysts. Chin. Chem. Lett. 2021, 32, 2985–2993. [Google Scholar] [CrossRef]
- Namdari, M.; Lee, C.-S.; Haghighat, F. Active Ozone Removal Technologies for a Safe Indoor Environment: A Comprehensive Review. Build. Environ. 2021, 187, 107370. [Google Scholar] [CrossRef]
- Li, X.; He, G.; Ma, J.; Shao, X.; Chen, Y.; He, H. Boosting the Dispersity of Metallic Ag Nanoparticles and Ozone Decomposition Performance of Ag-Mn Catalysts Via Manganese Vacancy-Dependent Metal–Support Interactions. Environ. Sci. Technol. 2021, 55, 16143–16152. [Google Scholar] [CrossRef] [PubMed]
- Zhang, M.; Zhang, S.; Wang, Z.; Hu, J.; Lian, Z.; Zhong, Q. Enhanced Water Resistance Mechanism in Ag-Hollandite for Catalytic Ozone Decomposition. J. Hazard. Mater. 2024, 465, 133481. [Google Scholar] [CrossRef]
- Hao, Z.; Cheng, D.; Guo, Y.; Liang, Y. Supported Gold Catalysts Used for Ozone Decomposition and Simultaneous Elimination of Ozone and Carbon Monoxide at Ambient Temperature. Appl. Catal. B Environ. 2001, 33, 217–222. [Google Scholar] [CrossRef]
- Chang, C.-L.; Tser-Sheng, L. Pt/Rh and Pd/Rh Catalysts Used for Ozone Decomposition and Simultaneous Elimination of Ozone and Carbon Monoxide. React. Kinet. Catal. Lett. 2005, 86, 91–98. [Google Scholar] [CrossRef]
- Dong, C.; Yang, J.-J.; Xie, L.-H.; Cui, G.; Fang, W.-H.; Li, J.-R. Catalytic Ozone Decomposition and Adsorptive VOCs Removal in Bimetallic Metal-Organic Frameworks. Nat. Commun. 2022, 13, 4991. [Google Scholar]
- Gong, S.; Wu, X.; Zhang, J.; Han, N.; Chen, Y. Facile Solution Synthesis of Cu2O–CuO–Cu(OH)2 Hierarchical Nanostructures for Effective Catalytic Ozone Decomposition. CrystEngComm 2018, 20, 3096–3104. [Google Scholar] [CrossRef]
- Ma, S.; Ye, X.; Jiang, X.; Cen, W.; Jiang, W.; Wang, H. First Principles Calculation of Mechanical, Dynamical and Thermodynamic Properties of MnO2 with Four Crystal Phases. J. Alloys Compd. 2021, 852, 157007. [Google Scholar] [CrossRef]
- Yang, J.; Ren, S.; Su, B.; Zhou, Y.; Hu, G.; Jiang, L.; Cao, J.; Liu, W.; Yao, L.; Kong, M.; et al. Insight into N2O Formation over Different Crystal Phases of MnO2 during Low-Temperature NH3–SCR of NO. Catal. Lett. 2021, 151, 2964–2971. [Google Scholar] [CrossRef]
- Zhou, C.; Wang, J.; Liu, X.; Chen, F.; Di, Y.; Gao, S.; Shi, Q. Magnetic and Thermodynamic Properties of α, β, γ and δ-MnO2. New J. Chem. 2018, 42, 8400–8407. [Google Scholar] [CrossRef]
- Xu, B.; Qin, H.; Wu, X.; Sun, Y. Ozone Decomposition Mechanism at Different Structural Oxygen Vacancies on Manganese Dioxide. J. Phys. Chem. C 2022, 126, 17076–17083. [Google Scholar] [CrossRef]
- Jia, J.; Zhang, P.; Chen, L. Catalytic Decomposition of Gaseous Ozone over Manganese Dioxides with Different Crystal Structures. Appl. Catal. B Environ. 2016, 189, 210–218. [Google Scholar] [CrossRef]
- Yang, R.; Guo, Z.; Cai, L.; Zhu, R.; Fan, Y.; Zhang, Y.; Han, P.; Zhang, W.; Zhu, X.; Zhao, Q.; et al. Investigation into the Phase–Activity Relationship of MnO2 Nanomaterials toward Ozone-Assisted Catalytic Oxidation of Toluene. Small 2021, 17, 2103052. [Google Scholar] [CrossRef]
- Zhang, J.; Li, Y.; Wang, L.; Zhang, C.; He, H. Catalytic Oxidation of Formaldehyde over Manganese Oxides with Different Crystal Structures. Catal. Sci. Technol. 2015, 5, 2305–2313. [Google Scholar] [CrossRef]
- Li, W.; Gibbs, G.V.; Oyama, S.T. Mechanism of Ozone Decomposition on a Manganese Oxide Catalyst. 1. In Situ Raman Spectroscopy and Ab Initio Molecular Orbital Calculations. J. Am. Chem. Soc. 1998, 120, 9041–9046. [Google Scholar] [CrossRef]
- Ma, J.; Li, X.; Zhang, C.; Ma, Q.; He, H. Novel CeMnaOx Catalyst for Highly Efficient Catalytic Decomposition of Ozone. Appl. Catal. B Environ. 2020, 264, 118498. [Google Scholar] [CrossRef]
- Cao, Z.; Bian, H.; Xie, Z.; Ji, L.; Zhang, Q. Research and improvement on the performance of Ti modified Mn based catalysts for removing ozone at room temperature. J. Guizhou Norm. Univ. (Nat. Sci.) 2024, 42, 75–83. [Google Scholar] [CrossRef]
- Xie, Z.; Ji, L.; Bian, H.; Zhang, Q. Generation of Abundant Oxygen Vacancies in Sandwich Structured ε-MnO2/γ-Al2O3/Al by a Facile Modification Strategy for Enhanced Catalytic Decomposition of Ozone in Humid Conditions. Chem. Eng. J. 2025, 509, 161202. [Google Scholar] [CrossRef]
- Yang, Q.; Li, J.; Wang, D.; Peng, Y.; Ma, Y. Activity Improvement of Acid Treatment on LaFeO3 Catalyst for CO Oxidation. Catal. Today 2021, 376, 205–210. [Google Scholar] [CrossRef]
- Dang, H.; Zhao, W.; Wu, R.; Yue, L.; Wang, Y.; Ren, Z.; Zhao, Y. Effect of Acid Treatment on the Catalytic Performance of CuO/Cryptomelane Catalyst for CO Preferential Oxidation in H2-Rich Streams. Int. J. Hydrogen Energy 2023, 48, 27619–27630. [Google Scholar] [CrossRef]
- Xiong, S.; Zhang, K.; Xu, Z.; Ou, H.; Zheng, Y.; Li, X.; Peng, Y.; Luo, X.; Li, J. Enhancing Ozone Catalytic Decomposition through Acid Treatment of α-MnO2 for Improved Activity and Humidity Resistance. J. Environ. Sci. 2025, 149, 35–45. [Google Scholar] [CrossRef]
- Li, X.; Ma, J.; He, H. Recent Advances in Catalytic Decomposition of Ozone. J. Environ. Sci. 2020, 94, 14–31. [Google Scholar] [CrossRef]
- Liu, S.; Ji, J.; Yu, Y.; Huang, H. Facile Synthesis of Amorphous Mesoporous Manganese Oxides for Efficient Catalytic Decomposition of Ozone. Catal. Sci. Technol. 2018, 8, 4264–4273. [Google Scholar] [CrossRef]
- Zhao, H.; Wang, A.; Zhang, Q.; Han, C. Highly Efficient Removal of Ozone by Amorphous Manganese Oxides Synthesized with a Simple Hydrothermal Method. J. Environ. Sci. 2023, 134, 96–107. [Google Scholar] [CrossRef]
- Yu, Y.; Liu, S.; Ji, J.; Huang, H. Amorphous MnO2 Surviving Calcination: An Efficient Catalyst for Ozone Decomposition. Catal. Sci. Technol. 2019, 9, 5090–5099. [Google Scholar] [CrossRef]
- Yan, Q.; Ji, J.; Chen, Y.; Zhao, G.; Jia, B.; Xu, L.; Cheng, P. By-Product Reduction for the Non-Thermal Plasma Removal of Toluene Using an α-MnO2/Cordierite Honeycomb Monolithic Catalyst in a Honeycomb Structure. Appl. Catal. B Environ. 2024, 343, 123530. [Google Scholar] [CrossRef]
- Chernykh, M.; Grabchenko, M.; Knyazev, A.; Mamontov, G. Cordierite-Supported Transition-Metal-Oxide-Based Catalysts for Ozone Decomposition. Crystals 2023, 13, 1674. [Google Scholar] [CrossRef]
- Cao, R.; Zhang, P.; Liu, Y.; Zheng, X. Ammonium-Treated Birnessite-Type MnO2 to Increase Oxygen Vacancies and Surface Acidity for Stably Decomposing Ozone in Humid Condition. Appl. Surf. Sci. 2019, 495, 143607. [Google Scholar] [CrossRef]
- He, Y.; Zhang, P.; Yang, J.; Wang, S.; Li, J. Fabrication of MnO2 Coating on Aluminum Honeycomb for Fast Catalytic Decomposition of Ozone at Room Temperature. J. Environ. Sci. 2023, 134, 34–43. [Google Scholar] [CrossRef]
- Devaraj, S.; Munichandraiah, N. Effect of Crystallographic Structure of MnO2 on Its Electrochemical Capacitance Properties. J. Phys. Chem. C 2008, 112, 4406–4417. [Google Scholar] [CrossRef]
- Yu, H.; Yang, J.; Lu, L.; Guo, Y.; Guan, J.; Fan, G.; Zhu, Q.; Han, N.; Chen, Y. Controllable Synthesis of Different MnO2 Phases by a Precipitation Method for Effective Ozone Decomposition. J. Phys. Chem. C 2024, 128, 5559–5567. [Google Scholar] [CrossRef]
- McKenzie, R.M. The Synthesis of Birnessite, Cryptomelane, and Some Other Oxides and Hydroxides of Manganese. Mineral. Mag. 1971, 38, 493–502. [Google Scholar] [CrossRef]
- Ji, J.; Lu, X.; Chen, C.; He, M.; Huang, H. Potassium-Modulated δ-MnO2 as Robust Catalysts for Formaldehyde Oxidation at Room Temperature. Appl. Catal. B Environ. 2020, 260, 118210. [Google Scholar] [CrossRef]
- Liu, Y.; Zhang, P. Catalytic Decomposition of Gaseous Ozone over Todorokite-Type Manganese Dioxides at Room Temperature: Effects of Cerium Modification. Appl. Catal. A Gen. 2017, 530, 102–110. [Google Scholar] [CrossRef]
- Yang, Y.; Jia, J.; Liu, Y.; Zhang, P. The Effect of Tungsten Doping on the Catalytic Activity of α-MnO2 Nanomaterial for Ozone Decomposition under Humid Condition. Appl. Catal. A Gen. 2018, 562, 132–141. [Google Scholar] [CrossRef]
- Fang, R.; Feng, Q.; Huang, H.; Ji, J.; He, M.; Zhan, Y.; Liu, B.; Leung, D.Y.C. Effect of K+ Ions on Efficient Room-Temperature Degradation of Formaldehyde over MnO2 Catalysts. Catal. Today 2019, 327, 154–160. [Google Scholar] [CrossRef]
- Wu, Z.; Zhang, P.; Rong, S.; Jia, J. Creating Water-Resistant Oxygen Vacancies in δ-MnO2 by Chlorine Introduction for Catalytic Ozone Decomposition at Ambient Temperature. Appl. Catal. B Environ. 2023, 335, 122900. [Google Scholar] [CrossRef]
- Liu, Y.; Zhang, P. Removing Surface Hydroxyl Groups of Ce-Modified MnO2 to Significantly Improve Its Stability for Gaseous Ozone Decomposition. J. Phys. Chem. C 2017, 121, 23488–23497. [Google Scholar] [CrossRef]
- Zhu, G.; Zhu, J.; Jiang, W.; Zhang, Z.; Wang, J.; Zhu, Y.; Zhang, Q. Surface Oxygen Vacancy Induced α-MnO2 Nanofiber for Highly Efficient Ozone Elimination. Appl. Catal. B Environ. 2017, 209, 729–737. [Google Scholar] [CrossRef]
- Tao, L.; Zhao, G.; Chen, P.; Zhang, Z.; Liu, Y.; Lu, Y. High-Performance Co-MnOx Composite Oxide Catalyst Structured onto Al-Fiber Felt for High-Throughput O3 Decomposition. ChemCatChem 2019, 11, 1131–1142. [Google Scholar] [CrossRef]
- Liang, H.; Wang, X.; Wang, H.; Qu, Z. Co-Doped Cryptomelane-Type Manganese Oxide in Situ Grown on a Nickel Foam Substrate for High Humidity Ozone Decomposition. J. Environ. Sci. 2025, 148, 529–540. [Google Scholar] [CrossRef]
- Govender, S.; Friedrich, H. Monoliths: A Review of the Basics, Preparation Methods and Their Relevance to Oxidation. Catalysts 2017, 7, 62. [Google Scholar] [CrossRef]
- Cao, R.; Li, L.; Zhang, P.; Gao, L.; Rong, S. Regulating Oxygen Vacancies in Ultrathin δ-MnO2 Nanosheets With Superior Activity for Gaseous Ozone Decomposition. Environ. Sci. Nano 2021, 8, 1628–1641. [Google Scholar]
- Wang, A.; Zhao, H.; Wu, Y.; Zhang, Q.; Han, C. Cerium-Modified Amorphous Manganese Oxides for Efficient Catalytic Removal of Ozone. J. Environ. Sci. 2023, 131, 151–161. [Google Scholar]
- Liu, B.; Yi, Z.; Yang, Y.; Li, Y.; Yang, J.; Zhu, M. Unlocking Efficient and Robust Ozone Decomposition with CNT-Confined Manganese Oxide via Synergistic Electronic Modulation. Appl. Catal. B Environ. 2023, 334, 122788. [Google Scholar]
- Zhang, B.; Ji, J.; Liu, B.; Zhang, D.; Liu, S.; Huang, H. Highly Efficient Ozone Decomposition Against Harsh Environments Over Long-Term Stable Amorphous MnOx Catalysts. Appl. Catal. B Environ. 2022, 315, 121552. [Google Scholar]
- Liu, S.; Dai, W.; Liu, B.; Lin, S.; Zeng, F.; Huang, Q.; Sun, M.; Feng, F.; Lan, B.; Huang, H. Highly c-Disordered Birnessite with Abundant out-of-Layer Oxygen Vacancies for Enhanced Ozone Catalytic Decomposition. Separation and Purification Technology 2023, 322, 124254. [Google Scholar]
- Xu, Z.; Yang, W.; Si, W.; Chen, J.; Peng, Y.; Li, J. A novel γ-like MnO2 Catalyst for Ozone Decomposition in High Humidity Conditions. J. Hazar. Mater. 2021, 420, 126641. [Google Scholar]
- Cao, R.; Li, L.; Zhang, P. Macroporous MnO2-based Aerogel Crosslinked with Cellulose Nanofibers for Efficient Ozone Removal Under Humid Condition. J. Hazar. Mater. 2021, 407, 124793. [Google Scholar]
- Deng, Z.; Tian, J.; Wang, P.; Liu, B.; Guo, Y.; Xu, X.; Zeng, Z.; Li, L. Nanoflower-like δ-MnO2 Exhibits Excellent Ozone Decomposition Under Harsh Conditions: The Influence of Potassium ion. Appl. Surf. Sci. 2024, 671, 160769. [Google Scholar] [CrossRef]
- Wang, Z.; Li, T.; Zhang, S.; Zhang, R.; Zhang, Y.; Zhong, Q. One-step Synthesis of δ-MnO2 with Rich Defects for Efficient Ozone Decomposition Under Humid Conditions. J. Chem. Eng. 2024, 488, 150693. [Google Scholar]


Disclaimer/Publisher’s Note: The statements, opinions and data contained in all publications are solely those of the individual author(s) and contributor(s) and not of MDPI and/or the editor(s). MDPI and/or the editor(s) disclaim responsibility for any injury to people or property resulting from any ideas, methods, instructions or products referred to in the content. |
© 2025 by the authors. Licensee MDPI, Basel, Switzerland. This article is an open access article distributed under the terms and conditions of the Creative Commons Attribution (CC BY) license (https://creativecommons.org/licenses/by/4.0/).