Abstract
The dependence of the reaction rate on the solution layer thickness discovered in a previous work could be a powerful tool for investigating photocatalytic reactions. A reduction of the apparent rate constant with the growth of the dye concentration was found using this dependence. This decrement follows a hyperbolic law. This dependence is explained based on the observed increment of the solution conductivity. In addition, it is confirmed experimentally that the reaction rate decreases with the solution depth growth. The possibility of independent determination of the reaction rate constant and the adsorption equilibrium constant has been discussed. Additionally, it is demonstrated that the vessel’s reflective bottom could increase the chemical reaction rate. The reason why other authors have not yet reported this effect is also discussed.
1. Introduction
Generally, higher initial dye concentrations suppress the photocatalytic decomposition efficiency [1,2]. Some studies attribute this effect to light absorption by model pollutant dye molecules [3,4,5]. Another explanation is that the model pollutant molecules and degradation products obstruct the active sites of the catalyst surface [6,7,8,9,10,11]. At low concentrations of the dye, the low efficiency may be attributed to a slow diffusion to the active areas of the catalyst; therefore, its efficiency increases with the increase of dissolved model pollutant amount [7]. An initial rise, followed by a decrease in the rate of photodegradation, was observed by Saquib and Muneer [12]. However, according to other authors [13], the reaction rate could stay unaltered when the initial concentration of the pollutant is changed.
A formula for the photocatalytic reaction rate was reported in previous work [14]. It was derived from the Beer–Lambert law and Langmuir–Hinshelwood equation and reveals the relation of the photocatalytic degradation rate on parameters like the compound concentration, photocatalyst concentration, and solution depth. The relationship was validated experimentally by the photodegradation of methylene blue (MB) by ZnO [14]. Both the Beer–Lambert law and Langmuir–Hinshelwood equation are valid independently of what substance is submitted to decomposition. Nevertheless, the formula described in [14] needs further experimental confirmation. As a result, it was found that the apparent rate constant for MO degradation with TiO2 decreases with the increasing MO concentration according to a hyperbolic law.
In this sense, the initial aim of the present research was to confirm the acquired relation of the photocatalytic reaction rate on the initial model pollutant concentration, the photocatalyst concentration, and the solution layer thickness. As the main result, the dependence of the apparent rate constant on the model pollutant initial concentration is established. Additionally, it is demonstrated that the reaction rate can be significantly increased by using a reflective bottom. The existence of this effect is expected. Nevertheless, this phenomenon has not been reported by other researchers, according to our best knowledge. The explanation is that the impact of the bottom reflection on the reaction rate is observable for powder photocatalysts in the case of very transparent solutions (low substrate concentration and low concentration of the powder) and small thickness of the solution layer.
2. Results and Discussion
2.1. Non-Reflective Bottom
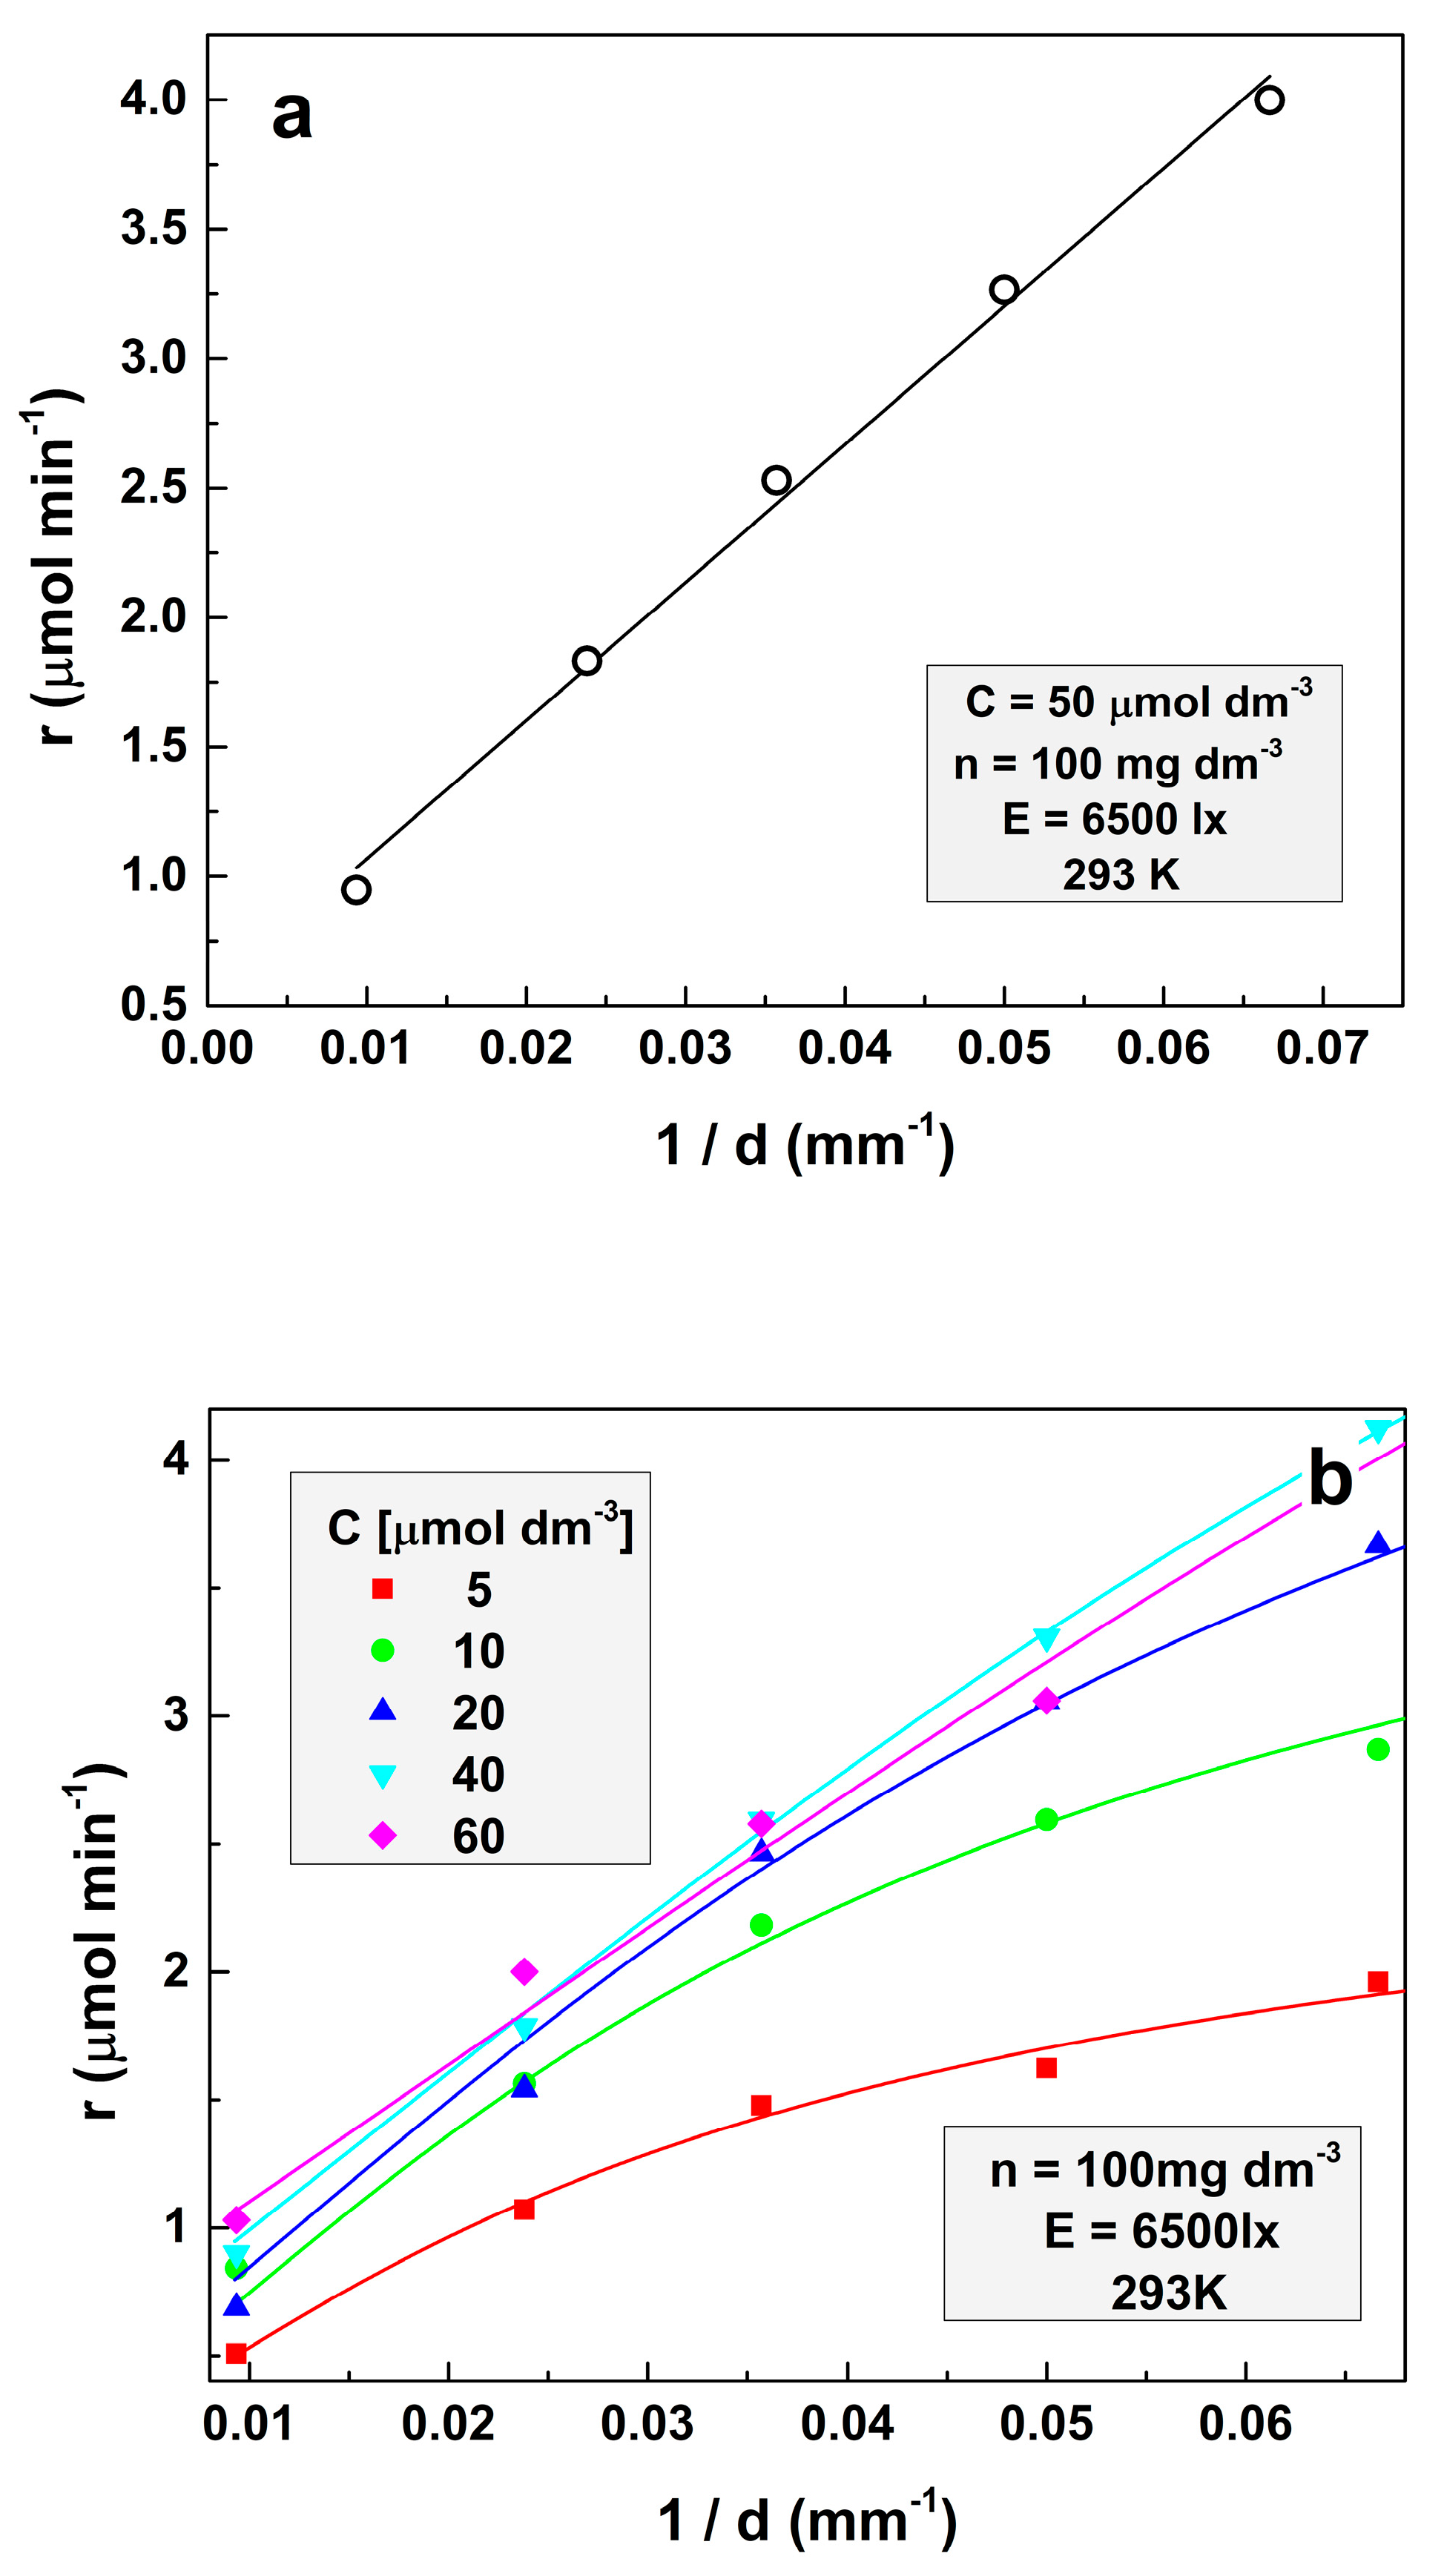
The respective experiments were performed at the illumination of 6500 lx and a temperature of 293 K. The amount of the loaded TiO2 is 100 mg dm−3 for all experiments. Figure 1a illustrates the case of an opaque solution. The symbols designate the experimental points, and the continuous line indicates the fit of these points according to Equation (7). It demonstrates the excellent fitting of the experimental results by Equation (7). It can be seen that in opaque solutions, the dependence of the photocatalytic decomposition rate on the parameter d−1 is practically a straight line.
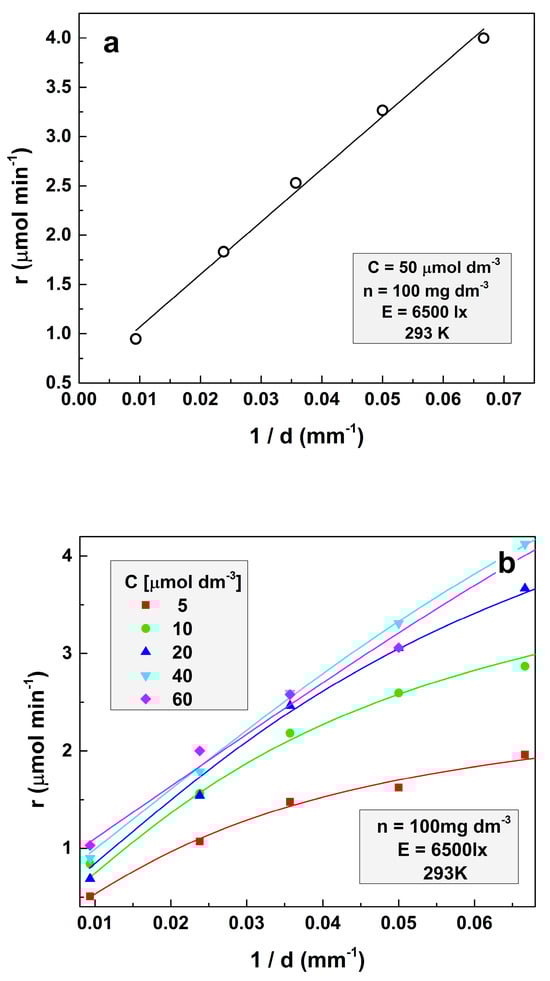
Figure 1.
Dependence of the reaction rate on the parameter d−1 at (a) the initial concentration of MO 50 μmol dm−3 and (b) for several different initial MO concentrations.
In turn, Figure 1b represents the dependencies of the reaction rate on the inverse solution depth (d−1) for several model contaminant concentrations. It is seen that the reaction rate increases at higher initial concentrations, as is expected. It is also seen that as the concentration increases, the line curvature gradually decreases. This effect occurs because the increase of the amount of methyl orange per unit volume of the solution results in less significance of the exponential term in Equation (6). This decrement of the exponential term influences, in turn, is a result of the decreasing role of the solution volume below the surface layer. Finally, a “compression” of the lines representing the dependence of the reaction rate on the parameter d−1 at higher solution concentrations is also observed. The experimental data in Figure 1b are fitted with Equation (1) (solid lines):
All experimental data were fitted simultaneously using Equation (1) with the same l, μ, and A, but with different apparent rate constant (ARC) values for each MO concentration, commented below. The following values were obtained: l = (3.54 ± 0.75) × 10−3 dm3 μmol−1, μ = (3.52 ± 0.58) × 10−4 dm3 mg−1, and A = (9.7 ± 1.2) × 10−5 dm6 mg−1 min−1. It is seen from the figures that Equation (1) fits the experimental data very well, demonstrating that Formula (5) is valid for the MO photodegradation by titanium dioxide. It is interesting to define the origin of constant A. Most probably, the occurrence of A is due to thermally activated charges. The verification of this probability requires additional experiments at different temperatures, which will be discussed in further reports.
In this case, the value of the apparent rate constant is more intriguing. Although the ARC values should be independent of the dye concentration, the experiments have shown that distinguishable ARC values are suitable for the respective MO initial concentrations. The respective results are presented by the respective symbols in Figure 2.
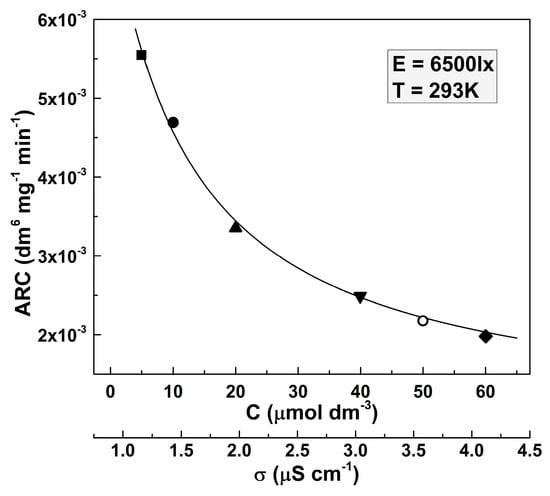
Figure 2.
Dependence of the apparent rate constant on the initial concentration of the MO solution (respectively, on the solution conductivity). The values were taken for illuminance 6500 lx and a temperature of 293 K.
It is seen that ARC decreases at higher dye solution concentrations. This result is not surprising, given the hyperbolic dependence of the reaction rate on the conductivity of the solution, found in [15]. The solution conductivity increases with the increase of the dissolved compound concentration. The dependence of the conductivity of the MO solution on its concentration is practically linear in the studied dye concentration ranges (where σ = 0.046C + 1.103, considering that σ is measured in μS cm−1 and C is measured in μmol dm−3). It is seen that the points determined by fitting the experimental data by Equation (2) reveal a clear trend, represented by the solid line in Figure 2. Equation (2) possesses the following form:
where ARC0 = (6.19 ± 0.22) × 10−3 dm6 mg−1 min−1 and a = (3.42 ± 0.22) × 10−2 dm3 μmol−1.
As mentioned in the theoretical background section, from a mathematical point of view, the case in which the product KC is not negligible should be considered as well. That would mean that Ka Kb. In this case, the adsorption equilibrium constant K should reach values above the 105–106 range. These values, in turn, would mean that K needs to be redefined.
If the experimental data presented in Figure 1 are fitted by Equation (3):
Then the values of the rate constant k and the adsorption equilibrium constant K could be determined independently. A fit of all experimental data by expression (3) leads to the acquisition of the following values: k = (0.175 ± 0.021) μmol dm3 mg−1 min−1, K = (3.64 ± 0.16) × 10−2 dm3 μmol−1, l = (3.51 ± 0.25) × 10−3 dm3 μmol−1, μ = (3.88 ± 0.71) × 10−4 dm3 mg−1, and A = (1.106 ± 0.012) × 10−4 dm6 mg−1 min−1.
2.2. The Effect of the Reflective Bottom
The results acquired from comparative experiments with vessels with reflective and non-reflective bottoms are illustrated in Figure 3.
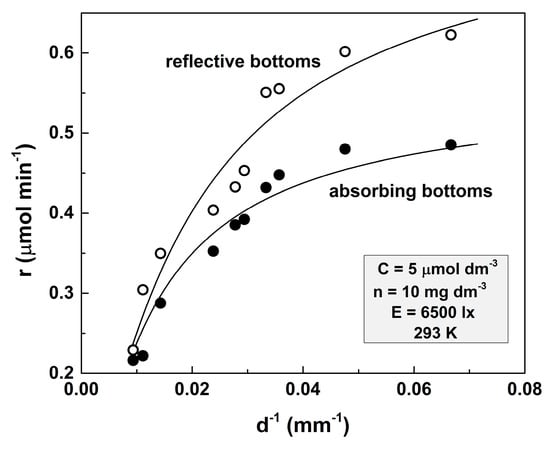
Figure 3.
Dependence of the photocatalytic reaction rate on the d−1 parameter for a transparent solution. The amount of the loaded TiO2 is 10 mg dm−3, the initial concentration of the MO solution is 5 μmol dm−3, the illumination is 6500 lx, and the temperature is 293 K.
Solid lines represent the theoretical fits according to Equations (3) and (4). The former equation was used for fitting the curve acquired for the light absorptive bottoms, whereas the latter one was applied for the experiments with reflective bottom vessels.
The values of the fitting parameters are as follows: l = (3.51 ± 0.25) × 10−3 dm3 μmol−1, μ = (3.88 ± 0.71) × 10−4 dm3 mg−1, A = (1.106 ± 0.012) × 10−4 dm6 mg−1 min−1, ε = (43.4 ± 6.2) %, and ARC = (1.32 ± 0.09) × 10−2 dm6 mg−1 min−1.
It can be seen that the reaction rate is significantly higher when vessels with reflective bottoms are used. This effect is much stronger at small depths, and at d = 107 mm, it is practically imperceptible.
The analysis of Figure 3 has led to the following inferences: (i) The experimental points deviations follow the same trend in both cases. These deviations occur due to the geometrical imperfections of the vessel bottoms (i.e., the bottoms are not ideally flat). That is why the solution layer’s depth is not perfectly definable. This effect is clearer when shallow vessels are used. (ii) The ARC value is higher than the value acquired for the same concentration of MO but with 100 mg dm−3. In general, when we suspend a substance with a low electrical conductivity in a liquid with a higher one, the conductivity of the resulting suspension decreases [16]. Therefore, the ARC values should be higher at higher amounts of dispersed TiO2. However, it turns out that when TiO2 is suspended in water, the conductivity of the resulting suspension increases. Thus, the conductivity of the 5 mg dm−3 TiO2 water suspension obtained with 1.1 μS cm−1 water is 1.5 μS cm−1 and for 100 mg dm−3 is 2.55 μS cm−1. This explains the lower ARC value obtained for a larger value of n.
The quantum efficiency QE estimate shows that the reflective bottom increases the QE by about 20 to 30%.
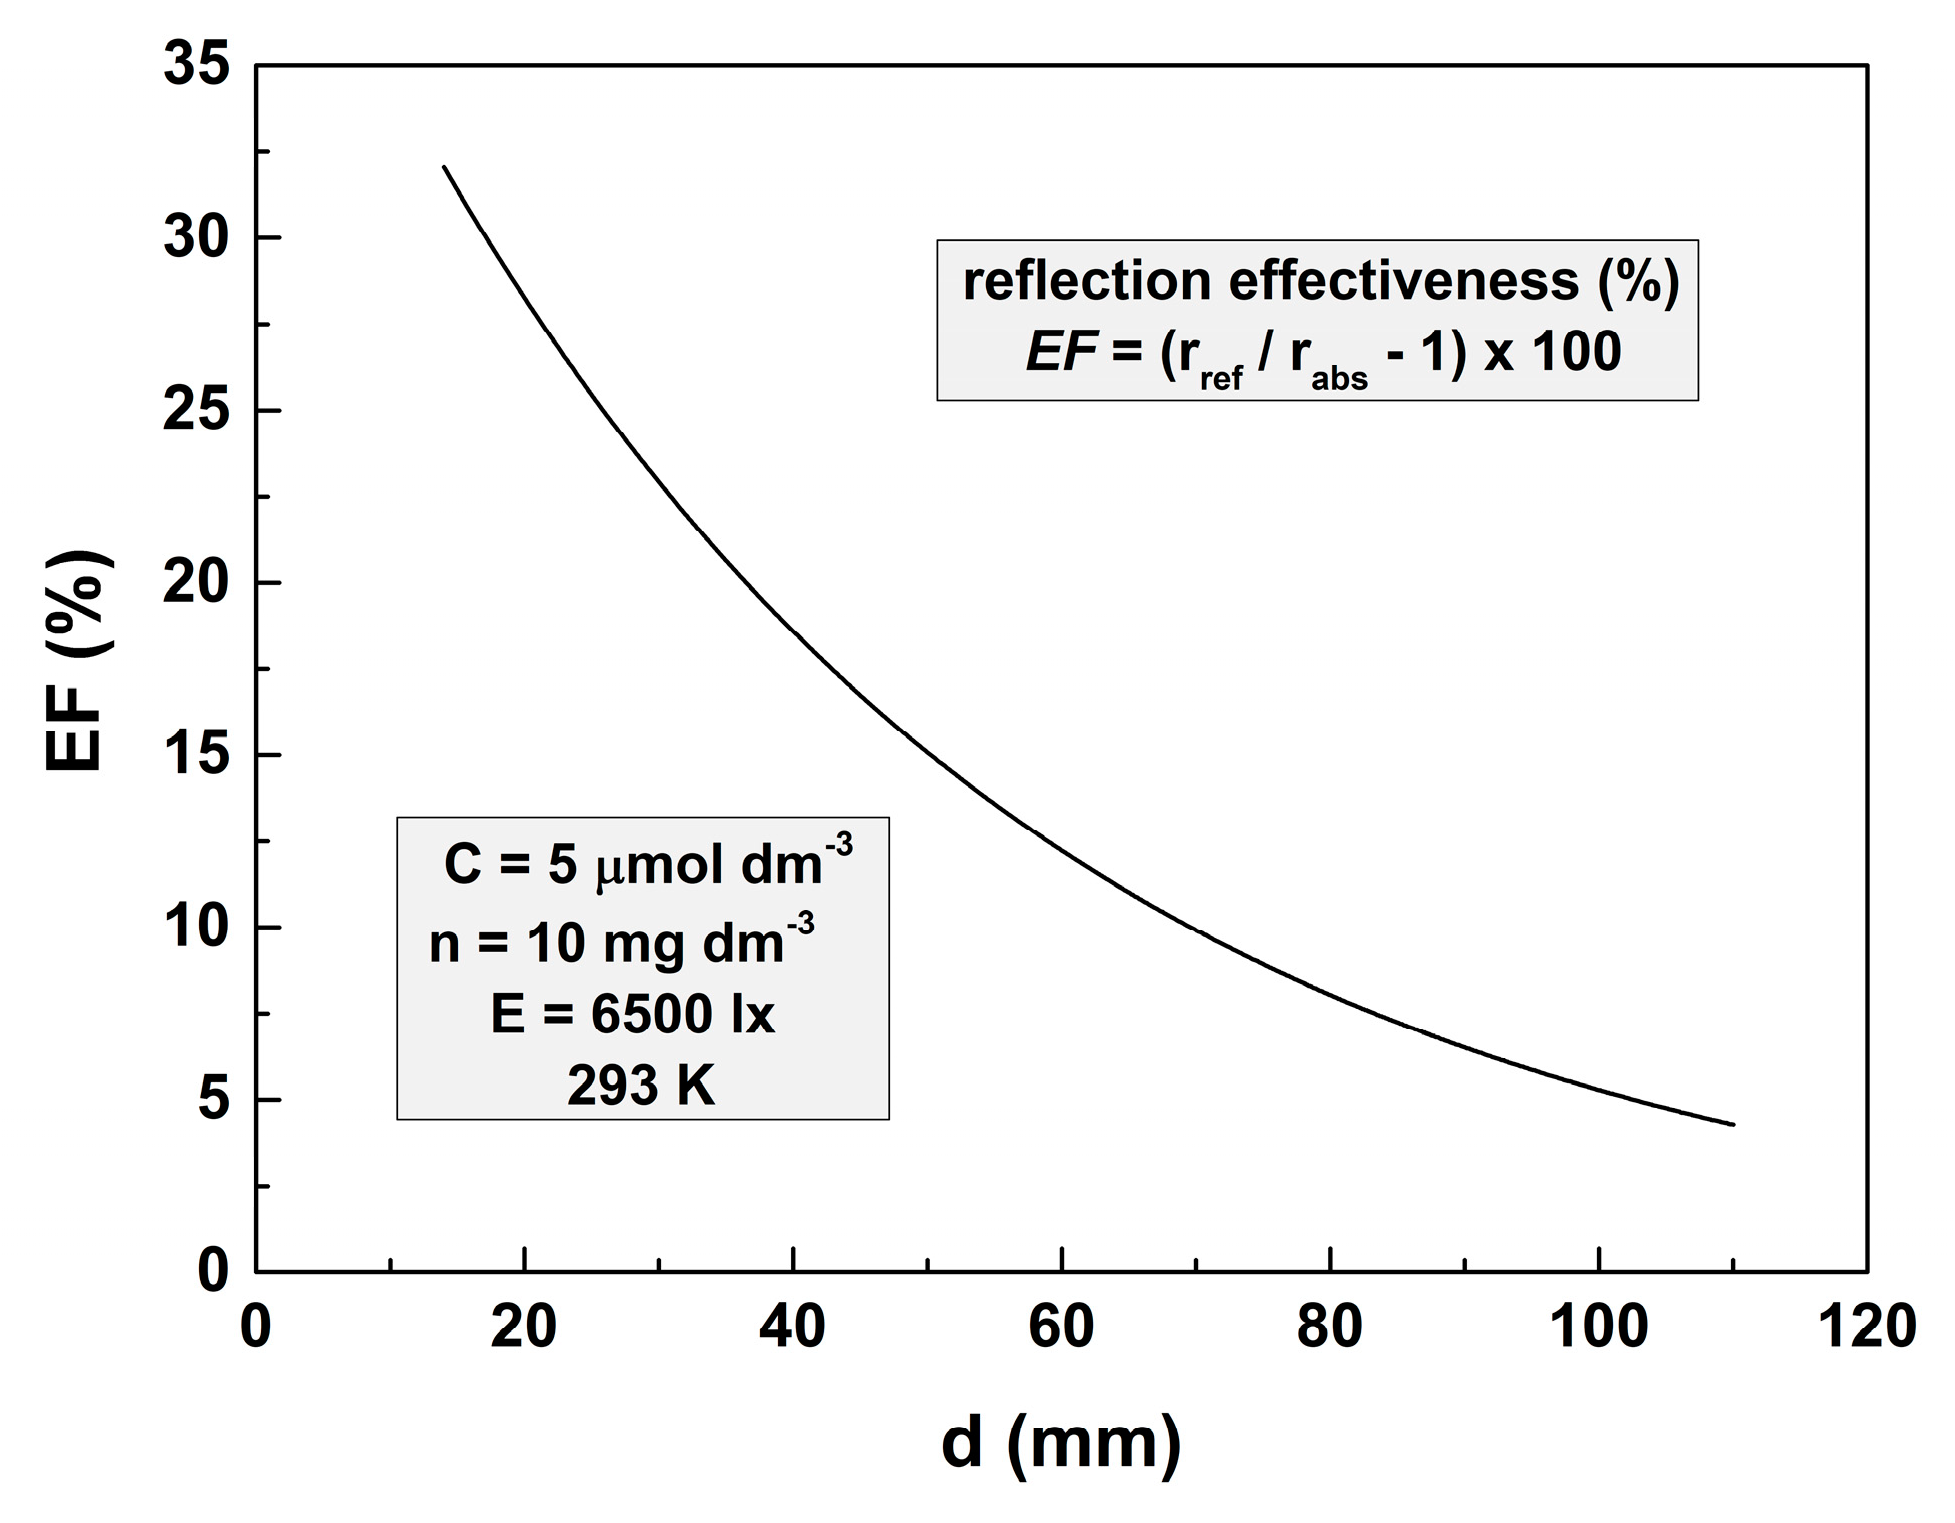
Let the effectiveness of bottom reflectivity be defined as EF = (rref/rabs − 1) × 100. The dependence of this parameter on the depth of the solution layer is represented in Figure 4. It shows that at depths higher than 50 mm, EF is lower than 10%. That is why it is very difficult to demonstrate the influence of the bottom reflectivity on the reaction rate.
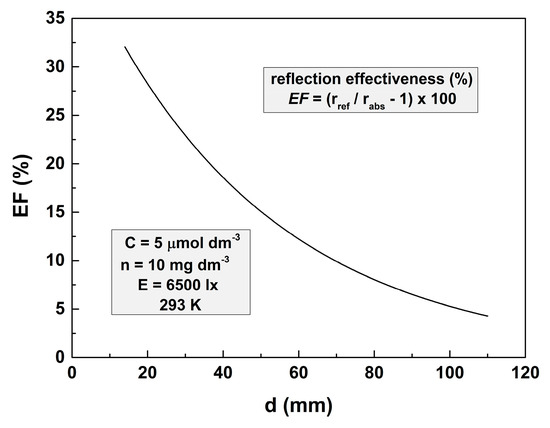
Figure 4.
Dependence of the bottom reflectance effectiveness on the thickness of the solution layer for photodegradation of 5 μmol dm−3 MO solution with 10 mg dm−3 TiO2. The illuminance is 6500 lx, and the temperature is 293 K.
Rather often, the photodegradation products of organic dyes are more toxic than the original dye [17]. Therefore, the question of what part of the photodegraded MO has undergone complete mineralization is important. For this purpose, TOC analyses were carried out. The results show that only about 14% of the photodecomposed dye has been completely mineralized. The remaining reaction products are organic.
3. Theoretical Background
In a previous study [14], Equation (5) was derived considering the Langmuir–Hinshelwood equation and the Beer–Lambert law.
where r is the reaction rate, k is the reaction rate constant (which should be independent of the contaminant concentration), C is the concentration of the degradation compound, K is the adsorption equilibrium constant, l is the light absorption coefficient of the contaminant, d is the depth of the solution, n is the amount of the photocatalyst powder (per unit solution), and μ is the coefficient of absorption/scattering of light by the powder.
Two alternative considerations are possible for the KC product, as described below:
3.1. When KC Possesses an Ignorable Value (i.e., )
According to our knowledge, this assumption is accepted by most researchers working in this field [18,19,20,21,22,23,24,25,26,27,28,29,30,31,32,33]. Indeed, K is defined as Kd/Ka [34], where Kd is the rate of desorption and Ka is the rate of adsorption on the TiO2 particle surface. This ratio is expected to be below 1. The concentration is usually measured in μmol dm−3 for convenience. However, it is more reasonable to represent it as a dimensionless quantity. As the molecular weight of the water is about 18.015 g mol−1 and there are about 55.5 mol in one dm−3 then 1 μmol dm−3 = 10−6 mol/55.5 mol = 1.8 × 10⁻⁸, and the dimensionless concentration of the substances used here is in the range of 10−6–10−7. Consequently, the product KC is indeed much lower than 1. If the representation , where ARC is the apparent rate constant, then the Formula (5) converts to Equation (6):
From Formulas (5) and (6), the reaction rate depends inversely on the solution depth d. Then, two subcases can be distinguished:
3.1.1. Low Solution Transparency
Then, the exponential term in Equation (6) could be omitted, and the result is:
The resulting expression is a linear dependence for the parameter d−1.
3.1.2. High Solution Transparency
In this case, the exponential term in Equation (6) cannot be omitted, and the dependence is more complicated.
3.2. When the KC Value Cannot Be Ignored (i.e., KC Comparable to 1)
Such a case was also considered here, although the KC product should always possess an insignificant value.
3.3. Decomposition Kinetics at the Occurrence of a Reflection from the Bottom
All considerations made so far exclude reflection from the bottom of the container. If the reflection coefficient of the bottom is high, an additional term is necessary to account for the reflected light. In this case, Equation (6) acquires the following form (8):
where ε is the reflection coefficient of the bottom of the vessel.
4. Materials and Methods
The model contaminant solutions were prepared by dissolving methyl orange (MO) (CAS 547-58-0) in double distilled water with conductivity σ = 1.1 μS cm−1.
Titanium dioxide powder (CAS 1317-70-0) (Nano Arc anatase, 99.9%, 32 nm S. A. 45 m2 g−1, product of Thermo Fisher-GmbH (Dreieich, Germany) was used as a photocatalyst at 100 mg dm−3 and 10 mg dm−3 concentrations. The TiO2 powder was separated by centrifugation before measuring the MO concentration.
The solution temperature was maintained at 293 K. The concentration of the solutions was monitored by measuring the solution’s transparency using a Jasco V670 UV–VIS spectrophotometer. The solution transparency was measured at 464 nm. The solution conductivity was measured by a Milwaukee MW806 MAX pH/EC/TDS meter.
A very transparent solution was chosen to demonstrate the effect of bottom reflectivity on the reaction rate. The concentration of the nanopowder was n = 10 mg dm−3, and the initial concentration of the MO solution was 5 μmol dm−3. Black paper applied in photography was used for light-absorbing bottoms, and aluminum foil was used for the reflective ones.
A Shimadzu TOC–L analyzer was used to measure the amount of organic carbon in our experiments. The samples were acidified with 1.5% HCl and barbutated for 90 s.
The experiments were carried out in a thermostated reactor supported by a magnetic stirrer. The volume of the methyl orange solution was 500 cm3. The reactor was illuminated by a 300 W Hanau quartz lamp. The luminous flux on the solution surface was 6500 lx (indirect sunlight) measured by a Mastech MS6610 luxmeter. The illumination times were 2 min. The experimental data were fitted by the program MINUIT [35].
5. Conclusions
The photocatalytic degradation rate of MO by TiO2 at several solution layer thicknesses and different initial concentrations of the dye was measured. The results were fitted by the equation proposed in previous research and by the use of MINUIT software. The results of the present study could be summarized as follows:
- (1)
- The apparent rate constant of the reaction decreases with the increase of the dye concentration according to a hyperbolic law. This correlation could be explained by the increased solution conductivities at higher MO concentrations. The curvatures of the lines, describing the dependence of the reaction rate on the solution depth, gradually weaken with increasing dye concentration;
- (2)
- It is possible to evaluate independently the values of the rate constant and the adsorption equilibrium constant for the photocatalytic degradation reaction if it is assumed that the value of the adsorption equilibrium constant could be greater than 105–106;
- (3)
- The use of a reflective bottom of the vessel could significantly increase the rate of the reaction in case of solutions with rather high transparency and relatively low layer thicknesses;
- (4)
- The effectiveness of the reflective bottom decreases with the increase of the solution layer thickness.
Finally, the dependence of the reaction rate on the solution layer thickness, commented in the present study, could be used as a powerful tool for studying photocatalytic reactions.
Author Contributions
E.L.: Conceptualization, Formal analysis, Investigation, Methodology, Writing—original draft. S.N.: Formal analysis, Methodology, Software, Validation. V.L.: Formal analysis, Investigation, Methodology, Writing—original draft, Visualization. C.G.: Writing—review and editing. S.K.: Writing—review and editing. All authors have read and agreed to the published version of the manuscript.
Funding
This study is funded by the European Union-Next Generation EU, through the National Recovery and Resilience Plan of the Republic of Bulgaria, project N° BG-RRP-2.004-0002, “BiOrgaMCT”. Also, equipment acquired with the financial support of INFRAMAT (contract No. Д01-322/30.11.2023) was used.
Data Availability Statement
Data will be made available on request.
Conflicts of Interest
The authors declare that they have no known competing financial interests or personal relationships that could have appeared to influence the work reported in this paper.
References
- Bobirică, L.; Bobirică, C.; Lupu, G.I.; Orbeci, C. Influence of operating parameters on photocatalytic oxidation of 2,4-dichlorofenol in aqueous solution by TiO2/stainless steel photocatalytic membrane. Appl. Sci. 2021, 11, 11664. [Google Scholar] [CrossRef]
- Blažeka, D.; Car, J.; Klobuchar, N.; Jurov, A.; Zavašnik, J.; Jagodar, A.; Kovachevich, E.; Krstulovi, N. Photodegradation of methylene blue and rhodamine B using laser synthesized ZnO nanoparticles. Materials 2020, 13, 4357. [Google Scholar] [CrossRef] [PubMed]
- Zhang, D.; Lv, S.; Luo, Z. A study on the photocatalytic degradation performance of a [KNbO3]0.9-[BaNi0.5Nb0.5O3−δ]0.1 perovskite. RSC Adv. 2020, 10, 1275–1280. [Google Scholar] [CrossRef] [PubMed]
- Yao, W.F.; Xu, X.H.; Wang, H.; Zhou, J.T.; Yang, X.N.; Zhang, Y.; Shang, S.X.; Huang, B.B. Photocatalytic property of perovskite bismuth titanate. Appl. Catal. B Environ. 2004, 52, 109–116. [Google Scholar] [CrossRef]
- Borji, S.H.; Nasseri, S.; Mahvi, A.H.; Nabizadeh, R.; Javadi, A.H. Investigation of photocatalytic degradation of phenol by Fe(III)-doped TiO2 and TiO2 nanoparticles. J. Environ. Health Sci. Eng. 2014, 12, 101. [Google Scholar] [CrossRef] [PubMed]
- San, N.; Hatipoǧlu, A.; Koçtürk, G.; Çınar, Z. Prediction of primary intermediates and the photodegradation kinetics of 3-aminophenol in aqueous TiO2 suspensions. J. Photochem. Photobiol. A 2001, 139, 225–232. [Google Scholar] [CrossRef]
- Bahrudin, N. Evaluation of degradation kinetic and photostability of immobilized TiO2/activated carbon bilayer photocatalyst for phenol removal. Appl. Surf. Sci. Adv. 2022, 7, 100208. [Google Scholar] [CrossRef]
- Chen, S.; Liu, J.; Liu, P.; Yu, B. Investigation of photocatalytic degradation of methyl orange by using nano-sized ZnO catalysts. Adv. Chem. Eng. Sci. 2011, 1, 9–14. [Google Scholar] [CrossRef]
- Mohamed, R.; Mkhalid, I.; Baeissa, E.; Al-Rayyani, M. Photocatalytic degradation of methylene blue by Fe/ZnO/SiO2 nanoparticles under visible light. J. Nanotechnol. 2012, 2012, 329082. [Google Scholar] [CrossRef]
- Neena, D.; Kondamareddy, K.; Bin, H.; Lu, D.; Kumar, P.; Dwivedi, R.K.; Pelenovich, V.; Zhao, X.; Gao, W.; Fu, D. Enhanced visible light photodegradation activity of RhB/MB from aqueous solution using nanosized novel Fe-Cd co-modified ZnO. Sci. Rep. 2018, 8, 10691. [Google Scholar] [CrossRef]
- Bhapkar, A.; Prasad, R.; Jaspal, D.; Shirolkar, M.; Gheisari, K.; Bhame, S. Visible light driven photocatalytic degradation of methylene blue by ZnO nanostructures synthesized by glycine nitrate auto combustion route. Inorg. Chem. Commun. 2023, 148, 110311. [Google Scholar] [CrossRef]
- Saquib, M.; Muneer, M. TiO2-mediated photocatalytic degradation of a triphenylmethane dye (gentian violet), in aqueous suspensions. Dyes Pigm. 2003, 56, 37–49. [Google Scholar] [CrossRef]
- Megatif, L.; Dillert, R.; Bahnemann, D. Reaction rate study of the photocatalytic degradation of dichloroacetic acid in a black body reactor. Catalysts 2019, 9, 635. [Google Scholar] [CrossRef]
- Lilov, E.; Lilova, V.; Nedev, S.; Adam, A.M.; Kozhukharov, S.; Girginov, C. Depth dependence of the photocatalytic reaction rate. kinetic model generalization. Phys. Scr. 2023, 98, 095001. [Google Scholar] [CrossRef]
- Kaur, J.; Bansal, S.; Singhal, S. Photocatalytic degradation of methyl orange using ZnO nanopowders synthesized via thermal decomposition of oxalate precursor method. Phys. B Condens. Matter 2013, 416, 33–38. [Google Scholar] [CrossRef]
- Vallejo, W.; Cantillo, A.; Díaz-Uribe, C. Methylene blue photodegradation under visible irradiation on Ag-doped ZnO thin films. Int. J. Photoenergy 2020, 2020, 1627498. [Google Scholar] [CrossRef]
- Srisai, J.; Muangnapoh, T.; Vas-Umnuay, P. Comparative study on photocatalytic degradation of methylene blue using pristine ZnO and Ni/ZnO composite films. Mater. Today Proceed. 2022, 66, 3168–3173. [Google Scholar] [CrossRef]
- Eswaran, P.; Madasamy, P.; Pillay, K.; Brink, H. Sunlight-driven photocatalytic degradation of methylene blue using ZnO/biochar nanocomposite derived from banana peels. Biomass Conv. Biorefin. 2024, 2024, 1–21. [Google Scholar] [CrossRef]
- Negash, A.; Mohammed, S.; Weldekirstos, H.; Ambaye, A.; Gashu, M. Enhanced photocatalytic degradation of methylene blue dye using eco-friendly synthesized rGO@ZnO nanocomposites. Sci. Rep. 2023, 13, 22234. [Google Scholar] [CrossRef]
- Di Mauro, A.; Fragalà, M.; Privitera, V.; Impellizzeri, G. ZnO for application in photocatalysis: From thin films to nanostructures. Mater. Sci. Semicond. Process. 2017, 69, 44–51. [Google Scholar] [CrossRef]
- Shakoor, M.H.; Shakoor, M.B.; Jilani, A.; Ahmed, T.; Rizwan, M.; Dustgeer, M.; Iqbal, J.; Zahid, M.; Yong, J. Enhancing the photocatalytic degradation of methylene blue with graphene oxide-encapsulated g-C3N4/ZnO ternary composites. ACS Omega 2024, 9, 16187–16195. [Google Scholar] [CrossRef]
- Rafi, J.A.; Kanda, Y.; Honda, M.; Ichikawa, Y. Annealing effects of ZnO thin film on photocatalytic performances of graphene composites. C J. Carbon Res. 2023, 10, 4. [Google Scholar] [CrossRef]
- Widyastuti, E.; Hsu, J.-L.; Lee, Y.-C. Insight on photocatalytic and photoinduced antimicrobial properties of ZnO thin films deposited by HiPIMS through thermal oxidation. Nanomaterials 2022, 12, 463. [Google Scholar] [CrossRef] [PubMed]
- Rabeel, M.; Javed, S.; Khan, R.; Akram, M.; Rehman, S.; Kim, D.; Khan, M. Controlling the wettability of ZnO thin films by spray pyrolysis for photocatalytic applications. Materials 2022, 15, 3364. [Google Scholar] [CrossRef]
- Chebwogen, J.; Maghanga, C. Fabrication and characterization of cobalt-pigmented anodized zinc for photocatalytic application. Int. J. Thin. Film. Sci. Technol. 2020, 9, 127–132. [Google Scholar] [CrossRef]
- Cambrussi, A.; Morais, A.; Neris, A.; Osajima, J.; Filho, E.; Ribeiro, A. Photodegradation study of TiO2 and ZnO in suspension using miniaturized tests. Matéria (Rio J.) 2019, 24, e12482. [Google Scholar] [CrossRef]
- Mittal, M.; Sharma, M.; Pandey, O.P. UV–Visible light induced photocatalytic studies of Cu doped ZnO nanoparticles prepared by co-precipitation method. Sol. Energy 2014, 110, 386–397. [Google Scholar] [CrossRef]
- Harito, C.; Zaidi, S.; Bavykin, D.; Martins, A.; Yuliarto, B.; Walsh, F.; de León, C. PbO2 decorated ZnO-TiO2 core-shell nanoflower structures by zinc anodising for photo- and anodic degradation of Reactive Black-5 dye. Adv. Nat. Sci. Nanosci. Nanotechnol. 2020, 11, 035018. [Google Scholar] [CrossRef]
- Semeraro, P.; Bettini, S.; Sawalha, S.; Pal, S.; Licciulli, A.; Marzo, F.; Lovergine, N.; Valli, L.; Giancane, G. Photocatalytic degradation of tetracycline byZnO/γ-Fe2O3 paramagnetic nanocomposite material. Nanomaterials 2020, 10, 1458. [Google Scholar] [CrossRef]
- Asefa, G.; Negussa, D.; Lemessa, G.; Alemu, T. The study of photocatalytic degradation kinetics and mechanism of malachite green dye on Ni–TiO2 surface modified with polyaniline. J. Nanomater. 2024, 2024, 5259089. [Google Scholar] [CrossRef]
- Tran, H.; Nguyen, D.; Do, P.; Tran, U. Kinetics of photocatalyt.ic degradation of organic compounds: A mini-review and new approach. RSC Adv. 2023, 13, 16915–16925. [Google Scholar] [CrossRef] [PubMed]
- James, F.; Roos, M. Minuit—A system for function minimization and analysis of the parameter errors and correlations. Comput. Phys. Commun. 1975, 10, 343–367. [Google Scholar] [CrossRef]
- Lilov, E.; Nedev, S.; Lilova, V.; Kozhukharov, S.; Girginov, C. Solution conductivity as a factor determining the photocatalytic reaction rate. J. Photochem. Photobiol. 2024, 21, 100240. [Google Scholar] [CrossRef]
- Banisi, S.; Finch, J.A.; Laplante, A.R. Electrical conductivity of dispersions: A review. Miner. Eng. 1993, 6, 369–385. [Google Scholar] [CrossRef]
- Chen, T.; Zheng, Y.; Lin, J.-M.; Chen, G. Study on the photocatalytic degradation of methyl orange in water using Ag/ZnO as catalyst by liquid chromatography electrospray ionization ion-trap mass spectrometry. J. Am. Soc. Mass Spectrom. 2008, 19, 997–1003. [Google Scholar] [CrossRef]


Disclaimer/Publisher’s Note: The statements, opinions and data contained in all publications are solely those of the individual author(s) and contributor(s) and not of MDPI and/or the editor(s). MDPI and/or the editor(s) disclaim responsibility for any injury to people or property resulting from any ideas, methods, instructions or products referred to in the content. |
© 2025 by the authors. Licensee MDPI, Basel, Switzerland. This article is an open access article distributed under the terms and conditions of the Creative Commons Attribution (CC BY) license (https://creativecommons.org/licenses/by/4.0/).