Article

Preparation of Oxygen Reduction Catalyst Electrodes by an Efficient Electrodeposition Method on HNO3-Activated Carbon Paper

1
State Key Laboratory of Chemical Engineering, East China University of Science and Technology, Shanghai 200237, China
2
State Key Laboratory of Green Chemical Engineering and Industrial Catalysis, School of Chemical Engineering, East China University of Science and Technology, Shanghai 200237, China
*
Author to whom correspondence should be addressed.
Catalysts 2025, 15(4), 403; https://doi.org/10.3390/catal15040403
Submission received: 28 February 2025 / Revised: 8 April 2025 / Accepted: 15 April 2025 / Published: 21 April 2025
(This article belongs to the Section Industrial Catalysis)

Abstract

:
The proton exchange membrane fuel cell (PEMFC) is a promising energy conversion technology. The synthesis route of the cathode oxygen reduction catalyst electrode is an important factor affecting the development of the battery. In traditional technology, Pt shows low utilization of oxygen reduction activity due to poor contact between catalyst nanoparticles (NP), the electrolyte, and oxygen. In this work, an effective electrochemical method for the preparation of a Pt/C catalyst electrode was proposed. The carbon paper (CP) substrate was electrochemically activated by HNO3, and then, Pt nanoparticles were prepared on CP by one-step electrodeposition. Secondly, a Density Functional Theory (DFT) investigation was carried out to elucidate that the N-doped catalyst facilitates the desorption of intermediates from the catalyst surface and promotes the oxygen reduction reaction. Thirdly, the effects of acid activation voltage were discussed. The result shows that increasing the voltage significantly increases the concentration of C–N groups and decreases the particle size of Pt. The effects of acidification concentration were investigated at an optimal activation voltage of 1.6 V. When the activation concentration was 0.1 mol, Pt0 reached an optimal value, and therefore obtained an equilibrium between the adsorption of oxygen on Pt and the desorption of the intermediates. Pt/0.1CP1.6 exhibits better performance than commercial catalysts in oxygen reduction reactions. After 5000 testing cycles, the catalyst showed a constant durability with only a 3.0 mV·dec−1 increase of the Tafel slope and just a 6.7 m2·gPt−1 decline of the ECSA.

1. Introduction

Hydrogen fuel cell technology is a key pathway for the widespread application of hydrogen energy. Hydrogen fuel cells convert the chemical energy of hydrogen and oxygen into electrical energy, producing environmentally friendly water and thermal energy as byproducts [1]. Among these, proton exchange membrane fuel cells (PEMFCs) exhibit high energy density and excellent climate compatibility, making them crucial for reducing carbon emissions and replacing traditional internal combustion engines [2]. Among the various challenges faced by PEMFCs, the synthesis methods and materials of cathode oxygen reduction reaction (ORR) catalysts are key factors affecting fuel cell performance [3]. Nitrogen-doped carbon materials have garnered widespread attention due to their low cost, abundant raw materials, and outstanding catalytic performance [4].
Pajootan et al. [5] employed RF-PAPLD technology to deposit a thin layer of titanium oxynitride (TiOxNy) directly on multi-walled carbon nanotubes (MWCNTs) grown on a stainless steel mesh, followed by PLD to coat the structure with a small, well-dispersed amount of platinum (Pt) nanoparticles in an inert atmosphere. Their study found that the Pt/TiOxNy-0.03Torr-30 W/MWCNT electrode demonstrated excellent oxygen reduction reaction (ORR) activity, achieving a peak current density of 180 mA cm−2. In comparison, a commercial Pt/C electrode with the same Pt loading produced a current density of only 105 mA·cm−2 at 0.5 V. Zhao et al. [6] synthesized carbon materials with dual nitrogen-doped interfaces and an ordered porous structure (DN-OPC) using a one-step chemical vapor deposition method. Treated at 750 °C for 4 h, DN-OPC exhibited two types of ordered mesoporous structures and a high specific surface area (1430 m2/g). As an ORR catalyst, DN-OPC displayed activity comparable to that of commercial Pt/C catalysts, along with excellent durability and methanol tolerance. Liang et al. [7] investigated, via theoretical calculations, the effects of co-doping graphitic nitrogen and pyridinic nitrogen on the structural stability and ORR activity of nitrogen-doped graphene (NDG). Co-doping significantly improved the stability of NDG, with the triangular pore structures in co-doped configurations exhibiting higher ORR activity than those with single-doping structures. Lan et al. [8] successfully prepared defect-rich, pyridinic nitrogen-dominated, self-supported carbon paper electrodes using hydrothermal treatment and in situ electrochemical exfoliation. Utilizing this electrode as the cathode and persulfate as the oxidant, the membraneless DLFC displayed remarkable cell performance, with an open-circuit voltage reaching 2.13 V and a maximum power density of 241.0 mW cm−2.
The catalyst film electrode can eliminate the carbon corrosion and ionomer poisoning of the catalyst by directly depositing on the structured PEM or GDL. By removing the dispersed carbon phase and ionized phase of the electrode, they provide a simpler interface and fewer degradation modes. Egetenmeyer et al. [9] prepared Pt and Pt3Co catalyst electrodes by pulse electrodeposition. The performance of the PEMFC was significantly improved by plasma activation of the GDL. The GDL surface seems to be slightly covered by a PTFE layer at the beginning. After the layer is gradually removed by plasma pretreatment, some carbon particles are no longer electrically insulated and are easier to be used in the electrodeposition process. Eiler et al. [10] synthesized, immobilized, and distributed Pt alloy nanoparticles in one step by an electrodeposition method, and the ORR mass activity of the catalyst was as high as 10 A·mgPt−1. Since the nanoparticles are in direct contact with the carbon carrier and PEM, almost all Pt will promote the ORR reaction, which has extremely high efficiency in Pt utilization. Shen et al. [11] used N, N-dimethylformamide (DMF) to form a complex with Pt to facilitate the uniform loading of Pt and obtained a highly active PtCo catalyst by applying a constant voltage method. This method does not require long-chain surfactants, and the ORR activity of the prepared catalyst is excellent in electrochemical tests. The half-wave potential is 0.91 V, and the specific activity is six times larger than that of commercial Pt/C, which is 1.52 mA·cm−2. Hornberger et al. [12] investigated the role of carbon nitrogen doping and pyridinic-N content in enhancing proton exchange membrane fuel cell (PEMFC) performance. Their approach involved synthesizing N-modified catalysts by depositing uniformly dispersed platinum nanoparticles (Pt NPs) onto nitrogen-doped carbon supports (N-C). Electrochemical characterization revealed that MEA utilizing the N-doped Vulcan catalyst exhibited superior overall performance compared to those fabricated with commercial Vulcan XC 72R carbon.
Carbon paper (CP) features a unique layered fiber structure, well-developed conductive pathways, excellent mechanical strength, outstanding electrical conductivity, smooth surface characteristics, and high gas permeability. These attributes make carbon paper valuable for potential applications across various fields [13,14]. However, due to its low content of surface polar functional groups, limited active surface area, and low hydrophilicity, many researchers have employed various modification methods to enhance its properties [15]. He et al. [16] treated carbon paper with hydrothermal ammonia, increasing its nitrogen content from 2.957% to 6.432%. The smoothness and morphology of the carbon paper remained unchanged post-treatment, but its hydrophilicity was enhanced due to the introduction of nitrogen-containing groups. The sample, when treated at 220 °C for 15 h, exhibited optimal electrochemical activity and charge-discharge performance. At a current density of 20 mA cm2, the fabricated battery achieved a Coulombic efficiency, voltage efficiency, and energy efficiency of 97.2%, 85.3%, and 82.9%, respectively, after 50 cycles. Liu et al. [17] increased the porosity of carbon paper by growing carbon nanofibers (CNFs) in situ on its surface. The microporous CNF/carbon paper exhibited suitable hydrophobicity and low interlayer resistance, achieving a power density of up to 1.21 W cm2 at 100% relative humidity, which is 26% higher than that of traditional gas diffusion layers (GDLs).
Nevertheless, with the conventional methods for preparing catalyst electrodes some problems remain. The agglomeration of carbon particles and ionomers results in the underutilization of carbon-loaded Pt-based catalysts [18,19]. Furthermore, the lengthy preparation period and intricate synthesis process result in the premature dissolution of Pt nanoparticles and corrosion of the carbon carriers [20,21,22], which accelerates the degradation process of the catalyst electrode and affects the efficiency of the oxygen reduction kinetics.
In this work, an electrochemical activation method was proposed to effectively prepare Pt/C catalysts. Carbon paper containing nitrogen and oxygen functional groups could be obtained by activating the surface of the carbon paper, enhancing the degree of surface defects to provide more metal deposition sites. The electrodeposition technology also helps to improve the utilization efficiency of Pt. This one-step method is simple and fast for the preparation of catalysts directly supported on carbon paper, which helps to save production costs. Firstly, the effects of catalysts with different activation voltages on the oxygen reduction reaction were discussed. The effect of voltage on C–N group and Pt particle size was evaluated by the performance test of the catalyst electrode combined with scanning electron microscopy (SEM), Fourier transform infrared (FTIR), X-ray photoelectron spectroscopy (XPS), X-ray diffraction (XRD), and Raman. Secondly, the effect of activation concentration on the oxygen reduction reaction was discussed under the optimum activation voltage. The changes of the proportion of various Pt valence states and Pt particle size under different activation concentrations were analyzed by scanning electron microscopy (SEM) and X-ray photoelectron spectroscopy (XPS). Finally, the performance of different catalyst electrodes was compared using the onset potential, electrochemical active surface area (ECSA), and Tafel slope.

2. Results and Discussions

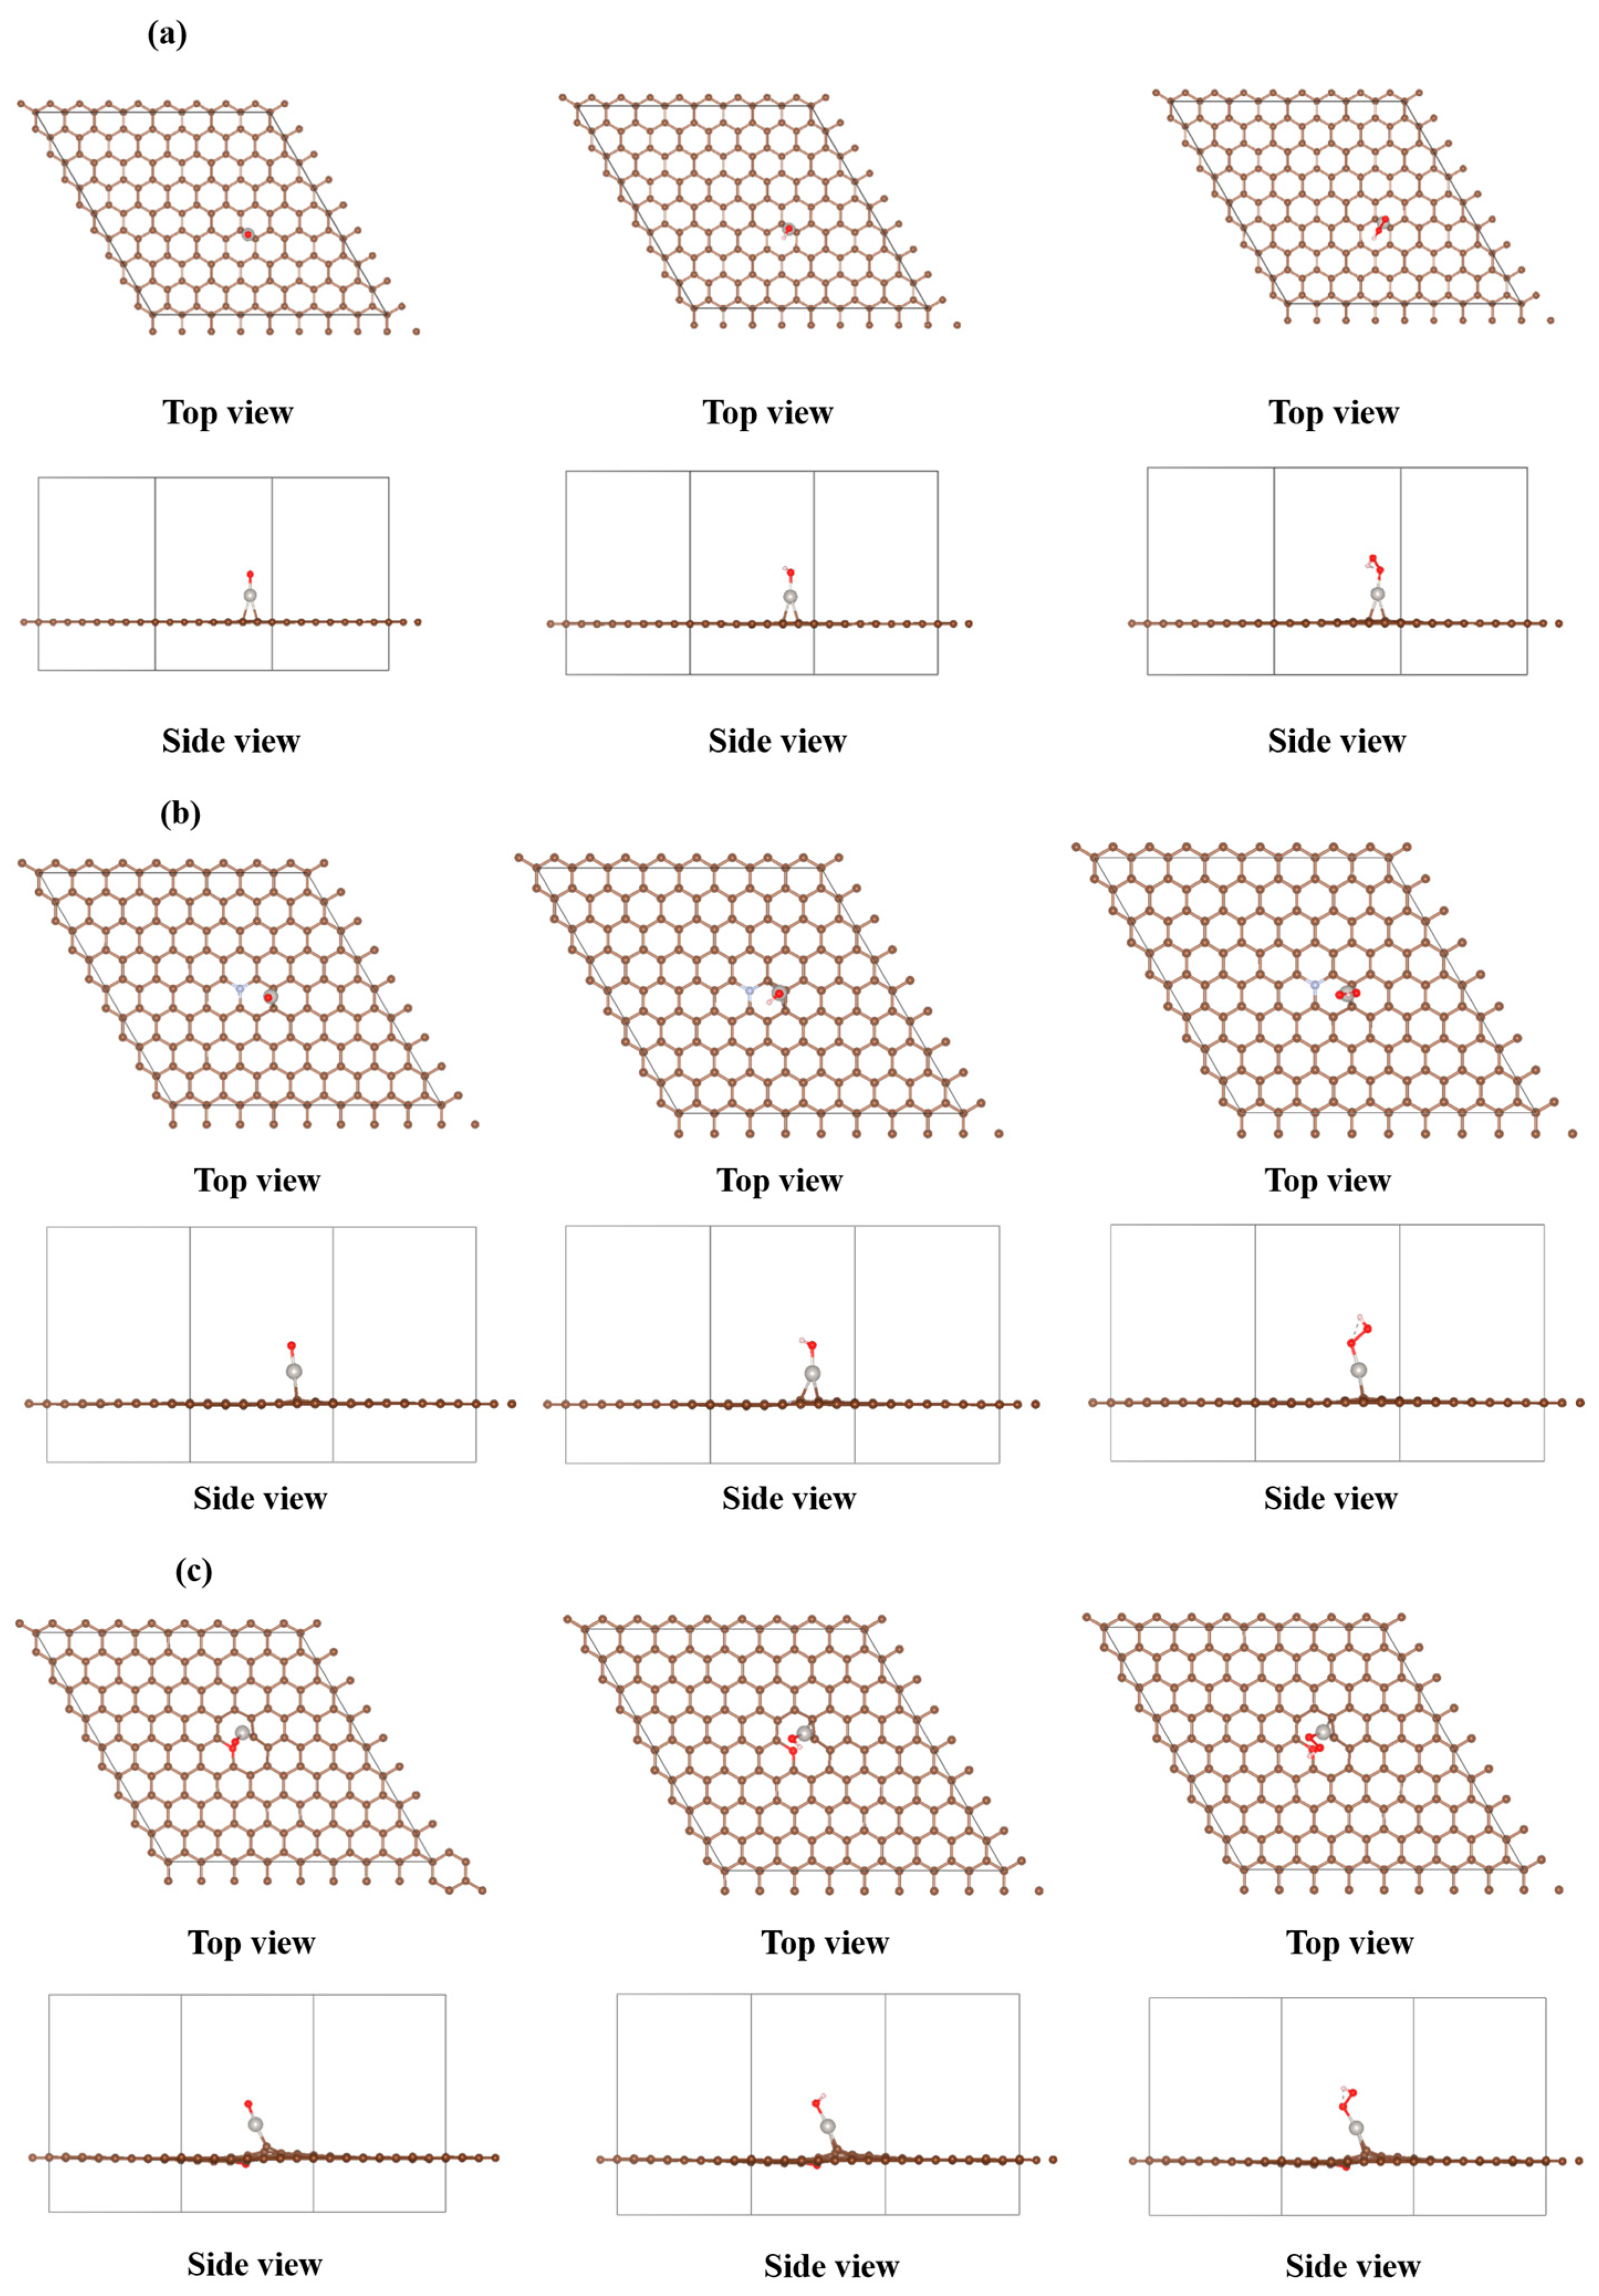
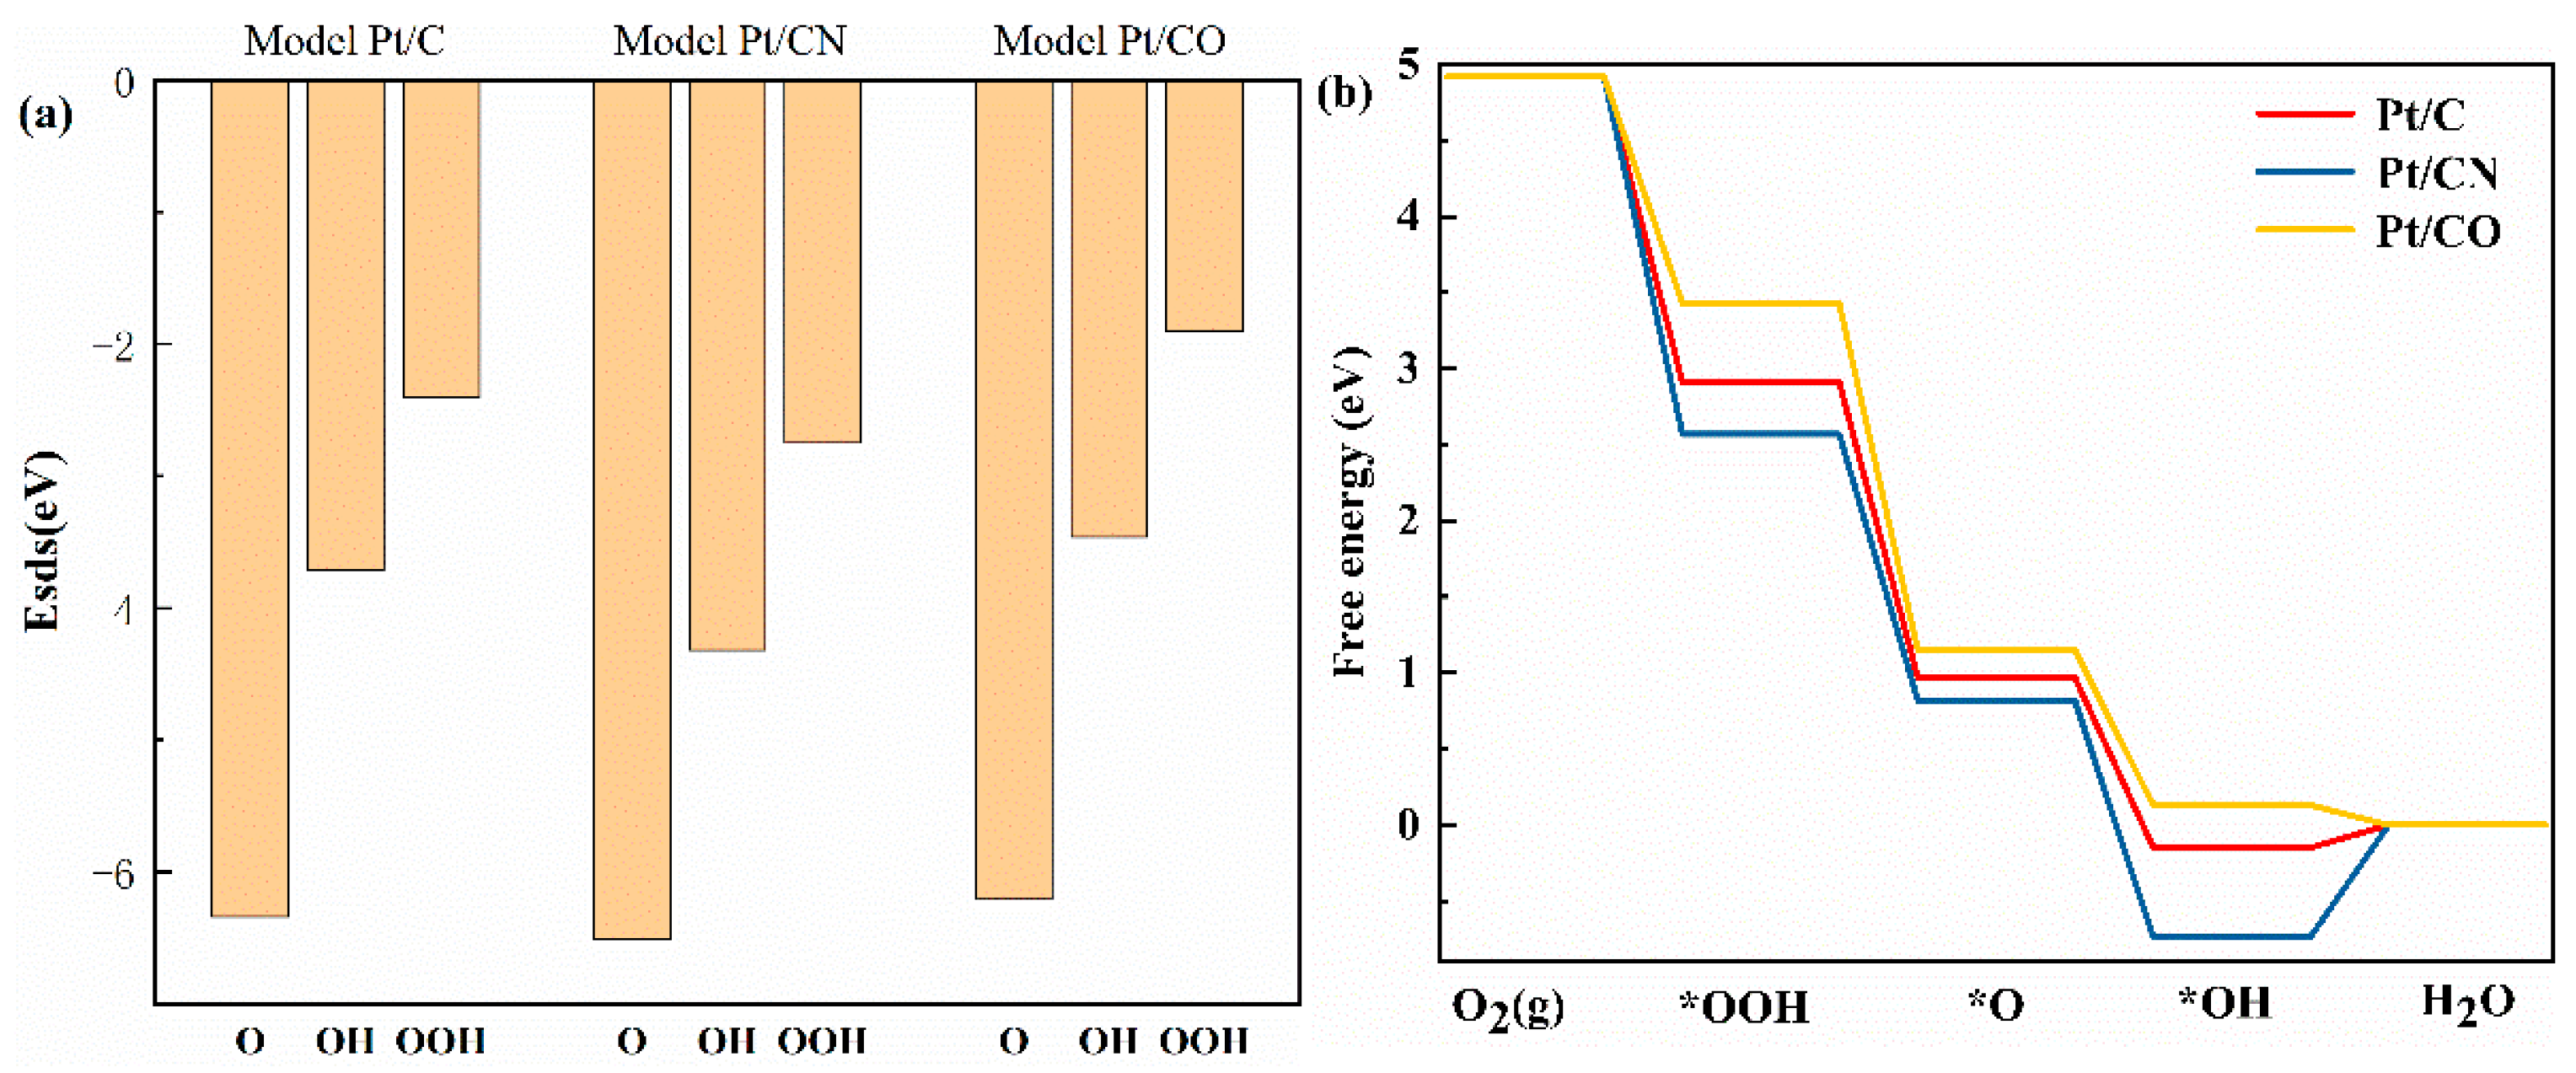
2.1. DFT Investigation on the Influence of Pt Loaded on N/O-Doped Carbon Supports in the Oxygen Reduction Reaction

The objective of this investigation is to ascertain the impact of N doping of the carbon carriers in the oxygen reduction reaction (ORR) on Pt/C catalysts. The interactions between the metal carriers and the properties of the charge distribution, density of states, and d-band centers were analyzed using the Density Functional Method. Additionally, the adsorption of ORR species on the catalysts was investigated, and the ORR overpotential was calculated.
As shown in Figure 1, for the Pt/C model, the interaction between the adsorbates and Pt does not alter the original adsorption configuration of the Pt atoms. The O atom bonds with Pt. For the Pt/CN model, the interaction between the adsorbates and both the Pt and N atoms modifies the original adsorption position of the Pt atom on the CN support, bringing it closer to the N atom. However, the Pt atom still adsorbs in a bridge configuration between two C atoms. The O atom tends to adsorb at the top of Pt, slightly towards the N atom. For the OH species, the optimal adsorption configuration has the O atom adsorbed at the top of Pt, with the H atom closer to the N-doped C ring. The OOH species also has an O atom adsorbed at the top of Pt. For the Pt/CO model, the interaction between the adsorbates and the Pt atom slightly alters the position of Pt, which deviates from its original site on the CO support. Similar to the other models, the O atoms from the species adsorb at the top of the Pt atoms. This demonstrates how the interactions between the Pt and the doping elements (N or CO) influence the adsorption configurations and energetics of intermediates during the ORR process on Pt-based catalysts.
The adsorption energy of each species in the ORR is lowest for the Pt/CN model, as shown in Figure 2a, indicating the weakest adsorption. This facilitated the desorption of intermediates from the catalyst surface, thereby promoting the ORR reaction. This suggested that N-doping enhance the reaction activity by weakening the adsorption of intermediates.
In order to evaluate the performance of an electrocatalytic material, the elementary reactions are illustrated in Equations (1)–(4).
* + O 2 + 4 ( H + + e ) * OOH + 3 ( H + + e )
* OOH + 3 ( H + + e ) * O + H 2 O + 2 ( H + + e )
* O + H 2 O + 2 ( H + + e ) * OH + H 2 O + ( H + + e )
* OH + H 2 O + ( H + + e ) * + 2 H 2 O
The alterations in Gibbs free energy on disparate catalysts are illustrated in Figure 2b. In the free energy diagram, the elementary reaction step with the smallest energy decrease was identified as the overpotential, corresponding to the reaction between OH* and a proton to form H2O. In the case of the ORR process, the actual electrode potential (U) was in alignment with the energy of the step exhibiting the smallest energy decrease. In contrast, the theoretical equilibrium potential (U_eq) was 1.23 V. The calculated overpotentials (η) for the ORR on the Pt/C, Pt/CN, and Pt/CO catalysts were 1.38 V, 1.97 V, and 1.10 V, respectively. The lower overpotential of the ORR on the Pt/CO catalyst in comparison to Pt/C suggested that the presence of oxygen atoms on the support could serve to reduce the ORR overpotential and enhanced the ORR catalytic performance.

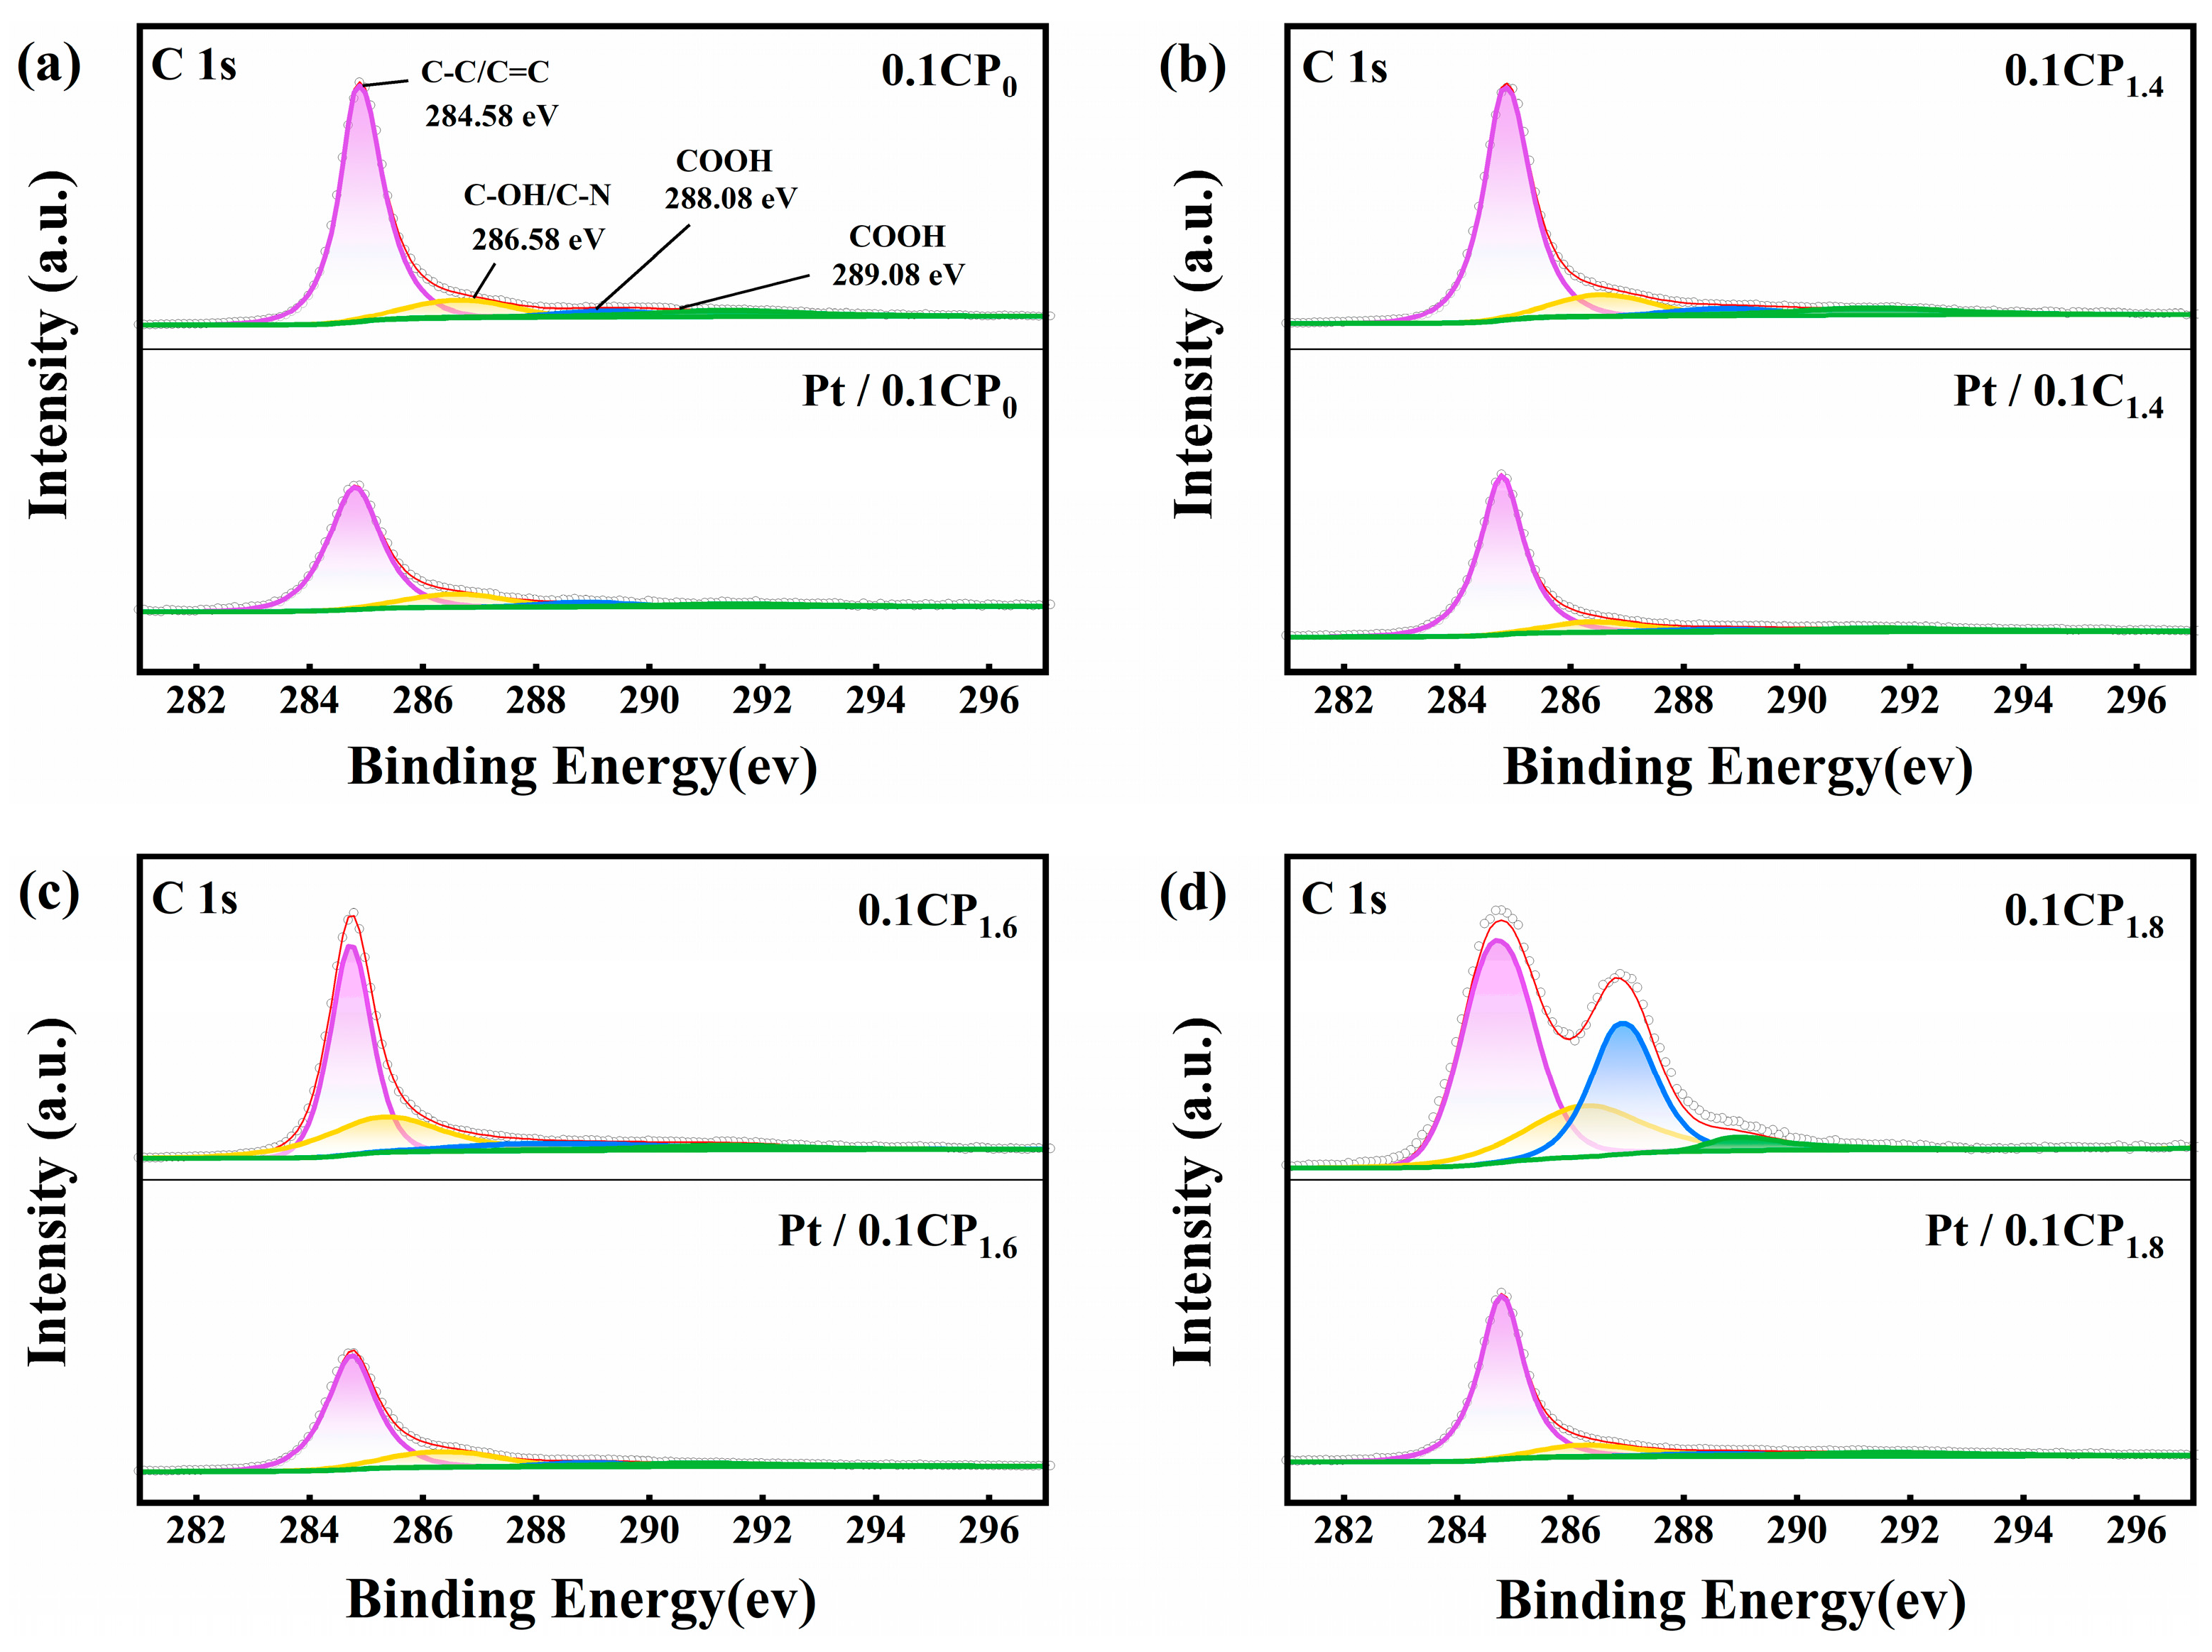
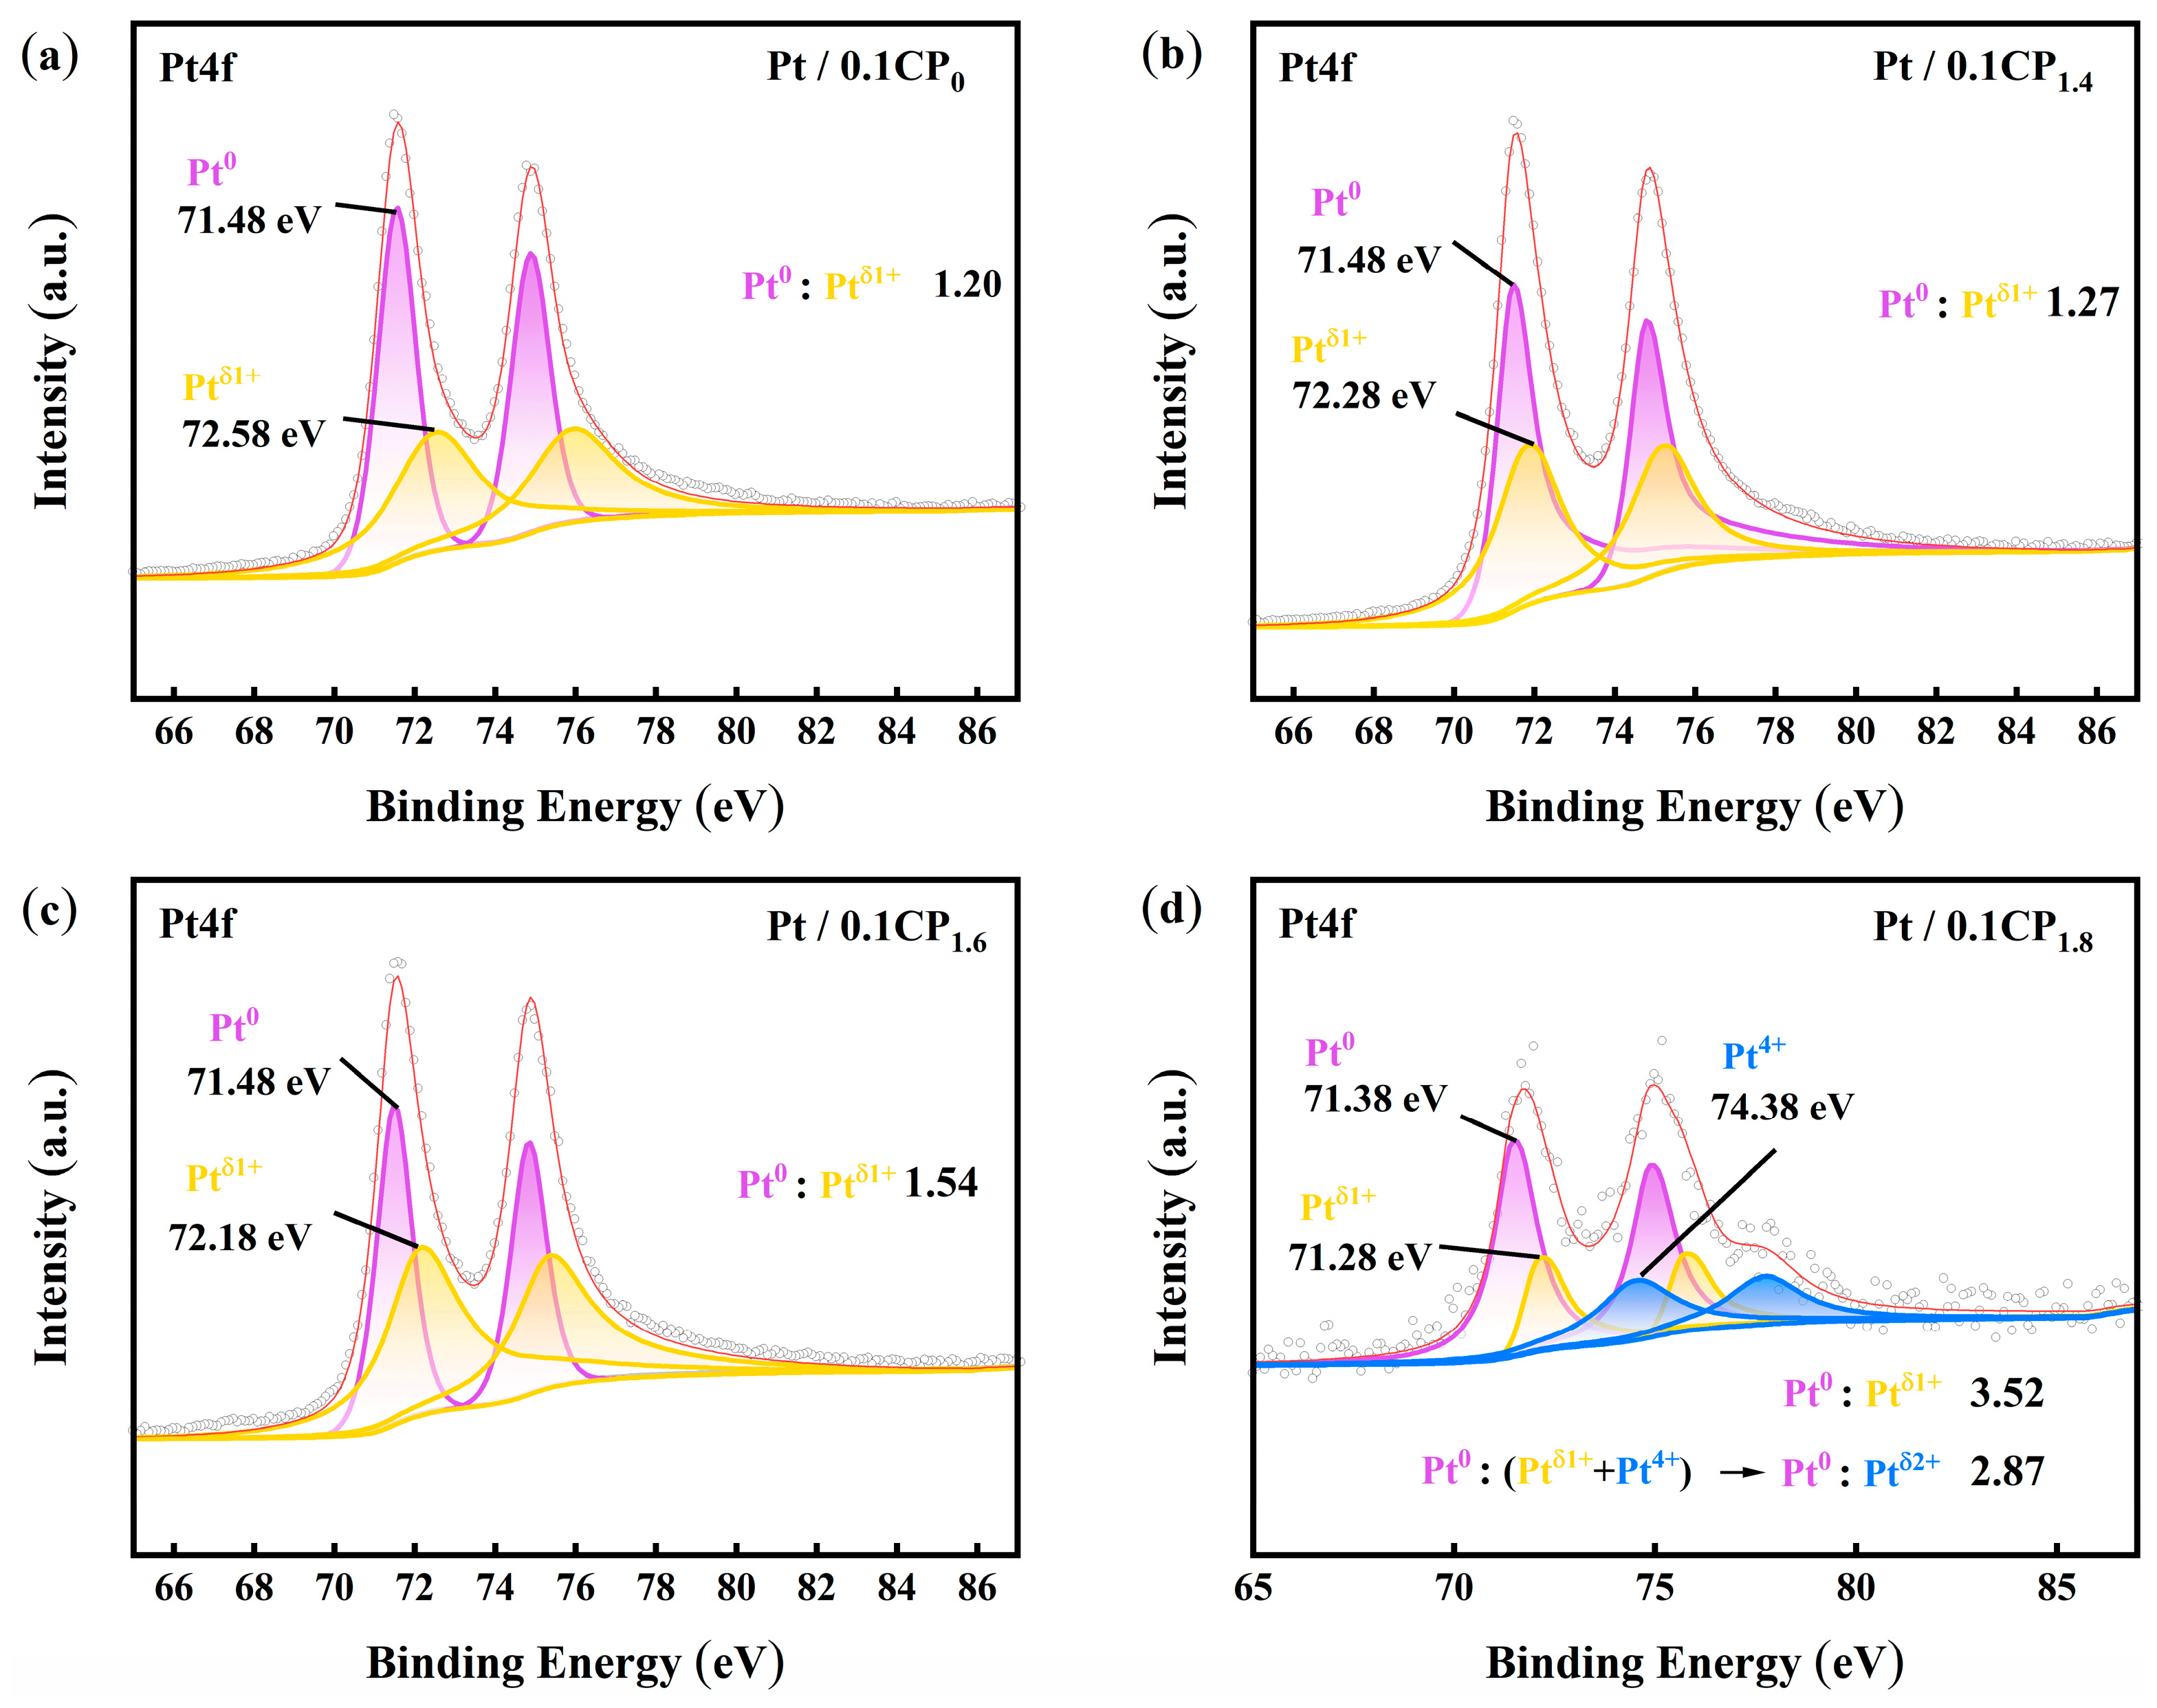
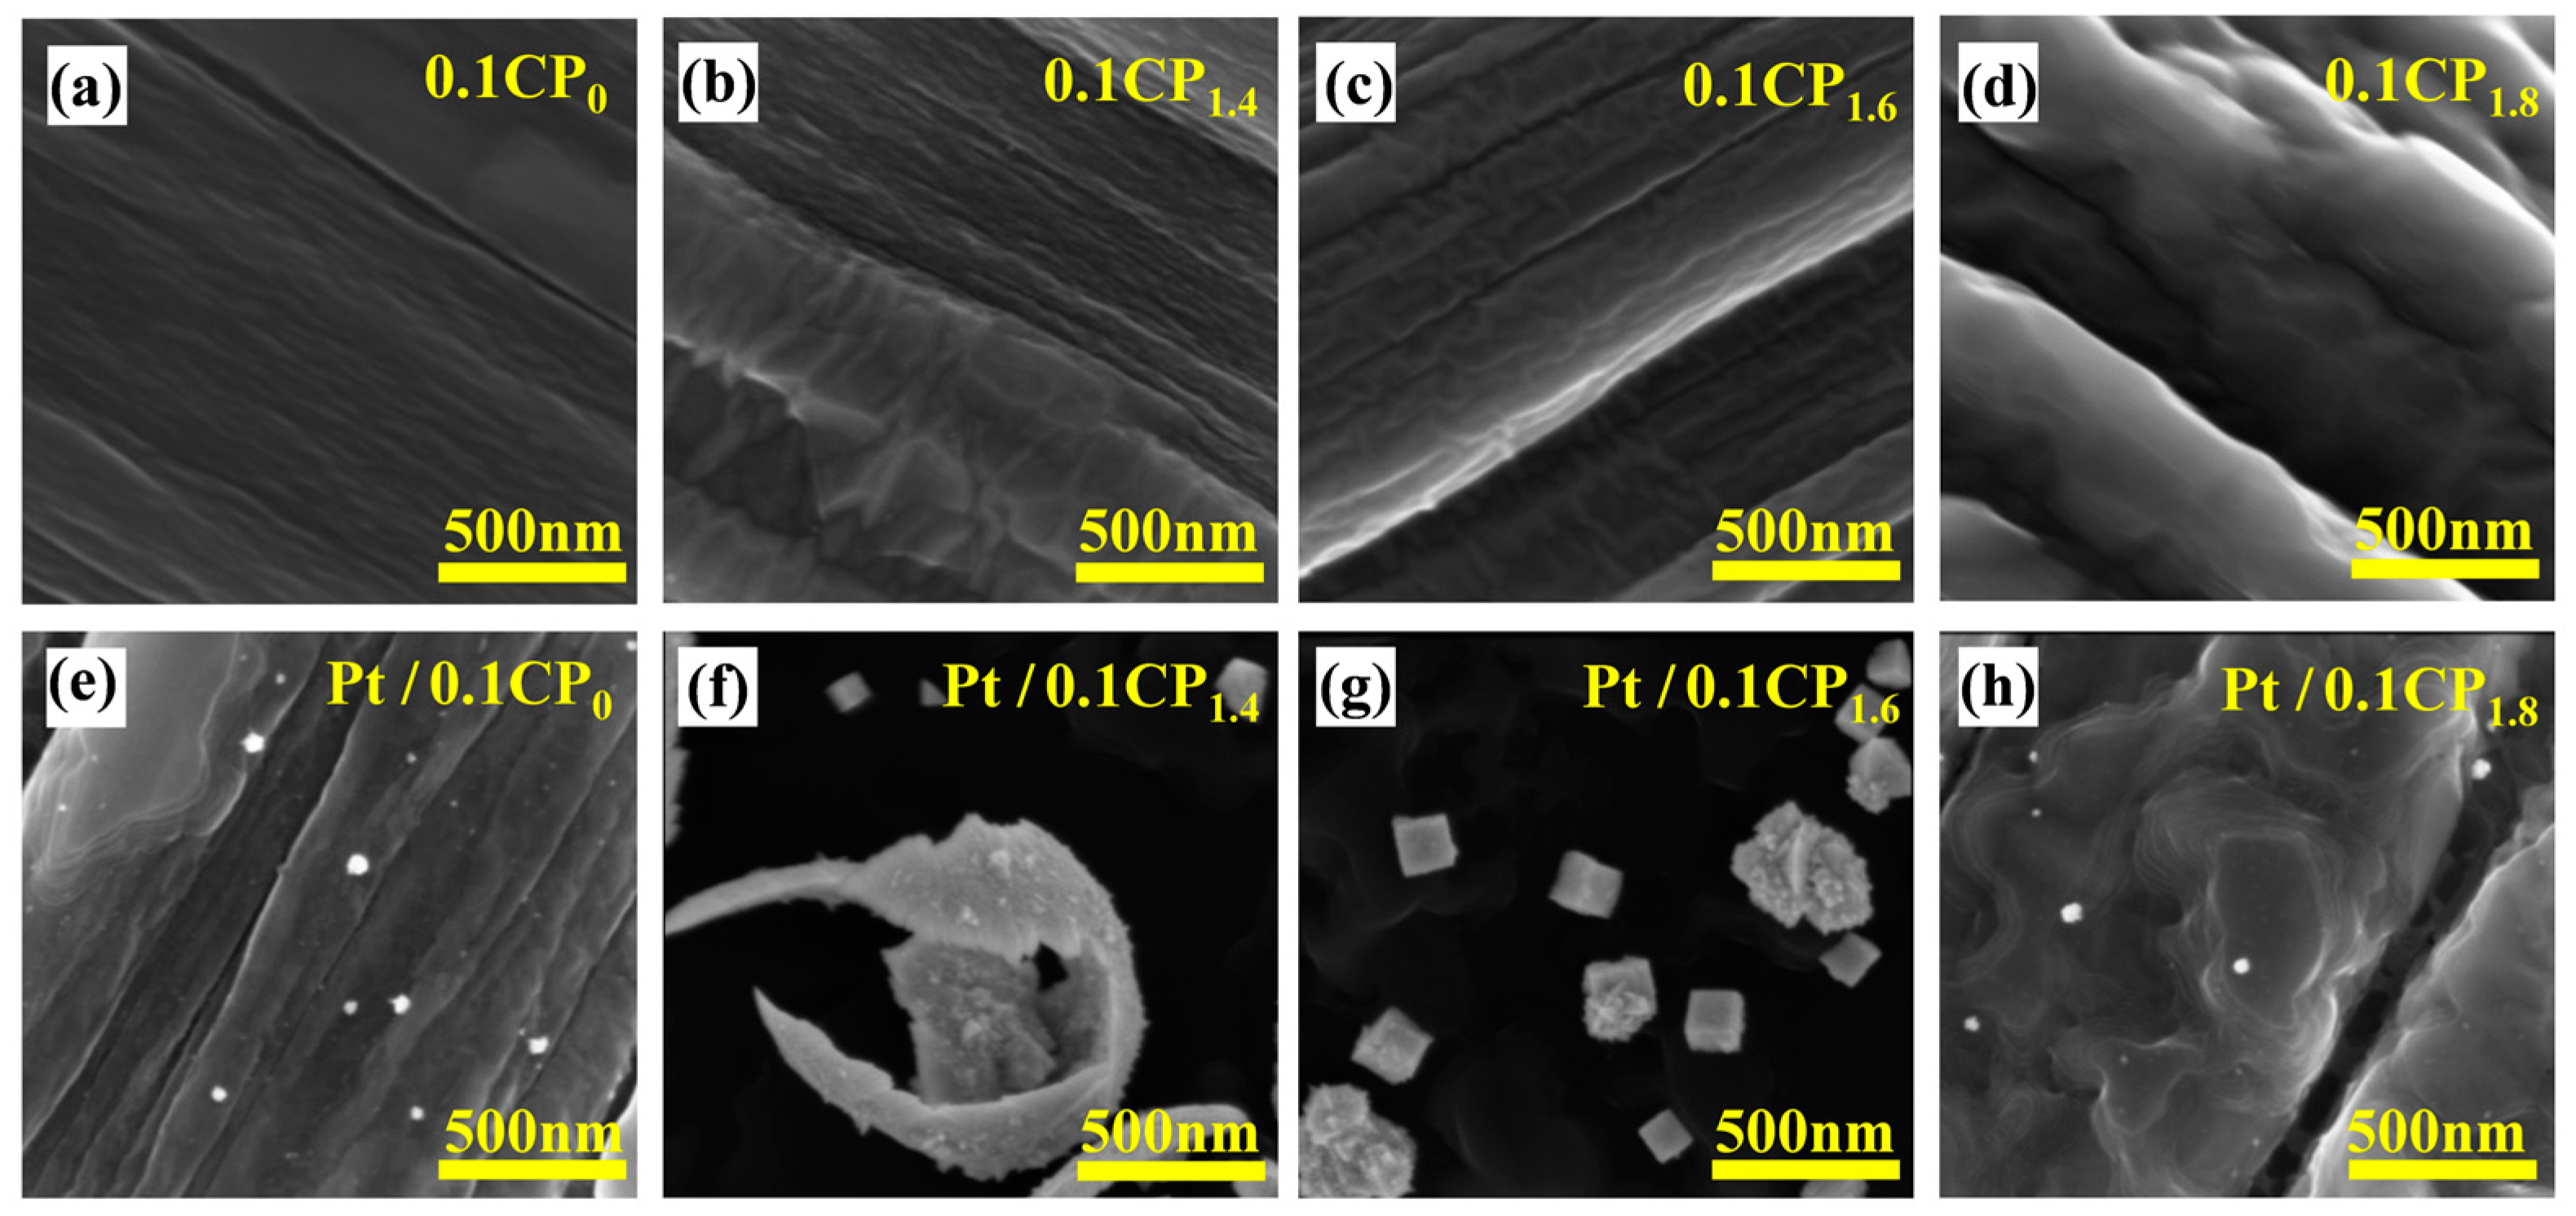
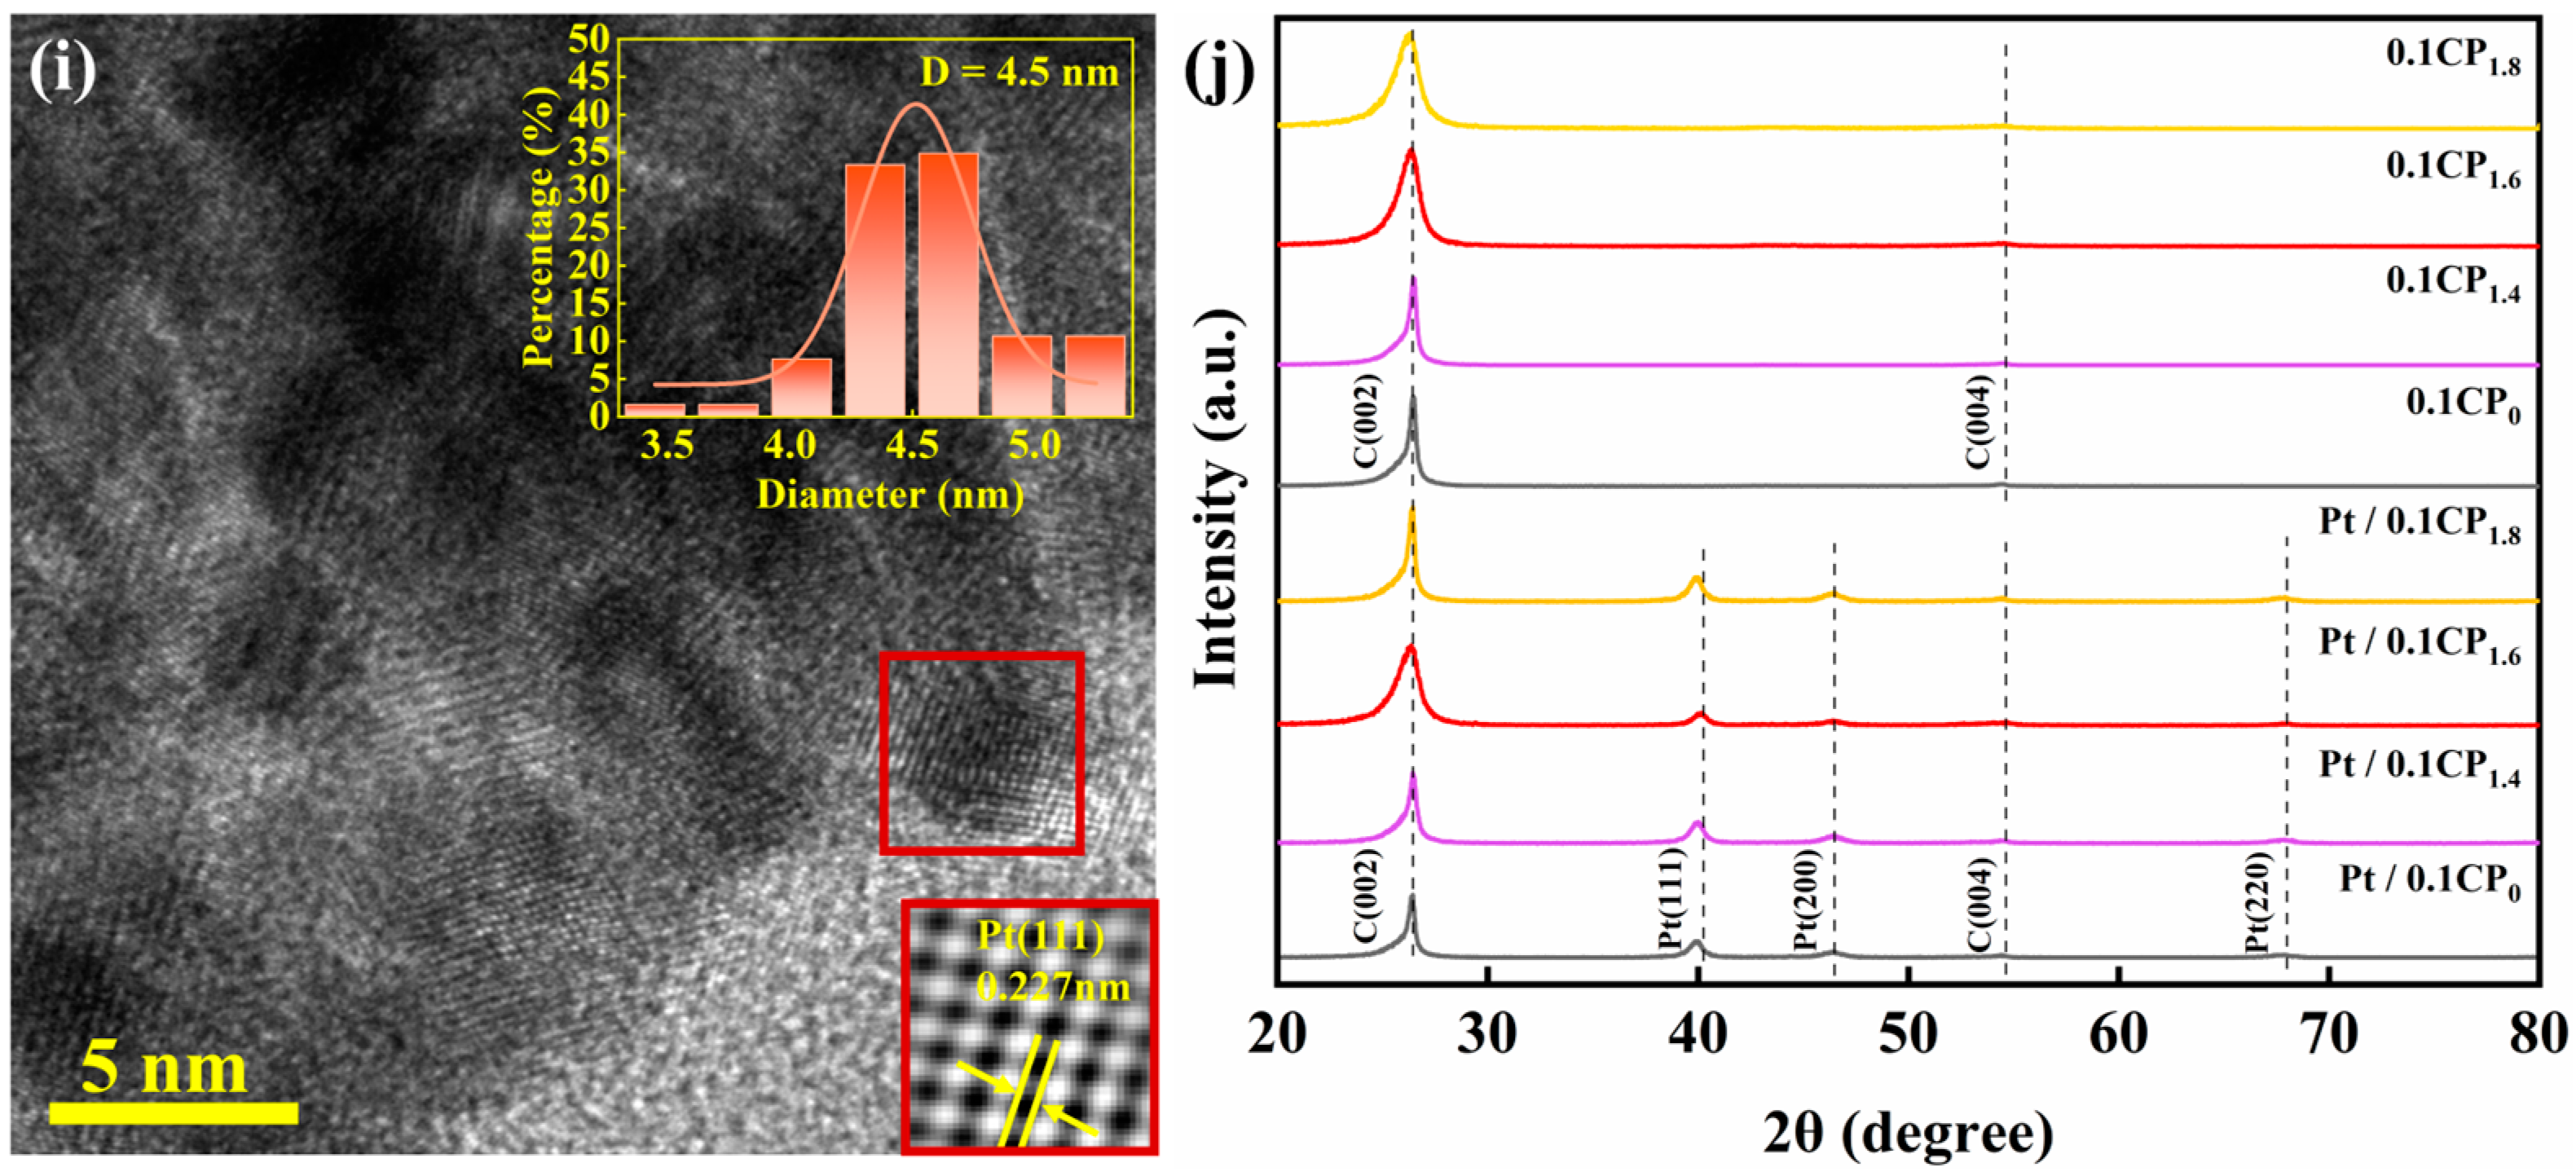
2.2. Physical Characterization and Half-Cell Performance Testing of Carbon-Supported Platinum Catalysts Regulated by Different Activation Voltages

In this section, the carbon papers activated by 0, 1.4, 1.6, 1.8 V voltage in 0.1 M HNO3 solution were named as 0.1CP0, 0.1CP1.4, 0.1CP1.6, and 0.1CP1.8. The catalyst electrodes prepared by loading Pt on these four carbon papers were named as Pt/0.1CP0, Pt/0.1CP1.4, Pt/0.1CP1.6, and Pt/0.1CP1.8.
Figure 3a compares the FTIR spectra of the 0.1CP0, 0.1CP1.4, 0.1CP1.6, and 0.1CP1.8 samples. The differences in the positions and intensities of characteristic peaks among these carbon paper samples revealed the influence of electrochemical activation on the surface functional groups. The peak around 820 cm−1 corresponds to nitrogen-containing groups [23], the peak near 1590 cm−1 was attributed to carbonyl groups, the broad peak around 2020 cm−1 corresponded to carbon–carbon triple bonds, the peak near 2158 cm−1 was associated with C=C=C groups, and the broad peak at 2366 cm−1 could be assigned to hydroxyl groups [24]. With increasing activation voltage, the intensities of the peaks corresponding to carbonyl and nitrogen-containing groups gradually increased, confirming that electrochemical activation could enhance the content of heteroatomic functional groups on the carbon fiber surface.
Figure 3b furtherly compares Raman spectra of untreated carbon paper and carbon paper activation at a voltage of 1.4 V, 1.6 V and 1.8 V. Peaks at 1349 cm−1, 1581 cm−1, and 2716 cm−1 correspond to the D-band, G-band, and 2D-band, respectively. The intensity ratio of the D-band to G-band (I_D:I_G) was analyzed, showing values of 0.09, 1.02, 1.33, and 1.49 for untreated carbon paper and carbon paper activation at 1.4 V, 1.6 V, and 1.8 V, respectively. The increasing I_D:I_G ratio with higher activation voltage indicated an increased degree of disorder in the carbon structure, greater sp3 hybridization, or a reduction in large sp2 in-plane structures. It could be attributed to the partial bonding of oxygen- and nitrogen-containing functional groups with carbon atoms after nitric acid treatment.
To further investigate the impact of activation voltage on the quantity and type of oxygen-containing functional groups on the carbon paper surface, XPS analysis was performed on untreated carbon paper and carbon paper subjected to a voltage of 1.8 V. As shown in Figure 3c,d, significant changes in oxygen-containing functional groups on the carbon paper surface are observed before and after activation. Deconvolution of the C1s spectra reveals peaks at binding energies of approximately 284.6 eV, 286.6 eV, 288.3 eV, and 290 eV, corresponding to the C=C/C–C, C–OH/C–N, C=O, and COOH groups [25], respectively. Similarly, deconvolution of the N1s spectra shows peaks at approximately 398.0 eV, 400.5 eV, 401.8, and 404.9 eV, representing pyridinic N, pyrrolic N [26], graphitic N [27], and oxidic N [28], respectively.
After electrochemical activation, the relative quantities of oxygen-containing functional groups such as C–OH/C–N, C=O, COOH, and oxidized nitrogen significantly increased. This finding is consistent with the FTIR results, further validating the impact of nitric acid treatment on the functionalization of the carbon paper surface.
To investigate whether heteroatom functional groups could promote the subsequent deposition of Pt nanoparticles, XPS characterization was performed on catalyst electrodes prepared under different activation voltages (Figure S1). Table 1 showed that the C:O of carbon paper without activation was enhanced, while the -C:O of carbon paper after activation showed a weakening trend. The surface oxygen content and nitrogen content decreased after Pt loading. The larger the loading of Pt on the surface, the more the content of impurity elements decreases. This phenomenon is due to the fact that the heteroatom groups on the surface of the acidified carbon paper are occupied by Pt ions during the one-step deposition of the Pt catalyst electrode. As shown in Figure 4, the peak intensity at 284.6 eV, corresponding to C–C/C=C functional groups, decreases after Pt loading on carbon paper treated at various activation voltages. This indicates that the deposition process causes a certain degree of corrosion to the carbon substrate.
At a binding energy of 286.58 eV, representing C–OH/C–N functional groups, the intensity of heteroatom functional groups decreases after Pt loading. This suggests that C–OH/C–N groups indeed act as active sites for Pt deposition. Notably, for carbon paper treated at an activation voltage of 1.8 V, the C=O functional group at 287.5 eV showed a significant reduction after Pt loading. The observation indicated that the C=O sites exhibit a high adsorption affinity during the adsorption and reduction of Pt ions, enabling Pt ion reduction to occur preferentially at these locations.
As shown in Figure 5, the characteristic peaks for Pt/0.1CP0, Pt/0.1CP1.4, Pt/0.1CP1.6, and Pt/0.1CP1.8 appear at Pt4f7/2 (ranging from 71.28 to 74.38 eV) and Pt4f5/2 (ranging from 74.58 to 77.68 eV). The energy separation between these two peaks is 3.30 eV, with an area ratio of 4:3 [29]. The Pt4f spectra were deconvoluted, and the resulting peaks were marked in purple, yellow, and blue, corresponding to Pt0, Ptδ1+, and Pt4+ (PtO2), respectively [30]. Ptδ1+ represents Pt ions with valences between zero and +2 (e.g., PtOH, PtO). The sum of Ptδ1+ and Pt4+ contents is collectively referred to as Ptδ2+ for comparative analysis.
The results reveal that with increasing activation voltage, the binding energy in the Pt4f region first increases and then decreases. The initial increase in binding energy could be attributed to the enhanced interaction between Pt and the carbon support facilitated by the activation voltage [31]. The subsequent decrease suggests that higher activation voltages promote greater electron back-donation into anti-bonding orbitals, thereby weakening the Pt-oxygen adsorption strength. This effect facilitates the desorption of reaction intermediates and accelerates the release rate of active sites [32].
Additionally, the ratio of Pt0 to Ptδ1+ increased with rising activation voltage. Since the adsorption of oxygen molecules on divalent Pt is closely related to the surface charge state of the catalyst, an appropriate Pt0: Ptδ1+ ratio could balance Pt’s oxygen adsorption with the desorption of intermediate species, such as OH and OOH, optimizing catalytic activity [33].
Figure 6a–d presents SEM images of carbon paper treated under different activation conditions. As the activation voltage increases, the surface of the carbon paper transitions from gray to black, indicating a deepening degree of oxidation. The overall morphology of the carbon paper was largely preserved under rapid electrochemical oxidation; however, with increasing voltage, the carbon fibers exhibited swelling, deeper surface depressions, and increased surface roughness. These changes facilitated that the adsorption of the Pt ions made it easier for ions to attach to the carbon paper surface.
In Figure 6e–h, it is evident that Pt nanoparticles are uniformly distributed across catalyst electrodes prepared from differently acidified carbon papers. The particle size of Pt decreases with increasing activation voltage. The morphology evolves from petal-like structures to a mixed state of cactus- and cube-shaped particles, and eventually to spherical nanoparticles. The catalyst morphology in Figure 6f might be due to the formation of fewer active sites on the surface of low-voltage acidified carbon paper. As a result, more Pt nanoparticles agglomerate to form a unique petal shape. The exposed plane of the square Pt particles in the Figure 6g might be beneficial to the catalytic activity [34]. In addition, Pt/0.1CP1.6 shows better performance than commercial catalysts in the oxygen reduction reaction. To investigate the dispersion of the Pt particles in Pt/0.1CP1.6, Figure 6i shows that the Pt/C0.1V1.6CP is mainly comprised Pt (111) (0.227 nm), and the average size of the Pt NPs is 4.5 nm (Figure S2).
XRD characterization was employed to furtherly investigate the crystal structure of the catalysts. As shown in Figure 6i,j, compared to carbon paper without Pt loading, the catalyst electrodes exhibit distinct peaks at the C(002) and C(004) planes, indicating that electrodeposition has limited impact on the graphitization degree of the carbon support. Distinct peaks corresponding to the Pt(111) plane at 2θ = 39.9°, the Pt(200) plane at 2θ = 46.2°, and the Pt(220) plane at 2θ = 67.6° were observed. With increasing activation voltage, the Pt(111) peak showed a shift. Pt/0.1CP0, Pt/0.1CP1.4, Pt/0.1CP1.6, and Pt/0.1CP1.8 exhibit sharp but lower peaks at 2θ values of 39.9°, 40.0°, 40.2°, and 40.2°, respectively. Combined with the XRD data and Scherrer equation, the Pt particle sizes of Pt/0.1CP0, Pt/0.1CP1.4, Pt/0.1CP1.6, and Pt/0.1CP1.8 were calculated to be 26.3 nm, 21.9 nm, 19.7 nm, and 15.2 nm (Table S1). With the increase of activation voltage, the particle size showed a decreasing trend.
This reflects an enhanced tensile effect between Pt and the carbon support, which could be attributed to chemically induced tensile strain within the Pt lattice [35].
Additionally, the intensities of the Pt(111), Pt(200), and Pt(220) peaks gradually weaken with increasing activation voltage, indicating a reduction in crystal grain size. This size reduction enhances the utilization efficiency of surface Pt, improving the catalytic activity of the electrodes.
In order to evaluate the ORR activity of the catalyst electrodes, a series of CV and LSV tests were conducted in 0.5 M H2SO4 solutions saturated with Ar and O2 gases, respectively. Figure 7a depicts the CV curves of Pt/0.1CP0, Pt/0.1CP1.4, Pt/0.1CP1.6, Pt/0.1CP1.8, and Pt/C/CP. It is evident that the catalyst electrodes exhibit discernible hydrogen desorption peaks within the potential window of 0–0.4 V (vs. RHE). From this, it was calculated that Pt/0.1CP0, Pt/0.1CP1.4, Pt/0.1CP1.6, Pt/0.1CP1.8, and Pt/C/CP have an ECSA of 36, 50, 85, 42, and 18 m2·gPt−1, respectively. The solid lines in Figure 7b show the LSV curves of the four different catalyst electrodes. The LSV vertical coordinate was taken as the horizontal coordinate corresponding to the time of −0.1 mA·cm−2, which was identified as the onset potential (Eonset). The Eonsets for Pt/0.1CP0, Pt/0.1CP1.4, Pt/0.1CP1.6, Pt/0.1CP1.8, and Pt/C/CP were 0.85, 0.91, 0.91, 0.89, and 0.86 V, respectively. The synthesized material, when considered in conjunction with its ECSA and Eonset values, demonstrates that the acidified carbon paper treated by applying a voltage of 1.6 V (vs. SCE) in a 0.1 M HNO3 solution could facilitate the electrodeposition of Pt catalysts, thereby resulting in the most optimal ORR activity among the electrodes. The Tafel slopes were calculated from the LSV curves, and the Tafel slopes of Pt/0.1CP0, Pt/0.1CP1.4, Pt/0.1CP1.6, Pt/0.1CP1.8, and Pt/C/CP were obtained, resulting in values of 92, 83, 69, 65, and 95mV dec−1, respectively. The Pt/0.1CP1. catalyst electrode exhibited the most favorable Tafel slope, indicating superior kinetic performance. A lower Tafel slope is indicative of enhanced oxygen reduction reaction (ORR) reaction kinetics, due to reduced mass transfer resistance. This phenomenon could be attributed to the fact that nitrogen doping facilitates the desorption of intermediates from the catalyst surface, thereby promoting the ORR reaction.
Moreover, the Pt/0.1CP1.6 catalyst displays an optimal Pt0 ratio, which enables a balance between the adsorption of oxygen by Pt and the desorption of intermediates OH and OOH. This is a crucial factor in achieving the most efficient ORR performance. Moreover, the Pt nanoparticles on Pt/0.1CP1.6 exhibit a combination of smaller Pt particles and spiny particles with a high specific surface area. This morphology also contributes to the enhancement of ORR activity. Moreover, the direct carbon paper carrier guarantees that the requisite activation conditions are maintained, thereby preserving the ordered structure of the carbon paper network. This is advantageous for mass transfer, as evidenced by the relatively high current density observed in the diffusion control region (0–0.4 V) of the LSV curve. The durability of the oxygen reduction catalyst is a crucial factor in determining the practical application value of the fuel cell. As illustrated in Figure 7, the ECSA of all of the catalyst electrodes exhibited a decline following 5000 cycles of the ADT test (Figure S3). When the initial value of the ECSA and the degree of decay are considered, it could be observed that Pt/C0.1V1.6CP initially has a higher ECSA value and maintains a higher value of 78 m2·gPt−1 after 5000 cycles of ADT testing of the catalyst electrode. The Tafel slope was calculated according to Figure 7, and it could be seen that the Tafel slope of Pt/0.1CP1.6 is relatively small, with an increase of 3 mV·dec−1 after ADT, indicating that the catalyst electrode maintains high kinetic efficiency and good stability. As a summary, increasing the activation voltage will significantly increase the content of C–N groups. Combined with DFT, it could be seen that this will reduce the adsorption energy of each species on the catalyst in the ORR reaction. Comparing the performance data before and after 5000 cycles of testing, the optimal activation voltage is 1.6 V.

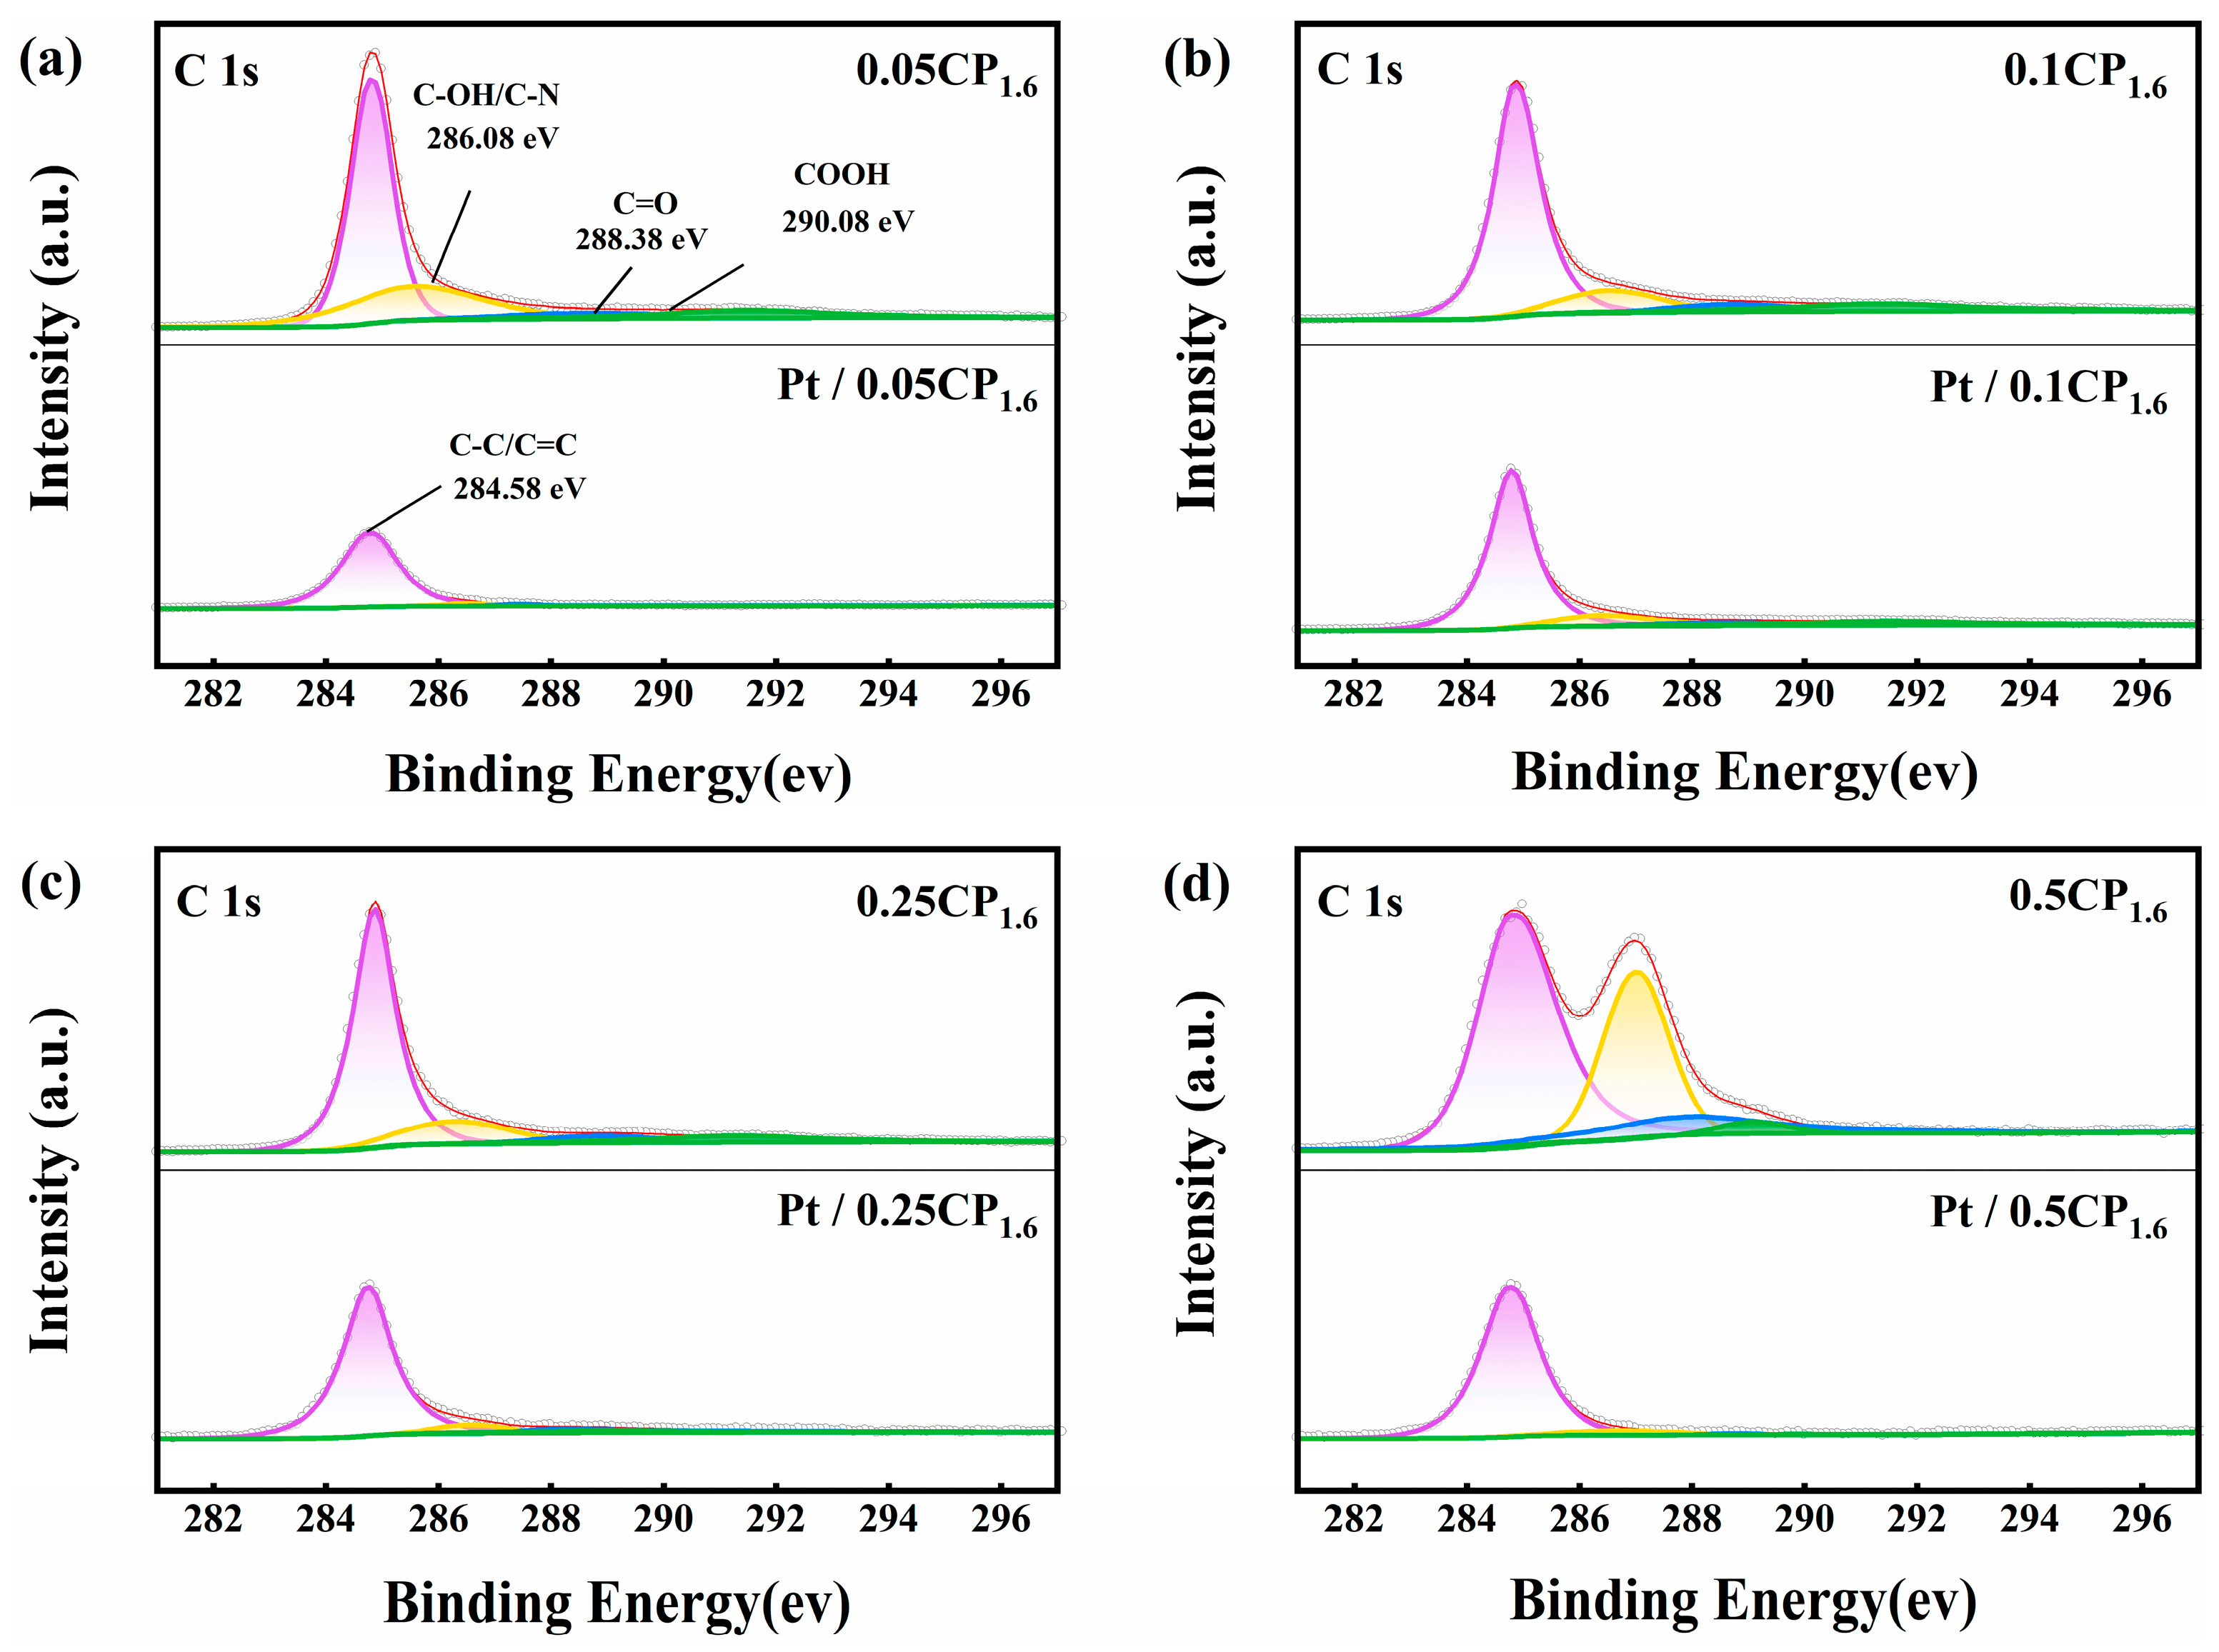
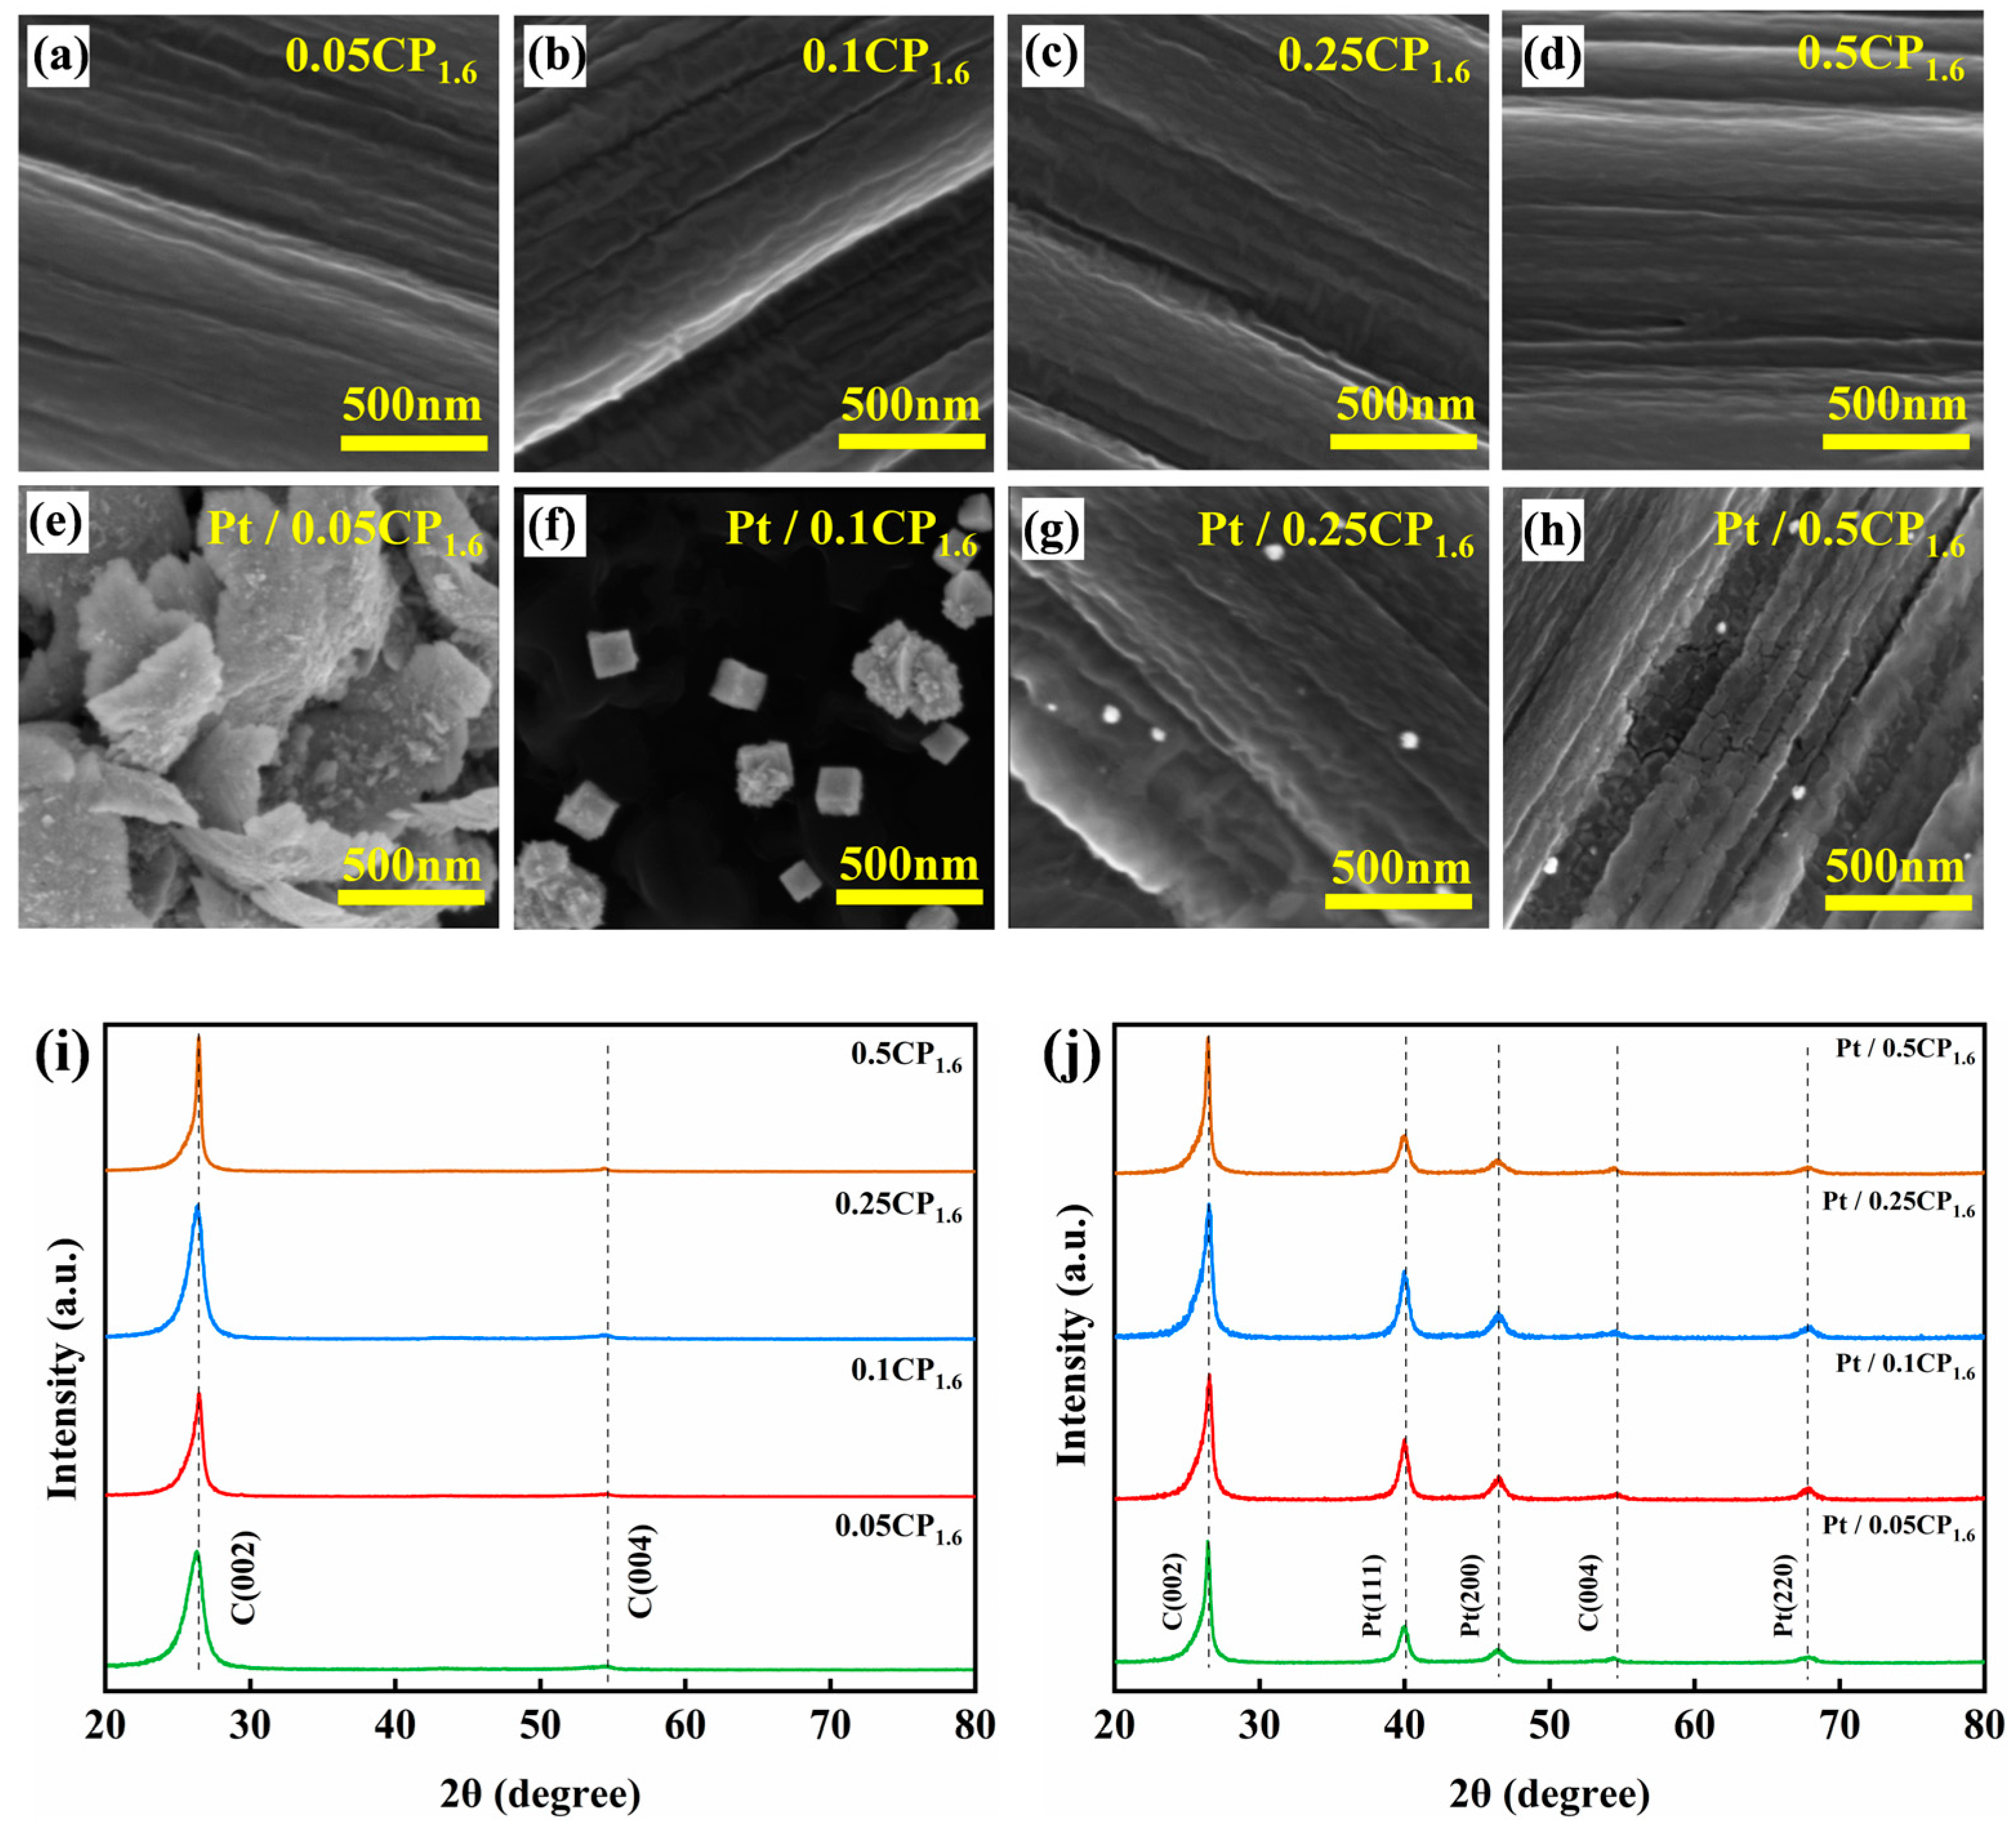
2.3. Physical Characterization and Half-Cell Performance Testing of the Carbon-Supported Platinum Catalysts Regulated by Different Activation Concentrations

In this section, the carbon papers activated in 0.05 M, 0.1 M, 0.25 M, or 0.5 M HNO3 solution at 1.6 V voltage were named as 0.05CP1.6, 0.1CP1.6, 0.25CP1.6, and 0.5CP1.6. The catalyst electrodes prepared by loading Pt on these four carbon papers were named as Pt/0.05CP1.6, Pt/0.1CP1.6, Pt/0.25CP1.6 and Pt/0.5CP1.6.
The effect of activation concentration on the deposition of Pt nanoparticles was investigated under the optimal activation voltage of 1.6 V. Figure 8 presents the deconvolution of the XPS C1s spectra for the 0.05CP1.6, 0.1CP1.6, 0.25CP1.6, and 0.5CP1.6 samples. At the binding energy of 286.1 eV, corresponding to the C–OH/C–N groups, the intensity of the heteroatomic functional groups on the carbon paper decreases after Pt loading. This indicates that C–OH/C–N indeed serves as active sites for Pt deposition. As shown in Table 2, the C:O of the activated carbon paper showed a weakening trend. The surface oxygen content and nitrogen content decreased after Pt loading.
Notably, for carbon paper treated with an acid concentration of 0.5 M, the C–OH/C–N functional group at 286.1 eV shows a significant reduction after Pt loading. This suggests that during the adsorption and reduction of Pt ions, C–OH/C–N sites exhibit a high adsorption tendency, promoting the reduction of Pt ions at these locations.
In order to further explore the charge transfer mechanism between Pt and carbon paper, the prepared Pt/0.05CP1.6, Pt/0.1CP1.6, Pt/0.25CP1.6 and Pt/0.5CP1.6 catalysts were analyzed by XPS Pt4f fine spectrum. As shown in Figure 9, we inferred the changes in the electronic states of the elements by observing the peak shifts, which in turn provided insights into electron gain or loss. The characteristic peaks for Pt/0.05CP1.6, Pt/0.1CP1.6, Pt/0.25CP1.6, and Pt/0.5CP1.6 are found in the Pt 4f7/2 (in the range of 71.28–74.08 eV) and Pt 4f5/2 (in the range of 74.58–77.68 eV) main peaks, with a binding energy difference of 3.30 eV between them and a peak area ratio of 4:3 [29].
The analysis results show that with the increase of activation concentration, the binding energy of the Pt4f region decreased slightly and then increased. The decrease of Pt4f binding energy indicates that the increase of activation concentration helps to enhance the electron filling degree of the antibonding energy band. In turn, the adsorption force of Pt on oxygen is weakened, which makes the reaction intermediate easier to desorb, thereby accelerating the release rate of the active site [32].
Deconvolution of the Pt4f spectra reveals that the ratio of Pt0 to Ptδ1+ increases with increasing activation concentration. Since the adsorption of oxygen molecules on divalent platinum was closely related to the surface charge state of the catalyst, controlling the Pt0:Ptδ1+ ratio could balance Pt’s adsorption of oxygen and the desorption of intermediate products such as OH and OOH [33]. Moreover, Darling et al. [36] demonstrated that surface PtO and other oxides might serve as a protective layer for non-desorbed Pt atoms, with the electrooxidation rate of Pt being controlled by the PtO chemical dissolution process. Therefore, by precisely controlling the amount of oxidized Pt, the protective effect of Ptδ1+ on Pt0 could be fully utilized to achieve excellent electrochemical performance.
As shown in Figure 10e–h, with the increase in acid solution concentration, the color of the carbon paper surface gradually changes from gray to black, indicating that the degree of oxidation increases, and the overall surface becomes rougher, making it easier for Pt ions to attach to the carbon paper surface. The Pt particle size on Pt/0.05CP1.6, Pt/0.1CP1.6, Pt/0.25CP1.6, and Pt/0.5CP1.6 electrodes decreases with increasing activation concentration. The morphology of Pt nanoparticles evolves from petal-like structures to a mixture of cactus-like and square shapes, and finally to small spherical particles, showing a clear reduction in particle size. It could be observed that the carbon paper treated with the highest concentration of acid experiences significant damage to the carbon fibers after Pt deposition.
Figure 10i,j also shows the XRD images for Pt/0.05CP1.6, Pt/0.1CP1.6, Pt/0.25CP1.6, and Pt/0.5CP1.6. A comparative analysis of the characteristic peaks reveals the crystal structure properties of the different electrodes. At the C(002) and C(004) positions, the catalyst electrodes after Pt loading exhibit distinct characteristic peaks. Characteristic peaks also appear at 2θ = 39.9° for the Pt (111) plane, 2θ = 46.2° for the Pt (200) plane, and 2θ = 67.6° for the Pt (220) plane. Combined with the XRD data and Scherrer equation, the Pt particle size of Pt/0.05CP1.6, Pt/0.1CP1.6, Pt/0.25CP1.6, and Pt/0.5CP1.6 was calculated to be 25.9 nm, 19.7 nm, 22.8 nm, and 20.4 nm (Table S1).
Figure 11a presents the CV curves for Pt/0.05CP1.6, Pt/0.1CP1.6, Pt/0.25CP1.6, and Pt/0.5CP1.6. In the potential window of 0 to 0.4 V (vs. RHE), all the catalyst electrodes exhibit a distinct hydrogen desorption peak. The ECSA values of Pt/0.05CP1.6, Pt/0.1CP1.6, Pt/0.25CP1.6, and Pt/0.5CP1.6, as calculated from the CV curves, are 90, 85, 85, and 71 m2·g·Pt−1, respectively.
The solid lines in Figure 11b represent the LSV curves of the four different catalyst electrodes. The onset potential (Eonset) is determined at the current density of −0.1 mA·cm−2, with corresponding values for Pt/0.05CP1.6, Pt/0.1CP1.6, Pt/0.25CP1.6, and Pt/0.5CP1.6 being 0.87, 0.91, 0.88, and 0.85 V, respectively. Considering both the ECSA and Eonset, it is evident that Pt/0.1CP1.6 exhibits the best ORR activity, while Pt/0.05CP1.6 shows relatively good ORR performance. Further analysis of the Tafel slopes is also conducted.
By plotting the logarithm of the current density against overpotential, the Tafel slopes for Pt/0.05CP1.6, Pt/0.1CP1.6, Pt/0.25CP1.6, and Pt/0.5CP1.6 are calculated to be 92, 69, 66, and 75 mV·dec−1, respectively. The best performing Pt/0.1CP1.6 catalyst also exhibits the lowest Tafel slope, indicating lower mass transport resistance and higher ORR reaction kinetics efficiency. This is likely due to the optimal Pt0:Ptδ1+ ratio in Pt/0.1CP1.6, where the appropriate content of Ptδ1+ helps to protect Pt0, enhancing its electrochemical performance.
Additionally, the larger surface area and morphology of the Pt nanoparticles on Pt/0.1CP1.6 further contributes to the improved ORR activity. The optimized activation conditions also help maintain the ordered structure of the carbon paper network. However, severe damage and cracking of the carbon paper fibers in Pt/0.5CP1.6, as shown in the SEM images in Figure 10, hinder mass transport. In summary, the catalyst electrode has the most suitable Pt0:Ptδ1+ ratio at the activation concentration of 0.1 mol, which will promote the activity of oxygen reduction reaction. Comparing the performance parameters of the catalyst electrode before and after 5000 cycles of performance test, Pt/C0.1V1.6CP has the best ORR performance.

3. Materials and Methods

3.1. Materials and Chemicals

The chemicals used in this study included NaOH (Shanghai Lingfeng Chemical Reagent Co., Shanghai, China), HCl (Shanghai Lingfeng Chemical Reagent Co., Shanghai, China), KCl (Shanghai Lingfeng Chemical Reagent Co., Shanghai, China), HNO3 (Shanghai Titan Scientific Co., Ltd., Shanghai, China), H2SO4 (Shanghai Titan Scientific Co., Ltd., Shanghai, China), and H2PtCl6·6H2O (Shanghai Titan Scientific Co., Ltd., Shanghai, China). The carbon paper (CP) used as the original carbon substrate had a thickness of 190 nm (Toray Industries, Inc., Tokyo, Japan). DMF (Shanghai Boer Chemical Reagent Co., Ltd., Shanghai, China) was used in electrodeposition. The slurry used for preparing the Pt/C commercial catalyst electrodes (50 wt.%) (Shanghai Yihydrogen Technology Co., Ltd., Shanghai, China). The Nafion solution (Sinopharm Chemical Reagent Co., Ltd., Shanghai, China). All gases used in the study were of high purity grade (Air Liquid China Holding Co., Ltd., Shanghai, China). All raw materials were used as received without further purification.

3.2. Preparation of the Catalyst Electrodes

The carbon paper used for electrodeposition was cut into 1 × 3 cm pieces. It was ultrasonically cleaned sequentially in 0.2 M NaOH solution, 0.2 M HCl solution, and deionized water for 3 min each. After sonication, the carbon paper was rinsed with deionized water until neutral and then dried in an oven. Activation and electrodeposition of the carbon paper were performed through constant-voltage treatment in an aqueous solution using a three-electrode electrochemical cell. The CHI660e electrochemical workstation was equipped with a 2 × 2 cm2 platinum foil as the counter electrode (CE), a saturated calomel electrode (SCE) as the reference electrode (RE), and a working electrode (WE). The working electrode consisted of the cleaned CP mounted on a platinum electrode clamp wrapped in a PTFE-coated platinum support to ensure electrical connection and uniform charge distribution across the CP during activation. An area of 1 × 2 cm2 of the CP was immersed in the electrolyte, with excess area masked using polyimide tape.
Electrochemical activation was carried out at 380 rpm in a 120 mL three-electrode electrolytic cell containing 0.05–0.5 M HNO3 solution. The voltage was set to 0 ~ 1.8 V (vs. SCE) for 300 seconds. The carbon paper treated in this way was named xCPy (x: concentration of HNO3 solution; y: acidizing voltage). The electrodeposition of nano-Pt particles was carried out by constant voltage method on the carbon paper substrate after electrochemical activation. During the electrodeposition of Pt, the aqueous electrolyte consisted of 0.1 M KCL, 0.5 M H2SO4, 2 mM H2PtCl6 ··6H2O and 60 mM N, N-dimethylformamide (DMF). The working voltage was set to −0.2 V (vs. SCE), the deposition time was 600 s, and the speed of the magnetic stirrer was 380 rpm. During the deposition process, it is necessary to ensure that the area of carbon paper immersed in the electrolyte is 1 × 2 cm2, and the excess area is isolated with polyimide tape. After the electrodeposition was completed, the carbon paper was taken out and immersed in deionized water for 30 min to remove the residual acid on the surface. Finally, the carbon paper was dried in an oven at 80 °C for 12 h to obtain a catalyst electrode named Pt/xCPy.
5 mg commercial Pt/C catalyst was put into a centrifuge tube, adding 500 μL deionized water, 500 μL isopropanol, and 25 μL Nafion solution. Then ultrasonic treatment was performed for 1 h to obtain the commercial catalyst slurry. A total of 100 μL of the commercial catalyst slurry was coated on both sides of the carbon paper (1 × 1 cm2) after alkali washing and pickling. The carbon paper coated with the commercially available Pt/C catalyst was dried in an oven at 80 °C for 12 h, then fixed on a Pt electrode clip to obtain a commercial Pt/C catalyst electrode. The commercial catalyst Pt loading is about 0.1 mgPt·cm−1, named Pt/C/CP.

3.3. Electrochemical Test

The electrochemical performance of the catalyst electrode was tested using a CHI660e electrochemical workstation. The three-electrode device for performance testing consists of a platinum wire electrode as CE, a saturated calomel electrode as RE, and a catalyst electrode WE clamped by a platinum electrode. The immersion area of the catalyst electrode in the electrolyte was maintained at 1 × 0.5 cm2. The electrolyte is 100 mL of 0.5 M H2SO4 solution, which is installed in the glass electrolytic cell, and the temperature is controlled by the water bath to be 25 °C. Before the test, two 100 mL aliquots of 0.5 M H2SO4 solution were first introduced with Ar and O2 gas for 30 min to obtain Ar or O2 saturated test solution. It should be noted that the ORR measurement procedure used here is different from the usual method using a rotating disk electrode (RDE) because the electrocatalyst is directly deposited on the GDL substrate and cannot be directly deposited on the RDE. Therefore, quantitative determination of the ORR parameters, such as half-wave potential, is not feasible. Nevertheless, the following tests provide qualitative information to show trends between catalysts with different compositions.
Cyclic voltammetry (CV) is a commonly used method to test the redox performance of working electrode. The catalyst electrode was activated by immersing it in Ar saturated solution. In the potential window between 0.03–1.2 V (vs. RHE), the curve was stable after 20 cycles of activation at a scan rate of 100 mV/s, then 3 cycles of complete scanning were performed. The cyclic voltammetry curve of the last cycle was taken for electrochemical performance analysis. The electrode was immersed in the O2-saturated test solution to test the current change curve of the electrode with time by linear sweep voltammetry (LSV). The operating conditions were 0.6–1.0 V (vs. RHE), and the scanning rate was 100 mV·s−1. The potential corresponding to the current density of −0.1 mA·cm−2 was taken as the onset potential (Eonset). The Tafel curve was converted from the LSV curve. The logarithm of the absolute value of the current density (j, mA·cm−2) in the LSV data are taken as the abscissa, and the potential in the LSV data were used as the ordinate to fit the Tafel slope. The catalyst electrode was subjected to accelerated durability testing (ADT) at operating conditions of 0.6–1.0 V (vs. RHE) and a scanning rate of 100 mV·s−1 for 5000 cycles. The CV and LSV curves of each 1000 cycles were measured to evaluate the stability and durability of the catalyst electrode.

3.4. Characterizations and Measurements

The XRD (Rigaku SmartLab SE, Rigaku Holdings Corporation, Tokyo, Japan) method was conducted to investigate the carbon structure and crystalline phases of the samples. The measurements were performed using a copper target (λ = 0.15405 nm) under an operating voltage of 40 kV and a current of 40 mA. The scanning rate was ω = 5°min−1 and the scanning range was 2θ = 10–80°. FTIR (NicoletiS10, Thermo Fisher Scientific, Waltham, MA, USA) spectra were used to characterize the chemical composition of CP via the attenuated total reflection (ATR) mode over a spectral range with a wave number of 4000 to 400 cm−1. The Raman (Horiba LabRAM HR Evolution, Horiba, Kyoto, Japan) spectroscopy was conducted employing a He–Ne laser source at the 633 nm wavelength, with spectral acquisition spanning from 500 to 3500 cm−1 in wavenumber. XPS (Thermo Scientific K-Alpha, Thermo Fisher Scientific, Waltham, MA, USA) was conducted to characterize the surface elemental composition of the catalysts, with sample charging effects compensated by referencing the adventitious carbon C1s peak at 284.8 eV. The microstructural features of the catalyst, including platinum nanoparticle size distribution, were characterized by TEM (JEM-F200, Jeol Ltd., Tokyo, Japan), while the surface morphology was investigated using field emission SEM (Nova NanoSEM 450, FEI, Hillsboro, OR, USA).

3.5. DFT Investigation

All spin-polarized DFT calculations were performed using the Vienna Ab initio Simulation Package (VASP 6.3.2). The interaction between ion cores and valence electrons was described using the projector augmented wave (PAW) method, and the electronic exchange-correlation energy was represented by the generalized gradient approximation (GGA)-PBE [37]. The plane wave cutoff energy [38] was set to 400 eV. During the calculations, spin polarization and van der Waals interactions were taken into account. The Brillouin zone was sampled using a 2 × 2 × 1 Monkhorst–Pack grid [39]. The convergence criteria for structural optimization were set to energy and force tolerances of 10–5 eV and 0.05 eV/Å, respectively.
The formula for calculating the adsorption energy of Pt atoms on the carbon support is given by the following equation:
E ads , Pt = E Pt / C ( CN / CO ) E C ( CN / CO ) E Pt
The ORR on Pt-based catalysts involves multiple possible reaction mechanisms, with intermediates including O*, OH*, OOH*, and O2* [40]. Therefore, the adsorption configurations and adsorption energies of these four intermediates on Pt/C, Pt/CN, and Pt/CO catalysts were studied. The results are shown in Figure 1, and the relevant adsorption energies are listed in Table 1. The calculation of adsorption energies is given by the following equation:
E ads , M = E M / cat E M E cat
The overpotential (η, V) is calculated using the following equation:
η = U e q U

4. Conclusions

In this work, nitric acid was used to modify the carbon carrier by a constant voltage method. Platinum nanoparticles were grown on the carrier by an electrodeposition method, which needed less than 1/10 of the preparation time of the traditional preparation method. This provides a promising prospect for simplifying the preparation process of cathode catalyst electrode and improving the performance of the cathode catalyst electrode. Table S1 summarizes the performance parameters of the catalyst electrode under different activation conditions. The main conclusions of this work are as follows:
(1) Oxygen-containing and C–N groups on the surface of the carbon paper and their contents have a great influence on the electrochemical properties of the subsequent platinum plating catalyst electrodes. Combined with the DFT calculations, the presence of oxygen atoms on the support could serve to reduce the ORR overpotential and enhanced the ORR catalytic performance. N doping significantly improves the performance of the catalyst electrode by attenuating the intermediate adsorption-promoting reactivity.
(2) On the other hand, excessive activation voltage or acid concentration might result in more oxidized Pt species in the subsequent deposition, and a low Pt0: Ptδ1+ ratio will cause the catalyst to age faster and lose stability. When the oxidation degree of Pt is too high, it may also be beneficial for the reaction, and Ptδ1+ may play a greater role in protecting Pt0.
(3) On carbon fibers, increasing the activation voltage and concentration enhances the carbon defects and significantly increases the number of edge defects, amorphous graphite, and micropores. Due to the presence of chemically induced tensile strain in the platinum lattice, changes in the graphite structure of the carbon paper enhance the interaction between the platinum and the support. Platinum could deposit and grow on the carbon paper firmly.

Supplementary Materials

The following supporting information can be downloaded at: https://www.mdpi.com/article/10.3390/catal15040403/s1, Table S1: Summary of the initial deposition current in the deposition process, Ptloading, Pt particle size calculated by Scherr equation (DPt), electrochemical active surface area (ECSA), onset potential, and Tafel slope of the different catalysts before and after accelerated durability testing (ADT), Figure S1: XPS O1s of (a) Pt/0.1CP0, Pt/0.1CP1.4, Pt/0.1CP1.6, Pt/0.1CP1.8 and (b) Pt/0.05CP1.6, Pt/0.1CP1.6, Pt/0.25CP1.6, and Pt/0.5CP1.6, Figure S2: TEM images of Pt/0.1CP0, Pt/0.1CP1.4, Pt/0.1CP1.6, Pt/0.1CP1.8, Pt/0.05CP1.6, Pt/0.25CP1.6, and Pt/0.5CP1.6, Figure S3: Cyclic voltammetry (CV) diagrams of (a) Pt/0.1CP0, Pt/0.1CP1.4, Pt/ Pt/0.1CP1.6, Pt/0.1CP1.8, and Pt/C/CP and (b) Pt/0.05CP1.6, Pt/0.1CP1.6, Pt/0.25CP1.6, and Pt/0.5CP1.6 after 5000 cycles of aging in 0.5 M H2SO4, 10 mV·s−1 sweep rate, O2 environment.

Author Contributions

Conceptualization, methodology, software, validation, formal analysis, investigation, data curation, and writing—original draft preparation, Y.G.; software, W.Z.; conceptualization, methodology, investigation, and writing—review and editing, L.Z.; conceptualization, investigation, resources, writing—review and editing, supervision, project administration, and funding acquisition, Q.Z. All authors have read and agreed to the published version of the manuscript.

Funding

This research was funded by the Fundamental Research Funds for the Central Universities, grant number 222202117013.

Data Availability Statement

The data presented in this study are available on request from the corresponding author.

Conflicts of Interest

The authors declare no conflicts of interest.

References

  1. Chen, Y.; Huang, Z.; Yu, J.; Wang, H.; Qin, Y.; Xing, L.; Du, L. Research Progress of Pt-Based Catalysts toward Cathodic Oxygen Reduction Reactions for Proton Exchange Membrane Fuel Cells. Catalysts 2024, 14, 569. [Google Scholar] [CrossRef]
  2. Zhang, X.; Li, H.; Yang, J.; Lei, Y.; Wang, C.; Wang, J.; Tang, Y.; Mao, Z. Recent Advances in Pt-Based Electrocatalysts for PEMFCs. RSC Adv. 2021, 11, 13316–13328. [Google Scholar] [CrossRef] [PubMed]
  3. Zhou, L.; Guo, Y.; Xu, Y.; Li, P.; Zhang, Q. Preparation of Oxygen Reduction Catalyst Electrodes by Electrochemical Acidification and Synergistic Electrodeposition. Catalysts 2024, 14, 300. [Google Scholar] [CrossRef]
  4. Li, T.; Chen, D.; Gu, L.; Chen, S.; Li, C.; Liao, J.; Zhou, Y.; Xu, Y.; Sun, C.; Yang, Z.; et al. Single-Source Precursor Synthesis of Nitrogen-Doped Porous Carbon for High-Performance Electrocatalytic ORR Application. Ceram. Int. 2019, 45, 8354–8361. [Google Scholar] [CrossRef]
  5. Pajootan, E.; Alolabi, S.A.; Omanovic, S.; Coulombe, S. Radiofrequency Plasma-Assisted Pulsed Laser Deposited Pt/TiOxNy Coatings on Multi-Walled Carbon Nanotubes as Gas Diffusion Electrodes for the Oxygen Reduction Reaction. Adv. Mater. Technol. 2022, 7, 2200196. [Google Scholar] [CrossRef]
  6. Zhao, H.; Zhang, Y.; Li, L.; Geng, X.; Yang, H.; Zhou, W.; Sun, C.; An, B. Synthesis of an Ordered Porous Carbon with the Dual Nitrogen-Doped Interfaces and Its ORR Catalysis Performance. Chin. Chem. Lett. 2021, 32, 140–145. [Google Scholar] [CrossRef]
  7. Liang, J.; Yuan, Q. Effects of Graphitic- and Pyridinic-N Co-Doping on Structure Regulation and ORR Activity of N-Doped Graphene. Appl. Surf. Sci. 2024, 648, 159025. [Google Scholar] [CrossRef]
  8. Lan, Q.; Ye, D.; Zhu, X.; Yang, Y.; Chen, R.; Wang, S.; Zhang, T.; Liao, Q. High-Performance Direct Liquid Fuel Cells Benefited from Highly N-Doped and Defect-Rich Carbon Paper Cathode with Carbon Nanosheets. Carbon 2023, 207, 95–104. [Google Scholar] [CrossRef]
  9. Egetenmeyer, A.; Radev, I.; Durneata, D.; Baumgärtner, M.; Peinecke, V.; Natter, H.; Hempelmann, R. Pulse Electrodeposited Cathode Catalyst Layers for PEM Fuel Cells. Int. J. Hydrogen Energy 2017, 42, 13649–13660. [Google Scholar] [CrossRef]
  10. Eiler, K.; Mølmen, L.; Fast, L.; Leisner, P.; Sort, J.; Pellicer, E. Oxygen Reduction Reaction and Proton Exchange Membrane Fuel Cell Performance of Pulse Electrodeposited Pt–Ni and Pt–Ni–Mo(O) Nanoparticles. Mater. Today Energy 2022, 27, 101023. [Google Scholar] [CrossRef]
  11. Shen, S.; Li, F.; Luo, L.; Guo, Y.; Yan, X.; Ke, C.; Zhang, J. DMF-Coordination Assisted Electrodeposition of Highly Active PtCo Alloy Catalysts for the Oxygen Reduction Reaction. J. Electrochem. Soc. 2018, 165, D43–D49. [Google Scholar] [CrossRef]
  12. Hornberger, E.; Merzdorf, T.; Schmies, H.; Hübner, J.; Klingenhof, M.; Gernert, U.; Kroschel, M.; Anke, B.; Lerch, M.; Schmidt, J.; et al. Impact of Carbon N-Doping and Pyridinic-N Content on the Fuel Cell Performance and Durability of Carbon-Supported Pt Nanoparticle Catalysts. ACS Appl. Mater. Interfaces 2022, 14, 18420–18430. [Google Scholar] [CrossRef]
  13. Lin, J.F.; Wertz, J.; Ahmad, R.; Thommes, M.; Kannan, A.M. Effect of Carbon Paper Substrate of the Gas Diffusion Layer on the Performance of Proton Exchange Membrane Fuel Cell. Electrochim. Acta 2010, 55, 2746–2751. [Google Scholar] [CrossRef]
  14. Xie, Z.; Tang, X.; Yang, P.; Sun, M.; Yang, K.; Huang, Q. Carboxyl-Terminated Butadiene-Acrylonitrile-Modified Carbon Paper for Use of Gas Diffusion Layer in PEM Fuel Cells. Int. J. Hydrogen Energy 2015, 40, 14345–14352. [Google Scholar] [CrossRef]
  15. Wang, Y.; Li, C.; Li, J.; Liu, Z.; Liu, C.; Song, M.; Guo, J.; Gao, X. Electrophoretic Deposition of Graphene Oxide Modified Carbon Paper: Enhance the Interface Strength and Decrease the Interface Resistance. Colloids Surf. Physicochem. Eng. Asp. 2024, 703, 135312. [Google Scholar] [CrossRef]
  16. He, Z.; Su, A.; Gao, C.; Zhou, Z.; Pan, C.; Liu, S. Carbon Paper Modified by Hydrothermal Ammoniated Treatment for Vanadium Redox Battery. Ionics 2013, 19, 1021–1026. [Google Scholar] [CrossRef]
  17. Liu, C.; Li, S. Performance Enhancement of Proton Exchange Membrane Fuel Cell through Carbon Nanofibers Grown In Situ on Carbon Paper. Molecules 2023, 28, 2810. [Google Scholar] [CrossRef]
  18. Park, Y.-C.; Tokiwa, H.; Kakinuma, K.; Watanabe, M.; Uchida, M. Effects of Carbon Supports on Pt Distribution, Ionomer Coverage and Cathode Performance for Polymer Electrolyte Fuel Cells. J. Power Sources 2016, 315, 179–191. [Google Scholar] [CrossRef]
  19. Ahn, C.-Y.; Ahn, J.; Kang, S.Y.; Kim, O.-H.; Lee, D.W.; Lee, J.H.; Shim, J.G.; Lee, C.H.; Cho, Y.-H.; Sung, Y.-E. Enhancement of Service Life of Polymer Electrolyte Fuel Cells through Application of Nanodispersed Ionomer. Sci. Adv. 2020, 6, eaaw0870. [Google Scholar] [CrossRef]
  20. De Bruijn, F.A.; Dam, V.A.T.; Janssen, G.J.M. Review: Durability and Degradation Issues of PEM Fuel Cell Components. Fuel Cells 2008, 8, 3–22. [Google Scholar] [CrossRef]
  21. Komini Babu, S.; Spernjak, D.; Dillet, J.; Lamibrac, A.; Maranzana, G.; Didierjean, S.; Lottin, O.; Borup, R.L.; Mukundan, R. Spatially Resolved Degradation during Startup and Shutdown in Polymer Electrolyte Membrane Fuel Cell Operation. Appl. Energy 2019, 254, 113659. [Google Scholar] [CrossRef]
  22. More, K.; Borup, R.; Reeves, K. Identifying Contributing Degradation Phenomena in PEM Fuel Cell Membrane Electride Assemblies Via Electron Microscopy. ECS Trans. 2006, 3, 717–733. [Google Scholar] [CrossRef]
  23. Zhang, Y.; Antonietti, M. Photocurrent Generation by Polymeric Carbon Nitride Solids: An Initial Step towards a Novel Photovoltaic System. Chem. Asian J. 2010, 5, 1307–1311. [Google Scholar] [CrossRef] [PubMed]
  24. Jia, N.; Martin, R.B.; Qi, Z.; Lefebvre, M.C.; Pickup, P.G. Modification of Carbon Supported Catalysts to Improve Performance in Gas Diffusion Electrodes. Electrochim. Acta 2001, 46, 2863–2869. [Google Scholar] [CrossRef]
  25. Wang, Z.; Han, Y.; Zeng, Y.; Qie, Y.; Wang, Y.; Zheng, D.; Lu, X.; Tong, Y. Activated Carbon Fiber Paper with Exceptional Capacitive Performance as a Robust Electrode for Supercapacitors. J. Mater. Chem. A 2016, 4, 5828–5833. [Google Scholar] [CrossRef]
  26. Sullivan, M.G.; Schnyder, B.; Bärtsch, M.; Alliata, D.; Barbero, C.; Imhof, R.; Kötz, R. Electrochemically Modified Glassy Carbon for Capacitor Electrodes Characterization of Thick Anodic Layers by Cyclic Voltammetry, Differential Electrochemical Mass Spectrometry, Spectroscopic Ellipsometry, X-Ray Photoelectron Spectroscopy, FTIR, and AFM. J. Electrochem. Soc. 2000, 147, 2636. [Google Scholar] [CrossRef]
  27. Ci, S.; Wen, Z.; Chen, J.; He, Z. Decorating Anode with Bamboo-like Nitrogen-Doped Carbon Nanotubes for Microbial Fuel Cells. Electrochem. Commun. 2012, 14, 71–74. [Google Scholar] [CrossRef]
  28. Achour, A.; Vizireanu, S.; Dinescu, G.; Le Brizoual, L.; Djouadi, M.-A.; Boujtita, M. Electrochemical Anodic Oxidation of Nitrogen Doped Carbon Nanowall Films: X-Ray Photoelectron and Micro-Raman Spectroscopy Study. Appl. Surf. Sci. 2013, 273, 49–57. [Google Scholar] [CrossRef]
  29. Wang, J.; Yin, G.; Shao, Y.; Zhang, S.; Wang, Z.; Gao, Y. Effect of Carbon Black Support Corrosion on the Durability of Pt/C Catalyst. J. Power Sources 2007, 171, 331–339. [Google Scholar] [CrossRef]
  30. Shang, N.G.; Au, F.C.K.; Meng, X.M.; Lee, C.S.; Bello, I.; Lee, S.T. Uniform Carbon Nanoflake Films and Their Field Emissions. Chem. Phys. Lett. 2002, 358, 187–191. [Google Scholar] [CrossRef]
  31. Zhang, G.; Yang, D.; Sacher, E. X-Ray Photoelectron Spectroscopic Analysis of Pt Nanoparticles on Highly Oriented Pyrolytic Graphite, Using Symmetric Component Line Shapes. J. Phys. Chem. C 2007, 111, 565–570. [Google Scholar] [CrossRef]
  32. Wakisaka, M.; Suzuki, H.; Mitsui, S.; Uchida, H.; Watanabe, M. Increased Oxygen Coverage at Pt−Fe Alloy Cathode for the Enhanced Oxygen Reduction Reaction Studied by EC−XPS. J. Phys. Chem. C 2008, 112, 2750–2755. [Google Scholar] [CrossRef]
  33. Balbuena, P.B.; Altomare, D.; Vadlamani, N.; Bingi, S.; Agapito, L.A.; Seminario, J.M. Adsorption of O, OH, and H2O on Pt-Based Bimetallic Clusters Alloyed with Co, Cr, and Ni. J. Phys. Chem. A 2004, 108, 6378–6384. [Google Scholar] [CrossRef]
  34. Cao, F.; Zang, Z.; Sun, S.; Sun, X.; Li, X.; Liu, T.; Wu, J. The influence of deposited potential on the ORR activity of Pt catalysts on glassy carbon electrode. RSC Adv. 2017, 7, 25429–25436. [Google Scholar] [CrossRef]
  35. Guan, D.; Zhong, J.; Xu, H.; Huang, Y.-C.; Hu, Z.; Chen, B.; Zhang, Y.; Ni, M.; Xu, X.; Zhou, W.; et al. A Universal Chemical-Induced Tensile Strain Tuning Strategy to Boost Oxygen-Evolving Electrocatalysis on Perovskite Oxides. Appl. Phys. Rev. 2022, 9, 011422. [Google Scholar] [CrossRef]
  36. Darling, R.M.; Meyers, J.P. Kinetic Model of Platinum Dissolution in PEMFCs. J. Electrochem. Soc. 2003, 150, A1523. [Google Scholar] [CrossRef]
  37. Perdew, J.P.; Burke, K.; Ernzerhof, M. Generalized Gradient Approximation Made Simple. Phys. Rev. Lett. 1996, 77, 3865–3868. [Google Scholar] [CrossRef]
  38. Blöchl, P.E. Projector Augmented-Wave Method. Phys. Rev. B 1994, 50, 17953–17979. [Google Scholar] [CrossRef]
  39. Monkhorst, H.J.; Pack, J.D. Special Points for Brillouin-Zone Integrations. Phys. Rev. B 1976, 13, 5188–5192. [Google Scholar] [CrossRef]
  40. Ou, L.; Chen, S. Comparative Study of Oxygen Reduction Reaction Mechanisms on the Pd(111) and Pt(111) Surfaces in Acid Medium by DFT. J. Phys. Chem. C 2013, 117, 1342–1349. [Google Scholar] [CrossRef]
Figure 1. The adsorption model of O, OH, OOH on (a) the Pt/C model, (b) the Pt/CN model, and (c) the Pt/CO model.
Catalysts 15 00403 g001
Figure 2. The adsorption energy plots (a) and ORR free energy change plots (b) of Pt/C, Pt/CN, and Pt/CO.
Catalysts 15 00403 g002
Figure 3. (a) Fourier transform infrared (FTIR) images of the 0.1CP0, 0.1CP1.4, 0.1CP1.6, and 0.1CP1.8; (b) Raman diagrams of the 0.1CP0, 0.1CP1.4, 0.1CP1.6, and 0.1CP1.8; (c) XPS C1s of 0.1CP0 and 0.1CP1.8; and (d) XPS N1s of 0.1CP0 and 0.1CP1.8.
Catalysts 15 00403 g003
Figure 4. XPS C1s of (a) 0.1CP0 and Pt/0.1CP0, (b) 0.1CP1.4 and Pt/0.1CP1.4, (c) 0.1CP1.6 and Pt/0.1CP1.6, and (d) 0.1CP1.8 and Pt/0.1CP1.8.
Catalysts 15 00403 g004
Figure 5. Pt4f of (a) Pt/0.1CP0, (b) Pt/0.1CP1.4, (c) Pt/0.1CP1.6, and (d) Pt/0.1CP1.8.
Catalysts 15 00403 g005
Figure 6. SEM images of (a) 0.1CP0, (b) 0.1CP1.4, (c) 0.1CP1.6, (d) 0.1CP1.8, (e) Pt/0.1CP0, (f) Pt/0.1CP1.4, (g) Pt/0.1CP1.6, and (h) Pt/0.1CP1.8; (i) TEM image of Pt/0.1CP1.6; (j) X-ray diffraction (XRD) patterns of the 0.1CP0, 0.1CP1.4, 0.1CP1.6, 0.1CP1.8, Pt/0.1CP0, Pt/0.1CP1.4, Pt/0.1CP1.6, and Pt/0.1CP1.8.
Catalysts 15 00403 g006aCatalysts 15 00403 g006b
Figure 7. (a) Cyclic voltammetry (CV) diagrams of Pt/0.1CP0, Pt/0.1CP1.4, Pt/0.1CP1.6, Pt/0.1CP1.8, and Pt/C/CP; (b) linear sweep voltammetry (LSV) diagrams; (c) ECSA and (d) Tafel slope of the different catalyst electrodes before 5000 cycles aging in 0.5 M H2SO4, 10 mV·s−1 sweep rate, O2 environment.
Catalysts 15 00403 g007
Figure 8. XPS C1s of (a) 0.05CP1.6 and Pt/0.05CP1.6, (b) 0.1CP1.6 and Pt/0.1CP1.6, (c) 0.25CP1.6 and Pt/0.25CP1.6, and (d) 0.5CP1.6 and Pt/0.5CP1.6.
Catalysts 15 00403 g008
Figure 9. Pt4f of (a) Pt/0.05CP1.6, (b) Pt/0.1CP1.6, (c) Pt/0.25CP1.6, and (d) Pt/0.5CP1.6.
Catalysts 15 00403 g009
Figure 10. SEM images of (a) 0.05CP1.6, (b) 0.1CP1.6, (c) 0.25CP1.6, (d) 0.5CP1.6, (e) Pt/0.05CP1.6, (f) Pt/0.1CP1.6, (g) Pt/0.25CP1.6, and (h) Pt/0.5CP1.6; X-ray diffraction (XRD) patterns of (i) 0.05CP1.6, 0.1CP1.6, 0.25CP1.6, 0.5CP1.6 and (j) Pt/0.05CP1.6, Pt/0.1CP1.6, Pt/0.25CP1.6 and Pt/0.5CP1.6.
Catalysts 15 00403 g010
Figure 11. (a) Cyclic voltammetry (CV) diagrams of Pt/0.05CP1.6, Pt/0.1CP1.6, Pt/0.25CP1.6, and Pt/0.5CP1.6; (b) linear sweep voltammetry (LSV) diagrams, and (c) the ECSA and (d) Tafel slope of different catalyst electrodes before 5000 cycles aging in 0.5 M H2SO4, 10 mV·s−1 sweep rate, O2 environment.
Catalysts 15 00403 g011
Table 1. Relative content of C, N, and O elements in the XPS full spectrum of 0.1CP0, 0.1CP1.4, 0.1CP1.6, and 0.1CP1.8.
SubstratesC:OC:NCatalystsC:OC:NPt Wt%
0.1CP014.0-Pt/0.1CP010.8-83.7
0.1CP1.44.984.8Pt/0.1CP1.46.277.869.7
0.1CP1.63.538.4Pt/0.1CP1.610.664.264.4
0.1CP1.82.629.8Pt/0.1CP1.811.559.447.8
Table 2. Relative content of the C, N, and O elements in the XPS full spectrum of 0.05CP1.6, 0.1CP1.6, 0.25CP1.6 and 0.5CP1.6.
SubstratesC:OC:NCatalystsC:OC:NPt Wt%
0.05CP1.64.994.7Pt/0.05CP1.614.999.679.6
0.1CP1.63.238.4Pt/0.1CP1.610.664.264.4
0.25CP1.63.440.4Pt/0.25CP1.611.263.053.8
0.5CP1.62.629.8Pt/0.5CP1.614.255.847.8
Disclaimer/Publisher’s Note: The statements, opinions and data contained in all publications are solely those of the individual author(s) and contributor(s) and not of MDPI and/or the editor(s). MDPI and/or the editor(s) disclaim responsibility for any injury to people or property resulting from any ideas, methods, instructions or products referred to in the content.

