Article

Photocatalytic Degradation of Acridine Orange over NaBiO3 Driven by Visible Light Irradiation

1
Department of General Education, National Taichung University of Science and Technology, Taichung 403, Taiwan
2
Department of Science Application and Dissemination, National Taichung University of Education, Taichung 403, Taiwan
3
General Education Center, Jen-Teh Junior College of Medicine, Nursing and Management, Houlong, Miaoli County 356, Taiwan
4
Department of Applied Chemistry, Providence University, Taichung 433, Taiwan
*
Author to whom correspondence should be addressed.
Catalysts 2013, 3(2), 501-516; https://doi.org/10.3390/catal3020501
Submission received: 1 March 2013 / Revised: 3 May 2013 / Accepted: 10 May 2013 / Published: 21 May 2013
(This article belongs to the Special Issue Photocatalysts)

Abstract

:
The photocatalytic degradation of acridine orange (AO) dye by NaBiO3 photocatalyst under visible light irradiation was investigated systematically. The NaBiO3 photocatalyst exhibited a higher photocatalytic activity compared to the P25 photocatalyst. After 160 min of photocatalytic reaction, the degradation rate of AO could reach to 99% in appropriate conditions. Factors, such as catalyst dosage, solution pH, initial AO concentration and the presence of anions, were found to influence the degradation rate. To scrutinize the mechanistic details of the dye photodegradation, the intermediates of the processes were separated, identified and characterized by the HPLC-ESI-MS technique. The analytical results indicated that the N-de-methylation degradation of AO dye took place in a stepwise manner to yield mono-, di-, tri- and tetra-N-de-methylated AO species generated during the processes. The probable photodegradation pathways were proposed and discussed.

Graphical Abstract

1. Introduction

Acridine orange (AO) is a heterocyclic dye containing nitrogen atoms, which is widely used in the fields of printing and dyeing, leather, printing ink and lithography [1]. It has also been used extensively in biological stains. Toxicological investigations indicate that aminoacridine has mutagenic potential [2]. The release of this colored wastewater in the ecosystem is a dramatic source of water pollution, eutrophication and perturbation in aquatic life [3]. Therefore, a method of treating wastewater containing AO is highly desirable now and in the near future.
In the recent 20 years, TiO2 has been the photocatalyst that is most extensively studied, and the applications of TiO2 and its modification to photocatalytic degradation of dyes have been extensively reported [4,5,6,7]. TiO2 possesses several excellent properties, such as outstanding oxidative power, photostability, nontoxicity and low cost [8]. However, the photocatalytic activity of TiO2 in visible light is extremely low, due to its wide band gap (3.2 eV), which is unable to allow efficient absorption of the most sunlight. It can only utilize less than 5% of solar energy [9]. Therefore, it is very important to develop visible light-sensitive photocatalyst, which can efficiently utilize inexpensive and inexhaustible solar energy.
NaBiO3 is a new efficient photocatalyst [10], which was firstly reported by Kako et al. Their results indicate that NaBiO3 showed a higher photocatalytic activity towards methylene blue compared to some other visible light-sensitive semiconductor compounds, such as N doped TiO2 and BiVO4. Takei et al. [11] studied the photocatalytic behavior of some bismutates with Bi5+ and found that NaBiO3 showed the highest activity for phenol decomposition among nine Bi5+ photocatalysts. Kou et al. [12] investigated the photocatalytic oxidation of polycyclic aromatic hydrocarbons over NaBiO3 under visible light irradiation. Their results show that NaBiO3 presented an efficient degradation towards the organic compounds. The photocatalytic degradation of sodium pentachlorophenate (PCP-Na) and 4-t-octylphenol (4-t-OP) over NaBiO3 under visible light irradiation was reported by Chang et al. [13,14]. Their results show that PCP-Na and 4-t-OP in aqueous solutions can be efficiently decomposed in the NaBiO3/visible light process. The photocatalytic degradation of Rhodamine-B over NaBiO3 under visible light irradiation was investigated by Yu et al. [15]. The major concern was aimed at the investigation of the influence of crystal water on photoactivity of NaBiO3, as well as the separation and identification of the reaction intermediates and the presentation of mechanistic details of the photochemical process.
In contrast with the widely studied TiO2 (more than 1500 papers), limited articles have been reported on the degradation of organic compounds under visible light in the presence of NaBiO3. As far as we are aware, no results have been reported on the photodegradation of acridine orange using NaBiO3 as catalyst. Herein, we evaluate the photocatalytic performance of AO over NaBiO3 under visible light irradiation. In our study, various parameters that may affect the photodegradation of AO in the presence of NaBiO3 suspensions were analyzed to obtain a more complete knowledge of NaBiO3 photocatalytic efficiency. This study also focused on the identification of the reaction intermediates and understanding of the mechanistic details of the photodegradation of AO in the NaBiO3/visible light process, as a foundation for future application of this energy-saving technology.

2. Results and Discussion

2.1. Characterization of NaBiO3

Figure 1 shows the X-ray diffraction patterns of the commercial NaBiO3 powder. Corresponding patterns of the same batch of NaBiO3 powder after subjecting them to catalytic reaction (Figure 2) are also included for comparison. The XRD patterns of NaBiO3 powder after reaction closely match those of before the reaction, though there are some minor differences in the relative intensity of peaks. It also could be observed that the characteristic peaks of (0 0 1), (1 0 0), (1 0 1), (1 1 0) and (1 1 1) planes of commercial NaBiO3 powder match those peaks of standard XRD JCPDS card for NaBiO3·2H2O [16]. It is obvious that the commercial NaBiO3 used in our study is NaBiO3·2H2O.
Figure 1. XRD pattern of the commercial NaBiO3 powder.
Catalysts 03 00501 g001
Figure 2. XRD pattern of the used NaBiO3 powder (after catalytic reaction).
Catalysts 03 00501 g002
Figure 3 shows the morphology of the commercial NaBiO3 powder under a field-emission SEM microscope. The SEM analysis indicated that the commercial NaBiO3 displayed the shape of leaf-like flakes. The lengths of the leaf-like flakes are about 125–180 nm, the thickness of these leaf-like flakes are about 20–30 nm. The Brunauer-Emmett-Teller (BET) measurement showed that the specific surface area of the commercial NaBiO3 powder was 27.63 ± 0.14 m²/g.
Figure 3. SEM image of the commercial NaBiO3 powder.
Catalysts 03 00501 g003

2.2. Photocatalytic Reaction

2.2.1. Effect of Catalyst Dosage

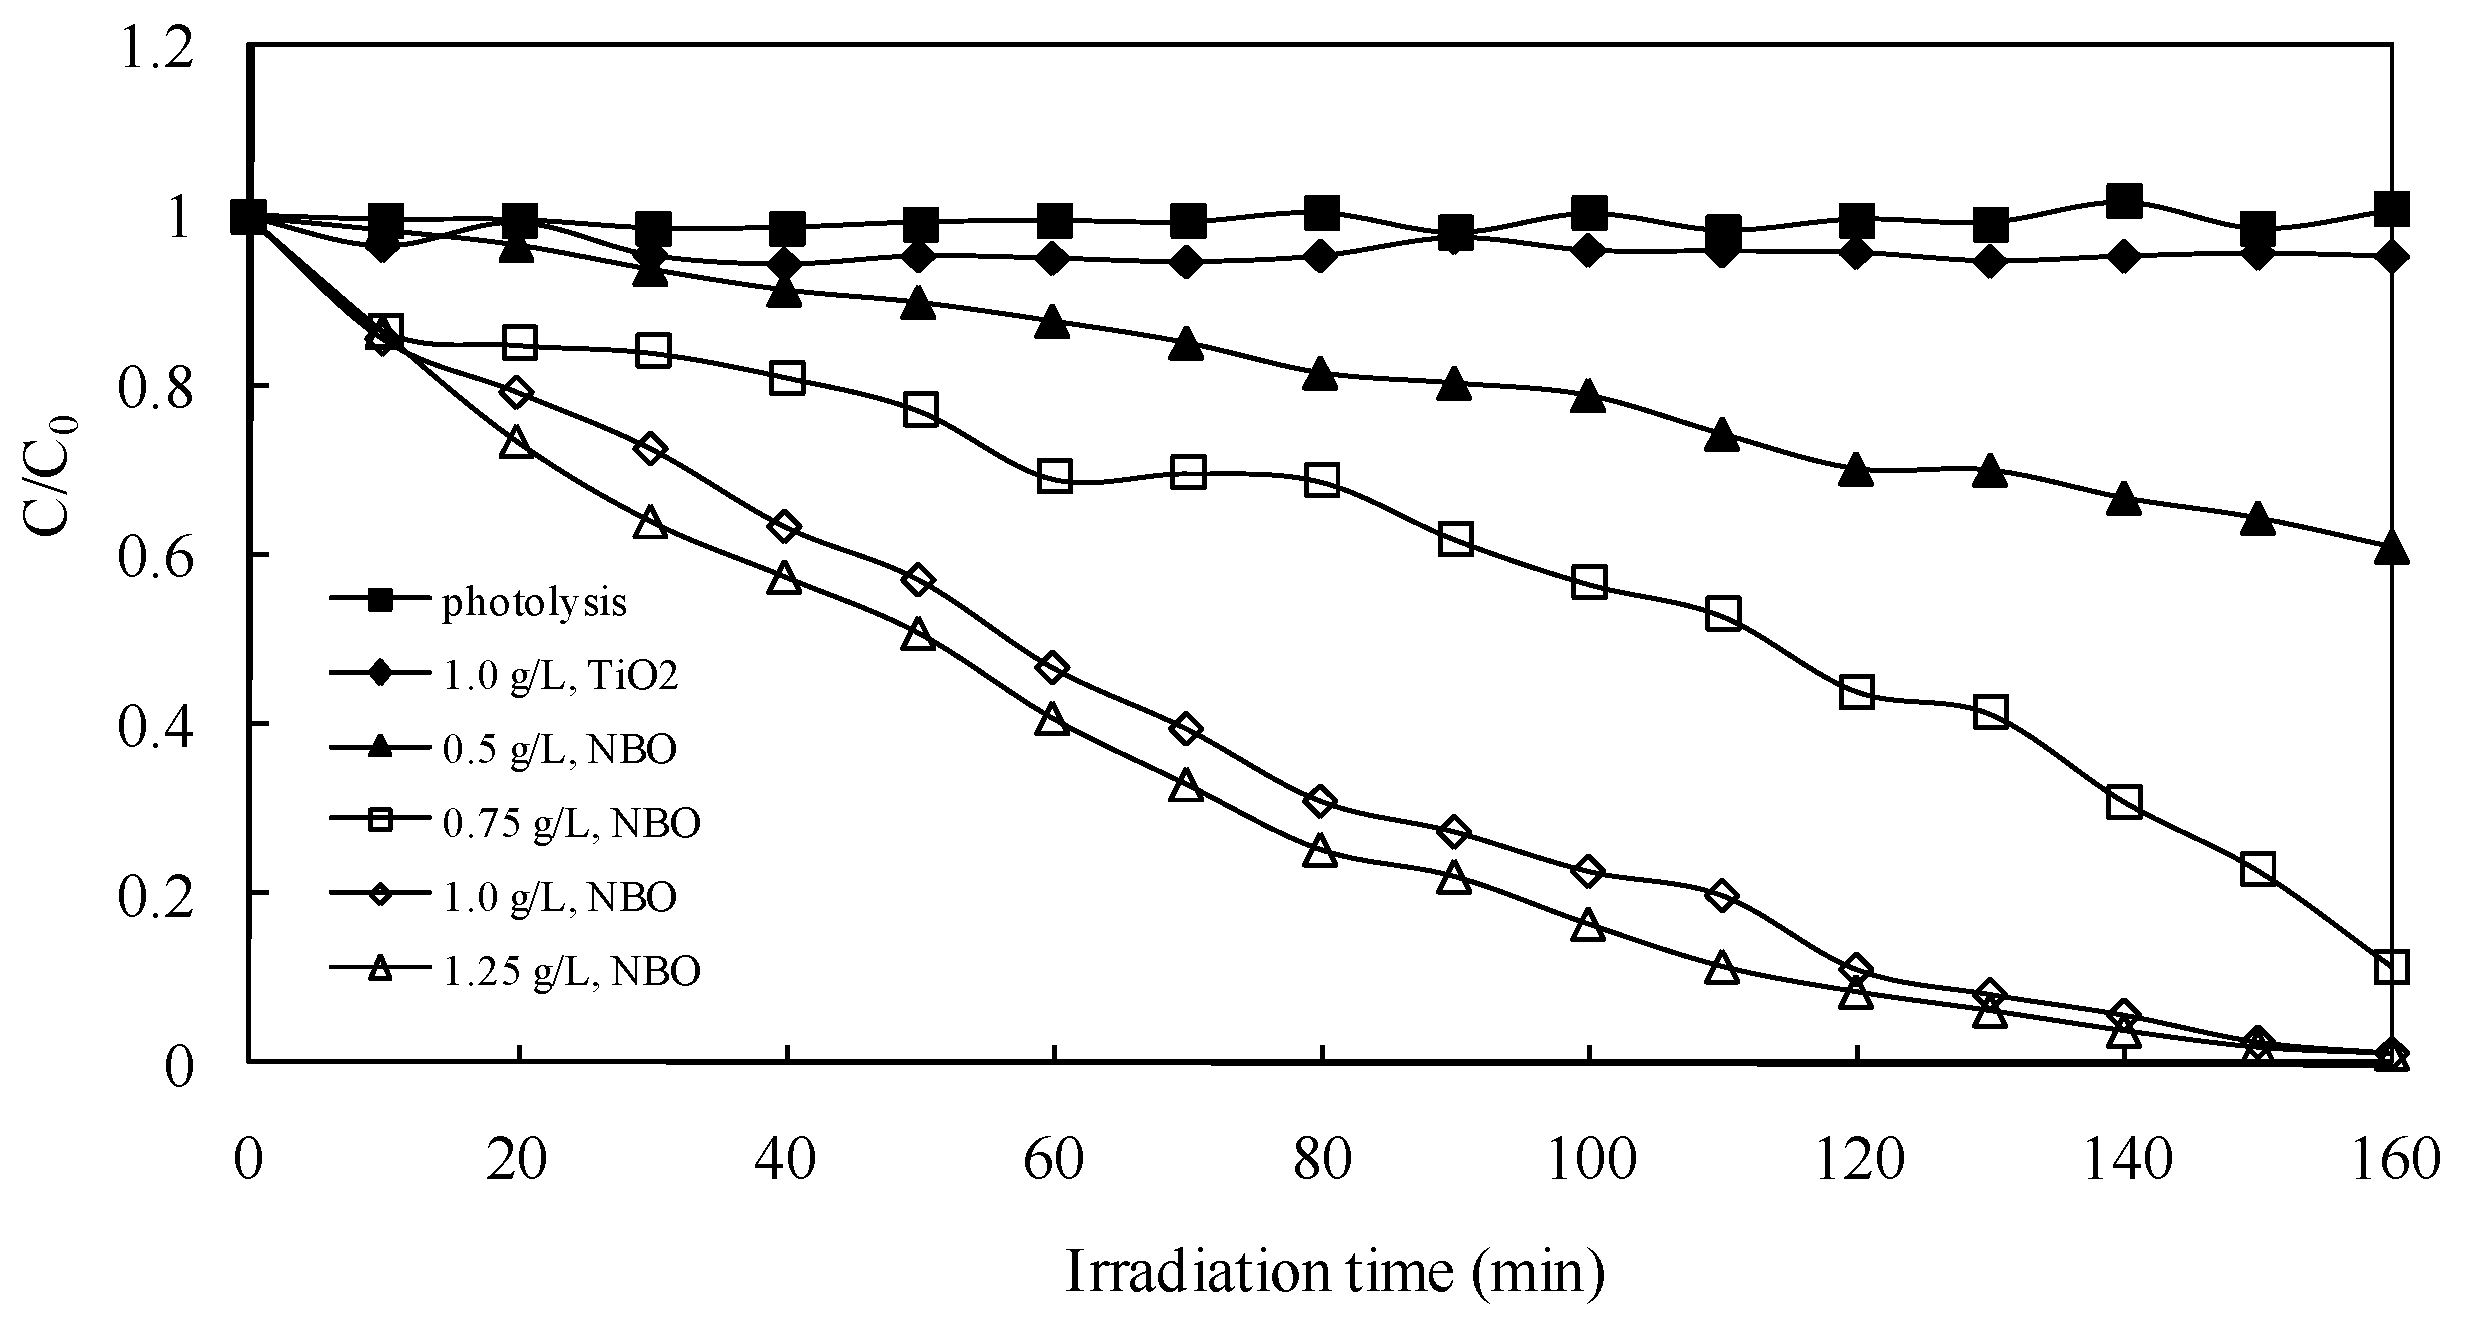
In photocatalytic processes, the amount of photocatalyst is an important parameter that can affect the degradation rate of organic compounds. In order to obtain the optimum catalyst dosage, the relationship between the dosage and degradation rate was investigated, as shown in Figure 4. The results clearly show that degradation under visible light irradiation without catalysts for 160 min was negligibly small, compared with the results obtained in the presence of NaBiO3 photocatalysts with different dosages. The smaller amount of NaBiO3 powders exhibited a lower degradation rate, because not enough catalytic active sites were supplied during the photocatalytic process. The maximum degradation rate after 160 min was around 99% when the optimum dosage (1 g L−1) was employed. However, the degradation rate begins to be in equilibrium if the dosage is much higher than this value.
As a comparison, the results of AO degradation over TiO2 (P25, 1 g L−1) under the same irradiation condition are also given in Figure 4. The TiO2 showed little photocatalytic activity (degradation rate less than 6%) under the visible light irradiation, because of its UV-only sensitive property [13]. Compared to TiO2 photocatalyst, NaBiO3 exhibited an extremely efficient photocatalytic performance (degradation rate is over 99%) towards AO under visible light irradiation. The excellent performance could be attributed to the hybridized sp orbital in the conduction band of NaBiO3 (Na 3s and O 2p hybridized orbits), supporting a high mobility on the sp bands for the photo-excited electrons, which may lead to suppression of the recombination of electron-hole pair and a relatively higher photocatalytic activity of the material than that of other photocatalysts [14].
Figure 4. Effect of NaBiO3 dosage on the photocatalytic degradation rate of acridine orange (AO). Experimental conditions: AO concentration 0.1 g L−1; pH 8.
Catalysts 03 00501 g004

2.2.2. Effect of Initial pH Value and Dye Concentration

The pH value of AO solution is also a key parameter that can affect the photocatalytic process dramatically. The influence of the initial pH value on the photodegradation rate of AO dye for the NaBiO3 suspensions is shown in Figure 5. The results indicated that the degradation rate decreased with a decrease in pH, and it proceeded much faster under an alkaline pH. When the initial pH rose from 4.0 to 8.0, the degradation rate of AO within 160 min increased significantly from 86.7% to 99.0%. The observed increase of the degradation rate with an increase in pH can be attributed to the high hydroxylation of the photocatalyst’s surface, due to the presence of a large quantity of OH ions, which would facilitate the formation of much more OH. Since hydroxyl free radical is the dominant oxidizing species in the photocatalytic process [17], the photodegradation of AO is therefore accelerated in an alkaline medium.
Figure 5. Effect of pH on the photocatalytic degradation rate of AO. Experimental conditions: AO concentration 0.1 g L−1; NaBiO3 concentration 1.0 g L−1.
Catalysts 03 00501 g005
By varying the initial dye concentration from 0.05 to 0.20 g L−1 at constant NaBiO3 dosage (1.0 g L−1, pH 8), its effect on the degradation rate could be determined, and the results are shown in Figure 6. As seen in the figure, degradation efficiency is inversely affected by the dye concentration. This negative effect can be explained as follows: as the dye concentration is increased, the equilibrium adsorption of dye on the catalyst surface active sites increases; hence, competitive adsorption of OH on the same sites decreases, meaning a lower formation rate of OH radical, which is the principal oxidant necessary for a high degradation efficiency. On the other hand, considering the Beer-Lambert law, as the initial dye concentration increases, the path length of photons entering the solution decreases, resulting in lower photon absorption on catalyst particles and, consequently, a lower photodegradation rate.
Figure 6. Effect of initial dye concentration on the photocatalytic degradation rate of AO. Experimental conditions: NaBiO3 concentration 1.0 g L−1; pH 8.
Catalysts 03 00501 g006

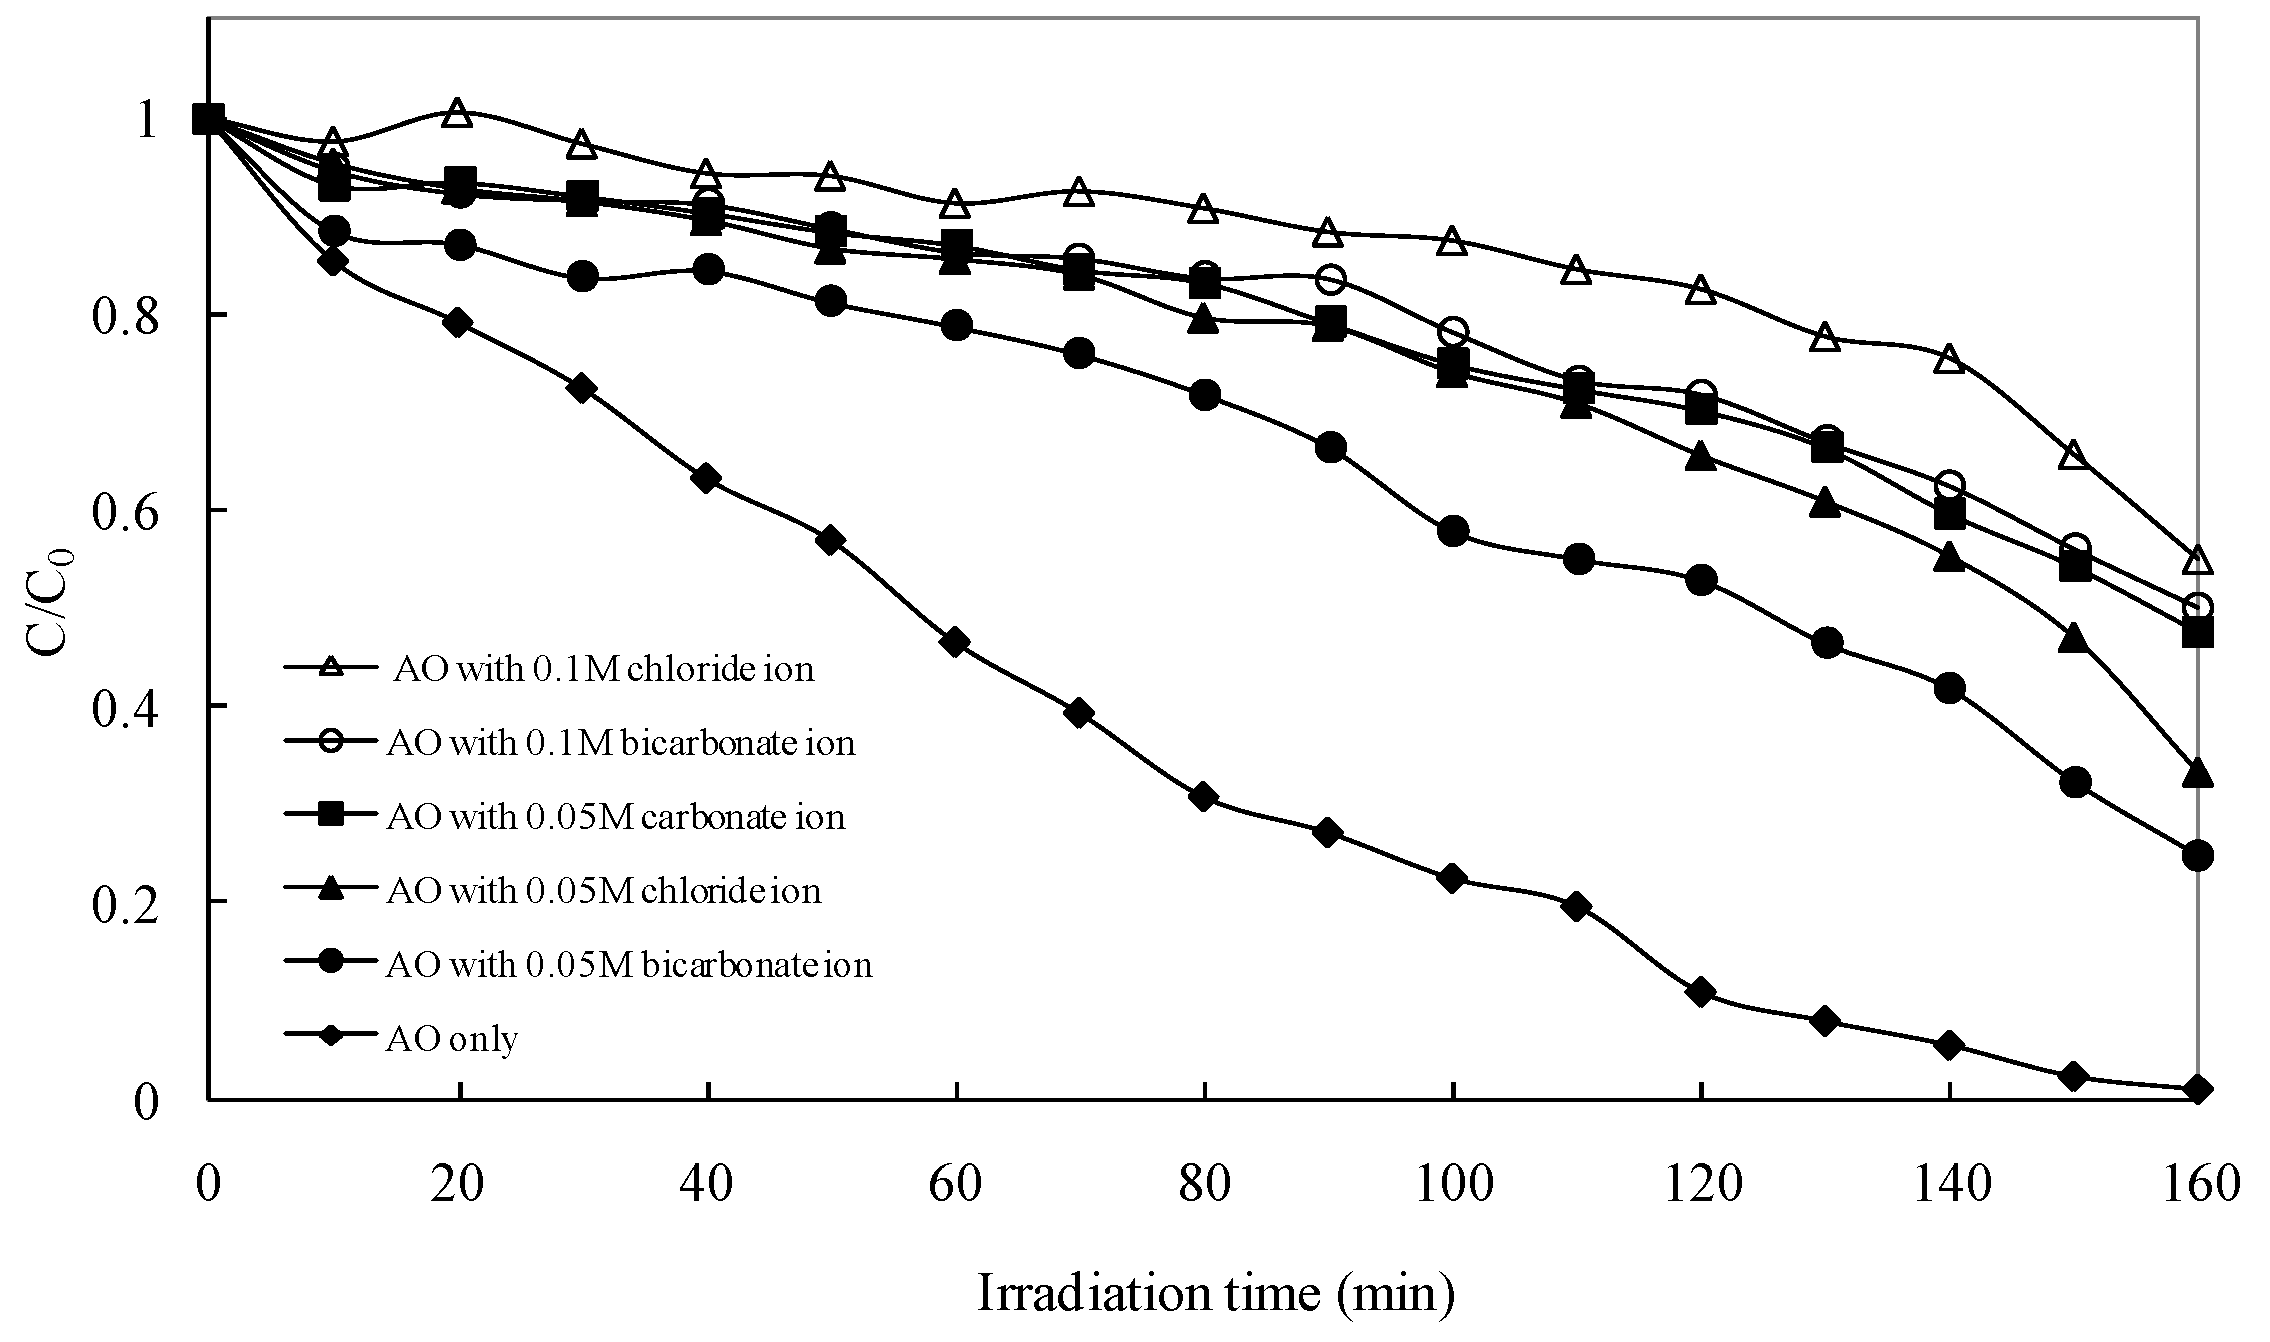
2.2.3. Effects of Anions

The study of the effects of anions on the photocatalytic degradation of AO is important, because anions are rather common in natural water and industrial wastewater. The effects of the presence of various anions, such as chloride, bicarbonate and carbonate, were studied using 0.05 M solutions of their sodium salts and an initial concentration of 0.1 g L−1 of AO with a 1 g L−1 of NaBiO3. The results showed that all these anions inhibit the degradation significantly (see Figure 7). To investigate the effects of variations of the concentration of anions on the degradation rate of AO, chloride and bicarbonate were also added at a different concentration (0.1 M) in the initial solution. It can be seen that the photocatalytic degradation efficiency of AO decreases further with increasing the concentration of anions. Inhibition effects of anions can be explained as the reaction of hydroxyl radical with anions that behaved as OH radical scavengers (Equations (1)–(3)) resulting in prolonged AO removal. Formation of inorganic radical anions (e.g., Cl, CO3•−) under these circumstances is possible.
Cl + OH→Cl + OH
CO32− + OH→CO3•− + OH
HCO3 + OH→CO3•− + H2O
However, these radicals have a lower oxidation potential than hydroxyl radicals (E0(CO3•−/CO32−) = 1.85 V, E0(Cl/Cl) = 2.47 V, E0(OH/H2O) = 2.80 V); they are not as reactive as OH, and thus the rate of photocatalytic degradation is reduced [18,19,20].

2.2.4. Evolution of Total Organic Carbon (TOC)

The complete degradation of an organic molecule by photocatalysis normally leads to the conversion of all its carbon atoms to gaseous CO2 and of the heteroatoms into inorganic anions that remain in solution. In order to study the total mineralization of AO, the determination of total organic carbon (TOC) was carried out as a function of the irradiation time. The decrease in the TOC percentage of AO during the photocatalytic degradation is depicted in Figure 8. The complete removal of AO (0.1 g L−1) was achieved after 160 min of treatment, and the corresponding carbon mineralization was 44%. The treatment was prolonged to 16 h to test whether mineralization could be completed, as well. Approximately 77% of AO was mineralized within 16 h of the photocatalytic reaction time. Complete mineralization of AO was not achieved after 16 h of oxidation, although AO disappeared after 160 min. The great difference between degradation efficiency and mineralization efficiency implied that the products of AO oxidation mostly stayed at the intermediate product stage under the present experimental conditions.
Figure 7. Effect of anions on the photocatalytic degradation rate of AO. Experimental conditions: AO concentration 0.1 g L−1; NaBiO3 concentration 1.0 g L−1; pH 8.
Catalysts 03 00501 g007
Figure 8. Depletion in total organic carbon (TOC) measured as a function of irradiation time for an aqueous solution of AO (0.1 g L−1) in the presence of NaBiO3 (1.0 g L−1).
Catalysts 03 00501 g008

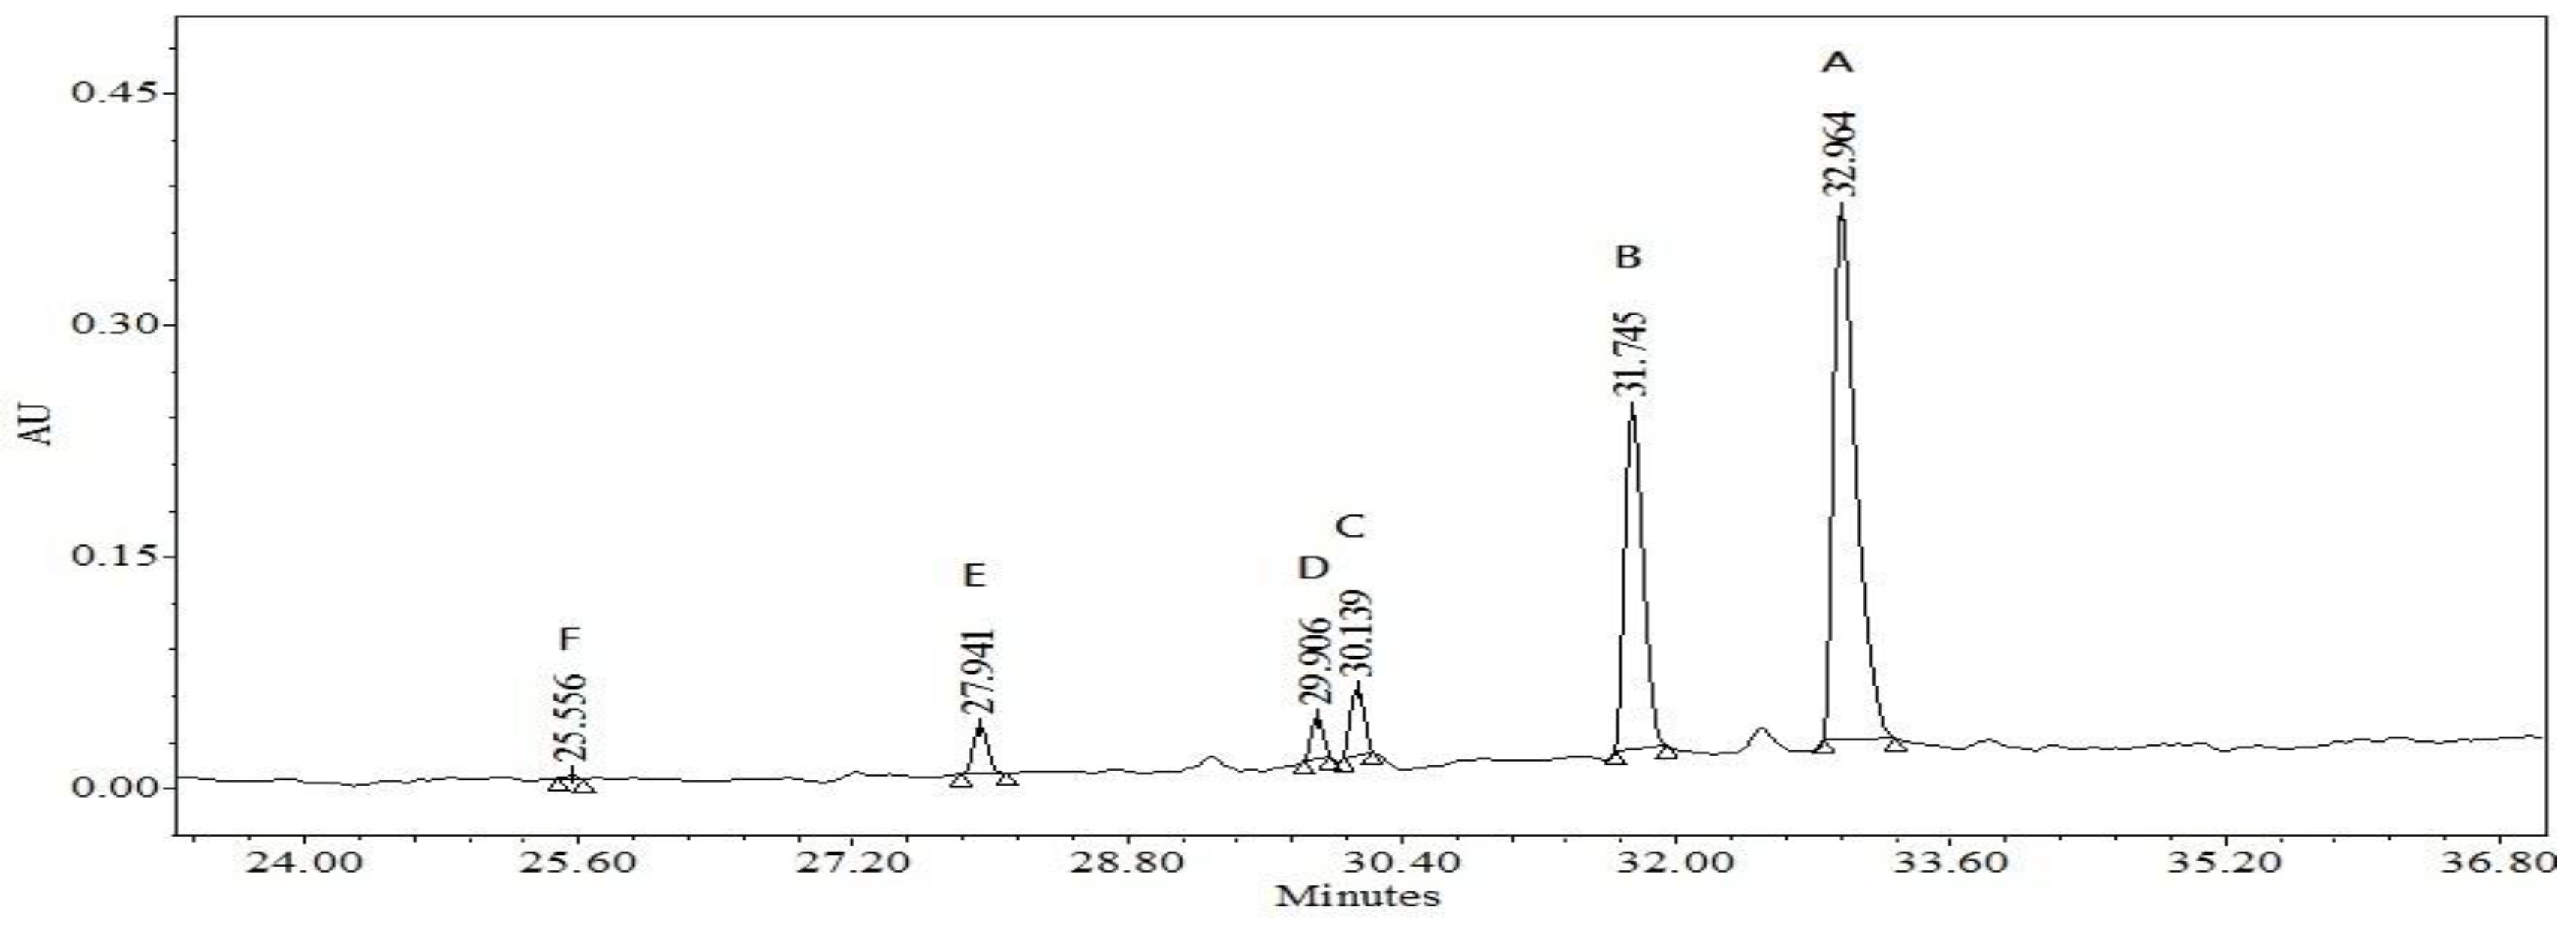
2.2.5. Separation and Identification of the Intermediates

Analyses of the intermediates would help to better comprehend the details of the reaction process. Because of the spectral overlap between the original dye and its degradation intermediates, temporal variations during the photooxidation of AO were monitored by HPLC equipped with a UV-visible diode array detector. The chromatogram recorded at 492 nm is shown in Figure 9. With irradiation up to 120 min, six components were identified, all with retention times less than 34 min. We denoted the AO dye and its related intermediates as species A–F. Except for the initial AO dye (peak A), the intensities of the other peaks increased at first and, subsequently, decreased, indicating the formation and transformation of the intermediates.
Figure 9. HPLC chromatogram obtained for AO solution after 120 min of irradiation with visible light in the presence of NaBiO3.
Catalysts 03 00501 g009
The absorption spectra of each intermediate in the visible spectral region are depicted in Figure 10. The absorption maximum of the spectral bands shifts hypsochromically from 491.6 nm (Figure 10, spectrum A) to 451.4 nm (Figure 10, Spectrum F). This hypsochromic shift of the absorption band was presumed to result from the stepwise formation of a series of N-de-methylated intermediates (i.e., methyl groups were removed one by one, as confirmed by the gradual peak wavelength shifts toward the blue region). Considering the auxochromic property of the N-methyl group, the characteristic absorption of the intermediate with less N-methyl was expected to occur at a shorter wavelength [21]. Similar phenomena were also observed during the photodegradation of Rhodamine-B over NaBiO3 under visible irradiation [15].
Figure 10. Absorption spectra of the N-de-methylated intermediates formed during the photocatalytic degradation process of the AO.
Catalysts 03 00501 g010
The N-de-methylated intermediates were further confirmed using the HPLC-ESI-MS method (Figure 11). The molecular ion peaks appeared to be in the acid forms of the intermediates. Table 1 presents the absorption maximum and the mass peaks of the N-de-methylated intermediates and the corresponding compounds identified by interpretation of their mass spectra. From the results of mass spectral analysis, we confirmed that the component A, m/z = 266.18, in liquid chromatogram was AO. The other components were B, m/z = 252.07, N-de-mono-methyl-acridine orange; C, m/z = 238.01, N,N’-de-dimethyl-acridine orange; D, m/z = 238.14, N,N-de-dimethyl-acridine orange; E, m/z = 224.03, N,N,N′-de-trimethyl-acridine orange; and F, m/z = 210.04, N,N,N’,N,-de-tetramethyl-acridine orange. These peaks differ exactly by 14 mass units successively, which consist of the sequential 
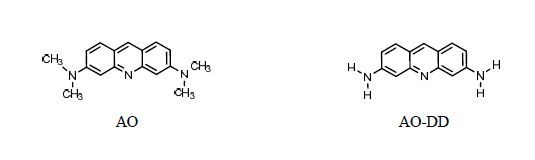
N-de-methylation of maternal AO. The proposed N-tetra-de-methylated intermediate (AO-DD) has been compared with the standard material of 3,6-diaminoacridine. The retention times and absorption spectra are identical.
Figure 11. ESI mass spectra of the N-de-methylated intermediates formed during the photodegradation of the AO dye after they were separated by the HPLC-ESI-MS method.
Catalysts 03 00501 g011
Table 1. Identification of the N-de-methylation intermediates of the AO dye by HPLC-ESI-MS.
HPLC peaksN-de-methylation intermediatesAbbreviationRetention time (min)ESI-MS peaks (m/z)Absorption maximum (nm)
A Catalysts 03 00501 i001AO32.964266.18491.6
B Catalysts 03 00501 i002AO-M31.745252.07478.2
C Catalysts 03 00501 i003AO-MM30.139238.01473.3
D Catalysts 03 00501 i004AO-D29.906238.14466.0
E Catalysts 03 00501 i005AO-DM27.941224.03459.9
F Catalysts 03 00501 i006AO-DD25.556210.04451.4
It is relevant to note that when the solution was monitored at the m/z = 238 mode, two peaks (C and D) appeared in the ion chromatogram. Both of them were regarded to be the intermediates that possess two less methyl groups relative to the AO dye. One of the isomers lost two methyl groups at the same side of AO, noted as AO-D; the other one, formed by removal of a methyl group from each side of the AO molecule, noted as AO-MM. Considering that the polarity of the AO-D species is greater than that of the AO-MM intermediate, we expected the latter to be eluted off the LC column after the AO-D species. As well, to the extent that two N-methyl groups are stronger auxochromic moieties than the N,N-dimethyl or amino groups are, the maximal absorption of the AO-D intermediate was anticipated to occur at a wavelength shorter than the band position of the AO-MM species.
The relative distribution of the N-de-methylated intermediates obtained is illustrated in Figure 12. To minimize errors, the relative intensities were recorded at the maximum absorption wavelength for each intermediate, although a quantitative determination of all of the photogenerated intermediates was not achieved, owing to the lack of the appropriate molar extinction coefficients of these intermediates and the related reference standards. Nonetheless, we clearly observed the changes in the distribution of each intermediate during the photodegradation process of the AO dye. The first product (AO-M) of N-de-methylation reached its maximum concentration after a 20 min irradiation period (Figure 12, curve B). Considering that the N,N-dimethyl group in AO-M is bulkier than the N-methyl group in AO-M molecules, the attack of OH radicals on the N-methyl groups should be favored at the expense of the N,N-dimethyl groups. In accord with this notion, the HPLC results showed that the AO-D intermediate reached maximal concentration before the AO-MM intermediate did. The N-di-de-methylated intermediates (AO-MM and AO-D) were observed (Figure 12, curve C–D) to reach their maximum concentrations after 60 and 40 min irradiation periods, respectively. The N-tri-de-methylated intermediate (AO-DM) was observed (Figure 12, curve E) to reach its maximum concentration after a 80 min irradiation period, because the OH attacked the N-methyl groups of AO-MM and the N,N-dimethyl group of AO-D. The successive appearance of the maximal quantity of each intermediate indicates that the N-de-methylation of AO is a stepwise photochemical process.
Figure 12. Variation in the relative distribution of the N-de-methylated products obtained from the photodegradation of the AO dye as a function of the irradiation time. Curves B–F correspond to the peaks B–F in Figure 9, respectively.
Catalysts 03 00501 g012

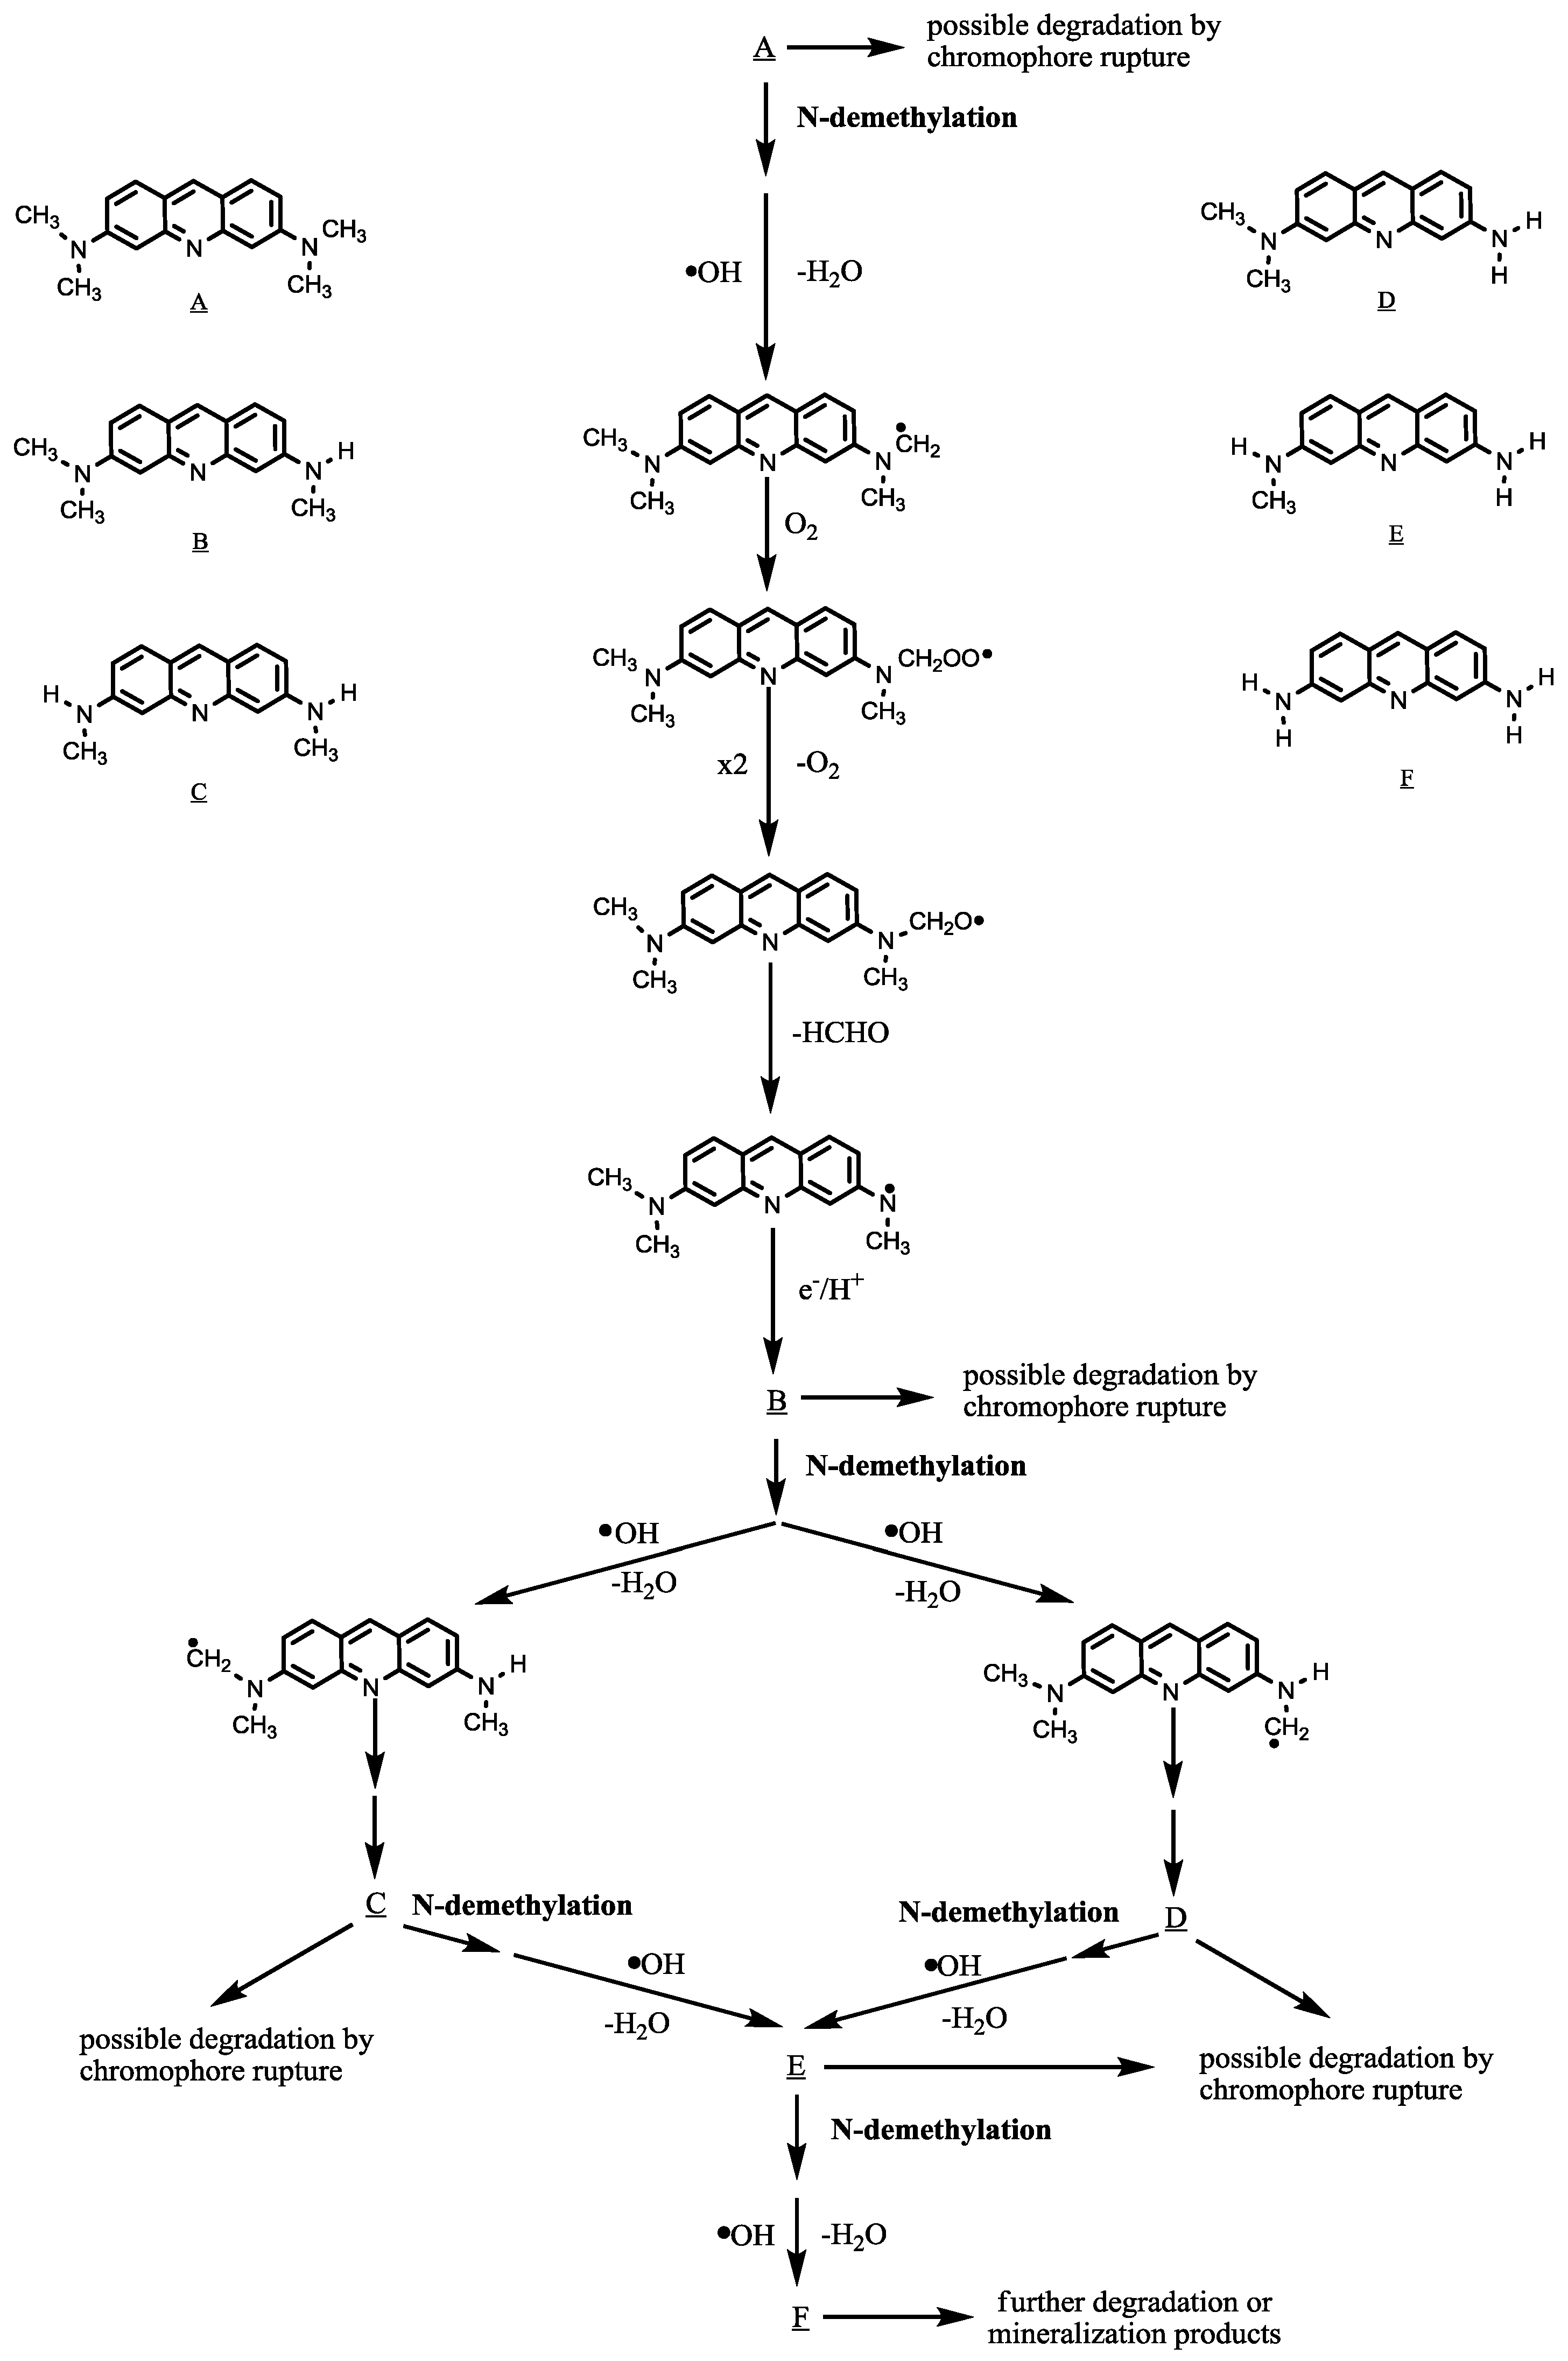
2.2.6. Degradation Pathway of AO

Photocatalytic processes use light to generate conduction band electrons and valence band holes (e and h+) capable of initiating redox chemical reactions on semiconductors. Previous studies indicated that the large dispersion of the hybridized sp orbitals in the conduction band of NaBiO3 increases the mobility of the photoexcited electrons, thus suppressing the recombination of photoexcited electron-hole pairs [14]. The hole photogenerated on the surface of NaBiO3 could easily react with OH/H2O to form ·OH [13]. The N-de-methylation of the AO occurs mostly by the attack of the OH species on the N,N-dimethyl groups of the AO, as shown in Scheme 1. Therefore, N-de-methylation seems play an important role in the degradation of AO. However, in our separate study, to further explore other possible degradation pathway of AO, photocatalysis in NaBiO3 slurries (1.0 g L−1) was conducted with a starting solution of 3,6-diaminoacridine (compound F, AO-DD). The results showed that AO-DD indeed underwent degradation. Unfortunately, none of its degradation by-products were found and identified at this time. It was suspected that degradation followed by the chromophore rupture path might be also possible.
Scheme 1. Proposed photodegradation mechanism of the AO dye under visible light irradiation in aqueous NaBiO3 dispersions, followed by the identification of several intermediates by HPLC-ESI mass spectral techniques.
Catalysts 03 00501 g013
Hydroxyl radicals yield carbon-centered radicals upon the H-atom abstraction from the methyl group or they react with the lone-pair electron on the N atom to generate cationic radicals, which subsequently convert into carbon-centered radicals [22]. The carbon-centered radicals react rapidly with O2 to produce peroxy radicals that subsequently transform into alkoxy radicals through the bimolecular Russell mechanism [23]. The fragmentation of the alkoxy radical produces a de-methylated product. The mono-de-methylated species, AO-M, can also be attacked by OH species and be implicated in other similar events (H-atom abstraction, oxygen attack and the bimolecular Russell mechanism) to yield the bi-de-methylated intermediates, AO-MM and AO-D. The N-de-methylation process, as described above, continues until formation of the completely N-de-methylated species, AO-DD.

3. Experimental Section

3.1. Materials

Acridine orange and 3,6-diaminoacridine were obtained from Sigma-Aldrich and used without further purification. Stock solutions containing 1 g L−1 of AO dye in water were prepared, protected from light and stored at 4 °C. HPLC analysis was employed to confirm the presence of the AO dye as a pure organic compound. Sodium bismuthate (NaBiO3) was purchased from Acros Organics and used as received as a photocatalyst without further purification. P25 TiO2 was obtained from Degussa. Reagent-grade ammonium acetate, sodium hydroxide, nitric acid and HPLC-grade methanol were purchased from Merck. De-ionized water was used throughout this study. The water was purified with a Milli-Q water ion-exchange system (Millipore Co., Billerica, MA, USA) to give a resistivity of 1.8 × 10⁷ Ω-cm.

3.2. Apparatus and Instruments

The apparatus for studying the photocatalytic degradation of AO has been described elsewhere [24]. The C-75 Chromato-Vue cabinet provides a wide area of illumination from the 15-W visible light tubes positioned on two sides of the cabinet interior. A Waters ZQ LC/MS system, equipped with a binary pump, a photodiode array detector, an autosampler and a micromass detector was used for separation and identification. The mineralization of the dye was monitored by measuring the total organic carbon (TOC) content with a Tekmar-Dohrmann Phoenix 8000 TOC Analyzer by directly injecting the aqueous solution.

3.3. Procedures and Analysis

An aqueous suspension was prepared by adding a certain amount of NaBiO3 to a 0.1 L solution containing the AO dye at appropriate concentrations. For reactions in different pH media, the initial pH of the suspensions was adjusted by addition of either NaOH or HNO3 solutions. Prior to irradiation, the suspensions were magnetically stirred in the dark for ca. 30 min to ensure the establishment of the adsorption/desorption equilibrium. Irradiations were carried out using two visible lamps (15 W). The lamp mainly provides visible light in the range of 400–700 nm. The average light intensity striking the surface of the reaction solution was about 1420 lux, as measured by a digital lux meter. At any given irradiation time interval, the suspension was sampled (5 × 10⁻³ L) and centrifuged to separate the NaBiO3 particles.
After each irradiation cycle, the amount of the residual dye was thus determined by HPLC. The analysis of organic intermediates was accomplished by HPLC-ESI-MS after the readjustment of the chromatographic conditions in order to make the mobile phase compatible with the working conditions of the mass spectrometer. Two different kinds of solvents were prepared in this study. Solvent A was 25 mM aqueous ammonium acetate buffer (pH 6.9), while solvent B was methanol. LC was carried out on an Atlantis dC18 column (250 mm × 4.6 mm i.d., dp = 5 μm). The flow rate of the mobile phase was set at 1 × 10⁻³ L/min. A linear gradient was run as follows: t = 0, A = 95, B = 5; t = 20, A = 50, B = 50; t = 35–40, A = 10, B = 90; t = 45, A = 95, B = 5. The column effluent was introduced into the ESI source of the mass spectrometer. Equipped with an ESI interface, the quadruple mass spectrometer with a heated nebulizer probe at 350 °C was used with an ion source temperature of 120 °C. ESI was carried out with the vaporizer at 300 °C, nitrogen as the sheath (80 psi) and auxiliary (20 psi) gas to assist with the preliminary nebulization and to initiate the ionization process. A discharge current of 5 μA was applied. The tube lens and capillary voltages were optimized for the maximum response during perfusion of the AO standard.

4. Conclusions

Our studies suggest that NaBiO3 photocatalysis could be an effective technique for the destruction of AO in aqueous solutions. It is found that the solution pH, catalyst dosage, initial AO concentration and the presence of anions can affect the photocatalytic performance greatly. AO (0.1 g L−1) was decomposed about 99% under visible light over NaBiO3 (1 g L−1) in 160 min, which was much more efficient than TiO2 (P25, 1 g L−1) performed under the same condition. However, low TOC removal or mineralization yield and high AO removal indicated the formation of intermediate products. Five N-de-methylated intermediates of AO, including two isomers (AO-D and AO-MM), were identified during the photooxidative reaction, and the successive appearance of the maximum of each intermediate reveals that the N-de-methylation of AO is a stepwise process. The methyl groups are removed one by one, as confirmed by the gradual wavelength shifts of the maximum-peaks toward the blue region. From the result of TOC, it is suggested that there could be other pathways than N-de-methylation involved. It is suspected that degradation followed by the chromophore rupture path might be also possible. It could be an interesting topic to pursue in the future.

Acknowledgments

This research was supported by the National Science Council of the Republic of China (NSC 98-2113-M-438-001; NSC 99-2113-M-438-001-MY2).

Conflict of Interest

The authors declare no conflict of interest.

References

  1. Xie, Y.; Chen, F.; He, J.; Zhao, J.; Wang, H. Photoassisted degradation of dyes in the presence of Fe3+ and H2O2 under visible irradiation. J. Photochem. Photobiol. A 2000, 136, 235–240. [Google Scholar] [CrossRef]
  2. Brinker, C.J.; Cornils, B.; Bonet, M. Ullmann’s Encyclopedia of Industrial Chemistry, Part A27. In Triarylmethane and Diarylmethane Dyes, 6th ed; Wiley-VCH: New York, NY, USA, 2001. [Google Scholar]
  3. Faisal, M.; Tariq, M.A.; Muneer, M. Photocatalysed degradation of two selected dyes in UV-irradiated aqueous suspensions of titania. Dyes Pigments 2007, 72, 233–239. [Google Scholar]
  4. Lu, C.S.; Mai, F.D.; Wu, C.W.; Wu, R.J.; Chen, C.C. Titanium dioxide-mediated photocatalytic degradation of acridine orange in aqueous suspensions under UV irradiation. Dyes Pigments 2008, 76, 706–713. [Google Scholar] [CrossRef]
  5. Chen, C.C.; Lu, C.S. Mechanistic studies of the photocatalytic degradation of methyl green: an investigation of products of the decomposition processes. Environ. Sci. Technol. 2007, 41, 4389–4396. [Google Scholar] [CrossRef]
  6. Chen, C.C.; Lu, C.S. Photocatalytic degradation of basic violet 4:Degradation efficiency, product distribution, and mechanisms. J. Phys. Chem. C 2007, 111, 13922–13932. [Google Scholar] [CrossRef]
  7. Prevot, A.B.; Fabbri, D.; Pramauro, E.; Baiocchi, C.; Medana, C. High-performance liquid chromatography coupled to ultraviolet diode array detection and electrospray ionization mass spectrometry for the analysis of intermediates produced in the initial steps of the photocatalytic degradation of sulfonated azo dyes. J. Chromatogr. A 2008, 1202, 145–154. [Google Scholar] [CrossRef]
  8. Hoffman, M.R.; Martin, S.T.; Choi, W.; Bahnemann, D.W. Environmental applications of semiconductor photocatalysis. Chem. Rev. 1995, 95, 69–96. [Google Scholar] [CrossRef]
  9. Sun, S.; Wang, W.; Zhou, L.; Xu, H. Efficient methylene blue removal over hydrothermally synthesized starlike BiVO4. Ind. Eng. Chem. Res. 2009, 48, 1735–1739. [Google Scholar] [CrossRef]
  10. Kako, T.; Zou, Z.; Katagiri, M.; Ye, J. Decomposition of organic compounds over NaBiO3 under visible light irradiation. Chem. Mater. 2007, 19, 198–202. [Google Scholar] [CrossRef]
  11. Takei, T.; Haramoto, R.; Dong, Q.; Kumada, N.; Yonesaki, Y.; Kinomura, N.; Mano, T.; Nishimoto, S.; Kameshima, Y.; Miyake, M. Photocatalytic activities of various pentavalent bismuthates under visible light irradiation. J. Solid State Chem. 2011, 184, 2017–2022. [Google Scholar]
  12. Kou, J.; Zhang, H.; Li, Z.; Ouyang, S.; Ye, J.; Zou, Z. Photooxidation of polycyclic aromatic hydrocarbons over NaBiO3 under visible light irradiation. Catal. Lett. 2008, 122, 131–137. [Google Scholar] [CrossRef]
  13. Chang, X.; Ji, G.; Sui, Q.; Huang, J.; Yu, G. Rapid photocatalytic degradation of PCP–Na over NaBiO3 driven by visible light irradiation. J. Hazard. Mater. 2009, 166, 728–733. [Google Scholar]
  14. Chang, X.; Huang, J.; Cheng, C.; Sha, W.; Li, X.; Ji, G.; Deng, S.; Yu, G. Photocatalytic decomposition of 4-t-octylphenol over NaBiO3 driven by visible light: Catalytic kinetics and corrosion products characterization. J. Hazard. Mater. 2010, 173, 765–772. [Google Scholar]
  15. Yu, K.; Yang, S.; He, H.; Sun, C.; Gu, C.; Ju, Y. Visible light-driven photocatalytic degradation of rhodamine-B over NaBiO3: Pathways and mechanism. J. Phys. Chem. A 2009, 113, 10024–10032. [Google Scholar]
  16. Pan, J.; Sun, Y.; Wan, P.; Wang, Z.; Liu, X. Preparation of NaBiO3 and the electrochemical characteristic of manganese dioxide doped with NaBiO3. Electrochim. Acta 2006, 51, 3118–3124. [Google Scholar] [CrossRef]
  17. Cao, Y.; Chen, J.; Huang, L.; Wang, Y.; Hou, Y.; Lu, Y. Photocatalytic degradation of chlorfenapyr in aqueous suspension of TiO2. J. Mol. Catal. A 2005, 233, 61–66. [Google Scholar] [CrossRef]
  18. Lair, A.; Ferronato, C.; Chovelon, J.M.; Herrmann, J.M. Naphthalene degradation in water by heterogeneous photocatalysis: An investigation of the influence of inorganic anions. J. Photochem. Photobiol. A 2008, 193, 193–203. [Google Scholar]
  19. Hirakawa, T.; Nosaka, Y. Properties of O2•− and OH formed in TiO2 aqueous suspensions by photocatalytic reaction and the influence of H2O2 and some ions. Langmuir 2002, 18, 3247–3254. [Google Scholar] [CrossRef]
  20. Lu, C.S.; Chen, C.C.; Mai, F.D.; Li, H.K. Identification of the degradation pathways of alkanolamines with TiO2 photocatalysis. J. Hazard. Mater. 2009, 165, 306–316. [Google Scholar]
  21. Chen, C.; Zhao, W.; Li, J.; Zhao, J.; Hidaka, H.; Serpone, N. Formation and identification of intermediates in the visible-light-assisted photodegradation of sulforhodamine-B dye in aqueous TiO2 dispersion. Environ. Sci. Technol. 2002, 36, 3604–3611. [Google Scholar]
  22. Lee, J.; Choi, W. Effect of platinum deposits on TiO2 on the anoxic photocatalytic degradation pathways of alkylamines in water: Dealkylation and N-alkylation. Environ. Sci. Technol. 2004, 38, 4026–4033. [Google Scholar]
  23. Russell, G.A. Deuterium isotope effects in the autooxidation of aralkyl hydrocarbons. Mechanism of the interaction of peroxy radicals. J. Am. Chem. Soc. 1957, 79, 3871–3877. [Google Scholar]
  24. Chen, C.C.; Lu, C.S.; Mai, F.D.; Weng, C.S. Photooxidative N-de-ethylation of anionic triarylmethane dye (sulfan blue) in titanium dioxide dispersions under UV irradiation. J. Hazard. Mater. B 2006, 137, 1600–1607. [Google Scholar]

