1. Introduction
Catalysts are important in every industry: chemical, petrochemical, oil-refining, pharmaceutical, organic synthesis, fuel-energetic industries, environment protection, and biocatalysis to name just a few. The chemical reactions on the surface of a catalyst are a function of the inlet chemical species, temperature conditions, metal formulation, washcoat material dispersion/size, and its age causing an immeasurable number of kinetic possibilities. In order to obtain the chemical species conversion rates, researchers spend a significant amount of experimental time and expense. Often, the use of models helps reduce the amount of experiments needed. In specific, models can help predict costs, material placement, effectiveness, and ageing among other items. Accurate and predictive models are needed as catalysts are being asked to perform longer at higher levels of effectiveness. With respect to modeling the reactions occurring on the surface, there are two pathways a researcher can take: detailed or global kinetics.
Detailed kinetic mechanisms allow the researcher to write the reactions as a function of the catalyst metal on the surface and permit different catalyst formulations. However, they are limited from a feasibility standpoint. One concern is that they still require calibration to experimental data because the measurement of all intermediate species on the surface is not feasible without significant experimental capabilities. Even if this happens, industrial revision of the surface metals and the ageing of the device may alter the kinetic constants. Moreover, in the literature there may not be a consensus as to all of the detailed steps needed for the model. For example, researchers have postulated around twenty different mechanistic steps for the relatively simple reaction of carbon monoxide (CO) with oxygen (O
2) [
1,
2,
3,
4,
5,
6,
7,
8,
9,
10,
11,
12,
13,
14,
15,
16,
17,
18,
19,
20,
21,
22,
23,
24,
25]. In comparison, global kinetics provides a macroscopic viewpoint of the reaction; CO and O
2 enter the catalyst and carbon dioxide (CO
2) leaves. This allows use of a simpler experimental setup when generating data for calibration of reaction rate expressions.
Furthermore, calibration of a detailed mechanism can take longer than a global mechanism because of the increased number of parameters and experimental tests necessary in order to ensure physically based values. Another issue is that catalysts typically consist of a number of different metals on the surface that may require the detailed mechanism to change and additional reactions to account for subsequent interactions (e.g., enhancement of CO oxidation with hydrogen present [
7,
19,
26]). This will necessitate further experimental tests while also increasing the numerical stiffness of the resultant reaction mechanism. Moreover, the influence of catalyst size, shape, and amount make it nearly impossible to determine one set of kinetic constants for one reaction. As a result, creating adaptive global kinetics, that include facets of the detailed mechanism while factoring in metal properties (e.g., dispersion), have the potential to be more predictive without significantly increasing the computational burden.
With respect to the literature, there are relatively few global mechanism efforts that attempt to develop a more analytical set of kinetics that can be applied to different catalyst formulations [
27]. Therefore, the goal of this effort is to create a global kinetic mechanism for CO oxidation that predicts the light-off and light-down temperatures as a function of platinum metal dispersion on the surface. This is done in the absence of other species, like H
2, in order to simplify the effort and focus on the fundamentals instead of creating a simulation that acts as a multiple parameter curve-fit. Of importance, CO oxidation is the first step in exhaust aftertreatment devices for internal combustion engines [
4], and it is a critical reaction in the production of hydrogen for fuel cell applications [
28,
29]. Hence, the results generated will be of interest to researchers in both these fields. Moreover, since sintering increases particle size (dispersion decreases) reducing catalyst effectiveness as it ages [
30], this model provides a starting point for a more predictive simulation tool suitable for automotive engineers who prefer the global kinetics route over the detailed approach [
31]. Furthermore, this effort endeavors to bridge the gap that exists between Mechanical and Chemical Engineers by demonstrating how surface interactions can be incorporated into a global mechanism. Finally, since the model variables are re-calculated before the simulation begins and the global reaction rate expression is the same, no significant increase in computational load occurs. The automotive industry standard one-dimensional monolithic catalyst model utilized by a wide number of researchers provides the basis of the modeling efforts.
2. Catalyst Model
A previous publication by the first author describes the history of the monolithic one-dimensional (1-D) catalyst model employed in this paper [
31]. For this model, two phases capture the bulk and surface (washcoat/substrate) components in the channel. The bulk gas species equation is written as:
The left hand side of this equation accounts for the advection of species through the channel and the right hand side describes the mass transfer of species from the bulk gas to the surface under the laminar conditions in the channel.
The bulk gas energy equation is written as a function of temperature:
The left hand side of this equation accounts for the propagation of energy through the channel and the right hand side describes the heat transfer between the gas and the surface.
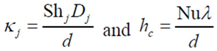
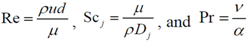
In these equations, calculation of the diffusion and heat transfer coefficients include entrance effects [
32,
33]:
For these expressions, Heck came to the conclusion that Nusselt and Sherwood numbers should correspond to constant heat flux conditions up until light-off and then correspond to the constant wall temperature condition afterwards [
34,
35]. This is because up until light-off, the region is kinetically controlled; hence, the heat flux is relatively low and approximately constant [
32]. Since the experiments modeled later in this paper consist of both light-off and extinction data in order to explore the hysteresis effects of CO oxidation, the constant heat flux conditions will be employed during light-off as developed by Groppi
et al. [
32]:
with the constant wall temperature conditions employed during the extinction experiments
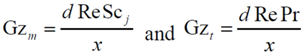
where Gz in the above equation represents the respective mass transfer (
Sh→Gz
m) and thermal Graetz (Nu→Gz
t) numbers that are written as a function of distance from the inlet:
with
As commonly accepted, the Chilton-Colburn analogy equates heat and mass transfer for the laminar flow conditions [
36,
37].
Simulation of chemistry on the surface of the catalyst happens via a combined treatment of gas concentrations within the washcoat:
This equation is written as an Ordinary Differential Equation and solved until steady state so the user does not have to incorporate an algebraic-differential solver for the non-linear equations. The first term on the right hand side describes species mass transfer between the bulk gas and surface and the second term indicates the reaction rates of the gases on the surface. The difference in the mass transfer source term between this equation and the bulk gas equation relates to the relative volume difference between the bulk and surface as indicated by the void fraction (ε).
Completing the 1-D model requires the inclusion of the monolith energy equation for the combined washcoat and substrate (e.g., one numerical node) in the direction normal to the flow:
The left hand side of this equation represents the storage of energy in this combined structure; whereas, the right hand side terms describe conduction, heat transfer between the gas and the surface, energy generated through catalytic reactions, and heat transfer to the ambient, respectively [
38]. Since the experiments simulated from the literature in this paper do not include ambient information, the model assumes adiabaticity as commonly accepted and this term is equal to zero.
3. Reaction Kinetics
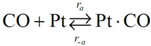
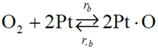
The authors chose to reduce the complexity of this initial effort by simulating only the carbon monoxide (CO) oxidation reaction over platinum/alumina:
Choice of this reaction allows the authors to calibrate the global reaction expression to available literature experimental data of varying dispersion, particle diameter, and metal weight with similar BET surface area values. The authors have investigated the history of CO oxidation and determined that most researchers believe that the reaction occurs via the following detailed kinetic steps:
CO adsorption is the first step of the mechanism because of the low initial sticking coefficient of oxygen on platinum as compared to CO [
39]. The second step in this mechanism is the dissociative adsorption of oxygen [
18,
40]. Most researchers believe that the final step is that of adsorbed CO interacting with adsorbed atomic oxygen via a Langmuir-Hinshelwood (L-H) mechanism. This appears to be the most widely assumed prospect, but mechanisms developed using only these conversion reactions do not necessarily predict the most accurate results [
8,
9,
13,
14]. The final step would be desorption of CO
2 from platinum that most assume happens instantaneously; hence, Equation (11c) lumps this step into the final detailed reaction. There is still no true consensus as to the Rate-Determining Step (RDS). A number of researchers indicate that both Equation (11b) and Equation (11c) can be the RDS [
17,
19,
41]. It is quite possible that at lower CO concentrations, Equation (11c) is the RDS and at higher CO concentrations, Equation (11b) becomes the RDS. This paper will utilize the RDS equal to Equation (11c) because it has been shown by Wojciechowski and Asprey to accurately fit experimental data [
20]. This results in the following global reaction equation:
where the adsorption equilibrium constants are equal to:
This is the same global mechanism calculated by Hori and Schmidt in 1975 using molecular oxygen adsorption [
5] and Goodman
et al. in 1982 for atomic oxygen [
12].
Table 1.
Literature values of CO oxidation model.
At this stage, it is possible to calibrate the pre-exponentials, activation energies, and adsorption heats as is often done by researchers. However, as Wojciechowski and Asprey illustrate [
20], there can be two different sets of parameters that match the data captured as indicated in
Table 1. One issue with kinetics is that it requires collection of a large amount of experimental data in order to eliminate all potential local minimums during parameter optimization. Moreover, since chemical kinetics are non-linear, it is possible to find a set of parameters that matches the data well but may be non-physically based. Hence, the approach the authors take is to explore from first principles the components of the global rate expression in order to minimize the number of variables to calibrate.
3.1. Adsorption Equilibrium Constants
Calculation of the pre-exponential factors for adsorption in Equations (13) and (14) come from kinetic gas theory [
43,
44,
45,
46,
47]:
where
ma is the mass of the molecule given by (
W/
NA),
NA is Avogadro’s number,
W is the molecular weight of the species,
kB is Boltzmann’s constant, and
S0 is the sticking coefficient for zero coverage of the species adsorbed. The desorption pre-exponential factor is written as:
using a rate constant or frequency (
ν in units of s
−1) determined from theory or experimental studies and the site density of the surface (Γ in sites per m
2). Writing the overall expressions for Arrhenius based adsorption and desorption kinetics via Equation (11a) results in:
Using Equations (13) and (14) allows for representation of the global rate expressions by combining the results of Equations (15), (16), and (17) into the following example for CO:
where the adsorption heats equal
![Catalysts 03 00517 i028]()
and
![Catalysts 03 00517 i029]()
.
Using the site density (
![Catalysts 03 00517 i030]()
) and Boltzmann constant (
![Catalysts 03 00517 i031]()
) including the area of a Pt site (
APt = 8×10
−20 m
2/site [
48]) results in expressions as a function of partial pressures:
Ideally, one should obtain values for all of these parameters over the same catalyst; however, the literature review that follows demonstrates this is not possible. Therefore, this paper will assume a few values even though the catalysts where this information comes from may not be the same.
3.2. Sticking Coefficients
Sticking coefficients can be a function of surface temperature, the angle of the bond with the gas, and the current coverage of the surface. From kinetic gas theory, the model is interested only in the initial surface coverage at the starting point of experiments or modeling. Later in this paper, the authors will apply the kinetic model to a Pt/γ-Al
2O
3 surface; however, most surface coverage values in the literature are found using a single crystalline structure in order to understand the interactions on the surface. In such cases, the authors postulate that one should use data from the most applicable surface. As discussed later, since some calibration of the kinetics will have to occur (as always), this embeds variations according to surface crystal structure within the resulting values. Face Centered Cubic crystalline materials such as Pt have three main vectors (100), (110) and (111), with imperfect or stepped plains predominately represented by Pt
111 and Pt
110 vectors. Pt
111 is a logical choice for physical parameter estimation as it is one of the two dominating crystal plans present in small particle size Pt catalysts [
49,
50] and will provide the baseline values. This paper will provide data for catalysts when found and may be used if no other option exists.
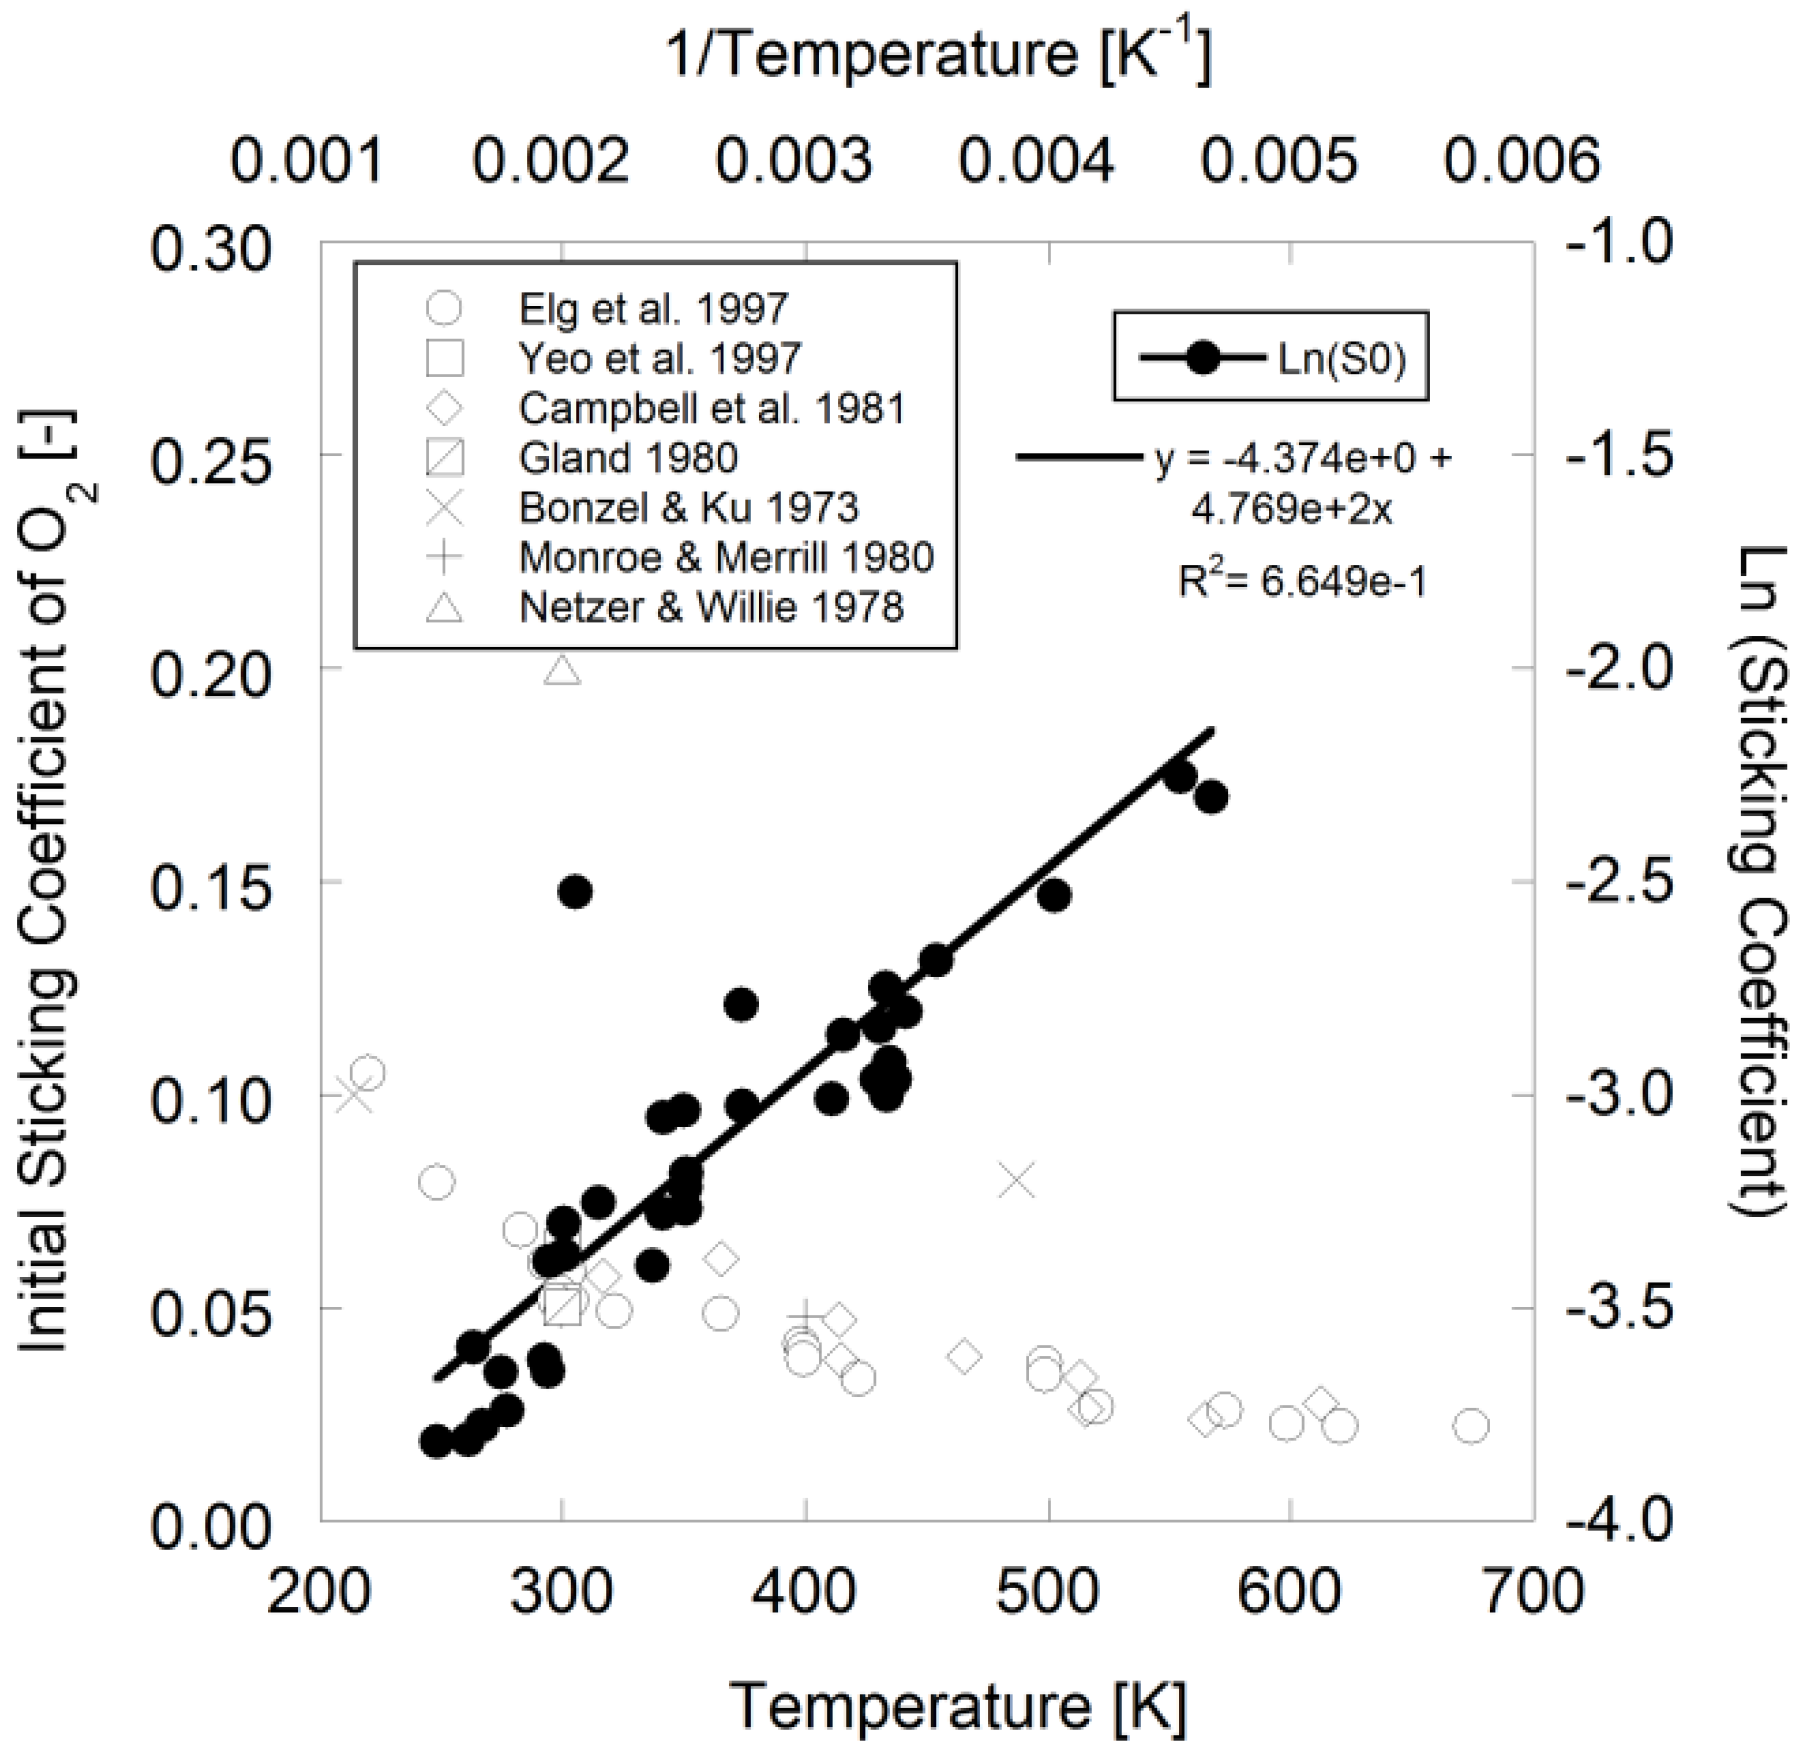
Figure 1.
Sticking coefficient of O
2 over Pt
111 using data from [
11,
40,
51,
52,
53,
54,
55].
Figure 1.
Sticking coefficient of O
2 over Pt
111 using data from [
11,
40,
51,
52,
53,
54,
55].
With respect to oxygen surface coverage, Elg
et al. mentions that the temperature dependence of the initial sticking coefficient during dissociative adsorption on Pt
111 is exponential in nature [
40] that Campbell
et al. wrote as an Arrhenius expression [
52]:
Using available literature data in
Figure 1, the authors fit the following parameters to the data for Pt
111 using Campbell
et al.’s expression for modeling:
![Catalysts 03 00517 i036]()
= 1.260 × 10
−2 and
![Catalysts 03 00517 i037]()
= −3.980 kJ/mol.
For the sticking coefficient of CO, Campbell
et al. finds that it is angular and temperature independent with a value of 0.84 for Pt
111 [
56]. Yeo
et al. finds an initial sticking coefficient of 0.80 over Pt
111 that decreases with CO coverage in monolayers (ML) while mentioning that the initial reactive sticking probability for CO is 0.7 during CO oxidation experiments [
51]. Schubert
et al. [
57] mention that standard values for the sticking coefficient of CO range between 0.5 and 0.8. Shigeishi and King determine an initial probability of 0.67 over Pt
111 [
58]. Based on this literature survey, the authors employ a constant initial sticking coefficient of 0.8 for CO as it provides a reasonable approximation of the Pt
111 values found.
3.3. Heats of Adsorption
With respect to the activation energy of the forward and reverse adsorption steps, Campbell
et al. indicate that a relatively small value is required for CO to transfer into the chemisorbed state [
59]:
and this value is used for the model.
Table 2.
Literature desorption activation energies (E−a) for carbon monoxide.
Table 2.
Literature desorption activation energies (E−a) for carbon monoxide.
| Value | Catalyst |
|---|
| 118–183 [51] | Pt111 |
| 120–171 (O-predosed) [60] | Pt110 |
| 138–178 [60] | Pt110 |
| 146.1 (modulated beam) [56,59] | Pt111 |
| 115.1–139 (TDS) [56] | Pt111 |
| 147.8 [61] | Pt110 |
| 125.6–129.8 (isosteric calculation) [61] | Pt110 |
| 100–138.2 [62] | Pt111 |
| 117.2 (zero coverage) [63] | Pt111 |
| 136.5 [64] | Pt100-(5×20) |
| 171.7–230.3 [65] | Polycrystalline Pt |
| 135 (at saturation) [58] | Pt111 |
Table 3.
Literature desorption activation energies (E−b) for oxygen.
Table 3.
Literature desorption activation energies (E−b) for oxygen.
| Parameter | Value | Catalyst |
|---|
| E−b | 141.6–157.8 [44] | Pt/γ-Al2O3 |
![Catalysts 03 00517 i039]() | 200 [43] | Pt/γ-Al2O3 |
| α1 | 0.115 [43] | Pt/γ-Al2O3 |
| E−b | 175.8–213.5 [52] | Pt111 |
| E−b | 117.2–213.5 [66] | Pt111 |
| E−b | 153–332 [67] | Pt110 |
| E−b | 199–335 [60] | Pt110 |
| E−b | 125–339 [51] | Pt111 |
| E−b | 167 [68] | polycrystalline Pt |
| E−b | 171.7–205.2 [69] | Pt(S)–9(111) × (111) |
| E−b | 154.9 [70] | Pt111 |
| E−b | 187.2–290.1 [39] | Pt100 |
| E−b | 161.6–216 [64] | Pt100−(5 × 20) |
| E−b | 280.5 [65] | polycrystalline Pt |
For oxygen, since it undergoes dissociation as it bonds atomically via Equation (11b), it must overcome a relatively small energy barrier. Olsson
et al. used the low dispersion data from Holmgren
et al. over a Pt/Ce catalyst with a value of 21 kJ/mol in their modeling efforts for a gamma-alumina catalyst [
71]. For high dispersion, this value equals 0.91 kJ/mol [
71]. Gland finds that the dissociative activation energy of oxygen is equal to 29.3 kJ/mol at low oxygen coverage for Pt
111 [
11]. Parker
et al. mention that while no determinations of the activation energy for dissociative adsorption of O
2 have been made for > 0.25 ML, the barrier heat can be estimated to be greater than 37.7 kJ/mol from the work of Derry and Ross [
66]. They estimate that it should be greater than 79.5 kJ/mol at 0.42 ML, with Derry and Ross illustrating that one should use a value greater than or equal to 67.0 kJ/mol at 0.5 ML of atomic oxygen coverage. Based on the previous discussion regarding differing platinum surfaces, the authors utilize the findings of Gland in this paper for
Eb.
When summarizing available literature data for desorption activation energies for carbon monoxide (
E−a) and oxygen (
E−b) in
Table 2 and
Table 3, respectively, the results suggest a large range of available values. This range exists because both of these parameters change as a function of the surface coverage of adsorbed species [
40,
43,
66,
72,
73,
74,
75]. For example, Olsson
et al. models the activation energy for oxygen desorption in a linear manner with atomic oxygen coverage as:
where
![Catalysts 03 00517 i041]()
is the fractional coverage of the surface by atomic oxygen and
α1 is a constant. This changing activation energy as a function of surface coverage reveals an issue with the global kinetic modeling approach. In such a model, the current state of coverage of the surface is unknown; hence, these activation energies cannot include this option in the model as the reaction proceeds or the inlet concentrations change.
For CO, the authors employ a lumped approach including both the activation energies for adsorption and desorption. In particular, the literature via
Table 2 illustrates that the total adsorption heat of this species changes as a function of surface coverage that varies with temperature [
72,
73,
74]. As a result, the authors model CO adsorption with a temperature dependence:
where
χ and
ξ are calibrated constants. Having
χ negative accounts for the desorption heats with the overall value of ∆
HCO decreasing (less negative) as a function of temperature. This is because the molecules become more active on the surface and will have an increasing tendency for desorption.
While the heat of desorption of oxygen (
E−b) changes with the surface coverage of oxygen, in this effort it is assumed constant and calibrated because of the large value range indicated in
Table 3. This assumption stems from the experimental results modeled later. In particular, the oxygen partial pressure is significantly higher as compared to the CO partial pressure (10% O
2 inlet
versus 0.1% CO). In the kinetically limited region, CO will cover a relatively small part of surface due to its low gas phase concentration despite the higher affinity of CO to platinum. In the mass transfer limited region, this CO will react with surrounding oxygen and leave the surface. However, the surface coverage of oxygen will not change significantly, as only a small amount of CO is available to react relative to the large concentration of oxygen present. Furthermore, given the relatively low concentrations of CO, the surface inhibiting effect of CO is negligible [
76]. Moreover, while some oxygen can desorb, the relative rate of desorption is low until about 800 K [
40,
77]. Since the experiments modeled were accomplished with temperatures lower than 600 K, this should not be an issue. Any small decrease in surface coverage due to desorption will be offset by an increase in coverage area on the newly created free sites due to the reaction.
The authors assume that the adsorption heats are additionally independent of particle size and dispersion. Uner and Uner found in their investigation of initial and integral heats of adsorption that O
2 and CO adsorption processes are not structure sensitive [
78]. When consolidating the reaction activation energies measured on these catalysts with the heat of adsorption, they attribute a minor decrease in effective activation energy with increasing particle size to a variation of pre-exponential factors of the elementary reaction steps of the CO oxidation reaction.
3.4. Desorption Rate Constants
The desorption rate constant describes the frequency of the species desorbing from the surface. The literature illustrates a wide range of values for oxygen (
![Catalysts 03 00517 i043]()
) for this experimentally determined value as indicated in
Table 4. Zhdanov and Kasemo state that one can conclude that the activated complex for adsorption of oxygen, and accordingly for desorption, has rotational and translational degrees of freedom [
75]. Hence, this means that this value should be much higher than 10
13 s
−1. Based on this information, the authors follow the efforts of Olsson
et al. in modeling a Pt/Al
2O
3 catalyst [
43] by using their indicated value of 10
15 s
−1.
Table 4.
Desorption rate frequencies used or determined in the literature for dissociative oxygen.
Table 4.
Desorption rate frequencies used or determined in the literature for dissociative oxygen.
| Value | Catalyst | Units |
|---|
| 1 × 10¹³ [68] | Pt111 | s−1 |
| 1 × 10¹⁵ [75] | Pt111 | s−1 |
| 2.4 × 10⁻² | Pt111 | cm2 s−1/s−1 |
| 3 × 10¹³ [52] |
| 2.6 × 10⁻¹ [66] | Pt111 | NA |
| 1.5 × 10⁻⁵ [67] | Pt110 | ML s−1 |
| 1 × 10¹³ [11] | Pt111 | s−1 |
Table 5.
Desorption rate frequencies in the literature for CO.
Table 5.
Desorption rate frequencies in the literature for CO.
| Value | Catalyst | Units |
|---|
| 1.25 × 10¹⁵ [56,59] | Pt111 | s−1 |
| 6.0 × 10¹⁴ [61] | Pt110 | s−1 |
| 1 × 10¹³ [62] | Pt111 | s−1 |
| 1 × 10¹⁵ [63] | Pt111 | s−1 |
| 7.5 × 10¹² [64] | Pt100 − (5 × 20) | s−1 |
For carbon monoxide (
![Catalysts 03 00517 i044]()
), Campbell
et al. mention that the value of the pre-exponential factor derived from modulated beam results is larger than usually expected for first order desorption (~ 10
13); other papers find values on the order of 10
15 s
−1 or even higher [
56] with an indication of values found provided in
Table 5. Schubert
et al. [
57] use standard values of 10
13 to 10
16 s
−1 in their effort. Fair and Madix [
61] mention that this factor contains the ratio of the single particle partition functions, which are dependent on contributions from electronic translational, rotational and vibrational degrees of freedom. Assuming a value of one for the transmission coefficient, they calculate a value of 9 × 10
17 s
−1 that they consider as the upper limit. Yeo
et al. [
51] assumes a value of 10
15 s
−1 based on the efforts of Ertl
et al. [
63]. Because of this survey, this work employs a value of 10
15 s
−1 since two researchers use this value and it is in the middle range of the limits found.
3.5. Rate Determining Step
Transition state theory relates the rate constant of the Rate Determining Step (RDS) to the equilibrium constant for the transition state that is a function of the Gibbs energy of the transition state. Using the relationship between entropy, enthalpy and Gibbs energy, the reaction rate constant is:
where
h is Planck’s constant and the enthalpy and entropy terms come from the transition state free energy. This expression provides a theoretically based form of the more commonly used Arrhenius equation. In this evaluation, the value for the change in enthalpy,
![Catalysts 03 00517 i046]()
, is known as the activation energy (
ECO) for the particular reaction under study. As a result, writing the
kCO component using the transition state theory expression in Equation (25) finds:
In this expression, theory indicates that the entropy component is a measure of the degree of order of the intermediate surface reactants. Investigating catalytic properties on the surface, particle size will affect entropy as it changes the nature and bond strength of the components on the surface. In particular, as the particle diameter increases (dispersion decreases), the entropy of the system should decrease as it becomes a less “chaotic” surface leading to a smaller
kCO. In other words, larger particles will have larger crystalline faces and fewer instances of defect sites resulting in more organized surface adsorption (e.g., lower entropy). However, as particle diameter decreases, the entropy of the system could possibly increase due to a less uniform surface and more surface defects reducing the organization of the adsorbed species. Furthermore, smaller particle sizes may result in surface stresses due to steric hindrance increasing the surface entropy leading to an increase in
kCO [
79,
80]. While possible, this is only a small dependency and not an overriding factor. Finally, with decreasing dispersion, the frequency of the reaction should decrease (smaller
kCO) since there are fewer sites where Pt CO and Pt O are next to each other.
Moreover, catalyst weight will influence the overall reaction rate as it can increase (or decrease) the number of reacting sites. Hence, from a modeling standpoint, the authors express the pre-exponential factor as:
where
a and
b are constants that require calibration and
δ is the dispersion of the metal on the surface. This model includes the catalyst weight normalized by the washcoat weight in order to provide a factor of reaction:
where the authors assume a linear dependency on this factor for this effort in order to simulate an increasing reaction with more platinum given a constant washcoat amount.
Since particle diameter and dispersion are interrelated, including either parameter as a variable effectively captures the other through inference with most researchers presenting dispersion as a distinction between different catalytic loadings [
81,
82,
83]. If the length of the catalyst is kept constant and the amount of material uniform, dispersion will determine the size of the metal atom on the surface along with the proximity of two metal atoms or sites of adsorption. In addition, the metal particle size may also decide the chemical bond strength between the adsorbate and the adsorbent. For example, Briot
et al. demonstrate that changes in particle size influence the heat of adsorption, which is a measure of Pt・O bond strength [
84]. They suggest that this can affect the reactivity of the absorbed oxygen with the reacting species. Hence, as the particle size decreases given the same number of sites, the chemical bond strength increases which may further hinder the reaction rate as more energy is required to break the bond [
80]. Numerous authors support this statement by indicating that the oxidation reaction is a strong function of particle size [
22,
80,
85,
86].
Table 6.
Literature activation energies for RDS of reaction (ECO).
Table 6.
Literature activation energies for RDS of reaction (ECO).
| Value (kJ mol−1) | Dispersion | Catalyst |
|---|
| 55–157 [51] | - | Pt111 |
| 100.9 (low O coverage) [59] | - | Pt111 |
| 49.0 (high O coverage) [59] | - | Pt111 |
| 125 [87] | - | Pt/α-Al2O3 |
| 172 [87] | - | Pt/α-Al2O3 |
| 55 [88] | 29% | Pt/SiO2 |
| 72 [88] | 63% | Pt/SiO2 |
| 92 [88] | 76% | Pt/SiO2 |
| 96 [89] | 4% | Pt/γ-Al2O3 |
| 107 [89] | 20% | Pt/γ-Al2O3 |
| 115 [89] | 29% | Pt/γ-Al2O3 |
| 120 [89] | 63% | Pt/γ-Al2O3 |
As a result, dispersion plays a large role in predicting the reaction rate expression and the authors chose this parameter as a primary variable of interest for the activation energy. Since as dispersion increases, particle diameter decreases this in turn influences the bond strength. This is similar to Yang
et al. who wrote the reaction rate expression as a function of particle size and related the results to dispersion [
86]. Hence, when ageing of the catalyst occurs through sintering, the dispersion of the catalytic material will change. Note that ageing and sintering can also change the structure of the catalyst particles resulting in different values for the sticking coefficients, activation energies, and heats of adsorption.
Table 7.
Constant parameters of adaptive kinetics model.
Table 7.
Constant parameters of adaptive kinetics model.
| Parameter | Value | Units |
|---|
| APt | 8 × 10⁻²⁰ | m2 site−1 |
| NA | 6.022142 × 10²³ | molecules mol−1 |
| WCO | 28.01 | g mol−1 |
![Catalysts 03 00517 i050]() | 31.9988 | g mol−1 |
| Ru | 8.314472 | J mol−1 K−1 |
| SCO | 0.8 | - |
| Eb | 29.3 | kJ mol−1 |
![Catalysts 03 00517 i051]() | 1 × 10¹⁵ | s−1 |
| νCO | 1 × 10¹⁵ | s−1 |
In regards to the activation energy, Oran and Uner found a large variation in values over different surfaces and dispersion values as indicated in
Table 6 [
90]. Moreover, theory dictates that since the pre-exponential is temperature dependent, the expression for activation energy must also be temperature dependent [
91]. From the two-parameter Kooij equation including this dispersion dependency, the activation energy equals:
where
c and
d are constants calibrated to the experimental data. The choice of the growth in activation energy as a function of dispersion follows the earlier discussion involving bond strength increasing as a function of growing dispersion. Moreover, a linear model was chosen since this is the simplest version of this dependency to calibrate. This concludes the model development with
Table 7 providing the parameters of the model based on the literature study beyond those left for calibration (
i.e.,
a,
b,
c,
d,
χ and
ξ).
4. Results and Discussion
Calibration of the parameters utilized CO oxidation literature data from a 2005 paper by Arnby
et al. [
23] where the amount of platinum, dispersion, and particle diameter changed between different catalysts as indicated in
Table 8. The platinum dispersion and surface area of Arnby
et al. were calculated from the amount of adsorbed CO, determined by CO chemisorption measurements. The nomenclature relating to the percentage Al
2O
3 (1, 10, and 100%) indicates their preparations methods where they deposit platinum only on part of the available support material. The choice of this paper over their 2004 paper [
22] and others for calibration is because both the platinum to washcoat (
ω) and BET surface area remains relatively constant between the different catalysts. Therefore, the difference in the data should ideally relate directly to the impact of dispersion and correspondingly the platinum particle size.
Matlab Simulink provided the platform for model calibration by first finding singular values of
a,
d, and
χ that minimized the least-squares curve-fit (LSQ) value between the experimental and simulated temperatures at the 50% CO conversion points over all light-off and extinction tests. The bounds on these parameters came from the respective literature in this area; specifically,
Table 6 for
d and
Table 2 for
χ with
E−b set equal to 200 kJ/mol based on
Table 3. This initial calibration to their hysteresis experiments found that the model was unable to match the thermal response from their data. Since they did not include a temperature ramp experiment without chemical reactions, measurement of the amount of heat transfer to the ambient and validation of use of monolith properties from the literature was not possible (e.g., density, thermal conductivity, and specific heat as 1800 kg m
−3, 1.5 W m
−1 K
−1, and 1020 J kg
−1 K
−1 respectively [
92]). As a result, the authors included monolith density (
ρm) as another constant for calibration. Using the initial three calibrated components and a literature value of monolith density, this provided the set of parameters for a final calibration involving all eight parameters (
a,
b,
c,
d,
χ,
ξ,
ρm, and
E−b) that minimized the LSQ value between temperatures at 50% CO conversion for both light-off and extinction with the final results given in
Table 9.
Table 8.
Washcoat parameters utilized in CO light-off experiments.
Table 8.
Washcoat parameters utilized in CO light-off experiments.
| Parameter | Pt(100%) Al2O3 [22] | Pt (10%) Al2O3 [22] | Pt (1%) Al2O3 [22] | Pt (100%) Al2O3 [23] | Pt (10%) Al2O3 [23] | Pt (1%) Al2O3 [23] |
|---|
| Pt content/mg | 0.30 | 0.39 | 0.59 | 0.52 | 0.52 | 0.50 |
| Washcoat/g | 0.15 | 0.20 | 0.30 | 0.26 | 0.26 | 0.25 |
| Pt/Washcoat/- | 0.00200 | 0.00195 | 0.00197 | 0.00200 | 0.00200 | 0.00200 |
| Dispersion/% | 48 | 41 | 26 | 56 | 44 | 21 |
| Mean Pt diameter/nm | 2.3 | 2.7 | 4.5 | 2.0 | 2.6 | 5.6 |
| BET/m2/gwsh | 151 | 152 | 162 | 160 | 163 | 163 |
Table 9.
Final model variables calibrated to Arnby et al. 2005 experimental data.
Table 9.
Final model variables calibrated to Arnby et al. 2005 experimental data.
| Variable | Value | Units |
|---|
| a | 5.703×10¹¹ | mol m−3 K−1 s−1 |
| b | 3.099 | - |
| c | 43.254 | kJ mol−1 |
| d | 83.442 | kJ mol−1 |
| χ | −149.185 | kJ mol−1 |
| ξ | 4.982×10⁻² | kJ mol−1 K−1 |
| ρm | 3380.435 | kg m−3 |
| E−b | 197.725 | kJ mol−1 |
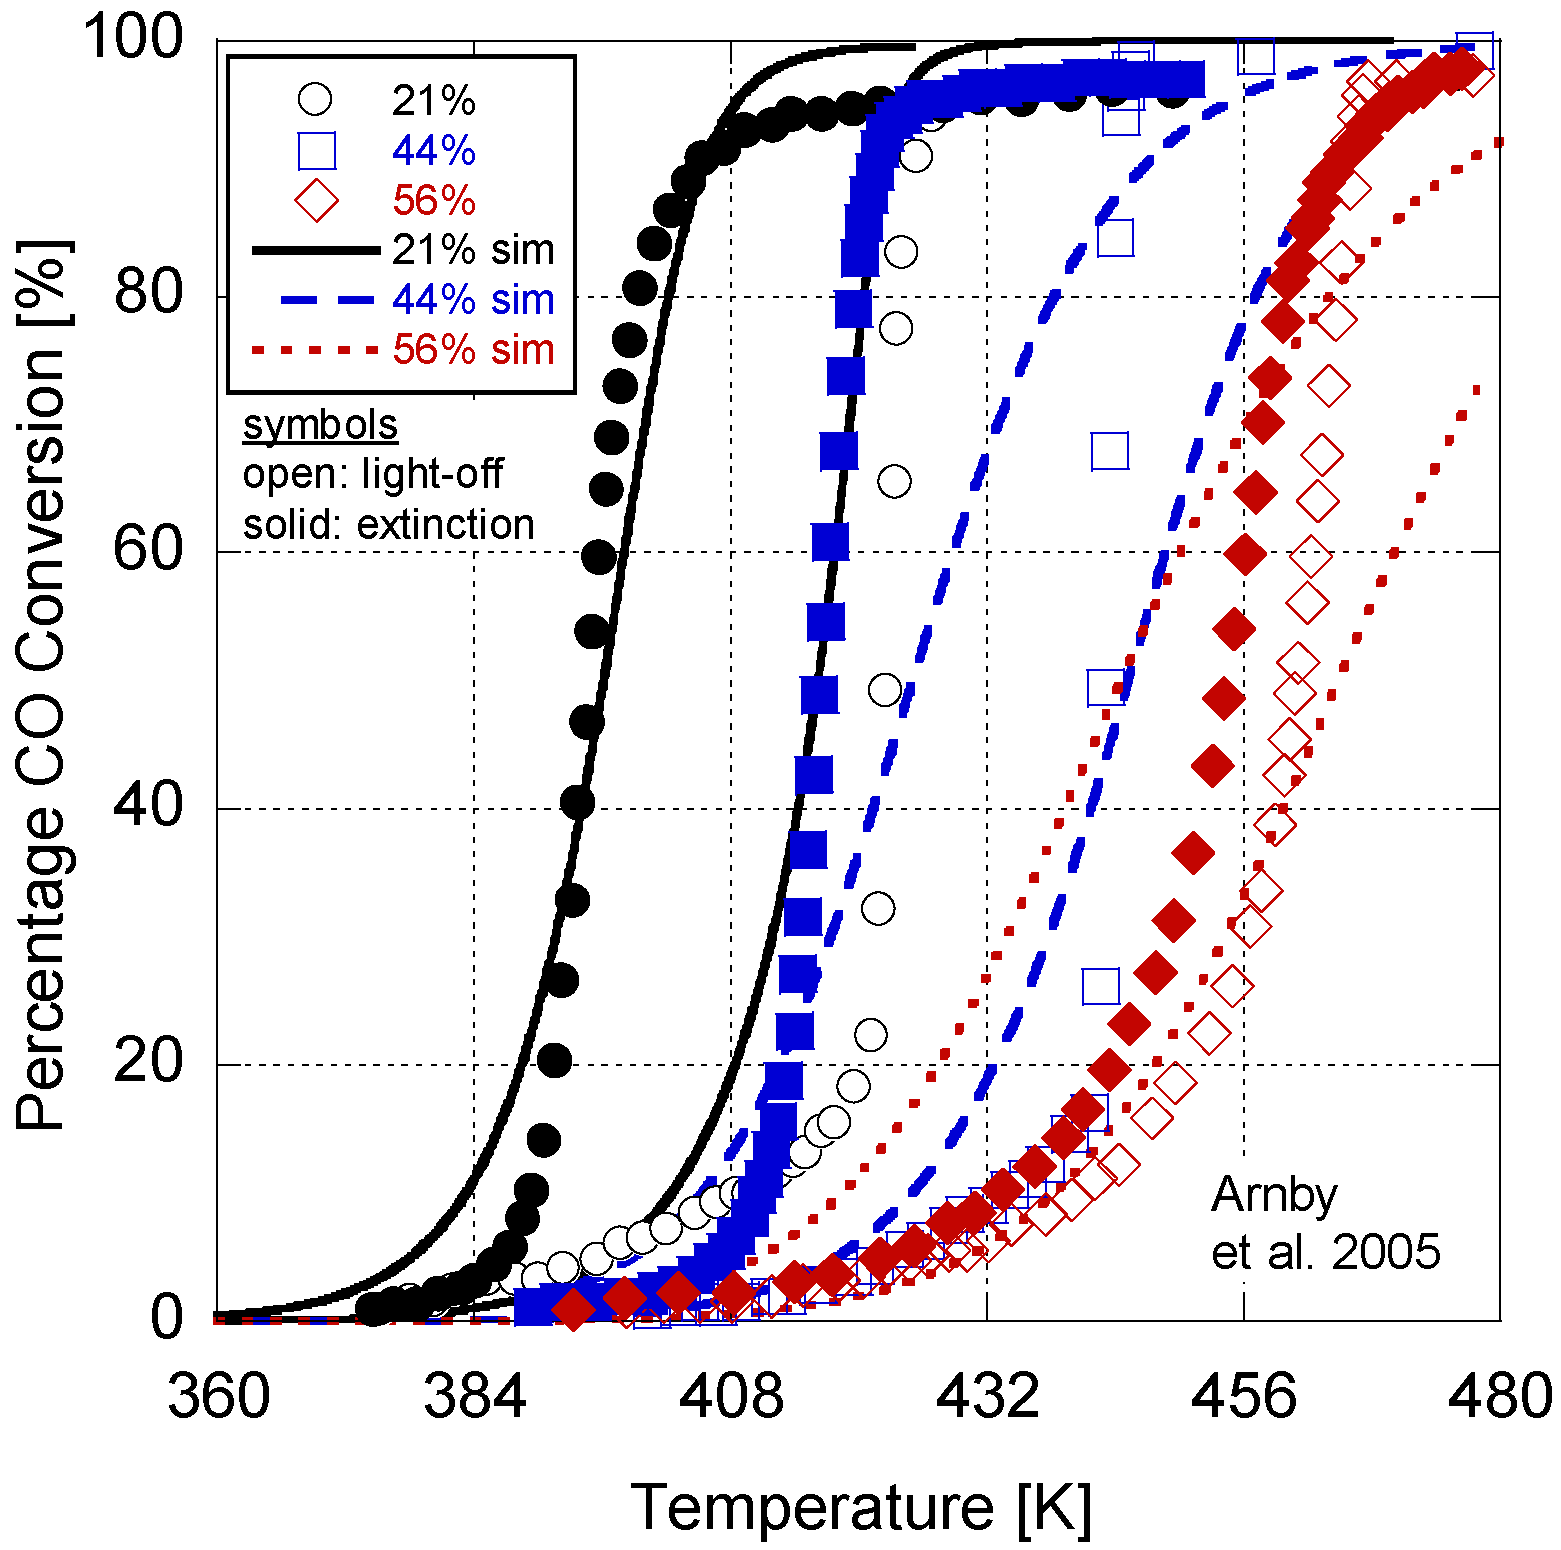
Figure 2.
Calibrated model results in comparison to Arnby et al. 2005 experimental data.
Figure 2.
Calibrated model results in comparison to Arnby et al. 2005 experimental data.
Table 10.
Comparison of Root Mean Square Error differences between experimental and simulation conversion percentages (light off/extinction).
Table 10.
Comparison of Root Mean Square Error differences between experimental and simulation conversion percentages (light off/extinction).
| Dispersion | Figure 2 | Dispersion | Figure 4 (0.01%) | Figure 4 (0.1%) | Figure 4 (1%) |
|---|
| 21% | 24.1/8.5 | 26% | 47.5/36.4 | 45.4/20.2 | 69.7/39.9 |
| 44% | 21.3/27.8 | 41% | 42.6/32.2 | 33.6/31.0 | 62.8/35.9 |
| 56% | 18.1/14.5 | 48% | 33.5/27.0 | 21.4/31.8 | 66.7/45.5 |
In
Figure 2, the model results are presented in comparison to the experimental data. Overall, the model deviates by an average of 5.3K between the 50% conversion points for the light-off and extinction temperatures. In
Table 10, a comparison of the Root Mean Squared Error (RMSE) between the simulation and experimental percentages is given. On average, the RMSE indicates a 20% difference in conversion. In order to explore the choice of constants for the last four parameters in
Table 5, a sensitivity analysis similar to Ó Conaire [
93] was performed by doubling (or halving) the respective value and finding the difference in the 50% light-off and extinction conversion temperatures. Taking the absolute values of the differences, halving
SCO was found to change the temperatures by an average of 6.6 K. When doubling
Eb,
![Catalysts 03 00517 i053]()
, and ν
CO, the differences were 20.0, 6.6, and 1.9 K respectively. With respect to the coefficients of
Table 9, all model values fall within the respective literature bounds; e.g., at 400K,
∆HCO = −129 kJ/mol (
Table 2),
E−b = 197 kJ/mol (
Table 3), and
ECO = 96–111 kJ/mol (
Table 6). Overall, it can be inferred that the calibrated model provides reasonable quantitative values in comparison to the experiments.
With respect to a qualitative analysis, the model accurately captures the trend of 50% conversion temperature with dispersion. However, the higher dispersion values do illustrate a delayed light-off and extinction temperature. Part of this difference could be due to the relatively high monolith density value found in
Table 9 resulting in a reduced thermal response of the monolith. Moreover, some of the deviation between the model and experiments (50% conversion temperatures, slope, and RMSE values) relates to the choice of a 1-D model that lumps boundary layer phenomenon into the source terms and washcoat diffusion into the reaction rates. This embeds assumptions into the kinetic parameters reducing the physicality of the model. While it is possible to use more advanced and accurate simulation techniques (e.g., 1 + 1-D model by the authors [
94]), this added computational effort made it unfeasible for calibration across all three hysteresis experiments.
Further differences between the results are a function of writing only the pre-exponential and activation energy as a function of dispersion. Metal particle size can influence other parameters, such as the sticking coefficient. This is evident in the difference between the light-off and extinction temperatures. The 56% dispersion experiment only differs by a few degrees Kelvin; however, the 44% and 26% cases are dissimilar by over 30 K. As a result, there is likely some additional non-linearity in the kinetic parameters as a function of dispersion. The results of the sensitivity analysis also demonstrate that the parameters held constant during the analysis might play a role. The authors’ endeavored to choose the best values based on the literature in order to reduce the required calibration effort. These may not be the optimum values and may need to be included in the calibration effort. However, the first exploration of a derived dispersion model here warranted the choice of the simplest version in order to explore its practicality. Finally, since the adaptive kinetics only influence the variables in the reaction rate expression as new values, there is no significant addition to the computational burden of the model while increasing its predictive nature with respect to dispersion.
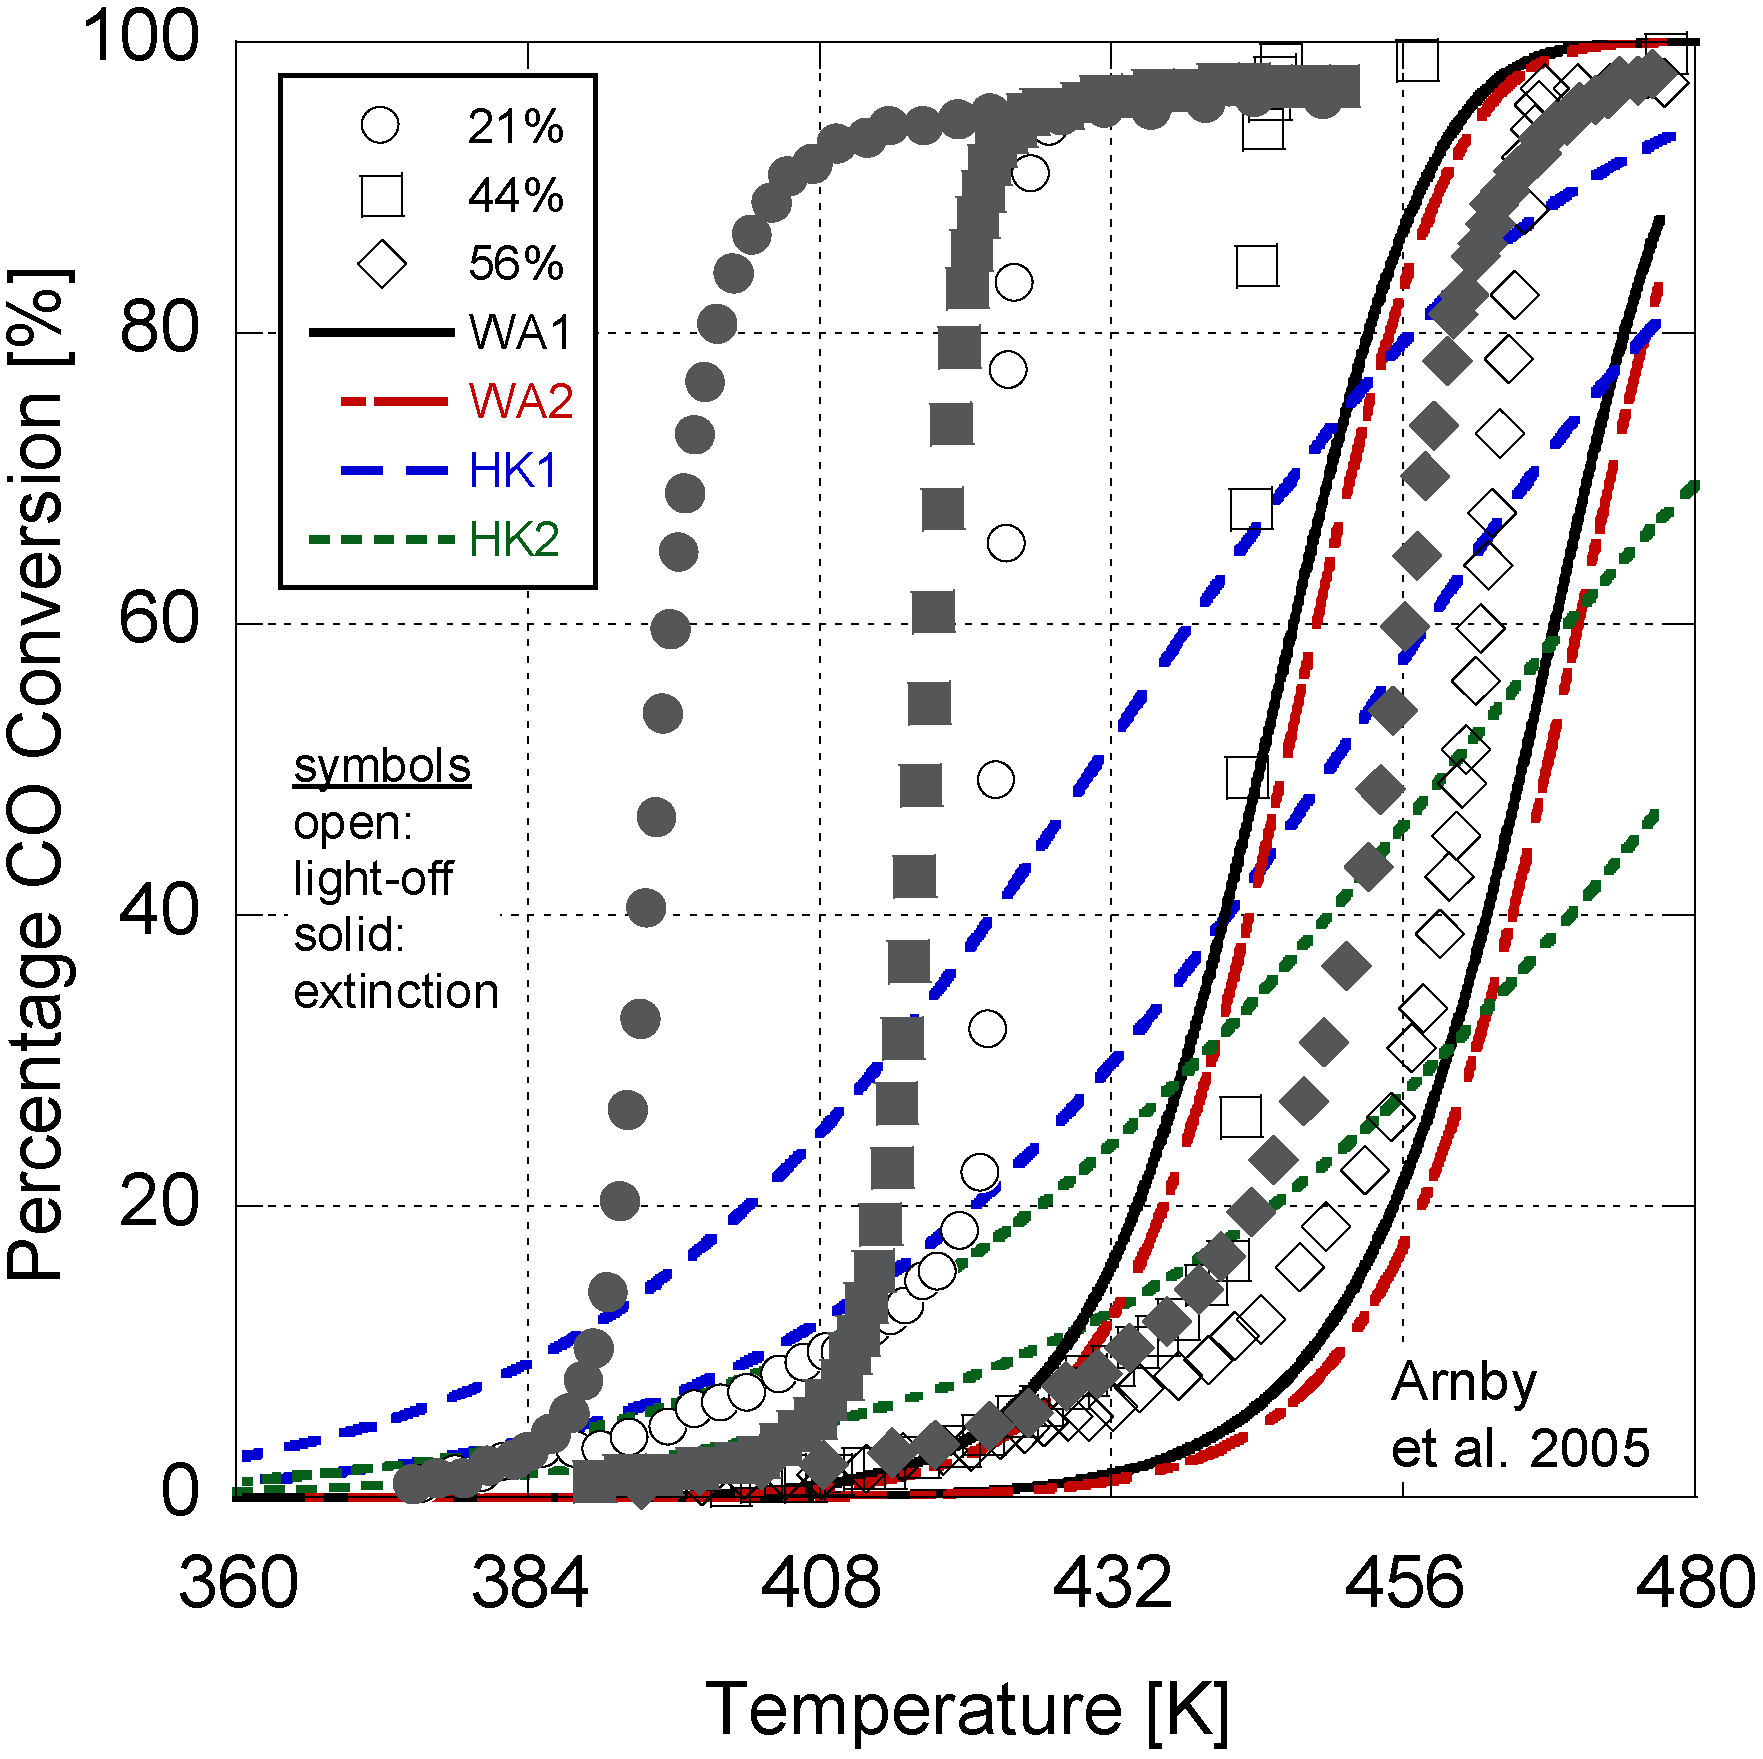
Figure 3.
Wojciechowski and Asprey (WA1 and WA2) [
20] and Herskowitz and Kenney (HK1 and HK2) [
42] model results in comparison to Arnby
et al. 2005 experimental data.
Figure 3.
Wojciechowski and Asprey (WA1 and WA2) [
20] and Herskowitz and Kenney (HK1 and HK2) [
42] model results in comparison to Arnby
et al. 2005 experimental data.
In order to contrast the derived expressions with models available in the literature, the Arnby
et al. 2005 experiments were simulated using the four different kinetic options via Wojciechowski and Asprey [
20] and Herskowitz and Kenney [
42] for the reaction expression of Equation (12) with the coefficients given in
Table 1. It is important to note that in order to utilize the pre-exponentials of these authors (
kCO) in the same units as this paper required division by the universal gas constant (given in
Table 1) that was then divided by the monolith temperature at the time of computation instead of assuming a singular value at all temperatures.
Figure 3 illustrates that the Wojciechowski and Asprey models are close to the highest dispersion rate results but significantly deviate from the lowest. Moreover, the Herskowitz and Kenney results do not accurate capture the experimental conditions. It is important to note that these models provide only singular results and cannot depict the influence of surface chemistry.
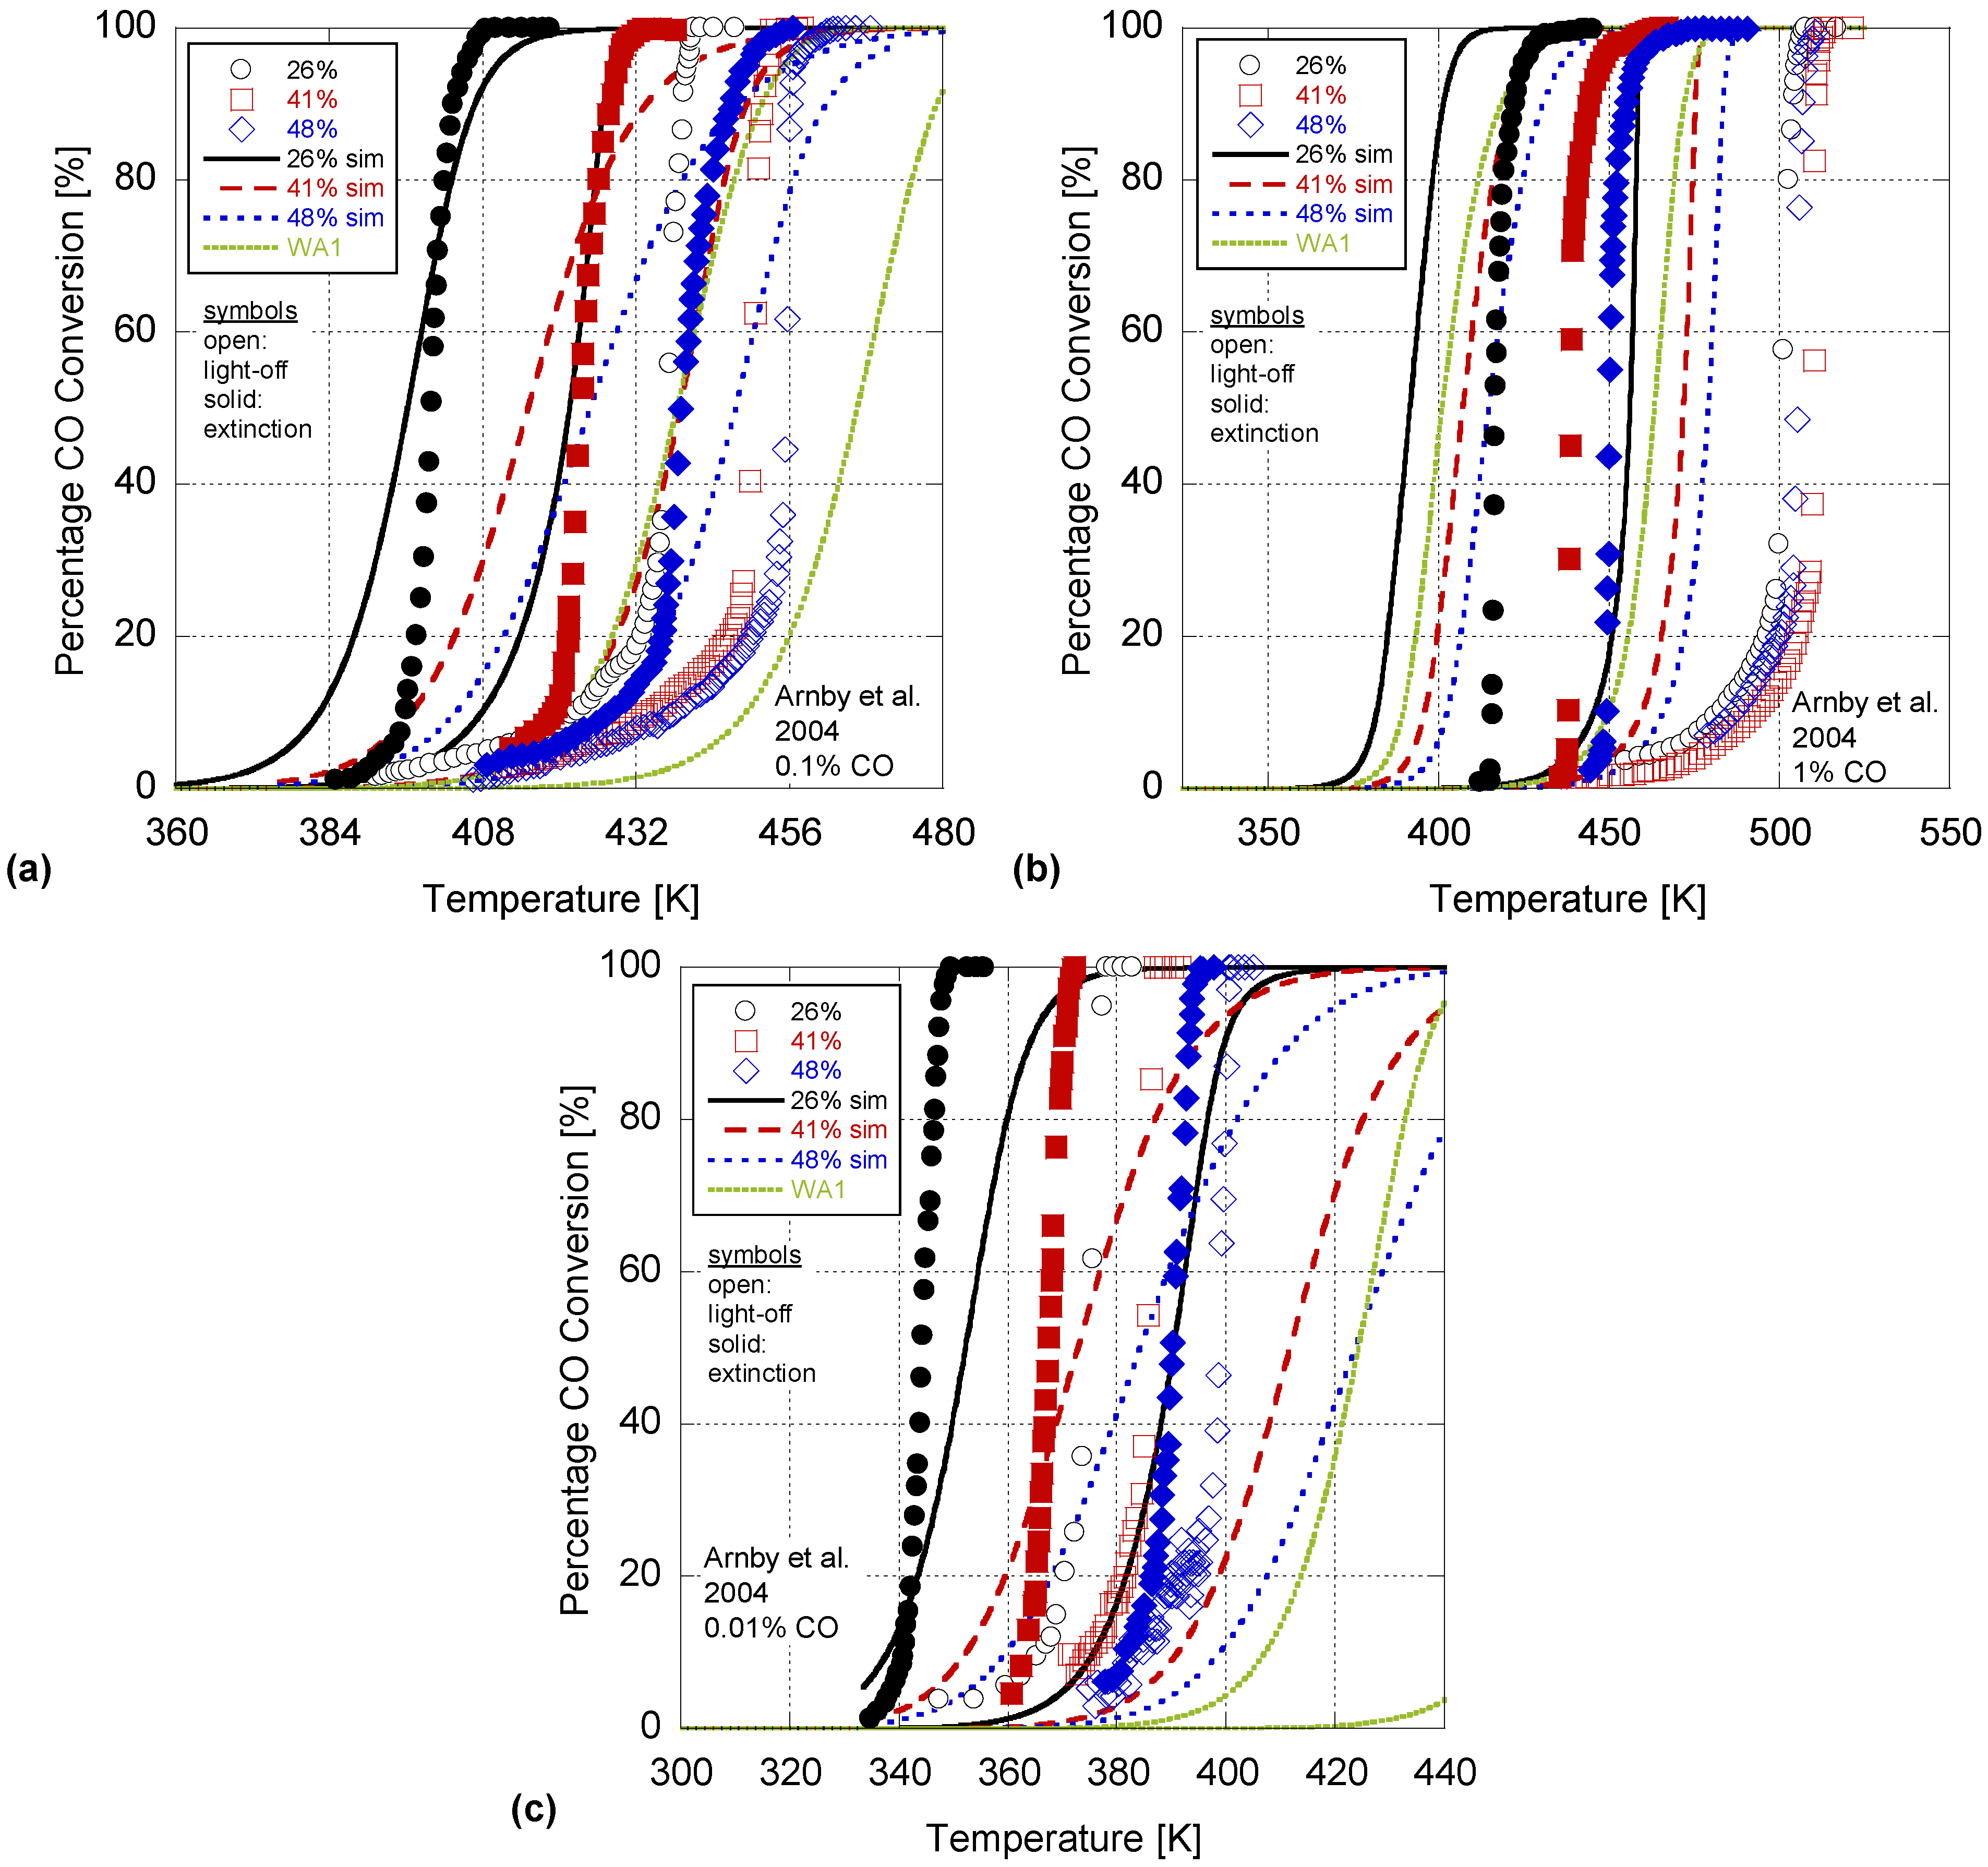
In order to validate the model, the Arnby
et al. experiments of 2004 were simulated using the coefficients from
Table 9. This 2004 paper utilized three different CO concentration levels; e.g., 0.01%, 0.1%, 1%. Moreover, the catalysts in the 2004 paper had varying Pt content, washcoat mass, and BET surface areas as given in
Table 8. Investigating
Figure 4, this paper’s model accuracy does degrade since it was calibrated to only the 2005 experiments that used 0.1% CO input. In particular, the average deviation between all 50% conversion temperatures increases to 19.3K with the 0.01%, 0.1%, and 1% CO concentration results differing by an average of 14.3K, 10.1K, and 33.5K respectively. Moreover, the RMSE values in
Table 10 increase significantly showing a difference of 35, 32, and 55% in conversion percentages. The model does perform best when compared to the 0.1% case since this was the concentration over which the model was calibrated.
Figure 4.
Simulation of Arnby
et al. 2004 (
a) 0.1%; (
b) 1% and (
c) 0.01% CO concentration experiments using the derived kinetics of
Table 9 and one set of parameters from Wojciechowski and Asprey.
Figure 4.
Simulation of Arnby
et al. 2004 (
a) 0.1%; (
b) 1% and (
c) 0.01% CO concentration experiments using the derived kinetics of
Table 9 and one set of parameters from Wojciechowski and Asprey.
Moreover, in the Arnby
et al. 2004 experimental data, they found a deviation in the trend for the 41% dispersion case as it incurred a decreased conversion rate over the 48% dispersion case. The authors theorized that this result may be a function of the relative ratio of Pt to washcoat support which is the lowest of all of the 2004 tests. The model as described in Equation (28) does account for this factor; however, it was unable to be captured by the simulation. Another concern is that for the high CO concentration input (1% CO) the RDS may shift to the oxygen adsorption case via Equation (11b) as discussed in
Section 3. This would require a different global reaction mechanism for simulation purposes; hence, the authors’ model calibrated to a different RDS would definitely not work. Overall, the model presented here provides the correct trends with dispersion. As dispersion increases, the temperature where light-off and extinction happens, increases. Finally, plotting one Wojciechowski and Asprey value (WA1) set in this figure illustrates that it has the same issue with respect to CO concentration while performing worse at the lowest CO level than the model in this effort. Hence, while the authors’ model does illustrate a significant difference in conversion percentages, its predictability has increased and the methodology for including dispersion in the global rate expression has potential.
While it is indeed possible to recalibrate the model to both the 2004 and 2005 experiments of Arnby
et al. using
Table 9 as the starting parameters, the fact that these experiments include a significant hysteresis effect results in the calibration of reactor heat transfer coefficients alongside the kinetic expression. A common omission from catalyst reactor papers is a reactor warm-up curve or indication that thermal hysteresis was checked during experimentation [
2,
22,
23,
24]. Even with insulated or isothermal reactors, there is still a need to have a temperature rise curve that illustrates the time rate of change of temperature throughout the length of the reactor. This will allow modelers the ability to calibrate the thermal properties (specific heat, density, and thermal conductivity) of the monolith or prove that the kinetic results are not a function of hysteresis. Ideally, just knowing the material of the monolith is sufficient; however, different reactors will have unique thermal conditions and a simple experiment to help modelers eliminate some variability would be significantly helpful. In addition, when experiments contain a large gradient in temperature between the reactor and the ambient, there is a possibility of external heat transfer. A transient heating test of the reactor with the inlet and outlet gas temperatures given as a function of time would help modelers calibrate the associated terms in Equation (9). As a result, spending additional time to calibrate the reaction further was deemed excessive and time was better spent working on setting up a reactor for follow-up experiments.


 (kJ mol−1)
 (atm−1)
 (kJ mol−1)


 and
and  .
. ) and Boltzmann constant (
  ) including the area of a Pt site (APt = 8×10⁻²⁰ m2/site [48]) results in expressions as a function of partial pressures:


 = 1.260 × 10⁻² and
  = −3.980 kJ/mol.


 is the fractional coverage of the surface by atomic oxygen and α1 is a constant. This changing activation energy as a function of surface coverage reveals an issue with the global kinetic modeling approach. In such a model, the current state of coverage of the surface is unknown; hence, these activation energies cannot include this option in the model as the reaction proceeds or the inlet concentrations change.
 ) for this experimentally determined value as indicated in Table 4. Zhdanov and Kasemo state that one can conclude that the activated complex for adsorption of oxygen, and accordingly for desorption, has rotational and translational degrees of freedom [75]. Hence, this means that this value should be much higher than 1013 s−1. Based on this information, the authors follow the efforts of Olsson et al. in modeling a Pt/Al2O3 catalyst [43] by using their indicated value of 1015 s−1.
 ), Campbell et al. mention that the value of the pre-exponential factor derived from modulated beam results is larger than usually expected for first order desorption (~ 1013); other papers find values on the order of 1015 s−1 or even higher [56] with an indication of values found provided in Table 5. Schubert et al. [57] use standard values of 1013 to 1016 s−1 in their effort. Fair and Madix [61] mention that this factor contains the ratio of the single particle partition functions, which are dependent on contributions from electronic translational, rotational and vibrational degrees of freedom. Assuming a value of one for the transmission coefficient, they calculate a value of 9 × 10¹⁷ s−1 that they consider as the upper limit. Yeo et al. [51] assumes a value of 1015 s−1 based on the efforts of Ertl et al. [63]. Because of this survey, this work employs a value of 1015 s−1 since two researchers use this value and it is in the middle range of the limits found.
 , is known as the activation energy (ECO) for the particular reaction under study. As a result, writing the kCO component using the transition state theory expression in Equation (25) finds:


 , and νCO, the differences were 20.0, 6.6, and 1.9 K respectively. With respect to the coefficients of Table 9, all model values fall within the respective literature bounds; e.g., at 400K, ∆HCO = −129 kJ/mol (Table 2), E−b = 197 kJ/mol (Table 3), and ECO = 96–111 kJ/mol (Table 6). Overall, it can be inferred that the calibrated model provides reasonable quantitative values in comparison to the experiments.