
Modification by SiO2 of Alumina Support for Light Alkane Dehydrogenation Catalysts

Abstract
:1. Introduction
2. Results and Discussion
2.1. Alumina Support
2.1.1. Thermal Treatment of Boehmite Precursor
2.1.2. SiO2-Modification of the Support
2.2. Chromia-Alumina Catalyst
2.2.1. Composition, Crystal and Pore Structure, Acidity of Catalysts
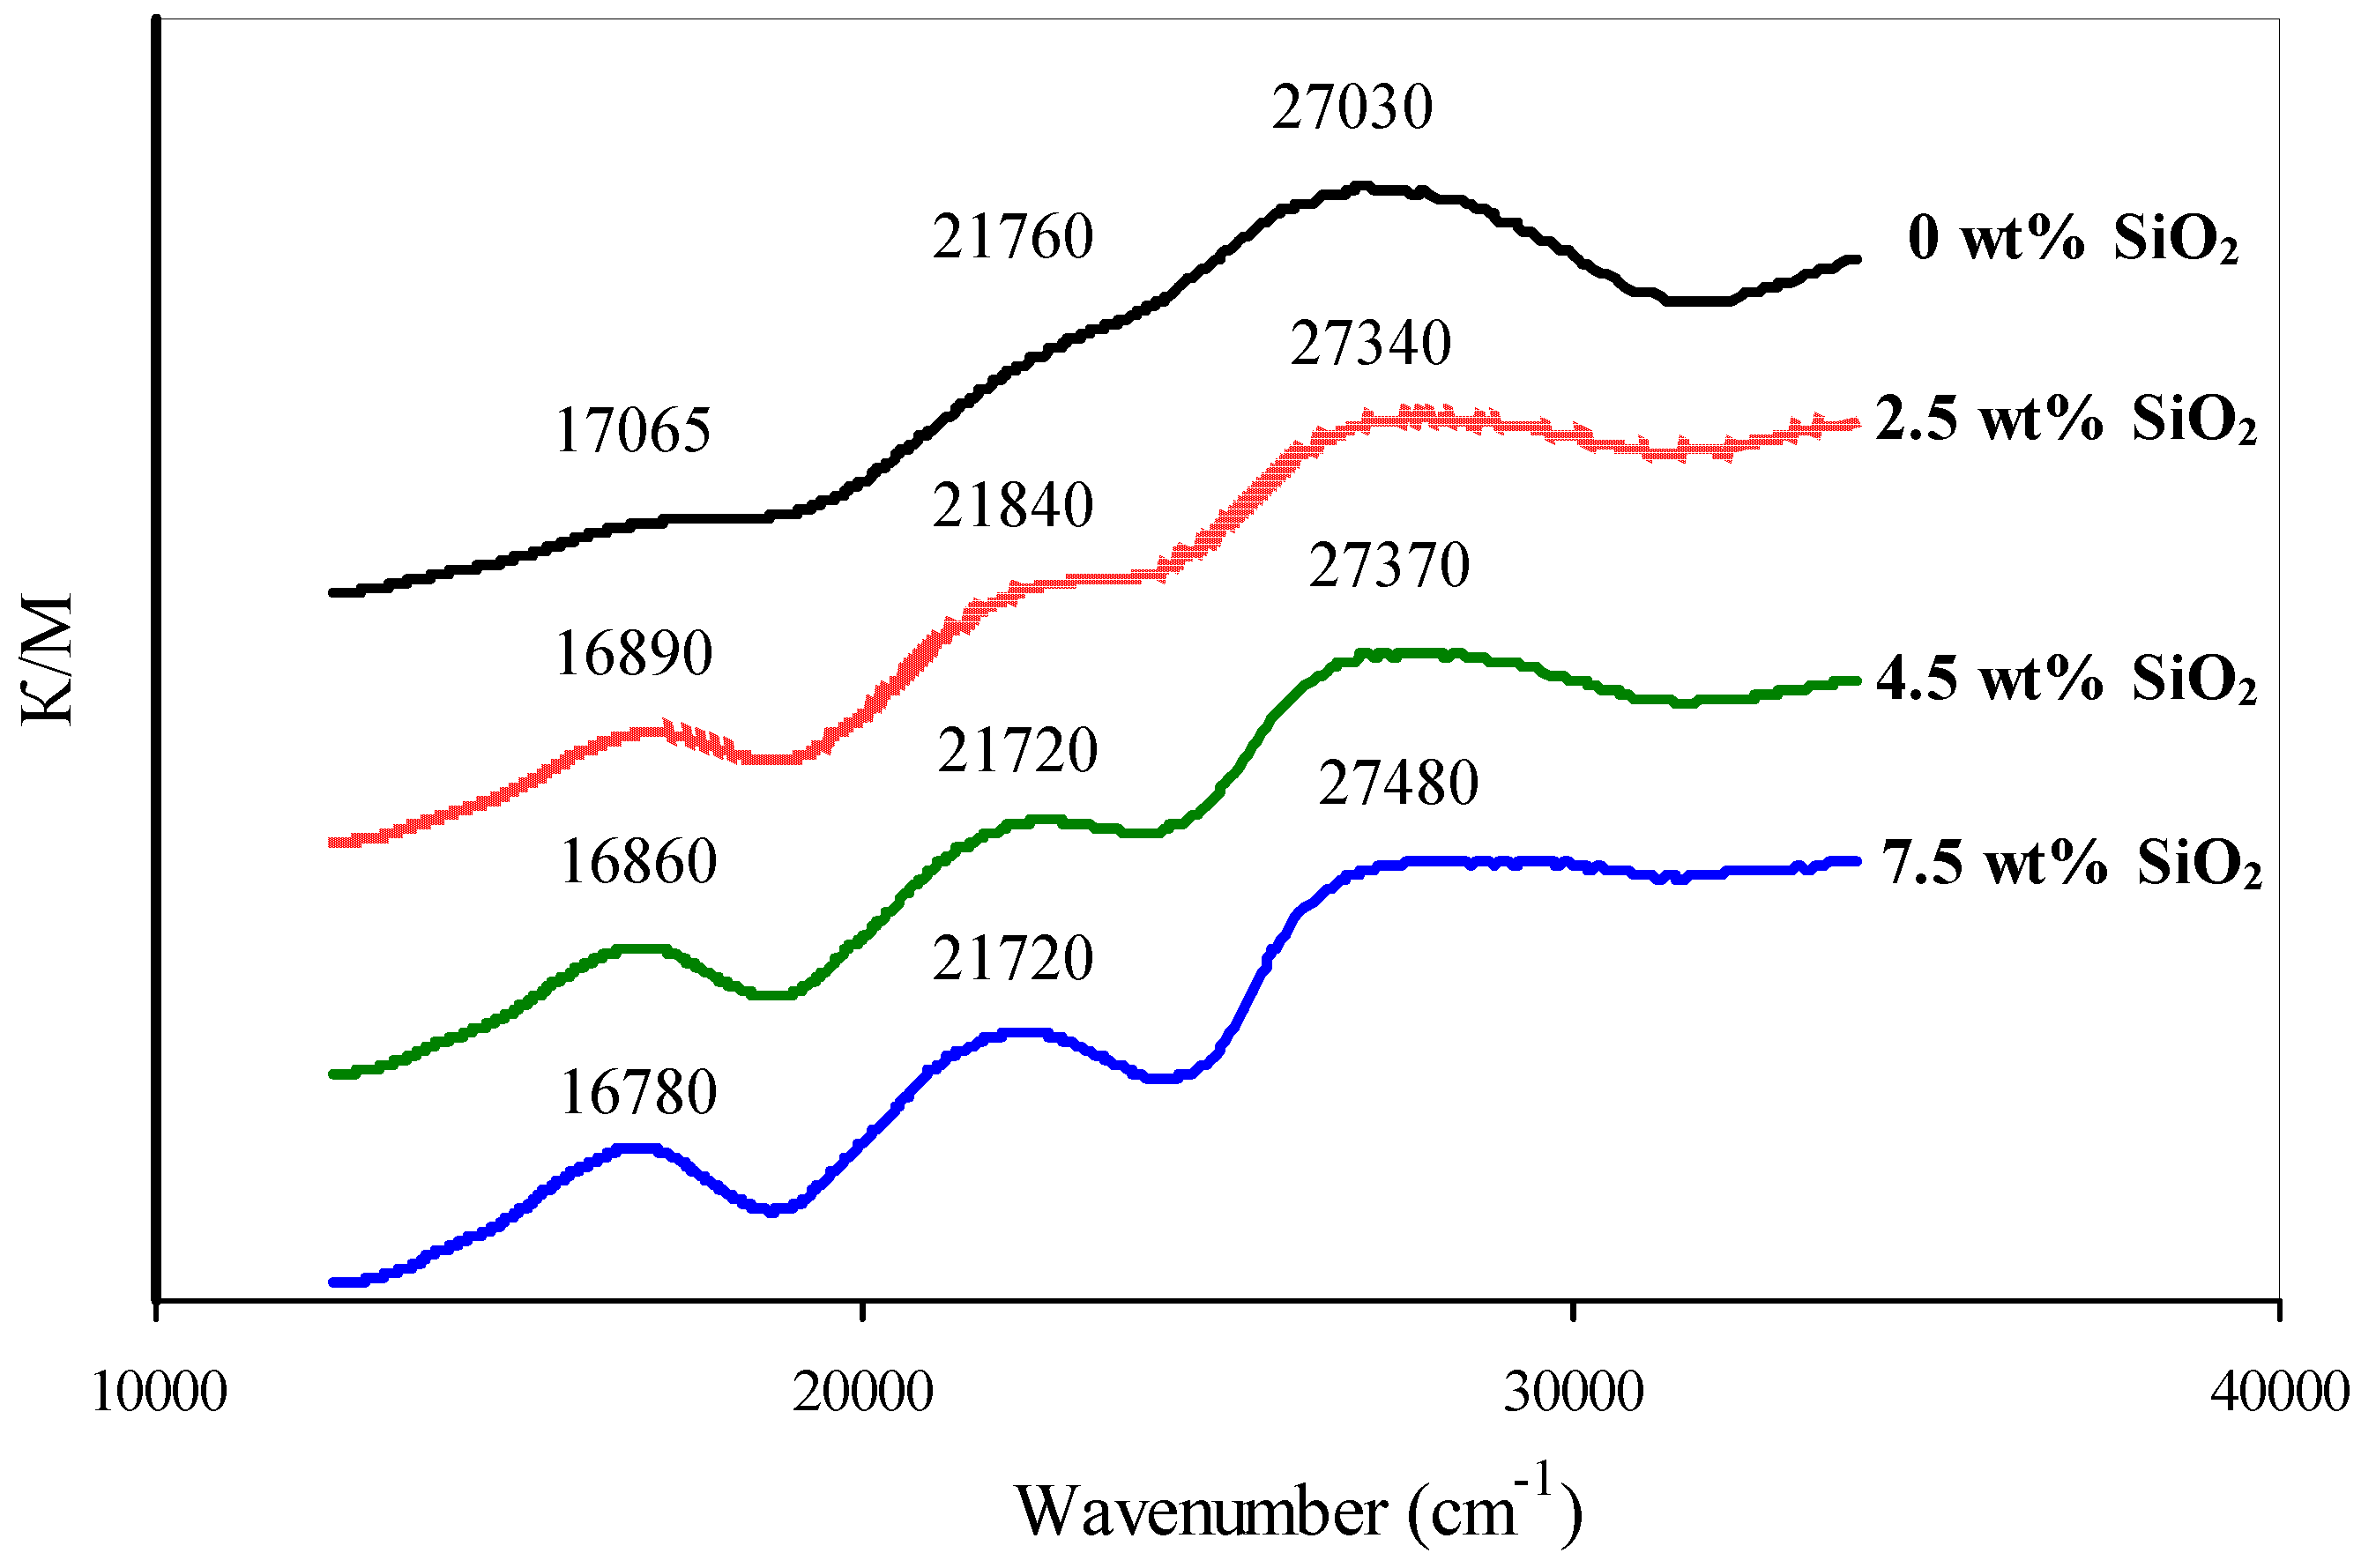
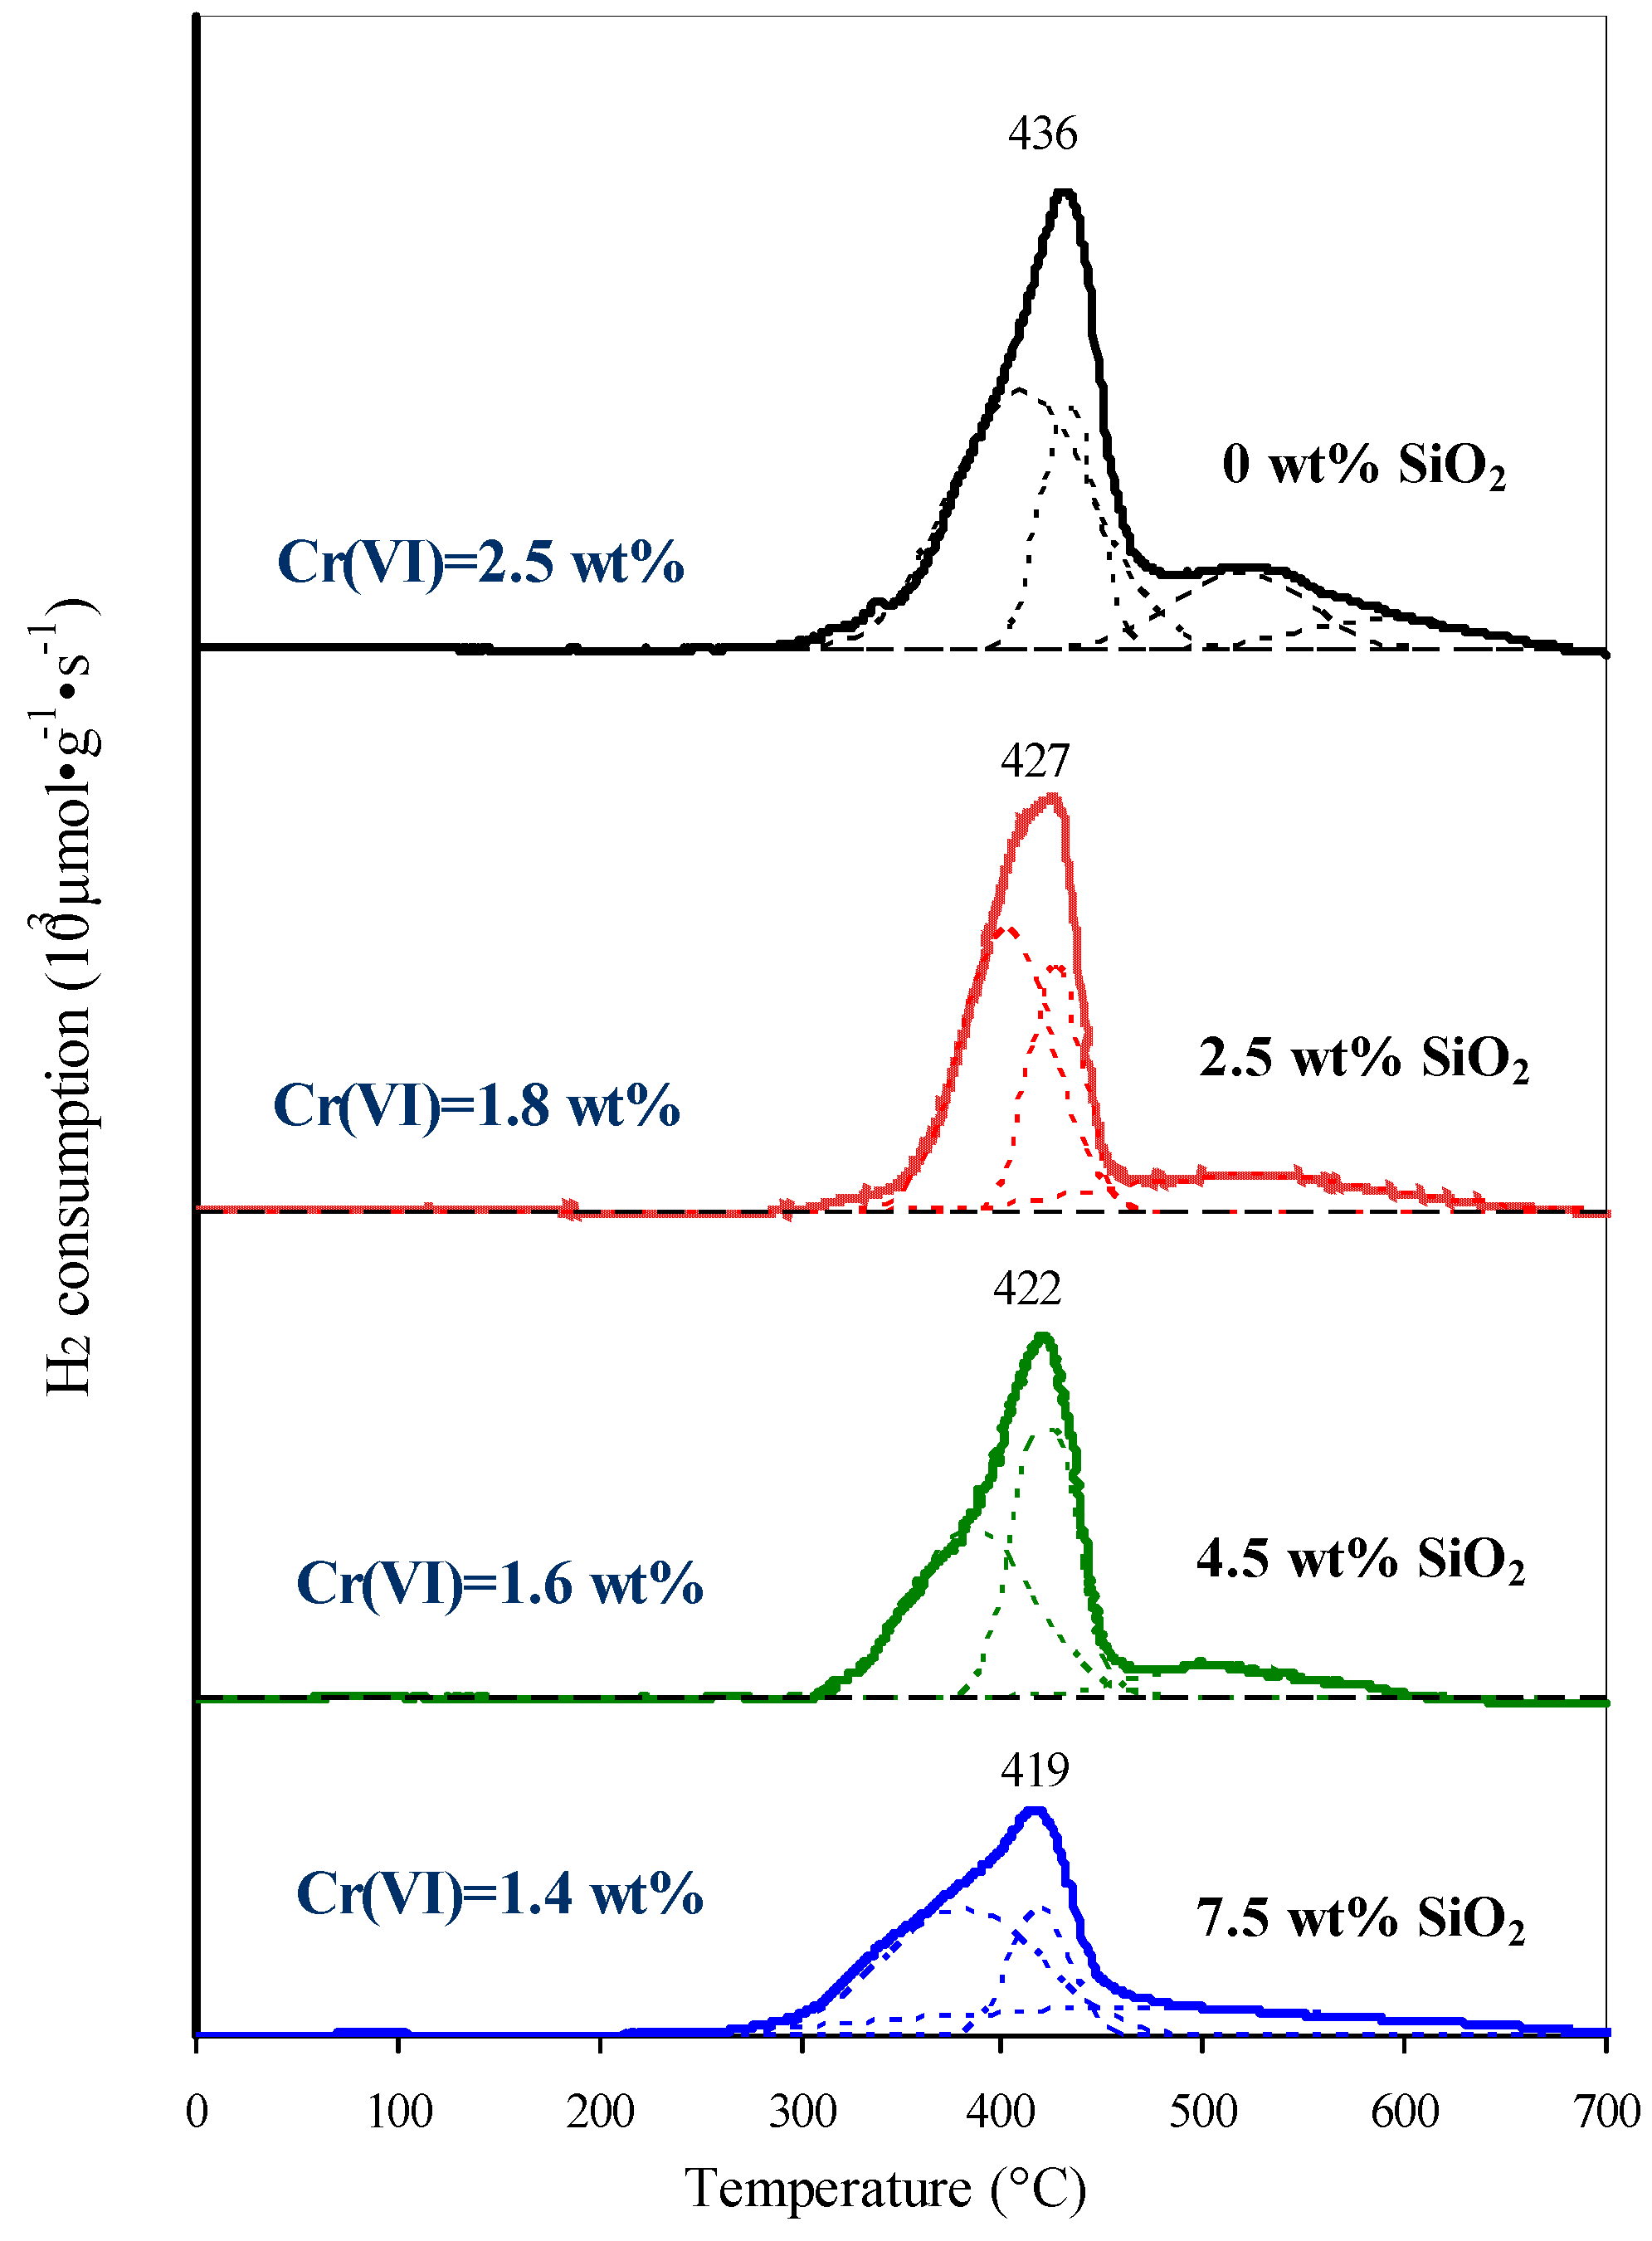
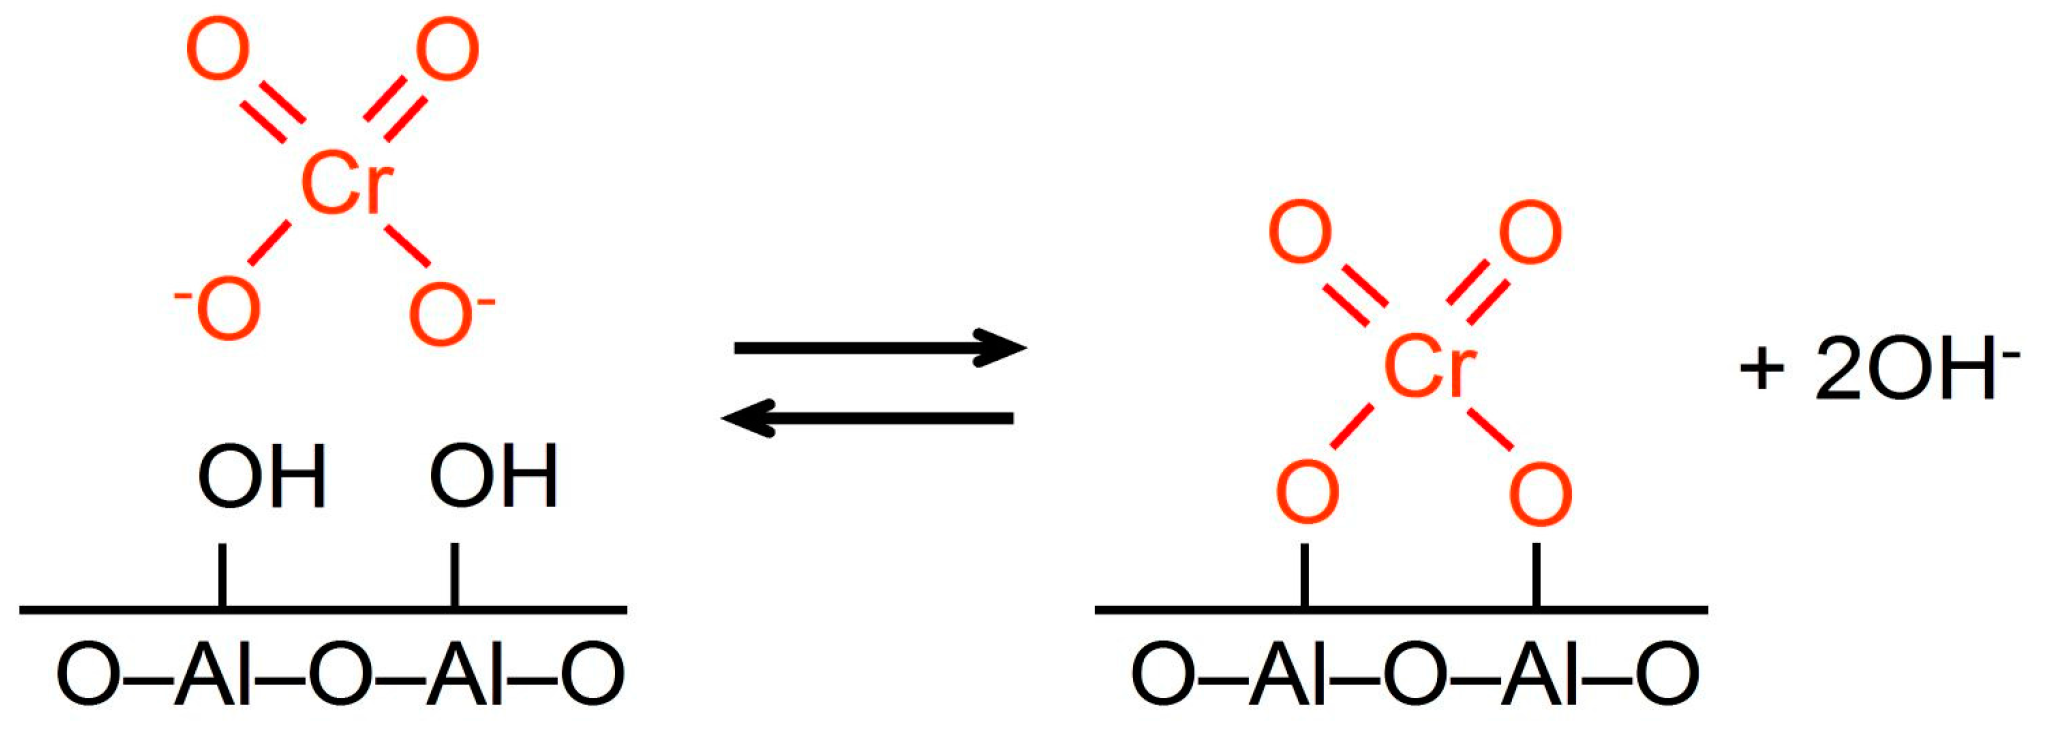
2.2.2. Active Component of Catalysts
2.2.3. Isobutane Dehydrogenation Performance of Catalysts
3. Materials and Methods
3.1. Preparation of Supports and Catalysts
3.2. Characterization of Supports and Catalysts
3.3. Catalyst Testing
4. Conclusions
Acknowledgments
Author Contributions
Conflicts of Interest
References
- Voloshina, O.A.; Nazarova, E.A.; Petrov, I.M. Obzor Rynka Promyshlennyh Katalyzatorov v Rossii (Review of Industrial Catalyst’s Market in Russia); INFOMINE Research Group: Moscow, Russia, 2008; pp. 213–218. [Google Scholar]
- Sattler, J.J.H.B.; Ruiz-Martinez, J.; Santillan-Jimenez, E.; Weckhuysen, B.M. Catalytic dehydrogenation of light alkanes on metals and metal oxides. Chem. Rev. 2014, 114, 10613–10653. [Google Scholar] [CrossRef] [PubMed]
- Kolesnikov, I.M. Kataliz i Proizvodstvo Katalizatorov (Catalysis and Catalysts Production); Tehnika: Moscow, Russia, 2004; pp. 314–315. [Google Scholar]
- Pakhomov, N.A.; Parakhin, O.A.; Nemykina, E.I.; Danilevich, V.V.; Chernov, M.P.; Pecherichenko, V.A. Microspherical chromium oxide/alumina catalyst KDM for fluidized bed isobutane dehydrogenation: Development and industrial application experience. Catal. Ind. 2012, 4, 298–307. [Google Scholar] [CrossRef]
- Egorova, S.R.; Kataev, A.N.; Bekmukhamedov, G.E.; Lamberov, A.A.; Gil’mullin, R.R.; Nesterov, O.N. Development of technology for the production of microspherical aluminum oxide supporter for the paraffin dehydrogenation catalyst. Catal. Ind. 2009, 1, 381–390. [Google Scholar] [CrossRef]
- Zeeshan, N. Light alkane dehydrogenation to light olefin technologies: A comprehensive review. Rev. Chem. Eng. 2015, 31, 413–436. [Google Scholar]
- Sanfilippo, D.; Miracca, I. Dehydrogenation of paraffins: synergies between catalyst design and reactor engineering. Catal. Today 2006, 111, 133–139. [Google Scholar] [CrossRef]
- Korhonen, S.T.; Airaksinen, S.M.K.; Banares, M.A.; Krause, A.O.I. Isobutane dehydrogenation on zirconia-, alumina-, and zirconia/alumina-supported chromia catalysts. Appl. Catal. A 2007, 333, 30–41. [Google Scholar] [CrossRef]
- Bugrova, T.A.; Litvyakova, N.N.; Mamontov, G.V. Effect of zirconia additives on the activity of the Cr/SiO2 catalyst in isobutane dehydrogenation. Kinet. Catal. 2015, 56, 758–763. [Google Scholar] [CrossRef]
- Jiménez-López, A.; Rodr’ıguez-Castellón, E.; Maireles-Torres, P.; D’ıaz, L.; Mérida-Robles, J. Chromium oxide supported on zirconium- and lanthanum-doped mesoporous silica for oxidative dehydrogenation of propane. Appl. Catal. A 2001, 218, 295–306. [Google Scholar] [CrossRef]
- Hoang, D.L.; Dittmar, A.; Radnik, J.; Brzezinka, K.-W.; Witke, K. Redox behaviour of La-Cr compounds formed in CrOx/La2O3 mixed oxides and CrOx/La2O3/ZrO2 catalysts. Appl. Catal. A 2003, 239, 95–110. [Google Scholar] [CrossRef]
- Cabrera, F.; Ardissone, D.; Gorriz, O.F. Dehydrogenation of propane on chromia/alumina catalysts promoted by tin. Catal. Today 2008, 133–135, 800–804. [Google Scholar] [CrossRef]
- Babenko, V.S.; Pakhomov, N.A.; Buyanov, R.A. Investigation of the thermal stability of the chromia–alumina catalysts for the process of the one-stage dehydrogenation of n-butane. Catal. Ind. 2009, 1, 43–49. [Google Scholar] [CrossRef]
- Buonomo, F.; Jezzi, R.; Notari, B.; Kotelnikov, G.R.; Michailov, K.R.; Patanov, V.A. Method for the Preparation of a Catalyst for the Dehydrogenation of C3-C5 paraffins. U.S. Patent 4746643, 24 May 1988. [Google Scholar]
- Rombi, E.; Cutrufello, M.G.; Solinas, V.; De Rossi, S.; Ferraris, G.; Pistone, A. Effects of potassium addition on the acidity and reducibility of chromia/alumina dehydrogenation catalysts. Appl. Catal. A 2003, 251, 255–266. [Google Scholar] [CrossRef]
- Paukshtis, E.A. Infrakrasnaya Spectroscopya v Geterogennom Kislotno-Osnovnom Katalize (IR-spectroscopy in Heterogeneous Acid-Base Catalysis); Nauka: Novosibirsk, Russia, 1992; pp. 78–92. [Google Scholar]
- Morrow, B.A.; Cody, I.A. Infrared studies of reactions on oxide surfaces. 6. Active sites on dehydroxylated silica for the chemisorption of ammonia and water. J. Phys. Chem. 1976, 80, 1998–2004. [Google Scholar] [CrossRef]
- Lindblad, M.; Root, A. Atomically controlled preparation of silica on alumina. Stud. Surf. Sci. Catal. 1998, 118, 817–826. [Google Scholar]
- Lundie, D.T.; McInroy, A.R.; Marshall, R.; Winfield, J.M.; Jones, P.; Dudman, C.C.; Parker, S.F.; Mitchell, C.; Lennon, D. Improved description of the surface acidity of η-alumina. J. Phys. Chem. B. 2005, 109, 11592–11601. [Google Scholar] [CrossRef] [PubMed]
- Srinivasan, S.; Narayanan, C.R.; Datye, A.K. The role of sodium and structure on the catalytic behavior of alumina: II. IR spectroscopy. Appl. Catal. A 1995, 132, 289–308. [Google Scholar] [CrossRef]
- Iengo, P.; Di Serio, M.; Solinas, V.; Gazzoli, D.; Salvio, G.; Santacesaria, E. Preparation and properties of new acid catalysts obtained by grafting alkoxides and derivatives on the most common supports. Part II: Grafting zirconium and silicon alkoxides on γ-alumina. Appl. Catal. A 1998, 170, 225–244. [Google Scholar] [CrossRef]
- McMillan, M.A.; Brinen, J.S.; Carruhers, J.D.; Haller, G.L. 29Si NMR investigation of the structure of amorphous silica-alumina supports. Colloids Surf. 1989, 38, 133–148. [Google Scholar] [CrossRef]
- Sato, S.; Sodesawa, T.; Nozaki, F.; Shoji, H. Solid-state NMR of silica-alumina prepared by chemical vapor deposition. J. Mol. Catal. 1991, 66, 343–355. [Google Scholar] [CrossRef]
- Finocchio, E.; Busca, G.; Rossini, S.; Cornaro, U.; Piccoli, V.; Miglio, R. FT-IR characterization of silicated aluminas, active olefin skeletal isomerization catalysts. Catal. Today 1997, 33, 335–352. [Google Scholar] [CrossRef]
- Kataev, A.N. Formation of a Monophase Microspherical Alumina Support and a Catalyst for Isobutane Dehydrogenation in the Industrial Synthesis. Ph.D. Thesis, Kazan State Technological University, Kazan, Russia, 2009; p. 106. [Google Scholar]
- Cavani, F.; Koutyrev, M.; Trifiro, F.; Bartolini, A.; Ghisletti, D.; Iezzi, R.; Santucci, A.; Del Piero, G. Chemical and physical characterization of alumina-supported chromia-based catalysts and their activity in dehydrogenation of isobutane. J. Catal. 1996, 158, 236–250. [Google Scholar] [CrossRef]
- Reinen, D. Ligand-field spectroscopy and chemical bonding in Cr3+-containing oxidic solids. Struct. Bond. 1969, 6, 30–51. [Google Scholar]
- Weckhuysen, B.M.; Wachs, I.E.; Schoonheyd, R.A. Surface chemistry and spectroscopy of chromium in inorganic oxides. Chem. Rev. 1996, 96, 3327–3349. [Google Scholar] [CrossRef] [PubMed]
- Weckhuysen, B.M.; De Ridder, L.M.; Schoonheydt, R.A. A quantitative diffuse reflectance spectroscopy study of supported chromium catalysts. J. Phys. Chem. 1993, 97, 4756–4763. [Google Scholar] [CrossRef]
- Vuurman, M.A.; Hardcastle, F.D.; Wachs, I.E. Characterization of CrO3/A12O3 catalysts under ambient conditions: influence of coverage and calcination temperature. J. Mol. Catal. 1993, 84, 193–205. [Google Scholar] [CrossRef]
- Vuurman, M.A.; Stufkens, D.J.; Oskam, A. Raman spectra of chromium oxide species in CrO3/Al2O3 catalysts. J. Mol. Catal. 1990, 60, 83–98. [Google Scholar] [CrossRef]
- Mentasty, L.R.; Gorriz, O.F.; Cadus, L.E. Chromium oxide supported on different Al2O3 supports: Catalytic propane dehydrogenation. Ind. Eng. Chem. Res. 1999, 38, 396–404. [Google Scholar] [CrossRef]
- Kanervo, J.M.; Krause, A.O.I. Characterisation of supported chromium oxide catalysts by kinetic analysis of H2-TPR data. J. Catal. 2002, 207, 57–65. [Google Scholar] [CrossRef]
- Parks, G.A. The isoelectric points of solid oxides, solid hydroxides and aqueous hydroxo-complex systems. Chem. Rev. 1965, 65, 177–198. [Google Scholar] [CrossRef]
- Spanos, N.; Slavov, S.; Kordulis, Ch.; Lycourghiotis, A. Mechanism of deposition of the CrO42−, HCrO4−, and Cr2O72− ions on the γ-alumina surface. Langmuir 1994, 10, 3134–3147. [Google Scholar] [CrossRef]
- Anderson, J.R. Structura Metallicheskih Katalizatorov (Structure of Metallic Catalysts); Mir: Moscow, Russia, 1978; pp. 40–46. [Google Scholar]
- Weckhuysen, B.M.; De Ridder, L.M.; Grobet, R.J.; Schoonheydt, R.A. Redox behavior and dispersion of supported chromium catalysts. J. Phys. Chem. 1995, 99, 320–326. [Google Scholar] [CrossRef]
- Weckhuysen, B.M.; Verberckmoes, A.A.; Buttiens, A.L.; Schoonheydt, R.A. Diffuse reflectance spectroscopy study of the thermal genesis and molecular structure of chromium-supported catalysts. J. Phys. Chem. 1994, 98, 579–584. [Google Scholar] [CrossRef]
- Puurunen, R.L.; Weckhuysen, B.M. Spectroscopic study on the irreversible deactivation of chromia/alumina dehydrogenation catalysts. J. Catal. 2002, 210, 418–430. [Google Scholar] [CrossRef]
- Weckhuysen, B.M.; Verberckmoes, A.A.; Debaere, J.; Ooms, K.; Langhans, I.; Schoonheydt, R.A. In situ UV-Vis diffuse reflectance spectroscopy—On line activity measurements of supported chromium oxide catalysts: relating isobutane dehydrogenation activity with Cr-speciation via experimental design. J. Mol. Catal. A Chem. 2000, 151, 115–131. [Google Scholar] [CrossRef]
- Weckhuysen, B.M.; Bensalem, A.; Schoonheydt, R.A. In situ UV-VIS diffuse reflectance spectroscopy-on-line activity measurements. Significance of Crn+species (n = 2, 3 and 6) in n-butane dehydrogenation catalyzed by supported chromium oxide catalysts. J. Chem. Soc. Faraday Trans. 1998, 94, 2011–2014. [Google Scholar] [CrossRef]
- Airaksinen, S.M.K.; Harlin, M.E.; Krause, A.O.I. Kinetic modeling of dehydrogenation of isobutane on chromia/alumina catalyst. Ind. Eng. Chem. Res. 2002, 41, 5619–5626. [Google Scholar] [CrossRef]
- Carrà, S.; Forni, L.; Vintani, C. Kinetics and mechanism in catalytic dehydrogenation of n-butane over chromia-alumina. J. Catal. 1967, 9, 154–165. [Google Scholar] [CrossRef]
- Yushchenko, V.V. Calculation of the acidity spectra of catalysts from temperature-programmed ammonia desorption data. J. Phys. Chem. (Zhurnal Fizicheskoi Khimii) 1997, 71, 628–632. [Google Scholar]


| Sample | Temperature of Treatment | Crystalline Phase | Brunauer-Emmett-Teller (BET) Surface Area (m2·g−1) | Pore Volume (cm3·g−1) | Total Number of Acid Sites (μmol·g−1) | Number of Acid Sites with Edes.NH3 >150 kJ·mol−1 (μmol·g−1) |
|---|---|---|---|---|---|---|
| Precursor of Alumina | - | γ-AlOOH | 27 | 0.07 | - | - |
| Alumina support | 750 | γ-Al2O3 | 92 | 0.27 | 125.8 | 16.2 |
| 800 | 83 | 0.26 | 102.3 | 10.0 | ||
| 850 | 62 | 0.26 | 91.8 | 8.5 |
| SiO2 Content (wt %) | BET Surface Area (m2·g−1) | Pore Volume (cm3·g−1) | Distribution of Pore Volume (cm3·g−1) over Pore Diameters | ||
|---|---|---|---|---|---|
| <10 nm | 10–30 nm | >30 nm | |||
| 0 | 83 | 0.26 | 0.08 | 0.13 | 0.05 |
| 2.5 | 80 | 0.27 | 0.06 | 0.15 | 0.06 |
| 4.5 | 82 | 0.27 | 0.06 | 0.15 | 0.06 |
| 7.5 | 87 | 0.28 | 0.06 | 0.16 | 0.06 |
| SiO2 Content (wt %) | Total Number of Acid Sites (μmol·g−1) | Distribution of Acid Sites (μmol·g−1) on the Energy of Ammonia Desorption | ||
|---|---|---|---|---|
| <100 kJ·mol−1 | 100–150 kJ·mol−1 | >150 kJ·mol−1 | ||
| 0 | 102.3 | 25.6 | 66.7 | 10.0 |
| 2.5 | 115.2 | 29.0 | 81.8 | 4.5 |
| 4.5 | 119.4 | 37.5 | 78.7 | 3.1 |
| 7.5 | 125.3 | 45.0 | 78.0 | 2.4 |
| Chromium Content (wt %) | Potassium Content (wt %) | Surface Concentration of Chromium (atoms·nm−2) | Dehydrogenation Rate (μmolC4H10·gcat−1·s−1) | Cracking Rate (μmol[C1–C3]·gcat−1·s−1) Initial | |
|---|---|---|---|---|---|
| Initial | After Treatment at 1000 °C | ||||
| 4.5 | 0.6 | 6.5 | 2.7 | 2.4 | 0.32 |
| 6.5 | 0 | 10.0 | 2.8 | - | 0.47 |
| 6.5 | 0.8 | 10.0 | 3.0 | 3.1 | 0.29 |
| 8.5 | 1.1 | 13.5 | 3.1 | 2.5 | 0.27 |
| Chromium Content (wt %) | Potassium Content (wt %) | SiO2 Content (wt %) | Cr(VI) Content 1 (wt %) | BET Surface Area (m2·g−1) | Pore Volume (cm3·g−1) |
|---|---|---|---|---|---|
| 6.5 | 0.8 | 0 | 2.5 | 77 | 0.22 |
| 6.5 | 0.8 | 2.5 | 1.9 | 73 | 0.22 |
| 6.5 | 0.8 | 4.5 | 1.6 | 74 | 0.22 |
| 6.5 | 0.8 | 7.5 | 1.4 | 70 | 0.22 |
| SiO2 Content (wt %) | Total Number of Acid Sites (μmol·g−1) | Distribution of Acid Sites (μmol·g−1) on the Energy of Ammonia Desorption | ||
|---|---|---|---|---|
| <100 kJ·mol−1 | 100–150 kJ·mol−1 | >150 kJ·mol−1 | ||
| 0 | 72.4 | 9.3 | 53.4 | 9.7 |
| 2.5 | 93.7 | 12.9 | 78.0 | 2.8 |
| 4.5 | 102.8 | 15.7 | 85.5 | 1.6 |
| 7.5 | 109.6 | 13.8 | 95.6 | 0.2 |
© 2016 by the authors; licensee MDPI, Basel, Switzerland. This article is an open access article distributed under the terms and conditions of the Creative Commons Attribution (CC-BY) license (http://creativecommons.org/licenses/by/4.0/).
Share and Cite
Bekmukhamedov, G.E.; Mukhamed’yarova, A.N.; Egorova, S.R.; Lamberov, A.A. Modification by SiO2 of Alumina Support for Light Alkane Dehydrogenation Catalysts. Catalysts 2016, 6, 162. https://doi.org/10.3390/catal6100162
Bekmukhamedov GE, Mukhamed’yarova AN, Egorova SR, Lamberov AA. Modification by SiO2 of Alumina Support for Light Alkane Dehydrogenation Catalysts. Catalysts. 2016; 6(10):162. https://doi.org/10.3390/catal6100162
Chicago/Turabian StyleBekmukhamedov, Giyjaz E., Alya N. Mukhamed’yarova, Svetlana R. Egorova, and Alexander A. Lamberov. 2016. "Modification by SiO2 of Alumina Support for Light Alkane Dehydrogenation Catalysts" Catalysts 6, no. 10: 162. https://doi.org/10.3390/catal6100162
APA StyleBekmukhamedov, G. E., Mukhamed’yarova, A. N., Egorova, S. R., & Lamberov, A. A. (2016). Modification by SiO2 of Alumina Support for Light Alkane Dehydrogenation Catalysts. Catalysts, 6(10), 162. https://doi.org/10.3390/catal6100162