Article

Solvothermal Conversion of Lignosulfonate Assisted by Ni Catalyst: Investigation of the Role of Ethanol and Ethylene Glycol as Solvents

by
Soheila Ghafarnejad Parto
1,
Jakob Munkholt Christensen
1,
Lars Saaby Pedersen
2,
Freddy Tjosås
3 and
Anker Degn Jensen
1,*
1
Chemical and Biochemical Engineering, Technical University of Denmark, 2800 Kgs. Lyngby, Denmark
2
Haldor Topsøe A/S, Nymøllevej 55, DK-2800 Kgs. Lyngby, Denmark
3
Borregaard A/S, 1721 Sarpsborg, Norway
*
Author to whom correspondence should be addressed.
Catalysts 2018, 8(11), 502; https://doi.org/10.3390/catal8110502
Submission received: 25 September 2018 / Revised: 14 October 2018 / Accepted: 23 October 2018 / Published: 27 October 2018
(This article belongs to the Special Issue Heterogeneous Catalysis for Valorization of Lignocellulosic Biomass)

Abstract

:
In this study, reductive solvolysis of lignosulfonate using Ni-based catalysts in ethylene glycol (EG) and ethanol (EtOH) at 250 °C was investigated. The liquefied fractions, regarded as oil, were carefully analyzed using size-exclusion chromatography (SEC) and gas chromatography–mass spectrometry with flame ionization detection (GC-MS-FID). The oil yields from catalytic conversion in EtOH and EG were similar, being 31 and 32 wt.%, respectively. The oil fractions from depolymerization in EtOH had lower molecular weight compared to the oil products in EG, indicating a higher degree of degradation of liquefied products in EtOH. On the other hand, EG showed superior activity in inhibiting condensation reactions; 16 and 46 wt.% tetrahydrofuran (THF) soluble and THF insoluble solid fractions were obtained from conversion in EtOH, while those numbers in EG were 45 and 23 wt.%, respectively. The Ni-based catalyst was introduced to provide active sites for hydrogenation of lignosulfonate fragments released into the solvent. The presence of NiS in the spent catalyst, formed from reaction between Ni and sulfur in the lignosulfonate, was confirmed. The sulfur content in the oil obtained in EtOH was 0.38 wt.%, which in comparison to lignosulfonate with 3.1 wt.% sulfur, indicated a high level of desulfurization.

1. Introduction

Lignocellulosic biomass is composed of 15–35 wt.% lignin, which provides mechanical stability and biological protection for the plants [1,2]. Lignin is made of phenylpropane building blocks connected via C-C and C-O bonds [3]. The complex and heterogeneous structure of lignin makes it a recalcitrant compound for degradation. Depending on the origin of the biomass, the structure of the lignin differs. Moreover, the structure of native lignin is transformed during pretreatment processes for isolation of cellulose and hemicellulose via cleavage of interconnecting C-O bonds and formation of new bonds [3]. A process that successfully can depolymerize lignin to monomeric units and degraded fractions may supplement the conventional petrochemical routes for production of valuable chemicals and fuels. One-pot degradation of lignin in a solvent assisted with a heterogeneous catalyst is a promising approach for conversion of lignin to higher value products and fuel [4,5,6].
Lignosulfonate is a technical lignin, produced as a byproduct from the sulfite pulping process [7]. During the sulfite pulping, sulfonate groups are introduced to the aliphatic chains via C-S bonds [8]. A simplified structure of lignosulfonate with Na+ as counter ions is shown in Figure 1 [9]. A more realistic structure of lignosulfonate is suggested in the following reference [10]. Lignosulfonate is a surface active biopolymer [11] and is used mainly as binding agent for animal feed, dispersion agent for suspension and slurries, emulsion stabilizer, and cement retarder [2,12]. Despite its commercial availability, and compared to the other types of technical lignin, only few studies are devoted to catalytic depolymerization of lignosulfonate [13,14,15]. Shu et al. [15] reported 64 wt.% liquefied products from non-catalytic conversion of 0.5 g sodium lignosulfonate (Na-LS) in 40 mL methanol in a batch reactor at 280 °C. Addition of a catalyst can promote selective degradation of lignin. Horacek et al. [14] obtained guaiacol and para-substituted guaiacols as the primary quantified products with a guaiacol yield up to 1.8 wt.% from conversion of a 5 wt.% aqueous solution of Na-LS in a tubular flow reactor over Ni/Al2O3 catalyst at 320 °C with H2 flow of 5 NmL/min.
One of the main challenges in catalytic conversion of lignosulfonate is sulfur deposition on the catalytically active sites, as most heterogeneous noble or transition metal based catalysts are poisoned by sulfur. Sulfur affects the catalyst activity by blockage of the reaction sites on the metal surface, electrical modification of the neighboring metal atoms, and through hindrance of the surface diffusion of the reactants [16]. Surprisingly, Song et al. [13] reported sulfur poisoning resistance of Ni-based catalysts during depolymerization of Na-LS. According to them, NiS species were initially formed through decomposition of C-S bonds, and were further reacted with H* radicals under reducing conditions, resulting in the formation of H2S and regeneration of metallic Ni on the catalyst [13]. They reported a conversion of 68 wt.% to oil over a 10 wt.% Ni supported on activated carbon (AC) catalyst with product selectivity of 75 to 95% for the identified alkyl-substituted guaiacols in EG at 200 °C and 50 bar hydrogen (H2) pressure [13], which is a very promising yield of monomeric units. They observed higher conversion of lignosulfonate to oil in EG than in EtOH medium [13]; 21 wt.% conversion was reported in EtOH, however, the role of solvent on the depolymerization mechanism was not elaborated in detail.
The degradation medium has a significant impact on the depolymerization of lignin and stabilization of degraded fragments. EG is a good solvent for dissolution of lignin through formation of H-bonding between EG and hydroxyl groups in the lignin [17]. Furthermore, EG has been reported to act as an end capping agent, preventing repolymerization. Lahive et al. [18] suggested that EG scavenges the in situ-produced formaldehyde and also stabilizes the aldehydes formed in β position from cleavage of β-O-4 [18]. Similarly, Huang et al. [19] demonstrated that EtOH is an effective solvent for degradation of lignin. They investigated depolymerization of Protobind 1000 lignin over CuMgAlOx catalyst in supercritical EtOH at 300 °C, and obtained a monomer yield of 17 wt.% [5]. According to Huang et al. [19], EtOH suppresses the repolymerization reactions through alkylation and esterification with degraded lignin fragments and by stabilization of reactive compounds such as formaldehyde. EtOH and EG can be produced by fermentation of sugar and by hydrogenolysis of cellulose [8], respectively. Production via bio-based processes makes both solvents good candidates for a green and integrated lignin degradation bio-refinery.
In this work, we investigated the conversion of lignosulfonate over Ni-based catalysts in EtOH and EG with a systematic workup procedure. Temperature programmed reduction (TPR), carbon monoxide (CO) chemisorption, ammonia desorption (NH3-TPD), and X-ray diffraction (XRD) were used for characterization of fresh and spent catalysts. A variety of analytical techniques was applied for analysis of different product fractions from upgrading of the lignosulfonate such as SEC, GC-MS-FID, elemental analyzer (CHNSO analysis), inductively coupled plasma-optical emission spectroscopy (ICP-OES), and GC. Moreover, the sulfur stability and the reusability of the Ni-based catalyst are demonstrated and the role of the catalyst support is discussed in detail.

2. Results and Discussions

The results of the analysis of sulfonic acid form lignosulfonate (H-LS) and catalyst, the conversion of H-LS in EtOH and EG and the role of catalyst are elaborated in this section.

2.1. Lignosulfonate

H-LS was prepared by ion-exchange of Na-LS as mentioned in the experimental section. The specifications of H-LS including C, H, S, O, ash content, humidity, weight average and number average molecular weight (Mw and Mn, respectively), and the atomic ratios of O/C and H/C are presented in Table 1. The C, H, S, and O contents are presented based on dry lignin. The corresponding polydispersity [20] of H-LS based on the Mw and Mn values was determined as 4.9.

2.2. Catalyst

5.0 wt.% Ni catalysts supported on SiO2 were prepared by incipient wetness impregnation. A nickel dispersion of 14.7% was measured by CO titration, which corresponds to an approximate catalyst particle size of 7.5 nm assuming that one CO molecule titrates one Ni surface atom. One step reduction of Ni/SiO2 catalyst at 350 °C was confirmed by TPR. In order to understand the role of support material on the catalyst activity, Ni supported on AC, ZrO2, and γ-Al2O3 were prepared. The particle sizes of Ni/AC and Ni/γ-Al2O3 catalysts were estimated to 14.8 and 32.5 nm, respectively (Table 2). As an example, the CO uptake of Ni/γ-Al2O3 catalyst is shown in supplementary material, Figure S1. The acidity of NiO/SiO2, NiO/ZrO2, and NiO/γ-Al2O3 catalysts was measured using NH3-TPD, while NiO/AC was assumed to be neutral. According to NH3-TPD measurements, catalysts with a range of acidity were synthesized. The NH3 adsorption capacity increased in order of 55, 373, and 601 µmol/gcat for NiO/SiO2, NiO/ZrO2, and NiO/γ-Al2O3 catalysts, respectively. The temperature in which NH3 was desorbed from NiO/ZrO2 was within the range of strong acidity while those for NiO/SiO2 and NiO/γ-Al2O3 were in the range of weak acidity. The NH3 desorption profiles are shown in supplementary materials, Figures S2–S4.

2.3. Solvothermal Conversion of Lignosulfonate

Degradation of H-LS in EtOH and EG solvents with/without the presence of Ni/SiO2 catalyst was investigated at 250 °C and the oil and solid yields are presented in Table 3.
The oil and solid yields from non-catalytic conversion of H-LS in supercritical EtOH were 16 wt.% and 70 wt.%, respectively (Table 3, Entry 1). A poor mass balance (86% closed) was obtained which was mainly due to severe deposition of solid products on the internal surface of the autoclave and the stirring compartment, accompanied by loss of solid products during the workup procedure. The oil yield increased to 31 wt.% by catalytic conversion of H-LS in EtOH medium, while the solid yield decreased to 62 wt.% (Table 3, Entry 2). The higher yield of the liquefied oil products in the presence of a catalyst is likely due to the role of catalyst in stabilization of the reactive fragments [21]. Van den Bosch et al. [21] proposed that the role of Ni/γ-Al2O3 in the delignification of birch sawdust in methanol was mainly the stabilization of reactive lignin fragments and thereby the inhibition of repolymerization. With addition of the catalyst the yield of the THF insoluble fraction decreased from 60 wt.% to 46 wt.%, and the yield of THF soluble fraction increased from 10 wt.% to 16 wt.%. The physical appearance of the solid phase changed noticeably by addition of catalyst; the solid residues in non-catalytic reactions were large lumps, while smaller solid particles were obtained after catalytic reaction (shown in supplementary materials, Figure S5). This difference may partially be caused by the grinding action of the catalyst particles on the char under stirring. The yield of the liquefied products was highly influenced by the reaction temperature [15] and increased to 47 wt.% oil yield for conversion of H-LS over Ni/SiO2 catalyst at 300 °C in EtOH (Table 3, Entry 3), and the total solid yield decreased to 39 wt.%. The higher bio-oil yields are likely due to the increased thermal cracking rates at higher temperatures [22] releasing more fragments from H-LS into the solvent and also an increase of end-capping alkylation and hydrogenation reactions compared to repolymerization reactions [5].
A more complex workup procedure using extraction with water and ethyl acetate was applied for isolation of liquefied products from EG. It was assumed that organic compounds were extracted in the ethyl acetate phase. Ethyl acetate was later evaporated using rotary evaporation. However, after its evaporation, excessive oil contents of 6.7 and 7.0 g were obtained from non-catalytic and catalytic tests, respectively (corresponding to ‘apparent’ oil yields of 89 and 93 wt.%). These yields were considerably higher than the expected mass of the oil fractions from degradation of lignin as solid yields of 80 and 68 wt.% were obtained in the absence and presence of catalyst, respectively. It was initially speculated that the extra mass observed in the liquid phase was either due to poor separation of the solvent (EG) from products or extensive solvent incorporation of EG into the lignin fragments, which is elaborated later. The yield of the oil fractions from conversion of H-LS in EG were therefore estimated as being everything not accounted for by the solid fractions (‘estimated’ oil yields). Similar to the reaction in the EtOH medium, the yield of the liquefied fraction increased over the catalyst (Table 3, Entries 4 and 5). The estimated oil yield of 32 wt.% obtained over Ni/SiO2 was very similar to the yield in the EtOH medium. Only 8 wt.% THF insoluble fraction was observed in the non-catalytic condition, however, this number increased to 23 wt.% with catalyst.
In comparison, Song et al. [13] reported 68 and 21 wt.% conversion of Na-LS in EG and EtOH over Ni/AC at 200 °C, respectively. They further observed 78 wt.% conversion from reaction of Na-LS in EG at 240 °C. Unlike Song et al. [13], we observed almost similar yields of 31 and 32 wt.% of the degraded fractions (oil yield) in both solvents, corresponding to almost similar conversions. There may be several reasons for the differences between our work and Song et al. [13]. The origin of lignin and the number of C-O and C-C bonds and also -OH bonds influence its thermal degradation and dissolution in solvents [17,23]. In the work by Song et al. [13], the biomass from which the lignosulfonate was extracted was not stated, and so there may be differences in the feedstocks. Moreover, they had loadings of 0.2 g catalyst, 2 g lignosulfonate, and 120 mL solvent. The excess amount of solvent to lignin ratio compared to our reaction conditions (7.5 g lignin and 75 mL solvent) may affect the conversion as coupling reactions of fragments are expected to be second order reactions. Besides, they used lignosulfonate with sodium ions as counter ions to the sulfonate group, while the lignosulfonate we investigated was in sulfonic acid form. The SO3H groups may acid-catalyze the degradation reaction [8], which may be the reason for the higher conversion we observed in EtOH medium compared to their result. Furthermore, lignosulfonate is highly soluble in EG, while its solubility in EtOH is limited [24]. Some unconverted lignosulfonates may remain soluble in EG after the reaction which then may result in overestimation of the conversions. A suitable workup procedure for separation of degraded products and unreacted lignin from solvent therefore seems critical.

2.3.1. Characterization of the Products and Comparison between EtOH and EG as Reaction Media

The cleavage of facile bonds such as C-O aryl ethers present in the structure of lignin results in the formation of reactive monomeric and dimeric intermediate radicals [18]. Repolymerization reactions and non-selective formation of stable C-C bonds induced by radicals can suppress the degradation and result in formation of char. Condensation of phenolic groups originating from lignosulfonate and aldehydes are reported [8]. Formation of C-C bonds can be inhibited by reaction of the solvent with the radicals. In order to elaborate on the role of each solvent, the liquefied products were analyzed with GC-MS-FID. The chromatograms are shown in supplementary materials, Figures S6 and S7. Monomer yields (based on DAF lignin) of 3.6 and 4.0 wt.% were quantified from non-catalytic and catalytic conversion in EtOH (Table 4). The monomer yields from non-catalytic and catalytic degradation in EG were 1.2 and 0.8 wt.%, and thus significantly lower compared to the monomer yields in EtOH. The observed yields of monomers indicate that the oil fractions are mainly composed of larger fragments including dimers and oligomers. In the work by Song et al. [13] 75 to 95% selectivity for (monomer) alkyl-substituted guaiacols was reported from conversion of Na-LS in EG at 200 °C. However, evaluating our oil fractions using GC-MS-FID results, it was observed that only a fraction of the oil phases were comprised of monomers, and therefore, the high selectivity reported by Song et al. [13] could not be reproduced in our work.
In the oil from conversion of H-LS in EtOH, guaiacol and substituted guaiacols and aromatic esters were the two main groups of identified compounds with guaiacol (selectivity of 8.6% in the absence of catalyst and 5.3% over Ni/SiO2) and ethyl vanillate (selectivity of 10.3% in the absence of catalyst and 5.7% over Ni/SiO2) being the most abundant compounds. Structures of the main identified substituted guaiacols and ethyl esters are shown in supplementary materials, Figure S8. Formation of guaiacol and alkyl substituted guaiacols can take place via hydrogenolysis of C-O-C bonds involving phenyl propane units such as such as β-O-4 and α-O-4 [25]. The cleavage of β-O-4 is reported to occur in the temperature range of 200 to 300 °C in different solvents [22]. Formation of ethyl vanillate was reported from degradation of Alkali lignin at 250 °C over a vanadium sulfide catalyst [26]. The aromatic esters were possibly produced by reaction of aromatic carboxylic acids from degradation of lignosulfonate and EtOH. According to the GC-MS results, esterification occurs in EtOH medium in both non-catalytic and catalytic reactions. The sulfonic acid groups present in the structure of H-LS can catalyze esterification reactions [27]. Esterification reactions are favored for enhancement of the oil quality as carboxylic acids groups decrease the stability of the oil [28]. Guaiacol was the primary monomeric product identified from degradation of lignin in the EG medium, corresponding to selectivity of 5.8 and 2.6 wt.% in the oil phases from non-catalytic and catalytic conditions, respectively.
The stability of the solvent is critical for an economically viable bio-refinery. The GC-MS-FID analysis of the light fractions (solvent + light products) from conversion in EtOH detected 99.4% EtOH (area basis) as the major compound. The GC analysis of the gas phase detected negligible amounts of CO2, CH4, C2H4, and C2H6 from non-catalytic and catalytic conversion of H-LS. This observation indicates that EtOH is relatively stable at the reaction conditions. Considering the reactions in EG, the high apparent yields of liquid phase products were not to a large extent originating from poor extraction of EG, as only 6 and 10 wt.% EG was detected in the oil phases from non-catalytic and catalytic reactions, using GC-MS-FID. The high apparent yield was partially due to conversion of EG; the GC-MS analysis of the oil fractions indicated extensive formation of diethylene glycol (DEG), triethylene glycol (TEG), tetraethylene glycol (TTEG), and compounds such as diethylene glycol ethyl ether. A blank test in the absence of lignin was conducted in order to evaluate self-reaction of EG over Ni/SiO2 catalyst. Only EG and trace amounts of 2-methoxy 1,3 dioxolane were detected from the blank test, which indicate that the formation of DEG, TEG, TTEG, and higher ethylene glycols was associated with the presence of H-LS or its degradation products. A likely explanation for the EG conversion in the presence of H-LS is the acid catalysis from H-LS protons. Self-reaction of EG under acidic conditions and formation of DEG and TEG have previously been reported [29,30]. The H+ originating from SO3H in the structure of H-LS can catalyze such reactions [8]. Similar to a mechanism proposed by Moghaddam et al. [30], protonation of EG can take place by introduction of H+ from the SO3H unit in the lignosulfonate structure (Figure 2). By nucleophilic attack of an adjacent EG molecule, a DEG is formed through dehydration. Formation of TEG and TTEG follows a similar mechanism. The reaction of EG is not limited to self-reaction. EG reacts with reactive lignin intermediates via end-capping reactions [31]. However, we could not detect products formed from reaction of H-LS degraded radicals and EG, which is probably because these compounds were too large to pass the GC column and reach the detector. The mixture containing lignin derived and EG self-reaction products may be directly used for applications such as functional gels and additive for lubricant [32,33].
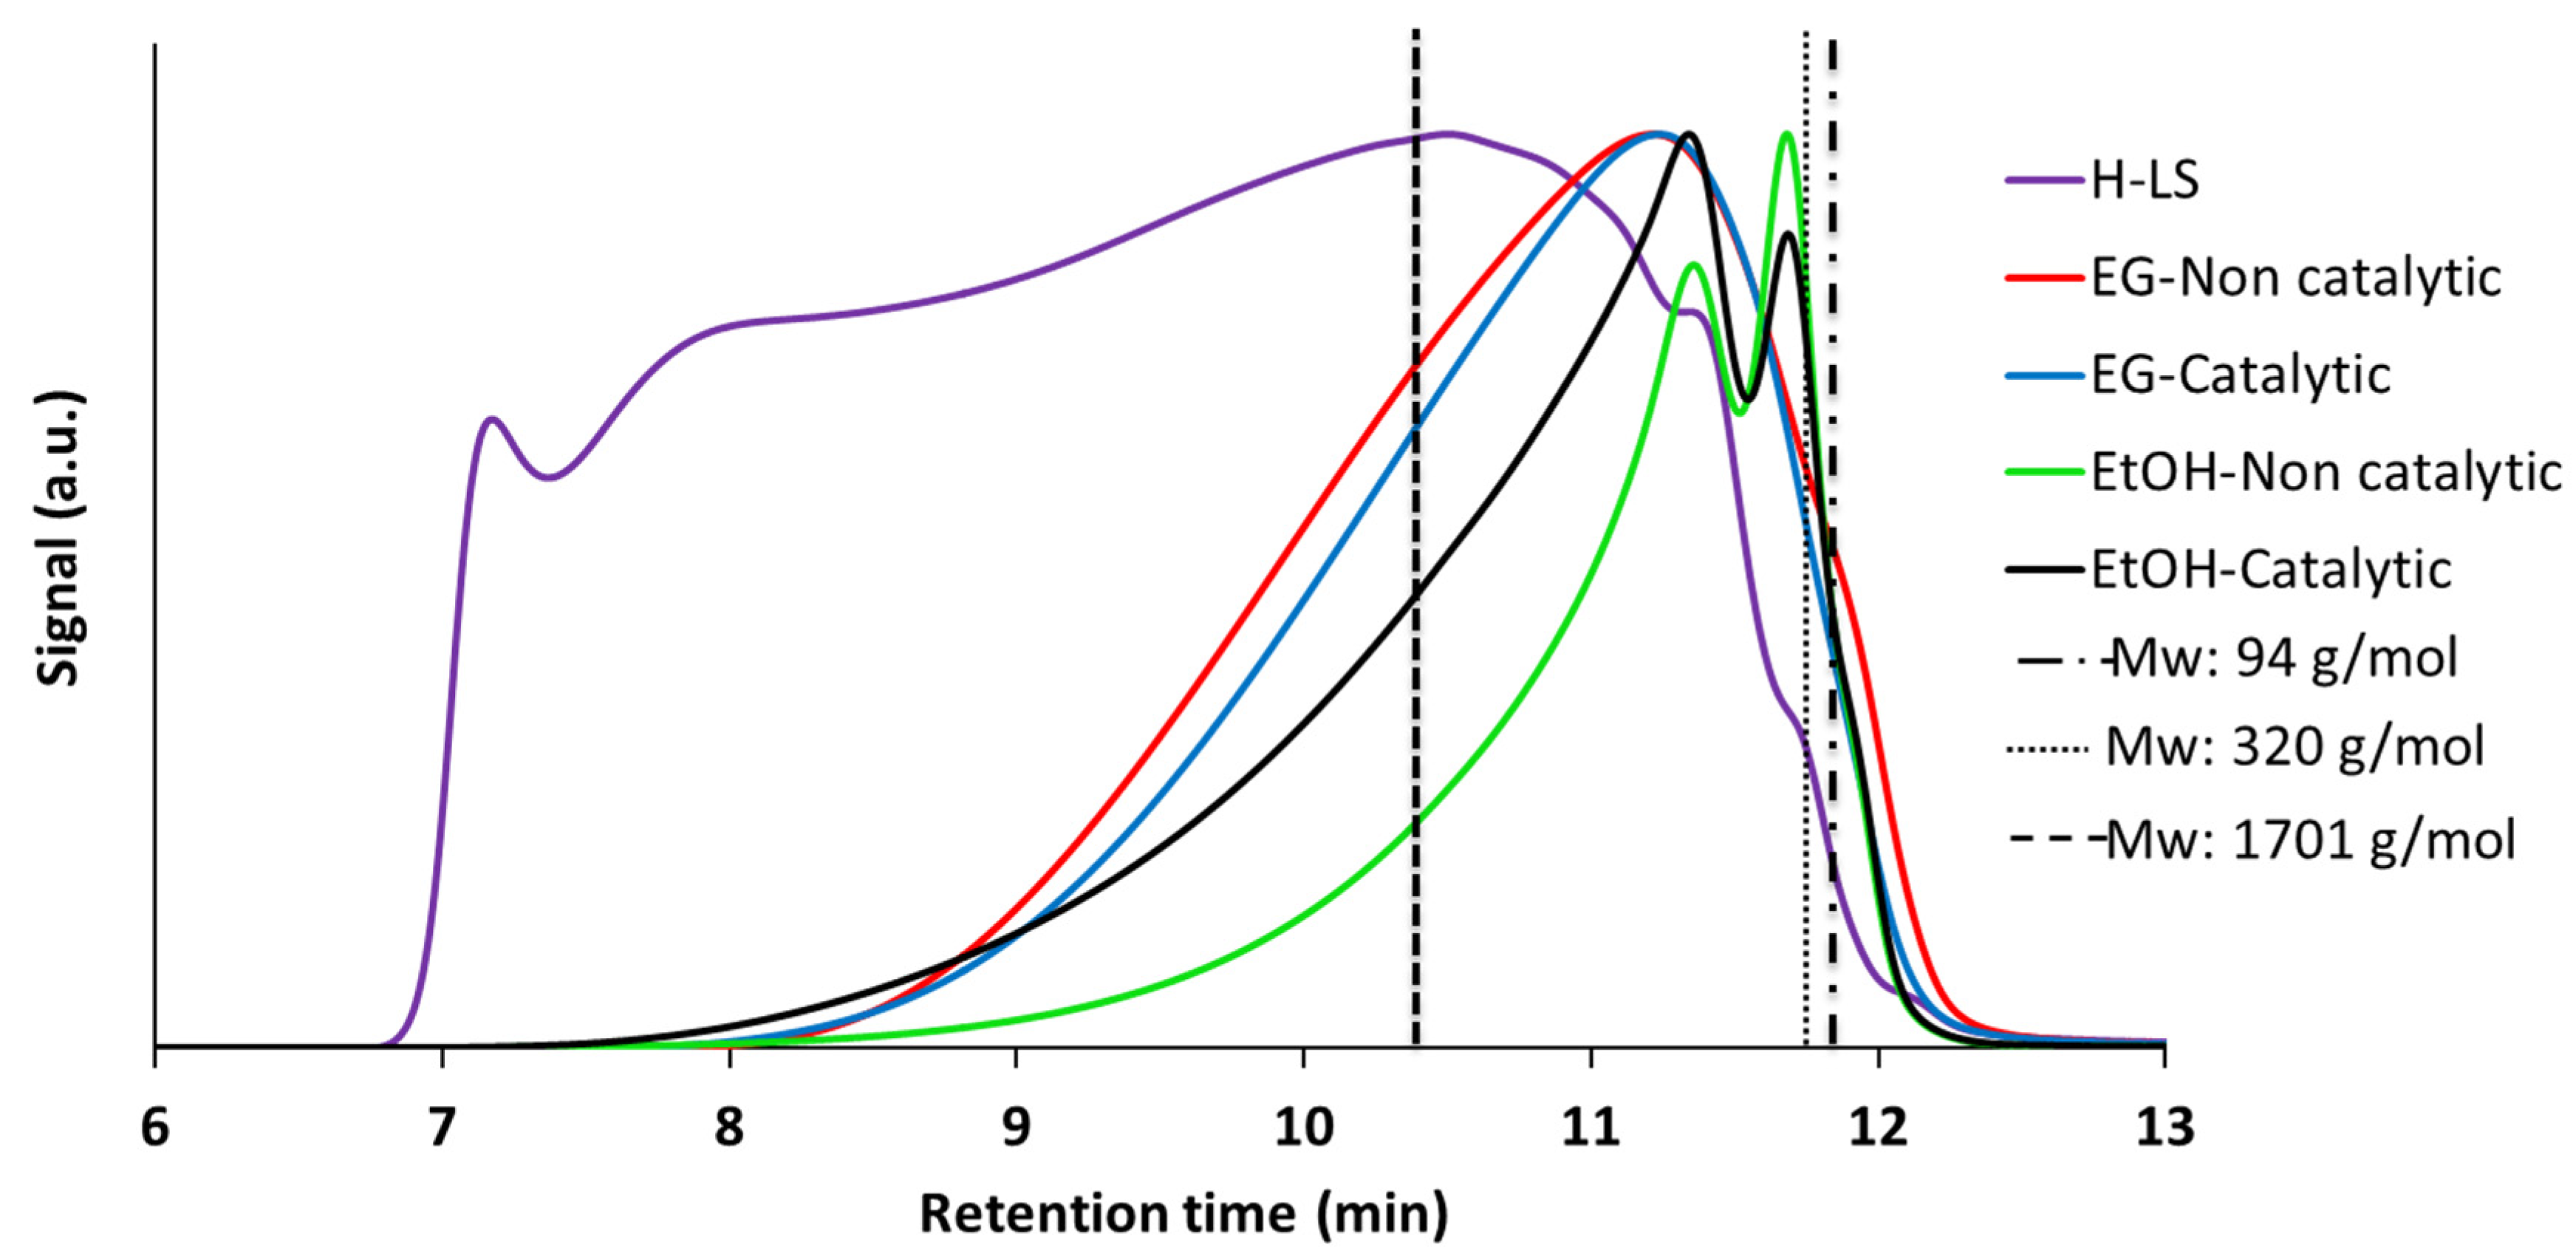
Although GC is a robust method for analysis of chemicals, most of the lignin degradation compounds are not volatile at the conventional GC analysis conditions and will thus not be detected. SEC is a useful technique for determination of the molecular weight distribution of the liquefied fractions. The SEC of the oil fractions obtained from non-catalytic and catalytic degradation of lignosulfonate confirmed formation of lower molecular weight compounds compared to the starting feedstock (Figure 3). The corresponding peak position for phenol, GGGE, and tannic acid as standards is shown for comparison. According to the elution pattern of the oil fractions, the majority of the degraded compounds had molecular weights that ranged from dimers to oligomers. This is consistent with the GC-MS-FID analysis showing relatively low yields of monomers. The SEC of the oil fractions from EtOH tests showed a bimodal pattern (See Figure 3). The oil from catalytic conversion in EtOH showed a larger shoulder in higher molecular weight fractions (lower retention times) compared to the oil produced without a catalyst while the elution of the non-catalytic oil produced in EG medium showed a slightly broader molecular weight distribution compared to the oil formed in the presence of a catalyst. Comparing the molecular weight distributions of the oil in the two different solvents indicates that the oil fractions from EtOH medium had much smaller molecular weight compared to the oils in EG. Previously Schutyser et al. [31] also observed formation of higher molecular weight lignin oligomers in EG than in other solvents including EtOH, water and methanol from conversion of birch sawdust over Pd/C catalyst at 200 °C. The higher molecular weight of the oil in EG medium may be due to both the abovementioned self-reactions of EG to generate products of high molecular weight as well as the ability of EG with its two hydroxyl groups to link two lignin degradation products into a larger species. Both EG and EtOH solvents can perform end-capping of formed radical fragments. They react with –OH and –COOH groups in the degraded fractions via different reactions including etherification and esterification. EG, having two hydroxyl groups, most likely links two smaller fragments into a larger one while EtOH, having one hydroxyl group, reacts with only one radical fragment. Moreover, reaction of lignin degraded fragments with products from self-reaction of EG is expected. Thus, conversion in EG leads to oils with larger molecular weight. Taking into account the SEC and GC-MS-FID results of the oil fractions, it is concluded that the role of the catalyst has been more pronounced in formation of dimers and oligomers, perhaps by inhibiting condensation of larger fragments, whereas the monomer yields has not been increased by a catalyst. This is probably because the H-LS is more cross-linked than native lignin with bonds between the dimers and oligomers that cannot be severed under the present reaction conditions. As a result, the formation of monomers during degradation of H-LS is not likely.
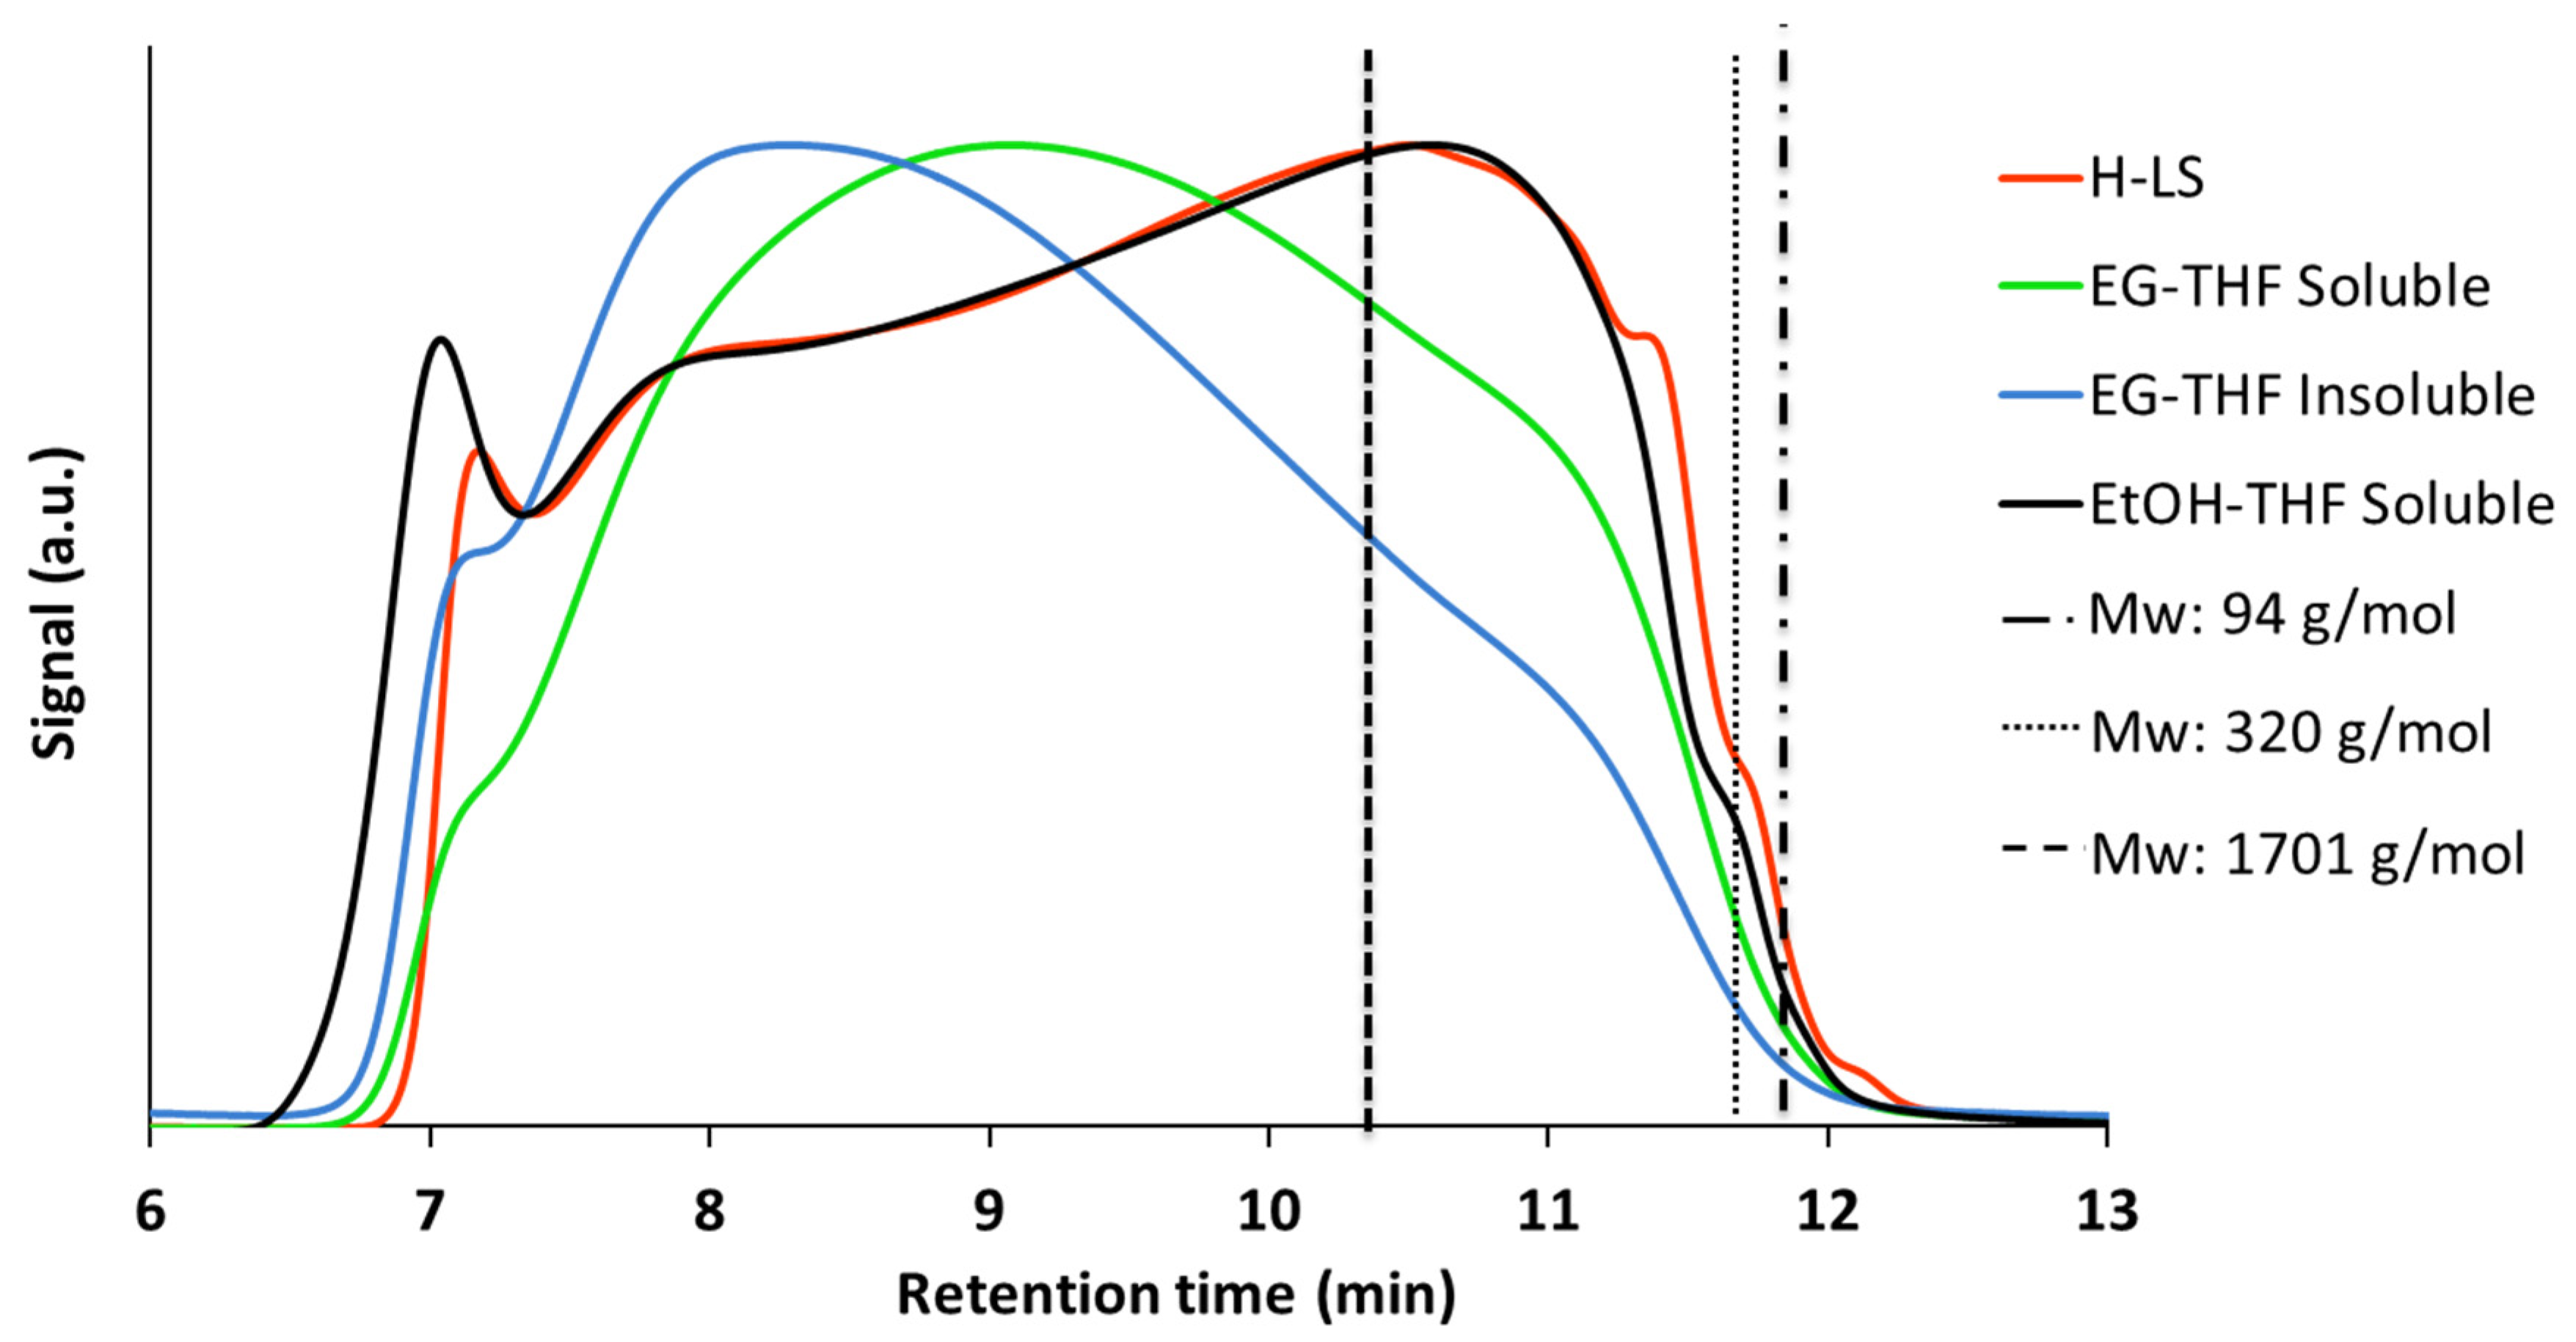
The solid phases were fractionized into THF soluble and THF insoluble compounds and analyzed with SEC. However, the THF insoluble fraction from the EtOH test was not soluble in the solvent used for SEC analysis. This indicates that the THF insoluble fraction from EtOH medium was composed of highly cross-linked carbonaceous fragments. The SEC analyses of the solid phases from catalytic conversion of H-LS in both solvents are shown in Figure 4. The molecular weight distribution of the THF soluble fraction from the EtOH medium practically overlays on the SEC of H-LS, which suggests that this phase is largely composed of unreacted lignosulfonate. Moreover, formation of higher molecular weight fractions compared to H-LS in the left shoulder confirms condensation reactions building larger structures. The THF soluble fraction from EG medium shows lower molecular weight compared to THF insoluble fraction. Therefore, it can be concluded that EtOH is less efficient for end-capping and the solid is a combination of highly cross-linked carbonaceous char phase and H-LS that has undergone little or no conversion (THF soluble), whereas EG, as a better end-capping agent, gives a solid that is a mixture of mid-size depolymerized/repolymerized products. However, it was observed that the content of THF insoluble phase from reaction of H-LS in EG increased from 6 wt.% in non-catalytic condition to 23 wt.% in the presence of a catalyst (see Table 3). The GC analysis of the liquid fractions indicated that the relative areas of DEG, TEG, and TTEG compared to EG increased in the presence of catalyst, which indicated that self-reaction of EG was probably catalyzed over Ni/SiO2. The lower –OH density of these compounds compared to EG may have inhibited the end-capping and be the reason for the higher THF insoluble fractions in the catalytic condition. Mu et al. [32] investigated the dissolution of alkali lignin in EG and polyethylene glycol (PEG) at 140 °C. While lignin was fully soluble in EG, only 5 wt.% lignin-PEG solution was reported due to low density of hydroxyl groups [32], which is consistent with our result and the higher yield of THF insoluble fraction in the catalytic test in EG.
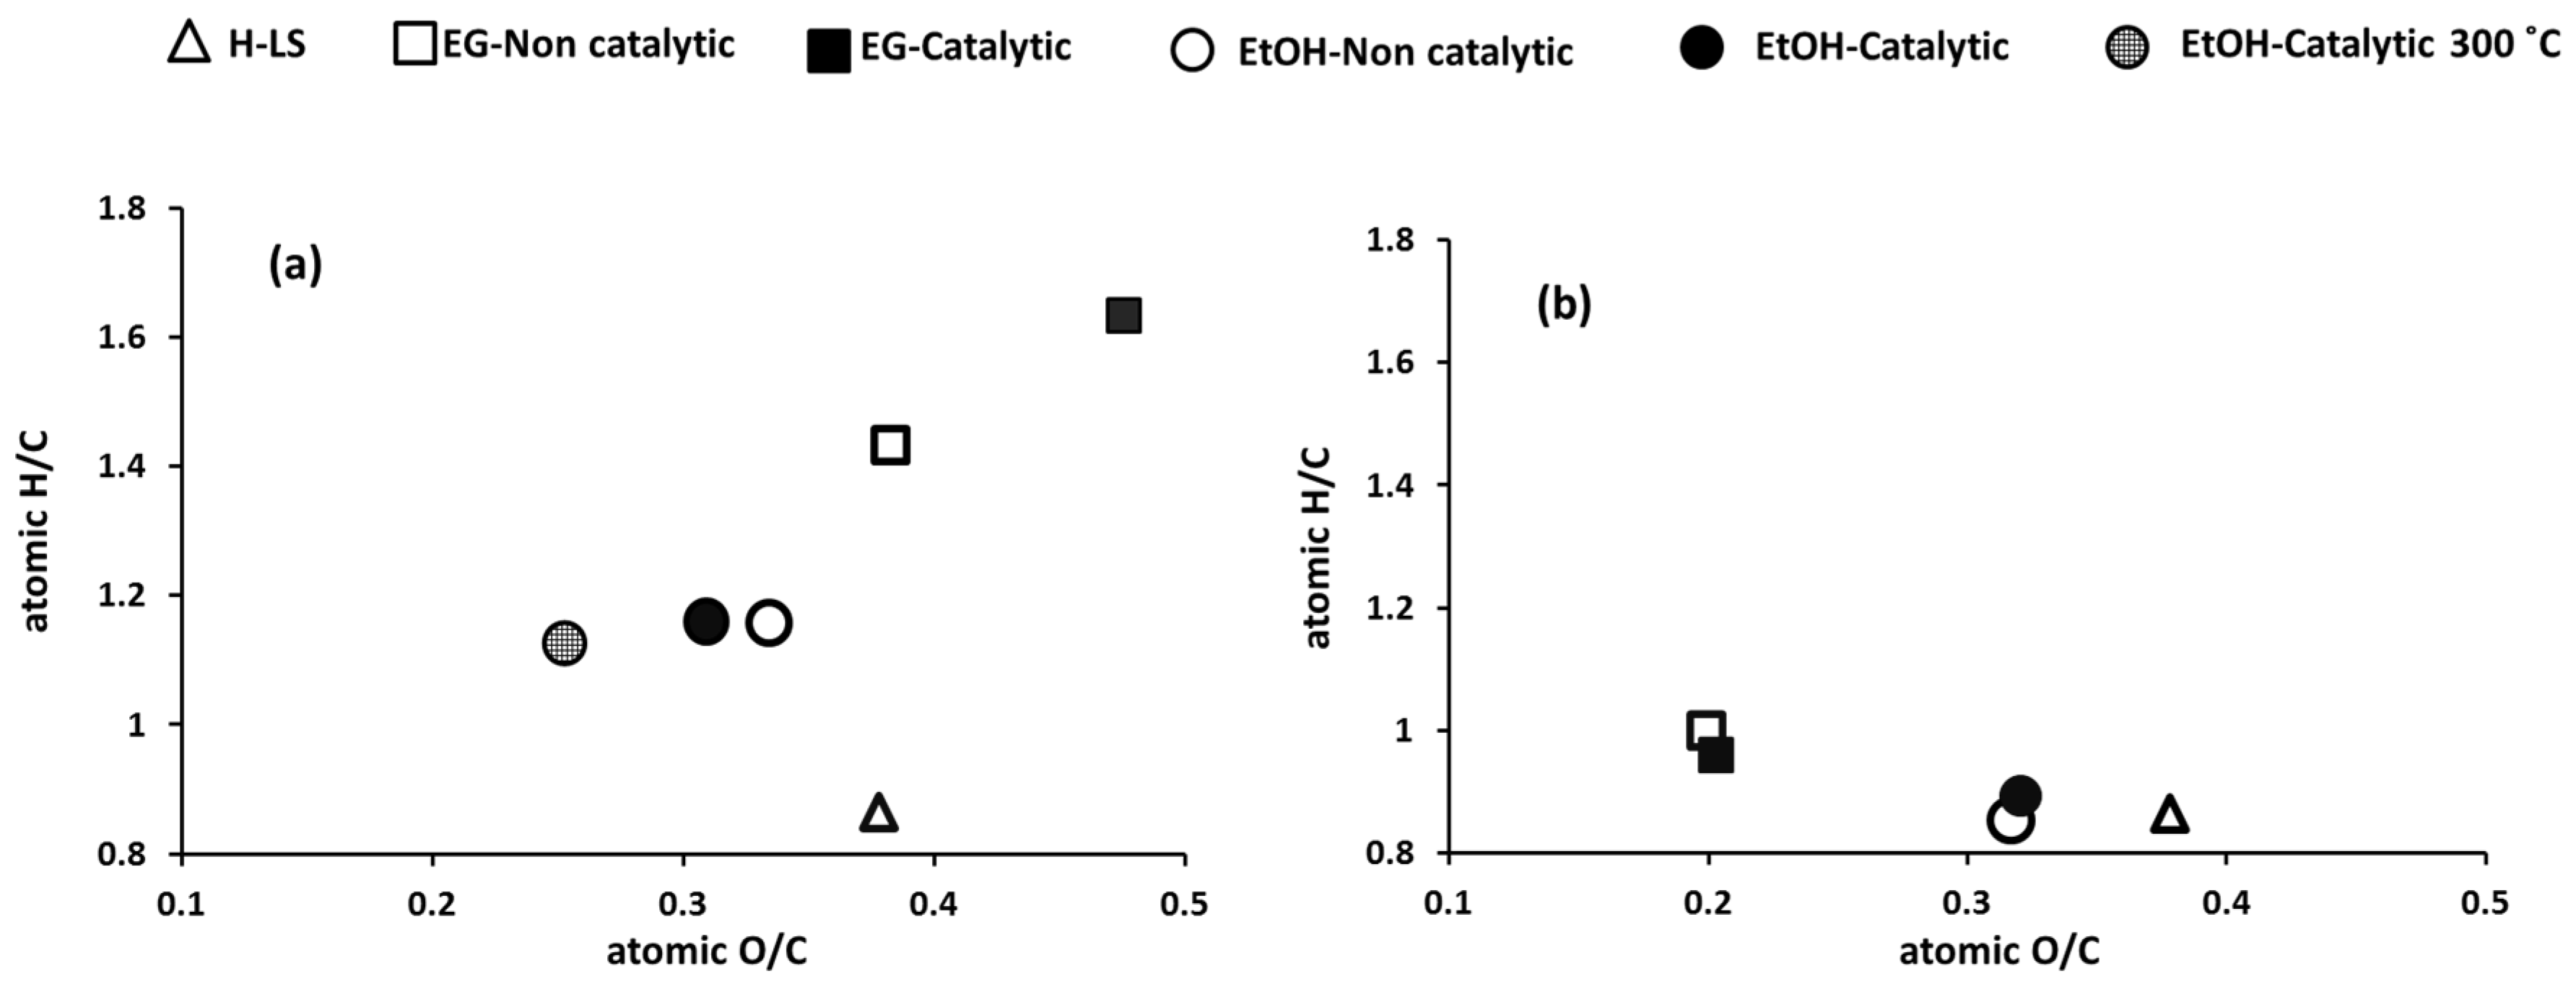
The elemental composition of the oil and solid phases were determined and plotted in Van Krevelen diagrams. The H/C and O/C ratios for H-LS, the oil, and solid fractions are shown in Figure 5. Deoxygenation and hydrogenation was clearly observed in the oil fractions in an EtOH medium (Figure 5a). The O/C ratio in the oil from the catalytic test at 300 °C was lower compared to the oil obtained at 250 °C, indicating increased deoxygenation at higher temperatures. Also note that the oil yield at 300 °C was significantly higher (47 wt.%) than at 250 °C (31 wt.%), see Table 3. The oil fractions from EG tests were a mixture of liquefied lignin derivatives incorporated into EG, and also DEG, TEG, TTEG, and other products from self-reaction of EG. Therefore, the presented O/C and H/C atomic ratios for these fractions are representing the whole mixture as a potential product from conversion of H-LS in this solvent and not exclusively the liquefied lignin fraction, and the fact that H/C and O/C ratios are higher in the oil from conversion of H-LS in EG than in the original H-LS reflects this solvent conversion and incorporation. Using the Dulong formula [29], the higher heating value (HHV) of H-LS was determined as 21.4 MJ/kg. This number increased in the oil fractions from conversion of H-LS in non-catalytic and catalytic conditions in EtOH medium to 25.6 and 26.6 MJ/kg, respectively. The liquid fractions from conversion of H-LS in EG (which contains EG and products from its self-reaction) in non-catalytic and catalytic condition had HHVs of 25.3 and 23.4 MJ/kg, respectively. The Van Krevelen diagram of the solid phases (Figure 5b) confirmed the decrease in O/C content in solid residues from both solvents, which was more pronounced in the solid residue from EG. The H/C content in the solid fractions from EG medium slightly increased compared to H-LS which may be due to incorporation of EG self-reaction products to large fractions.
A strong odor of sulfur in the light and oil fractions was indicative of the presence of sulfur. The ICP analysis detected 0.38 and 0.73 wt.% sulfur in the oil from catalytic conversion of H-LS in EtOH and the liquid products from EG test (apparent oil), respectively, which were lower compared to H-LS, with a sulfur content of 3.1 wt.%. This indicates that although desulfurization took place in the reactions, the oil fractions should be further desulfurized to become a viable fuel. The considerably higher sulfur content in the oil from EG test might be because of the reaction of EG with reactive intermediate, stabilizing them, and inhibiting further cleavage of C-S bonds.
The presented results clearly indicate differences in the performance of EG and EtOH as solvents for conversion of H-LS. There are advantages and disadvantages associated with each solvent. Feasibility studies can further clarify superiority of either of solvents for conversion of lignosulfonate. The performances of the solvents are summarized as follows:
  • EtOH remained almost intact at the reaction conditions whereas EG was, to a significant extent, converted via self-reaction. Depending on the value of the liquefied products from EG conversion, the conversion of EG may be unfavorable. However, it should be noted that conversion of EG was acid-catalyzed by H+ from sulfonate group. It is possible that the stability of EG can be improved by utilizing non-acid forms of lignosulfonate such as Na-LS. In support of this, although at lower temperature than applied here, Schutyser et al. [31] stated that EG remained stable during conversion of birch sawdust over Pd/C catalyst at 200 °C.
  • The isolation of the oil from EtOH is simple and may be done by distillation. On the contrary, separation of reaction products in the EG medium is very challenging due to the high boiling point of EG and also partial solubility of EG in conventional solvents used for extraction of products.
  • EG is a better end-capping agent in preventing formation of highly cross-linked solid fractions compared to EtOH. The solid residues left from reaction in EG can possibly be recycled in a continuous process and degraded to lower molecular weight compounds, while degradation of the solid char residue from EtOH medium could require severe reaction conditions or different processes such as pyrolysis or gasification. The char residue can also be burned for the energy supply.
  • EtOH is in a supercritical condition at 250 °C. The operational pressure in EtOH tests rose up to 155 bar while the pressure in EG tests was up to 78 bar. Obviously, a lower pressure is favorable from industrial equipment design point of view. It is beneficial to optimize the process condition to lower process pressure by reduction of initial H2 pressure, reduction of EtOH to lignosulfonate ratio and operation at lower temperatures, though it may result in lower liquefied products yields.

2.3.2. Effect of the Catalyst Support on the Degradation of Lignosulfonate

The effect of the support material on the catalytic behavior of Ni-based catalysts was investigated by using Ni catalyst supported on SiO2, AC, ZrO2, and γ-Al2O3 (the specifications of the catalysts are presented in Table 2). The catalytic tests were conducted in EtOH medium due to easier workup procedure compared to EG. The oil and solid yields are presented in Table 5, Entries 1–4. The oil yields were almost similar, 31–34 wt.%, independent of the nature of support and associated acidity. The oil yield from conversion of H-LS over Ni/AC (assumed as inert support) was 34 wt.% which was almost similar to 33 wt.% oil yield over Ni/γ-Al2O3 catalyst (possessing acidity). The SEC analysis of the oil fractions from conversion of H-LS over Ni deposited on different support materials showed also similar molecular weight distribution (shown in supplementary materials, Figure S9). Moreover, similar results were observed from elemental analysis of the oil phases. Furthermore, using pure support as catalyst was evaluated using AC and SiO2 (Table 5, Entries 5 and 6), where oil yields were almost similar to the oil yield from non-catalytic condition (~15–18 wt.%, see Table 3 and Table 5). Herein, we conclude that despite the effect of the catalyst support on the particle size of Ni atoms (see Table 2), the catalyst carrier has no or little influence on the final oil and solid yields; however it may affect the rate of the catalytic degradation and conversion of lignosulfonate. Further studies of the conversion of lignosulfonate at shorter reaction times may illuminate the potential role of catalyst carrier on the rate of lignosulfonate degradation and stabilization of reactive intermediates.

2.3.3. Working State of the Ni-Based Catalyst

Sulfur is a known poison for Ni catalysts in many reactions [34], and sulfur poisoning may occur during conversion of the sulfur containing feedstock. XRD analysis of the solid residue (char and catalyst) from catalytic conversion of H-LS over Ni/SiO2 in EtOH confirmed the presence of NiS (shown in supplementary materials, Figure S10). The XRD pattern of the detected NiS peaks is in agreement with literature [35,36]. The NiS phase detected by XRD analysis of the spent catalyst is likely formed through Ni-assisted cleavage of C-S bonds in lignosulfonate and adsorption of sulfur on Ni active sites. The presence of sulfur in the spent Ni/SiO2 catalyst residues was also confirmed by ICP analysis. In order to observe whether sulfur deposition affects the activity of the catalyst, a batch of Ni/SiO2 catalyst was deliberately sulfided in the presence of dimethyl disulfide (DMDS); 0.75 g of catalyst was treated with 10 mL DMDS at 400 °C, overnight. The autoclave was initially loaded with 30 bar H2 (RT). The presence of NiS was confirmed by XRD analysis on the sulfided catalyst. This catalyst was tested for conversion of H-LS at standard conditions without any further reduction (Table 5, Entry 7). Surprisingly, an oil yield of 33 wt.% was observed which was almost similar to the oil from the fresh Ni/SiO2 catalyst. This observation indicated that either catalytic activity is not affected by presence of sulfur and formation of NiS, or NiS is continuously regenerated to Ni during the reaction. Narani et al. [37] also reported activity of a sulfided Ni/AC catalyst for reductive conversion of Kraft lignin, where 70 wt.% methanol soluble oil was obtained at 320 °C. Song et al. [13] argued that Ni metal is active for hydrogenolysis of ether bonds and proposed that during the conversion of Na-LS, NiS phases were regenerated to catalytically active Ni sites in the reductive medium by desorption of sulfur in the form of H2S [13]. We treated the intentionally sulfided Ni/SiO2 catalyst in a blank test (without lignin) in EtOH at 250 °C and 50 bar H2 (RT) to see whether NiS can reductively react to the metallic Ni. The ICP analysis confirmed presence of sulfur in the catalyst after reductive EtOH treatment with S/Ni molar ratio of 0.71. It is not possible to make conclusions about the surface state of the catalyst on the basis of ICP, but the results indicate that the catalyst is a partly reduced or substoichiometric sulfide under reaction conditions. Understanding the exact mechanism of the catalytic activity is complex. Based on our observations and the results from Song et al. [13], we suggest that the partially non-sulfided Ni is able to exert some catalytic effect including hydrogenation of reactive radicals and a sulfur removal cycle may simultaneously take place where the adsorbed S desorbs in form of compounds such as H2S [13] followed by formation of a new NiS from cleavage of C-S bond.

2.3.4. Catalyst Reusability

The reusability of spent Ni/SiO2 catalyst was tested in EtOH. It was not possible to separate the catalyst from the solid residue from the former experiment and therefore the whole solid fraction (char + catalyst) from a previous experiment (the residue from Entry 2, Table 3) was used as catalyst assuming that the lignin derived solid residue would not further react or catalyze the reaction. The solid fraction was treated with H2 prior to use, in a way similar to the catalyst reduction step. An oil yield of 30 wt.% was observed (Table 5, Entry 8), which is similar to the 31 wt.% oil yield over the fresh Ni/SiO2. The SEC analysis of the oil fraction from catalytic reuse test was also consistent with the molecular weight distribution of the oil obtained with fresh catalyst (shown in supplementary materials, Figure S11), which confirms the catalyst reusability for at least one time.

3. Materials and Methods

3.1. Feedstock and Chemicals

The solvents used were EtOH (99.9%) and EG (99.8%) from Sigma-Aldrich (St. Louis, MO, USA). Other chemicals including the gases for GC analysis were of analytical grade. Spruce-based Na-LS was provided by Borregaard A/S (Sarpsborg, Norway). The Na+ is the counter ion of the sulfonate groups in the Na-LS. It was previously shown by Mortensen et al. [35] that potassium decreases the hydrodeoxygenation (HDO) activity of Ni/ZrO2 catalyst for HDO of guaiacol in 1-octanol at 250 °C. Similar behavior is expected from sodium ions. In order to avoid any potential interactions of sodium with Ni, the lignin was ion-exchanged to the sulfonic acid form lignosulfonate (H-LS). The ion-exchange was performed using Amberlite 120 H resin (Sigma-Aldrich, St. Louis, MO, USA), according to a method by Fredheim et al. [7]. In the ion-exchange procedure, 100 g Na-LS was dissolved in 1600 mL deionized water containing 68.2 g resin. The solution was stirred for 2 h at room temperature (RT). After 2 h, the lignosulfonate solution and the resin were separated by decanting. The ion-exchange process was repeated using fresh resin until the pH of the solution decreased to 1.4 [7]. Thereafter, the H-LS was retrieved by evaporation of water from the lignosulfonate solution in an oven at 50 °C, overnight.

3.2. Catalyst

The 5.0 wt.% Ni/SiO2, Ni/AC, Ni/ZrO2, and Ni/γ–Al2O3 catalysts were prepared by incipient wetness impregnation using nickel nitrate hexahydrate (Ni(NO3)2·6H2O) (Sigma-Aldrich, St. Louis, MO, USA) as precursor. The supports were SiO2 (Saint-Gobain Norpro, Courbevoie, France; 250 m2/g), AC (Sigma-Aldrich, St. Louis, MO, USA; 600 m2/g), tetragonal ZrO2 (Saint-Gobain, Courbevoie, France; trace monoclinic, 146 m2/g), and γ-Al2O3 (Saint-Gobain, Courbevoie, France; 254.7 m2/g). All catalysts were crushed and sieved to 150–300 µm and reduced before use. The Ni/SiO2 catalyst was reduced for 2 h in a 0.3 L 4566 Parr autoclave at 1 atm., 350 °C with H2 flow of 1 NL/min. A quantity of 1 g of Ni/AC, Ni/ZrO2 and Ni/γ–Al2O3 catalysts were reduced ex situ using a Quantachrome iQ2 apparatus (Quantachrome, Boynton Beach, FL, USA) with H2 flow for 2 h at 600 °C, followed by passivation in 1% O2 and 99% N2 at RT. The passivated catalysts were reactivated prior to use in the batch autoclave with a H2 flow of 1 NL/min for 2 h at 400 °C.

3.3. Depolymerization Reactions and Workup Procedure

In a typical run, 7.5 g H-LS, 0 (non-catalytic) or 0.75 g catalyst and 75 mL solvent were transferred into a 0.3 L 4566 Parr reactor (Parr Instrument Company, Moline, IL, USA). The reactor was sealed and flushed with N2 for three times. Subsequently, the reactor was flushed with H2 for at least three times and then pressurized to 50 bar H2 at RT. The reactor was heated to 250 °C while stirring (approximate stirring rate of 550 RPM) to avoid the lignin pyrolysis while resting at the bottom of the reactor which lead to poor liquid yields and a char that is difficult to remove. Once the reaction temperature was reached, the reaction time of 3 h was started. At the end of the experiment, the reaction was stopped by quenching the reactor in an ice bath. As soon as the temperature inside the reactor reached ambient temperature, gas samples were collected using Tedlar gas bags (Sigma-Aldrich, St. Louis, MO, USA). Before opening the reactor, the gas phase was discharged and the reactor was flushed with N2.
The solid and liquid products of the reaction were separated by vacuum filtration. The filter cake was washed with 100 mL EtOH to ensure removal of the light products. The filtrate and the EtOH used for rinsing the cake were combined and the solid phase was dried at 60 °C, overnight. Hereafter, two different methods were applied for liquid products isolation. With EtOH as solvent, the heavy and light fractions in the liquid phase were separated using a rotary evaporator at 35 °C, a pressure of 5 mbar and a rotation rate of 130 RPM. The EtOH and light products were evaporated (light fraction), and a thick liquid phase remained as residue (oil). An extensive product extraction procedure was applied in the experiments with EG, since evaporation of EG was not practical due to its high boiling point (197.3 °C). The liquid product fraction from the reactor was diluted with 150 mL ethyl acetate (Sigma-Aldrich, St. Louis, MO, USA, 99.7%) in a separation funnel followed by addition of 75 mL water. The funnel was then shaken vigorously. The aqueous and the organic phases were separated; the water phase in the bottom layer and the organic phase on the top. It was expected that unreacted EG and the EtOH used for washing were transferred to the aqueous phase while the liquefied organic compounds were in the ethyl acetate phase. Extraction was repeated three times to ensure complete separation of the products. Subsequently, the lignin degradation products were isolated from ethyl acetate using rotary evaporation. The yield of the oil fraction was calculated based on the dry and ash free (DAF) H-LS (Equation (1)).
Oil   yield = m O i l m D A F   H L S · 100 .
The selectivity of the monomers in the oil fractions and the monomer yields were determined by Equations (2) and (3), respectively.
Selectivity   to   monomers = m M o n o m e r   d e t e r m i n e d   b y   G C F I D m O i l   f r a c t i o n · 100 ,
Monomer   yield = m M o n o m e r   d e t e r m i n e d   b y   G C F I D m D A F   H L S · 100 .
The organic solid mass remaining after the reaction was calculated by subtracting the mass of ash and loaded catalyst from the total solid mass obtained from filtration. The solid yields were calculated using Equation (4).
Solid   yield = m S o l i d   r e s i d u e m A s h m C a t a l y s t m D A F   H L S · 100 .
The solid phase obtained from each test was fractionized by dissolution in THF (Sigma-Aldrich, St. Louis, MO, USA, 99.9%). The solid phase was dispersed in 100 mL THF followed by stirring for 30 min at RT. Subsequently, the solution was filtered using vacuum filtration. The ‘THF insoluble’ solid, collected on filter paper, was dried at 60 °C, overnight. The filtrate phase ‘THF soluble’ solid was recovered by evaporation of the THF. Considering that catalyst and ash were insoluble in THF, the yield of each fraction was calculated using Equations (5) and (6), respectively.
THF   insoluble   solid   yield = m T H F   i n s o l u b l e   s o l i d m A s h m C a t a l y s t m D A F   H L S · 100 ,
THF   soluble   solid   yield = m T H F   s o l u b l e   s o l i d m D A F   H L S · 100 .

3.4. Characterization and Analytical Techniques

3.4.1. Catalyst Characterization

TPR analysis was performed in order to investigate the reducibility of Ni(NO3)2 species using a Quantachrome iQ2 apparatus. The consumption of H2 was measured using a Hiden QGA mass spectrometer (Warrington, UK). The catalyst was flushed with 40 NmL/min of helium (He) for 25 min followed by heating from RT to 350 °C (Ni supported on SiO2) or 600 °C (Ni supported on AC, γ-Al2O3 and ZrO2) at a rate of 2 °C/min with H2 flow of 40 NmL/min and then maintaining this temperature for 4 h. The consumption of H2 is indicative of catalyst reduction and the end of H2 consumption is taken as evidence of complete reduction.
Catalyst metal dispersion was measured by CO chemisorption. The metal dispersion represents the percentage of the available surface metal atoms (NS) to the total number of metal atoms (NT) [38]. Similar to TPR, a Quantachrome iQ2 apparatus was used and CO was measured by thermal conductivity detector (TCD). Prior to chemisorption, the catalyst was completely reduced at the required temperature for 2 h, followed by cooling to 30 °C in 40 NmL/min He flow. The titration was conducted at 30 °C by pulse injection of 279 µl CO into the He flow and measuring the CO uptake. The results were used to calculate the Ni particle size.
The acidity of NiO/SiO2, NiO/ZrO2, and NiO/γ-Al2O3 was determined by NH3-TPD using a Micromeritics Autochem-II instrument (Norcross, GA, USA). An amount of 0.1 g of each sample was heated to 500 °C in 25 NmL/min He flow and then cooled to 100 °C. Thereafter, the samples were saturated with 50 NmL/min NH3 flow for 2 h. TPD was then conducted by heating the sample to 500 °C at a heating rate of 10 °C/min in He flow of 25 NmL/min. A TCD was used for measuring the desorbed NH3 with the acidity equated to the desorbed amount of NH3 [38]. Ammonia released at temperatures lower than 200 °C is considered as weak acid sites, whereas ammonia released at temperatures higher than 200 °C is considered as strong acid sites.
The XRD of fresh and spent catalysts was recorded ex situ with a Huber G670 powder diffractometer (Huber Diffraktionstechnik GmbH & Co. KG, Rimsting, Germany) using Cu (Kα1) radiation. Measurements were performed in the range of 3 to 100 degrees with a step size of 0.005 and total measurement duration of 60 min. The software used for crystal identification was Crystallographica Search-Match (by Oxford Cryosystems Ltd., Oxford, UK) with the ICDD PDF4 powder diffraction database (Newtown Square, PA, USA).
ICP-OES (Optima 3000, Perkin Elmer, Waltham, MA, USA) was used for quantification of the sulfur in NiS catalyst; the sample was melted together with potassium pyrosulfate (Sigma-Aldrich, St. Louis, MO, USA, 99%), dissolved in a solution of water and HCl (Sigma-Aldrich, St. Louis, MO, USA) and analyzed with optical emission spectroscopy.

3.4.2. Analysis of Feedstock and Depolymerization Products

SEC was performed using an Agilent 1100 series HPLC (Santa Clara, CA, USA) equipped with an UV-Vis detector and Polymer Standard Service Company (Mainz, Germany) Polarsil precolumn (50 × 8 mm, 5 µm) and main column (300 × 8 mm, 5 µm). A 90/10 wt.% dimethyl sulfoxide (Sigma-Aldrich, St. Louis, MO, USA, ≥99.9%) (DMSO)/water solution containing 0.05 M LiBr (Sigma-Aldrich, St. Louis, MO, USA, ≥99%) was used as solvent. The samples were dissolved in the solvent with a concentration of approximately 2 mg/mL. The column oven temperature was set to 80 °C to facilitate the elution of solvent. Ten microliters of sample was injected for each analysis and the elution flow rate was set to 1 mL/min. Phenol (Mw: 94 g/mol), guaiacylglycerol-beta-guaiacyl ether (GGGE) (Mw: 320 g/mol) and tannic acid (Mw: 1701 g/mol) were purchased from Sigma-Aldrich (St. Louis, MO, USA) and used as representative standards for lignin monomers, dimers and polymers. It was expected that lignin derived fractions were detected by the UV-Vis detector, at 280 nm, which is the wavelength suitable for detection of aromatic species.
The liquid products of the reactions were analyzed using a Shimadzu QP 2010 Ultra GC-MS-FID apparatus (Kyoto, Japan) equipped with a Supelco Equity 5 column (Sigma-Aldrich, St. Louis, MO, USA). Identification and quantification of the samples was performed by MS and FID, respectively. A weighed amount of oil samples were diluted in 10 mL ethanol for analysis. The initial temperature for the GC column was set to 40 °C and the column was heated to 250 °C at a heating rate of 10 °C/min and kept at this temperature for 5 min. A split ratio of 90 was used in the injection section. The MS scanning was set to a range of 30 to 400 m/z. The MS was intentionally turned off between 2.5 to 4 min in order to avoid saturation by high concentrations of EtOH. Product identification was performed using the NIST 08 library. The ‘relative response factor’ (RRF) method [39] was used for quantification of the compounds in the oil; Phenol was used as standard and the RRF of guaiacol, 4-methyl guaiacol, 4-ethyl guaiacol, and 4-propyl guaiacol was obtained using commercial samples (according to Equation (7)). Cst and Ast are the concentration and the area of standard and Ci and Ai are the concentration and the area of the compound i. The RRF of the compounds such as ethyl vanillate was determined using the ‘effective carbon number’ (ECN) method [40].
RRF i = A s t A i · C i C s t ,
An Agilent 7890A gas chromatograph (Santa Clara, CA, USA) equipped with TCD detector was used for identification and quantification of gaseous products. After each experiment, the gas phase was collected in a Tedlar bag for GC analysis. The gas injection was achieved using a fixed pressure pump. The gas flow was further split into two lines using He and argon (Ar) as carrier gases, respectively. H2 was analyzed with an arrangement of 6 ft Haysep Q and molecular sieve 5Å columns, where Ar was the carrier gas. The gases N2, O2, CO, CO2, CH4, C2H4, C2H6, C3H6, C3H8, and n-C4H10 were detected in a line with He as carrier gas in a 3 ft Haysep Q, HP-Plot and molecular sieve 5Å columns; the calibration curves were created using gases of analytical grade, supplied from certified gas cylinders from AGA (Copenhagen, Denmark).
The content of organic carbon (C), H, S, and N in H-LS, oil, and char fractions were analyzed using a EuroVector EA3000 CHNS analyzer (Eurovector, Pavia, Italy). The measurement is based on the combustion of approximately 1 mg encapsulated samples at 980 °C and quantification of produced CO2, H2O, N2, and SO2 gases by GC-TCD. The oxygen content was calculated by setting up a mass balance for each sample, assuming the mass not accounted for as C, H, N, S, and ash is oxygen. The ash content in H-LS and solid fractions was measured using a muffle oven at 600 °C.
ICP-OES was used for quantification of the sulfur content in the oil products of the reactions. The oil samples were prepared by dilution of a weighed amount of oil samples in EtOH.

4. Conclusions

The liquefaction of lignosulfonate in its acid form (H-LS) in ethanol (EtOH) and ethylene glycol (EG) media was investigated in the absence and presence of a Ni/SiO2 catalyst, and the solid and liquid products were analyzed in detail. The yields of the liquefied fractions were almost similar in the two solvents (31 wt.% in EtOH and 32 wt.% in EG) and analysis by SEC indicated that the products in the oil fractions were mainly dimers and oligomers. The oil from conversion of H-LS in EtOH medium showed formation of lower molecular weight compounds compared to the oil from conversion in EG medium. On the other hand, char formation was to a greater extent inhibited in EG medium by end-capping reaction and suppression of repolymerization of reactive compounds. Regarding the solvent reusability, EtOH was relatively stable at the reaction conditions whereas EG was significantly converted to DEG, TEG and TTEG, possibly catalyzed by H+ from the SO3H groups in the lignosulfonate structure. No influence of support was observed in the liquefaction of H-LS when testing Ni supported on AC, SiO2, ZrO2, and γ -Al2O3. The formation of a NiS phase in the spent catalyst from conversion of H-LS in EtOH medium was confirmed by XRD and ICP analysis. However, catalytic activity was observed despite formation of NiS. Overall, the results show that lignosulfonate can be catalytically converted to a liquid hydrocarbon and a solid char phase. The liquid may be used as a fuel after further processing in a refinery.

Supplementary Materials

The following are available online at https://www.mdpi.com/2073-4344/8/11/502/s1, Figure S1: CO titration of Ni/γ-Al2O3 catalyst; Figure S2: NH3-TPD profile of NiO/SiO2 catalyst; Figure S3: NH3-TPD profile of NiO/ZrO2 catalyst; Figure S4: NH3-TPD profile of NiO/Al2O3 catalyst; Figure S5: Physical appearances of the solid fractions from reaction of H-LS. (a) non-catalytic conversion and (b) catalytic conversion over Ni/SiO2 catalyst. Reaction condition: 0/0.75 g catalyst, 7.5 g H-LS, 75 mL solvent, initial H2 loading of 50 bar at RT, reaction temperature of 250 °C, 3 h reaction time; Figure S6: GC-MS analysis of the oil fraction from conversion of H-LS over Ni/SiO2 catalyst in ethanol medium. Reaction condition: 0.75 g catalyst, 7.5 g H-LS, 75 mL solvent, initial H2 loading of 50 bar at RT, reaction temperature of 250 °C, 3 h reaction time; Figure S7: GC-MS analysis of the oil fraction from conversion of H-LS over Ni/SiO2 catalyst in ethylene glycol medium. Reaction condition: 0.75 g catalyst, 7.5 g H-LS, 75 mL solvent, initial H2 loading of 50 bar at RT, reaction temperature of 250 °C, 3 h reaction time; Figure S8: The main identified compounds in the oil fractions by GC-MS analysis: (1) Guaiacol, (2) Methyl guaiacol, (3) Ethyl guaiacol, (4) Propyl guaiacol, (5) Ethyl vanillate, (6) Ethyl homovanillate; Figure S9: SEC of H-LS and the catalytic oils produced from conversion of H-LS in EtOH over Ni supported on SiO2, AC, ZrO2 and γ-Al2O3. Reaction condition: 0.75 g catalyst, 7.5 g H-LS, 75 mL solvent, initial H2 loading of 50 bar at RT, reaction temperature of 250 °C, 3 h reaction time; Figure S10: XRD pattern of the solid residue from conversion of H-LS over Ni/SiO2 catalyst. The peaks for NiS are specified. Reaction condition: 0.75 g catalyst, 7.5 g lignin, 75 mL solvent, initial H2 loading of 50 bar at RT, reaction temperature of 250 °C, 3 h reaction time; Figure S11: SEC of H-LS and catalytic oil products from conversion of H-LS in EtOH over fresh and reused Ni/SiO2 catalyst. Reaction condition: 0.75 g catalyst, 7.5 g H-LS, 75 mL solvent, initial H2 loading of 50 bar at RT, reaction temperature of 250 °C, 3 h reaction time.

Author Contributions

Conceptualization, S.G.P., J.M.C., and A.D.J.; Methodology, S.G.P., J.M.C., and A.D.J.; Formal Analysis, S.G.P., J.M.C., and L.S.P.; Investigation, S.G.P.; Resources, A.D.J., L.S.P., and F.T.; Data Curation, S.G.P.; Writing-Original Draft Preparation, S.G.P.; Writing-Review & Editing, J.M.C., A.D.J., L.S.P., and F.T.; Visualization, S.G.P.; Supervision, J.M.C., A.D.J., and L.S.P.; Funding Acquisition, A.D.J.

Funding

This research was funded by Bio-Value SPIR, A Strategic Platform for Innovation and Research on Value-added Products from Biomass, which is cofounded by The Innovation Fund Denmark, Grant number: 0603-00522B.

Acknowledgments

We would like to thank Leonhard Schill for conducting ammonia desorption analysis. Haldor Topsøe A/S is acknowledged for providing facility for the SEC analysis and conducting ICP. Borregaard A/S and Saint-Gobain are acknowledged for supplying the lignosulfonate and catalyst supports, respectively.

Conflicts of Interest

The authors declare no conflicts of interest.

References

  1. Calvo-Flores, F.G.; Dobado, J.A. Lignin as Renewable Raw Material. ChemSusChem 2010, 3, 1227–1235. [Google Scholar] [CrossRef] [PubMed]
  2. Reknes, K. The Chemistry of Lignosulfonate and the Effect on Performance of Lignosulfonate Base Plasticizers and Superplasticizers. In Proceedings of the 29th OUR World in Concrete and Structures (OWICs), Singapore, 25–26 August 2004. [Google Scholar]
  3. Lora, J. Industrial Commercial Lignins: Sources, Properties and Applications. In Monomers, Polymers and Composites from Renewable Resources, 1st ed.; Belgacem, M.N., Gandini, A., Eds.; Elsevier: Amsterdam, The Netherlands, 2008; pp. 225–241. ISBN 978-0-08-045316-3. [Google Scholar]
  4. Ma, R.; Hao, W.; Ma, X.; Tian, Y.; Li, Y. Catalytic ethanolysis of kraft lignin into high-value small-molecular chemicals over a nanostructured α-molybdenum carbide catalyst. Angew. Chem. 2014, 126, 7438–7443. [Google Scholar] [CrossRef]
  5. Huang, X.; Korányi, T.I.; Boot, M.D.; Hensen, E.J.M. Catalytic Depolymerization of Lignin in Supercritical Ethanol. ChemSusChem 2014, 7, 2276–2288. [Google Scholar] [CrossRef] [PubMed]
  6. Wang, X.; Rinaldi, R. Corrigendum: Solvent effects on the hydrogenolysis of diphenyl ether with raney nickel and their implications for the conversion of lignin. ChemSusChem 2012, 5, 1455–1466. [Google Scholar] [CrossRef] [PubMed]
  7. Fredheim, G.E.; Braaten, S.M.; Christensen, B.E. Molecular weight determination of lignosulfonates by size-exclusion chromatography and multi-angle laser light scattering. J. Chromatogr. Coruña 2002, 942, 191–199. [Google Scholar] [CrossRef]
  8. Li, S.; Li, N.; Li, G.; Li, L.; Wang, A.; Cong, Y.; Wang, X.; Zhang, T. Lignosulfonate-based acidic resin for the synthesis of renewable diesel and jet fuel range alkanes with 2-methylfuran and furfural. Green Chem. 2015, 17, 3644–3652. [Google Scholar] [CrossRef]
  9. Megiatto, J.D.; Cerrutti, B.M.; Frollini, E. Sodium lignosulfonate as a renewable stabilizing agent for aqueous alumina suspensions. Int. J. Biol. Macromol. 2016, 82, 927–932. [Google Scholar] [CrossRef] [PubMed]
  10. Kilanowski, B. Ligninsulfonat. Available online: https://de.wikipedia.org/wiki/Ligninsulfonat (accessed on 25 September 2018).
  11. Product Functionalities. Available online: https://www.lignotech.com/Product-Functionalities (accessed on 25 September 2018).
  12. Vishtal, A.G.; Kraslawski, A. Challenges in Industrial Applications of Technical Lignins. BioResources 2011, 6, 3547–3568. [Google Scholar]
  13. Song, Q.; Wang, F.; Xu, J. Hydrogenolysis of lignosulfonate into phenols over heterogeneous nickel catalysts. Chem. Commun. 2012, 48, 7019–7021. [Google Scholar] [CrossRef] [PubMed]
  14. Horáček, J.; Mikkola, J.-P.; Samikannu, A.; Št’ávová, G.; Larsson, W.; Hora, L.; Kubička, D. Studies on Sodium Lignosulfonate Depolymerization over Al2O3 Supported Catalysts Loaded with Metals and Metal Oxides in a Continuous Flow Reactor. Top. Catal. 2013, 56, 794–799. [Google Scholar] [CrossRef]
  15. Shu, R.; Xu, Y.; Ma, L.; Zhang, Q.; Wang, T.; Chen, P.; Wu, Q. Hydrogenolysis process for lignosulfonate depolymerization using synergistic catalysts of noble metal and metal chloride. RSC Adv. 2016, 6, 88788–88796. [Google Scholar] [CrossRef]
  16. Bartholomew, C.H. Mechanisms of catalyst deactivation. Appl. Catal. A Gen. 2001, 212, 17–60. [Google Scholar] [CrossRef]
  17. Sun, J.; Dutta, T.; Parthasarathi, R.; Ho Kim, K.H.; Tolic, N.; Chu, R.K.; Isern, N.G.; Cort, J.R.; Simmons, B.A.; Singh, S. Rapid room temperature solubilization and depolymerization of polymeric lignin at high loadings. Green Chem. 2016, 18, 6012–6020. [Google Scholar] [CrossRef]
  18. Lahive, C.W.; Deuss, P.J.; Lancefield, C.S.; Sun, Z.; Cordes, D.B.; Young, C.M.; Tran, F.; Slawin, A.M.Z.; de Vries, J.G.; Kamer, P.C.J.; et al. Advanced Model Compounds for Understanding Acid-Catalyzed Lignin Depolymerization: Identification of Renewable Aromatics and a Lignin-Derived Solvent. J. Am. Chem. Soc. 2016, 138, 8900–8911. [Google Scholar] [CrossRef] [PubMed]
  19. Huang, X.; Korányi, T.I.; Boot, M.D.; Hensen, E.J.M. Ethanol as capping agent and formaldehyde scavenger for efficient depolymerization of lignin to aromatics. Green Chem. 2015, 17, 4941–4950. [Google Scholar] [CrossRef] [Green Version]
  20. Rane, S.S.; Choi, P. Polydispersity Index: How Accurately Does It Measure the Breadth of the Molecular Weight Distribution? Chem. Mater. 2005, 17, 926. [Google Scholar] [CrossRef]
  21. Van den Bosch, S.; Renders, T.; Kennis, S.; Koelewijn, S.-F.; Van den Bossche, G.; Vangeel, T.; Deneyer, A.; Depuydt, D.; Courtin, C.M.; Thevelein, J.M.; et al. Integrating lignin valorization and bio-ethanol production: on the role of Ni-Al2O3 catalyst pellets during lignin-first fractionation. Green Chem. 2017, 19, 3313–3326. [Google Scholar] [CrossRef]
  22. Cheng, S.; Wilks, C.; Yuan, Z.; Leitch, M.; Xu, C.C. Hydrothermal degradation of alkali lignin to bio-phenolic compounds in sub/supercritical ethanol and water-ethanol co-solvent. Polym. Degrad. Stab. 2012, 97, 839–848. [Google Scholar] [CrossRef]
  23. Li, M.-F.; Sun, S.-N.; Xu, F.; Sun, R.-C. Organosolv fractionation of lignocelluloses for fuels, chemicals and materials: A biorefinery processing perspective. In Biomass Conversion—The Interface of Biotechnology, Chemistry and Materials Science, 1st ed.; Baskar, C., Baskar, S., Dhillon, R.S., Eds.; Springer: Berlin/Heidelberg, Germany, 2012; pp. 341–379. ISBN 978-3-642-28417-5. [Google Scholar]
  24. Myrvold, B.O. Differences in solubility parameters and susceptibility to salting-out between softwood and hardwood lignosulfonates. Holzforschung 2016, 70. [Google Scholar] [CrossRef]
  25. Singh, R.; Prakash, A.; Dhiman, S.K.; Balagurumurthy, B.; Arora, A.K.; Puri, S.K.; Bhaskar, T. Hydrothermal conversion of lignin to substituted phenols and aromatic ethers. Bioresour. Technol. 2014, 165, 319–322. [Google Scholar] [CrossRef] [PubMed]
  26. Tian, Q.; Li, N.; Liu, J.; Wang, M.; Deng, J.; Zhou, J.; Ma, Q. Catalytic hydrogenation of alkali lignin to bio-oil using fullerene-like vanadium sulfide. Energy Fuels 2015, 29, 255–261. [Google Scholar] [CrossRef]
  27. Caetano, C.S.; Guerreiro, L.; Fonseca, I.M.; Ramos, A.M.; Vital, J.; Castanheiro, J.E. Esterification of fatty acids to biodiesel over polymers with sulfonic acid groups. Appl. Catal. A Gen. 2009, 359, 41–46. [Google Scholar] [CrossRef] [Green Version]
  28. Zhang, Q.; Xu, Y.; Li, Y.; Wang, T.; Zhang, Q.; Ma, L.; He, M.; Li, K. Investigation on the esterification by using supercritical ethanol for bio-oil upgrading. Appl. Energy 2015, 160, 633–640. [Google Scholar] [CrossRef]
  29. Zhang, T.; Zhou, Y.; Liu, D.; Petrus, L. Qualitative analysis of products formed during the acid catalyzed liquefaction of bagasse in ethylene glycol. Bioresour. Technol. 2007, 98, 1454–1459. [Google Scholar] [CrossRef] [PubMed]
  30. Moghaddam, L.; Zhang, Z.; Wellard, R.M.; Bartley, J.P.; O’Hara, I.M.; Doherty, W.O.S. Characterisation of lignins isolated from sugarcane bagasse pretreated with acidified ethylene glycol and ionic liquids. Biomass Bioenergy 2014, 70, 498–512. [Google Scholar] [CrossRef]
  31. Schutyser, W.; Van den Bosch, S.; Renders, T.; De Boe, T.; Koelewijn, S.-F.; Dewaele, A.; Ennaert, T.; Verkinderen, O.; Goderis, B.; Courtin, C.M.; et al. Influence of bio-based solvents on the catalytic reductive fractionation of birch wood. Green Chem. 2015, 17, 5035–5045. [Google Scholar] [CrossRef]
  32. Mu, L.; Shi, Y.; Wang, H.; Zhu, J. Lignin in ethylene glycol and poly (ethylene glycol): Fortified lubricants with internal hydrogen bonding. ACS Sustain. Chem. Eng. 2016, 4, 1840–1849. [Google Scholar] [CrossRef]
  33. Kubo, S.; Yamada, T.; Hashida, K.; Ono, H. Grafting of ethylene glycol chains in lignin during the solvolysis for biomass conversion using ethylene carbonate/ethylene glycol system. Chem. Lett. 2007, 36, 502–503. [Google Scholar] [CrossRef]
  34. Rostrup-Nielsen, J.R. Some principles relating to the regeneration of sulfur-poisoned nickel catalyst. J. Catal. 1971, 21, 171–178. [Google Scholar] [CrossRef]
  35. Mortensen, P.M.; Gardini, D.; de Carvalho, H.W.P.; Damsgaard, C.D.; Grunwaldt, J.-D.; Jensen, P.A.; Wagner, J.B.; Jensen, A.D. Stability and resistance of nickel catalysts for hydrodeoxygenation: carbon deposition and effects of sulfur, potassium, and chlorine in the feed. Catal. Sci. Technol. 2014, 4, 3672–3686. [Google Scholar] [CrossRef] [Green Version]
  36. Chen, Y.; Xie, C.; Li, Y.; Song, C.; Bolin, T.B. Sulfur poisoning mechanism of steam reforming catalysts: an X-ray absorption near edge structure (XANES) spectroscopic study. Phys. Chem. Chem. Phys. 2010, 12, 5707. [Google Scholar] [CrossRef] [PubMed]
  37. Narani, A.; Chowdari, R.K.; Cannilla, C.; Bonura, G.; Frusteri, F.; Heeres, H.J.; Barta, K. Efficient catalytic hydrotreatment of Kraft lignin to alkylphenolics using supported NiW and NiMo catalysts in supercritical methanol. Green Chem. 2015, 17, 5046–5057. [Google Scholar] [CrossRef] [Green Version]
  38. Webb, P. Introduction to Chemical Adsorption Analytical Techniques and Their Applications to Catalysis; Micromeritics Instrument Corp.: Norcross, GA, USA, 2003. [Google Scholar]
  39. Katritzky, A.R.; Ignatchenko, E.S.; Barcock, R.A.; Lobanov, V.S.; Karelson, M. Prediction of gas chromatographic retention times and response factors using a general qualitative structure-property relationships treatment. Anal. Chem. 1994, 66, 1799–1807. [Google Scholar] [CrossRef]
  40. Scanlon, J.T.; Willis, D.E. Calculation of flame ionization detector relative response factors using the effective carbon number concept. J. Chromatogr. Sci. 1985, 23, 333–340. [Google Scholar] [CrossRef]
Figure 1. A proposed structure for lignosulfonate. Sulfonate groups are present in the aliphatic side chains. Adapted with permission from [9], Elsevier, 2016.
Catalysts 08 00502 g001
Figure 2. Acid catalyzed self-reaction of EG to form DEG. After Moghaddam et al. [31].
Catalysts 08 00502 g002
Figure 3. SEC of H-LS and the non-catalytic and catalytic oil products from conversion of H-LS in EtOH and EG media. Reaction condition: 0/0.75 g Ni/SiO2 catalyst, 7.5 g H-LS, 75 mL solvent, initial H2 loading of 50 bar at RT, reaction temperature of 250 °C, 3 h reaction time.
Catalysts 08 00502 g003
Figure 4. SEC analysis of the solid phases from catalytic conversion of H-LS in EtOH and EG media. Reaction condition: 0.75 g Ni/SiO2 catalyst, 7.5 g H-LS, 75 mL solvent, initial H2 loading of 50 bar at RT, reaction temperature of 250 °C, 3 h reaction time.
Catalysts 08 00502 g004
Figure 5. Van Krevelen diagrams of (a) oil and (b) solid fractions from conversion of H-LS in EtOH and EG media. Reaction condition: 0/0.75 g catalyst, 7.5 g H-LS, 75 mL solvent, initial H2 loading of 50 bar at RT, reaction temperature of 250 °C (except for conversion of H-LS in EtOH at 300 °C), 3 h reaction time.
Catalysts 08 00502 g005
Table 1. Specifications of H-LS.
Molecular Weight g/molComposition wt.%Atomic Ratio
MwMnCHOSAshHumidityO/CH/C
H-LS9400190061.14.430.83.10.62.50.380.86
Table 2. The particle size and acidities of the 5.0 wt.% nickel based catalysts.
CatalystParticle Size [nm]NH3 Desorbed [µmol/gcat] WeakNH3 Desorbed [µmol/gcat] Strong
Ni/SiO27.555 (at 152 °C)-
Ni/AC14.8N.A. *N.A.
Ni/ZrO2N.A.-373 (at 225 °C)
Ni/γ-Al2O332.5602 (at 184 °C)-
* N.A.: Not available.
Table 3. Yields of the oil and solid fractions from conversion of H-LS over Ni/SiO2 catalyst. Reaction condition: 0/0.75 g catalyst, 7.5 g H-LS, 75 mL solvent, initial H2 loading of 50 bar at RT, reaction temperature of 250 °C, 3 h reaction time.
EtOH Medium
EntryCatalystOil Yield wt.%Solid Phase wt.%
THF InsolubleTHF SolubleTotal
1Non-catalytic16601070
2Ni/SiO231461662
3 *Ni/SiO24730939
EG Medium
EntryCatalystApparent/Estimated Oil Yield wt.%Solid Phase wt.%
THF InsolubleTHF SolubleTotal
4Non-catalytic89/2067480
5Ni/SiO293/32234568
* Reaction temperature of 300 °C.
Table 4. The selectivity of monomers in the oil fractions from non-catalytic and catalytic conversion of H-LS, and the total monomer yields. Reaction condition: 0/0.75 g catalyst, 7.5 g H-LS, 75 mL solvent, initial H2 loading of 50 bar at RT, reaction temperature of 250 °C, 3 h reaction time.
ExperimentSelectivity %Monomer Yield wt.%
Guaiacol & Substituted GuaiacolsAromatic EstersTotal
EtOH, Non-catalytic10.911.822.73.6
EtOH, Ni/SiO26.66.312.94.0
EG, Non-catalytic5.8-5.81.2
EG, Ni/SiO22.6-2.60.8
Table 5. The oil and solid yields from conversion of H-LS over Ni-based catalyst in EtOH. Reaction condition: 0.75 g catalyst, 7.5 g lignin, 75 mL solvent, initial H2 loading of 50 bar at RT, reaction temperature of 250 °C, 3 h reaction time.
EntryCatalystOil Yield wt.%Solid Yield wt.%
1Ni/SiO23162
2Ni/AC3460
3Ni/ZrO23469
4Ni/γ-Al2O33367
5AC1576
6SiO21867
7Ni/SiO2 (sulfided)3352
8Ni/SiO2 *3060
* Spent catalyst from reaction of H-LS in EtOH in the presence of Ni/SiO2.