Article

Photocatalytic and Antimicrobial Properties of Ga Doped and Ag Doped ZnO Nanorods for Water Treatment

by
Marlene N. Cardoza-Contreras
1,*,
Adrián Vásquez-Gallegos
1,
Abraham Vidal-Limon
2,
José M. Romo-Herrera
2,
Sergio Águila
2 and
Oscar E. Contreras
2
1
Facultad de Ciencias Marinas, Universidad Autónoma de Baja California, Baja California 22860, Mexico
2
Centro de Nanociencias y Nanotecnología, Universidad Nacional Autónoma de México, Baja California 22800, Mexico
*
Author to whom correspondence should be addressed.
Catalysts 2019, 9(2), 165; https://doi.org/10.3390/catal9020165
Submission received: 6 December 2018 / Revised: 11 January 2019 / Accepted: 23 January 2019 / Published: 8 February 2019
(This article belongs to the Section Photocatalysis)

Abstract

:
Water contamination is a worldwide concerning problem. Emerging contaminants have made conventional water treatment processes ineffective. This makes the search for new materials with improved physical-chemical properties for water treatment an urgent necessity. Doping metal oxides nanostructures can improve the photocatalytic degradation of contaminants and the antimicrobial activity of the material. During this process, water treatment not only involves the degradation of toxic pollutants, but also the elimination of virus and bacteria. Then, it is important to study not only the effect of a dopant in a material as photocatalyst but also the effect in its antimicrobial properties. In this work ZnO nanorods, Ga doped ZnO nanorods and Ag doped ZnO nanorods are synthesized and supported in polyethylene by a fast-hydrothermal microwave heating synthesis. Their photocatalytic performance and antimicrobial properties for water treatment were evaluated. Experiments show that Ag and Ga can improve the photocatalytic and antimicrobial properties of ZnO nanorods; the relationship between doping concentrations, with both the toxicity effect of the nanorods toward bacteria and the nanorods photocatalytic performance, is shown.

Graphical Abstract

1. Introduction

Water contamination is a worldwide concerning problem and hence it is important to improve the technology and materials properties for its treatment. In recent years, photocatalysis has gained attention as an alternative water treatment method [1]. Photocatalytic process starts when a catalyst based on semiconductor-like material (generally metal oxide semiconductors: TiO2, ZnO, etc.) [2,3,4] absorbs a photon of greater energy than its band gap energy generating electron–hole pairs. Some of the electron–hole pairs recombine directly, losing the energy acquired while other electrons participate in oxidation reduction reactions on the surface of the catalyst producing reactive oxygen species (ROS) such as superoxide ions and hydroxide radicals (O2, ·OH) which are capable to degrade large organic pollutant molecules into harmless small molecules such as H2O and CO2. The incorporation of nanostructured photocatalysts could give the opportunity to increase the surface/volume ratio and improve the photocatalytic performance [5]. However, one of the limitations in the use of nanostructured materials is their harsh removal after the treatment, necessary to granulate or filter then in order to avoid their dispersion into the already treated medium. One effective solution to overcome the issue is with a photocatalytic membrane reactor (PMR), which consists of a nanostructured photocatalyst supported on a filtering membrane. In this way, a PMR can be a diffusion barrier and degrade contaminants at the same time [6,7,8]. A good photocatalyst can absorb visible light efficiently, have enough electron vacancies states in order to inhibit electron–hole recombination, should be not toxic and offer high surface to volume ratio (improved molecules adsorption). ZnO it is an attractive material to use as photocatalyst [9,10] due to its high surface reactivity and their ability to generate ROS when it is exposed to an irradiation energy greater than its band gap. Unfortunately, its use has been limited due to its inability to adsorb light from the visible region. To overcome this problem some researchers have studied different synthesis methods and they have found that ZnO has the possibility to absorb visible light when its structure has enough surface defects [11,12]. The microwave synthesis of nanomaterials has been developed dynamically in recent years [13,14,15], specifically ZnO hydrolysis and rapid crystallization via microwave synthesis has shown to create a high number of surface vacancies improving the visible light absorption efficiency of ZnO [12]. Other works have been focused on doping ZnO with metals in order to make ZnO visible light active [16,17,18]. Most importantly, water treatment not only involves the degradation of toxic pollutants, but also the elimination of virus and bacteria. Then, it is important to study not only the effect of a dopant in a material as a photocatalyst but also the effect in its antimicrobial properties. Gallium (Ga) has shown to possess strong antimicrobial properties, some authors have proposed hypothetically that bacteria capture Ga through their siderophores molecules (Fe chelating agents) and block multiple processes in the bacteria where Fe2+ it is oxidized to Fe3+ [19,20,21]. Alternatively, silver has been known to be toxic against a broad range of microorganisms [22,23,24,25]. The mechanism of the antimicrobial action of silver has not been clearly stated yet. According to Benjamin Le et al. [26], most researchers have attributed the antimicrobial activity of Ag to the presence of an Ag0 core, this consist in Ag particles accumulation at the bacterial membrane forming aggregates that produce damage of the bacterial membrane integrity. Other mechanism considered the generation of reactive oxygen species (ROS) by Ag nanoparticles causing a high oxidative stress that leads to inactivation of the microbial cell. Doping ZnO nanostructures with other elements that have been shown antimicrobial properties such as Ag and Ga can improve the antimicrobial activity of the nanostructures. In this work, we synthesize ZnO nanorods, Ga doped ZnO nanorods, and Ag doped ZnO nanorods supported in polyethylene by a fast-hydrothermal microwave heating synthesis and evaluated their photocatalytic performance and antimicrobial activity towards two bacterial strains commonly found on treated-water effluents.

2. Results

2.1. ZnO Nanoparticle Characterization

Figure 1a,b show transmission electron microscopy (TEM) micrographs of the synthesized ZnO nanoparticles. The low-resolution TEM micrograph exhibits spherical nanoparticles with diameters of 4.5 to 6 nm in size (Figure 1a). Measurements of the lattice fringe widths on the high-resolution TEM micrograph result in a value of 0.25 nm. This value is very close to the 0.248 nm interplanar spacing corresponding to (101) plane of hexagonal wurtzite phase of ZnO (JCPDS card no. 80-0075).

2.2. Doped and Undoped ZnO Nanorods Characterization
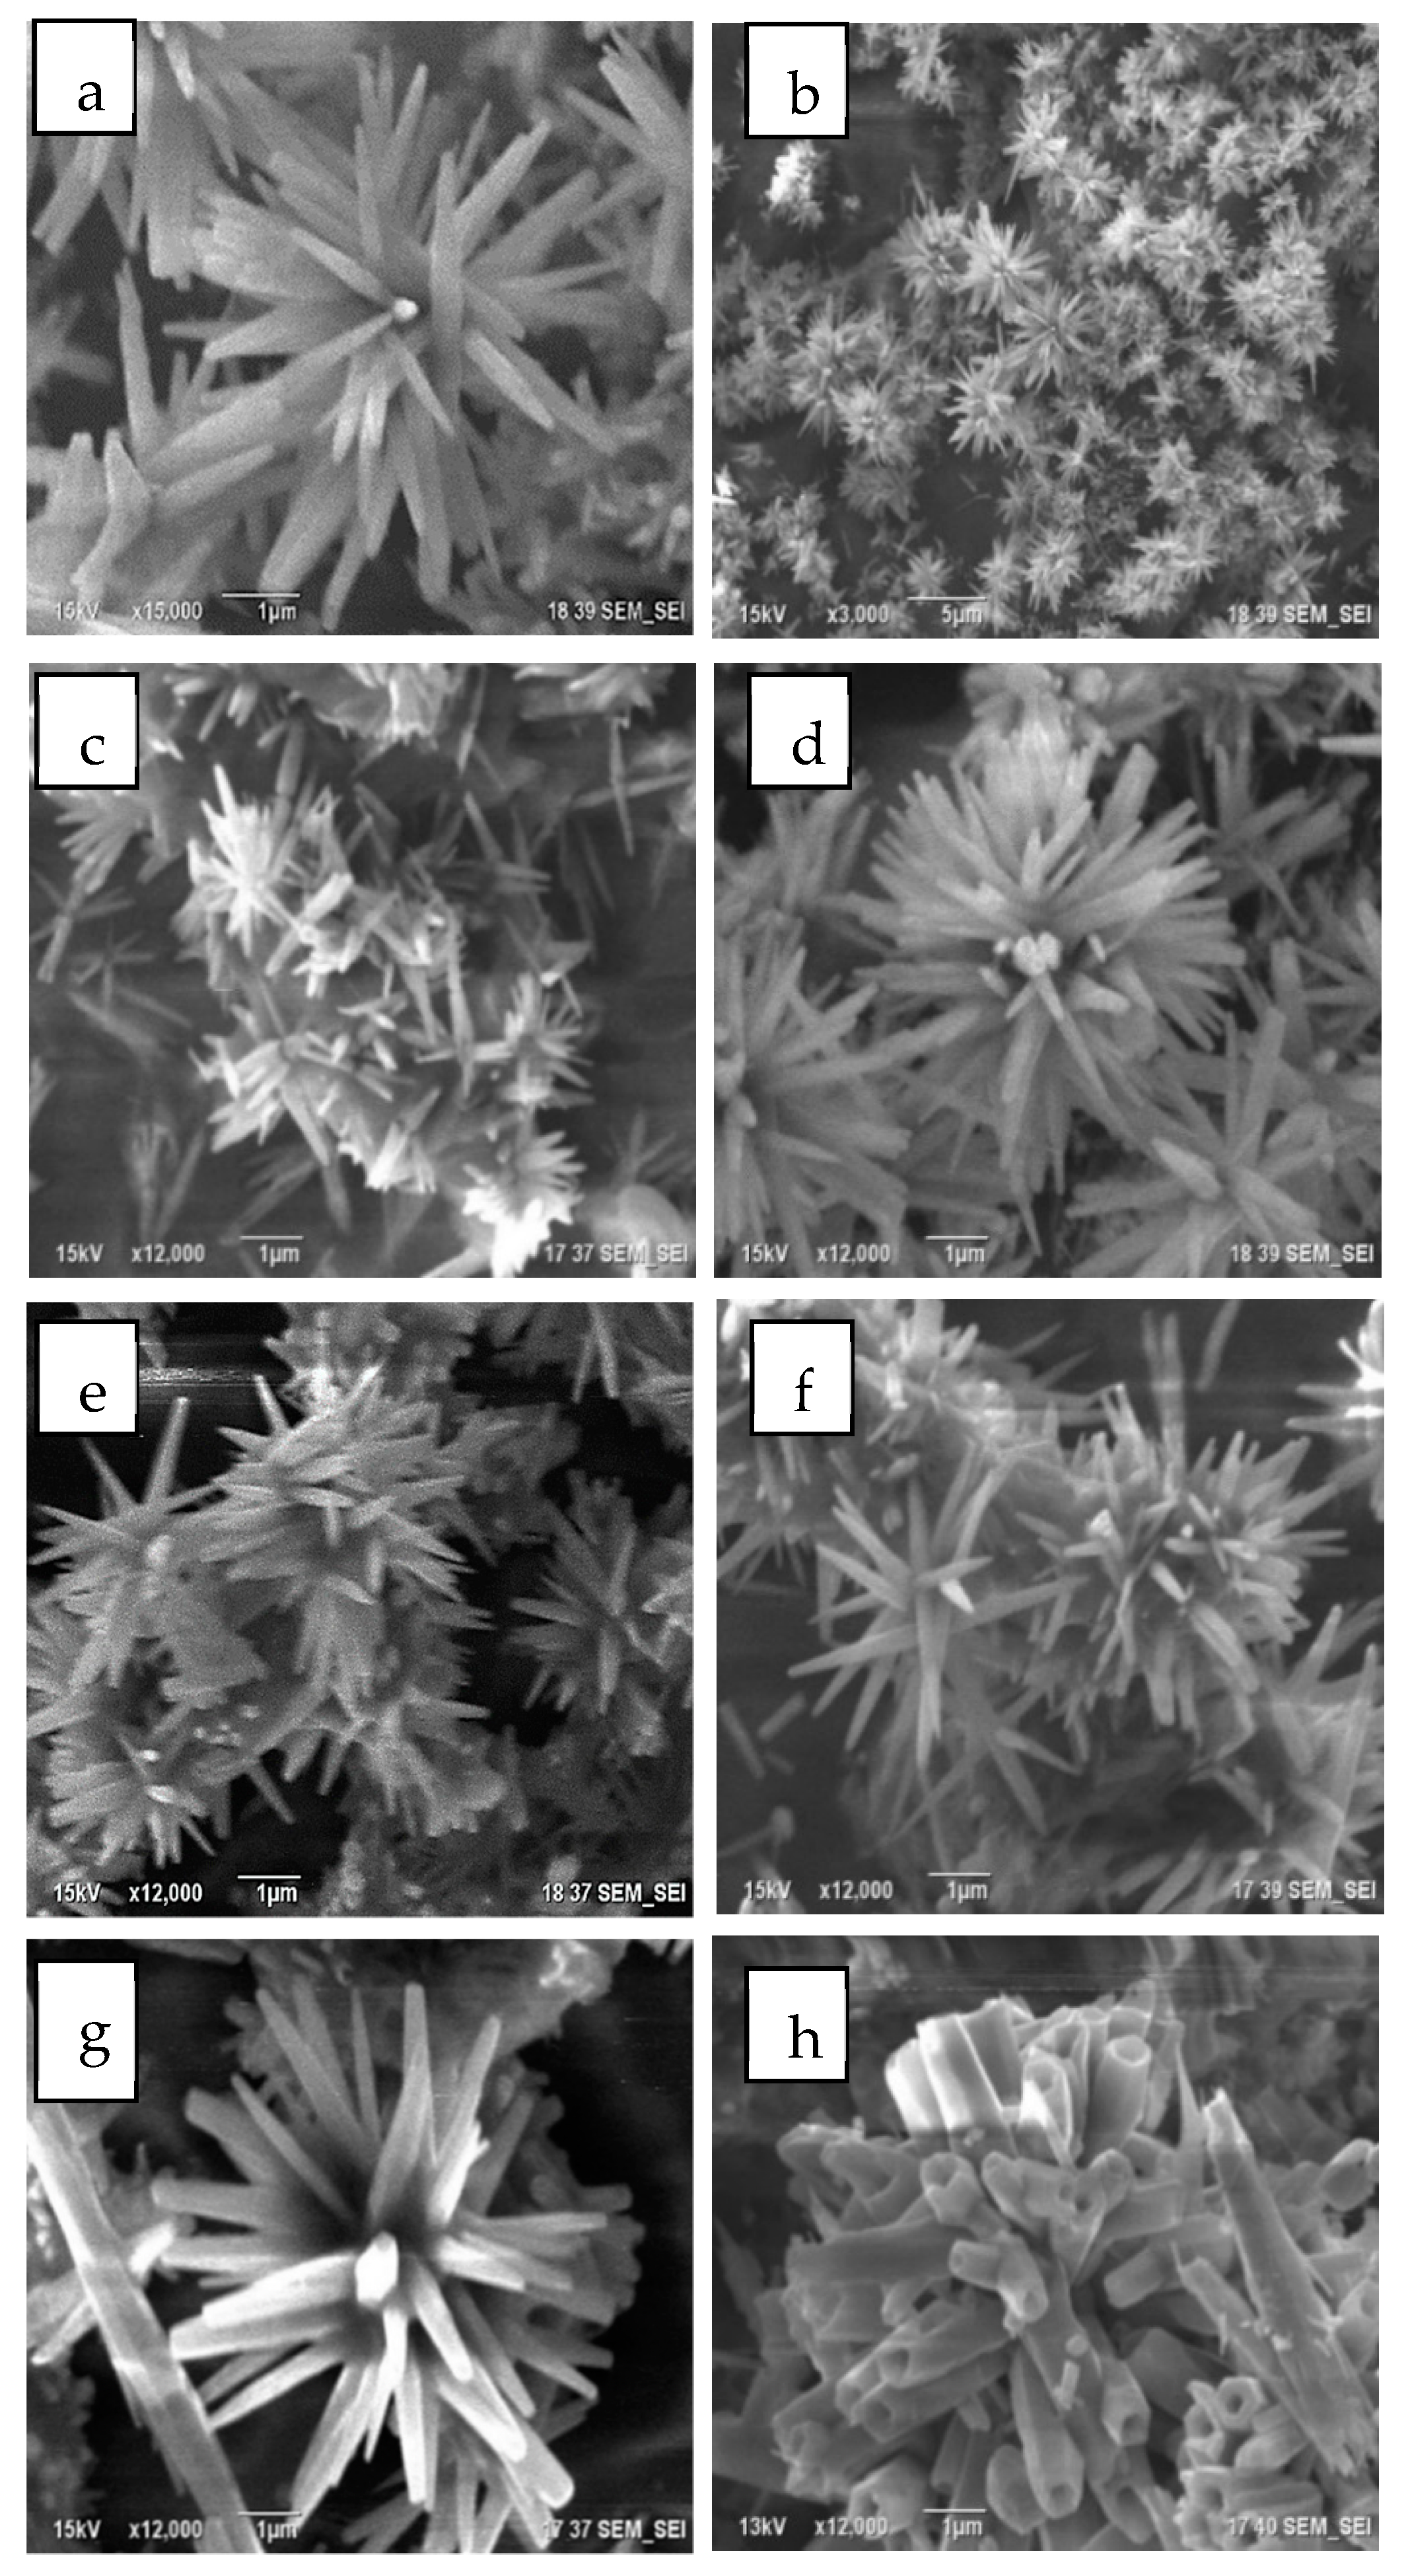
2.2.1. Morphology

Figure 2 illustrates the morphology of the undoped and doped ZnO nanorods (NRs), almost all ordered in urchin-like structures. Table 1 summarizes the doping effect on nanorod diameter obtained from scanning electron microscopy (SEM) images. Undoped ZnO NRs diameter range was 150–250 nm, for low Ga doping (0.1 at %) the nanorods diameter slightly reduces to 100–200 nm, meanwhile at higher doping concentrations starts to increase the NRs diameter. Lu Yue et al. [27] found a similar behavior on Na doped ZnO NRs. At Ag doping concentration of 2 at % and interesting effect was observed, generating hollow nanorods. A probable explanation to this phenomenon it is that Ag possess high thermal conductivity, then at high doping concentration the thermal conductivity of the ZnO NRs can increase and greatly improve the molecules’ vibration in a microwave heating treatment. In these conditions, considering that Ag+ ions are heavier and bigger than Zn ions (have high momentum), Ag+ can milling the surface of the NRs.

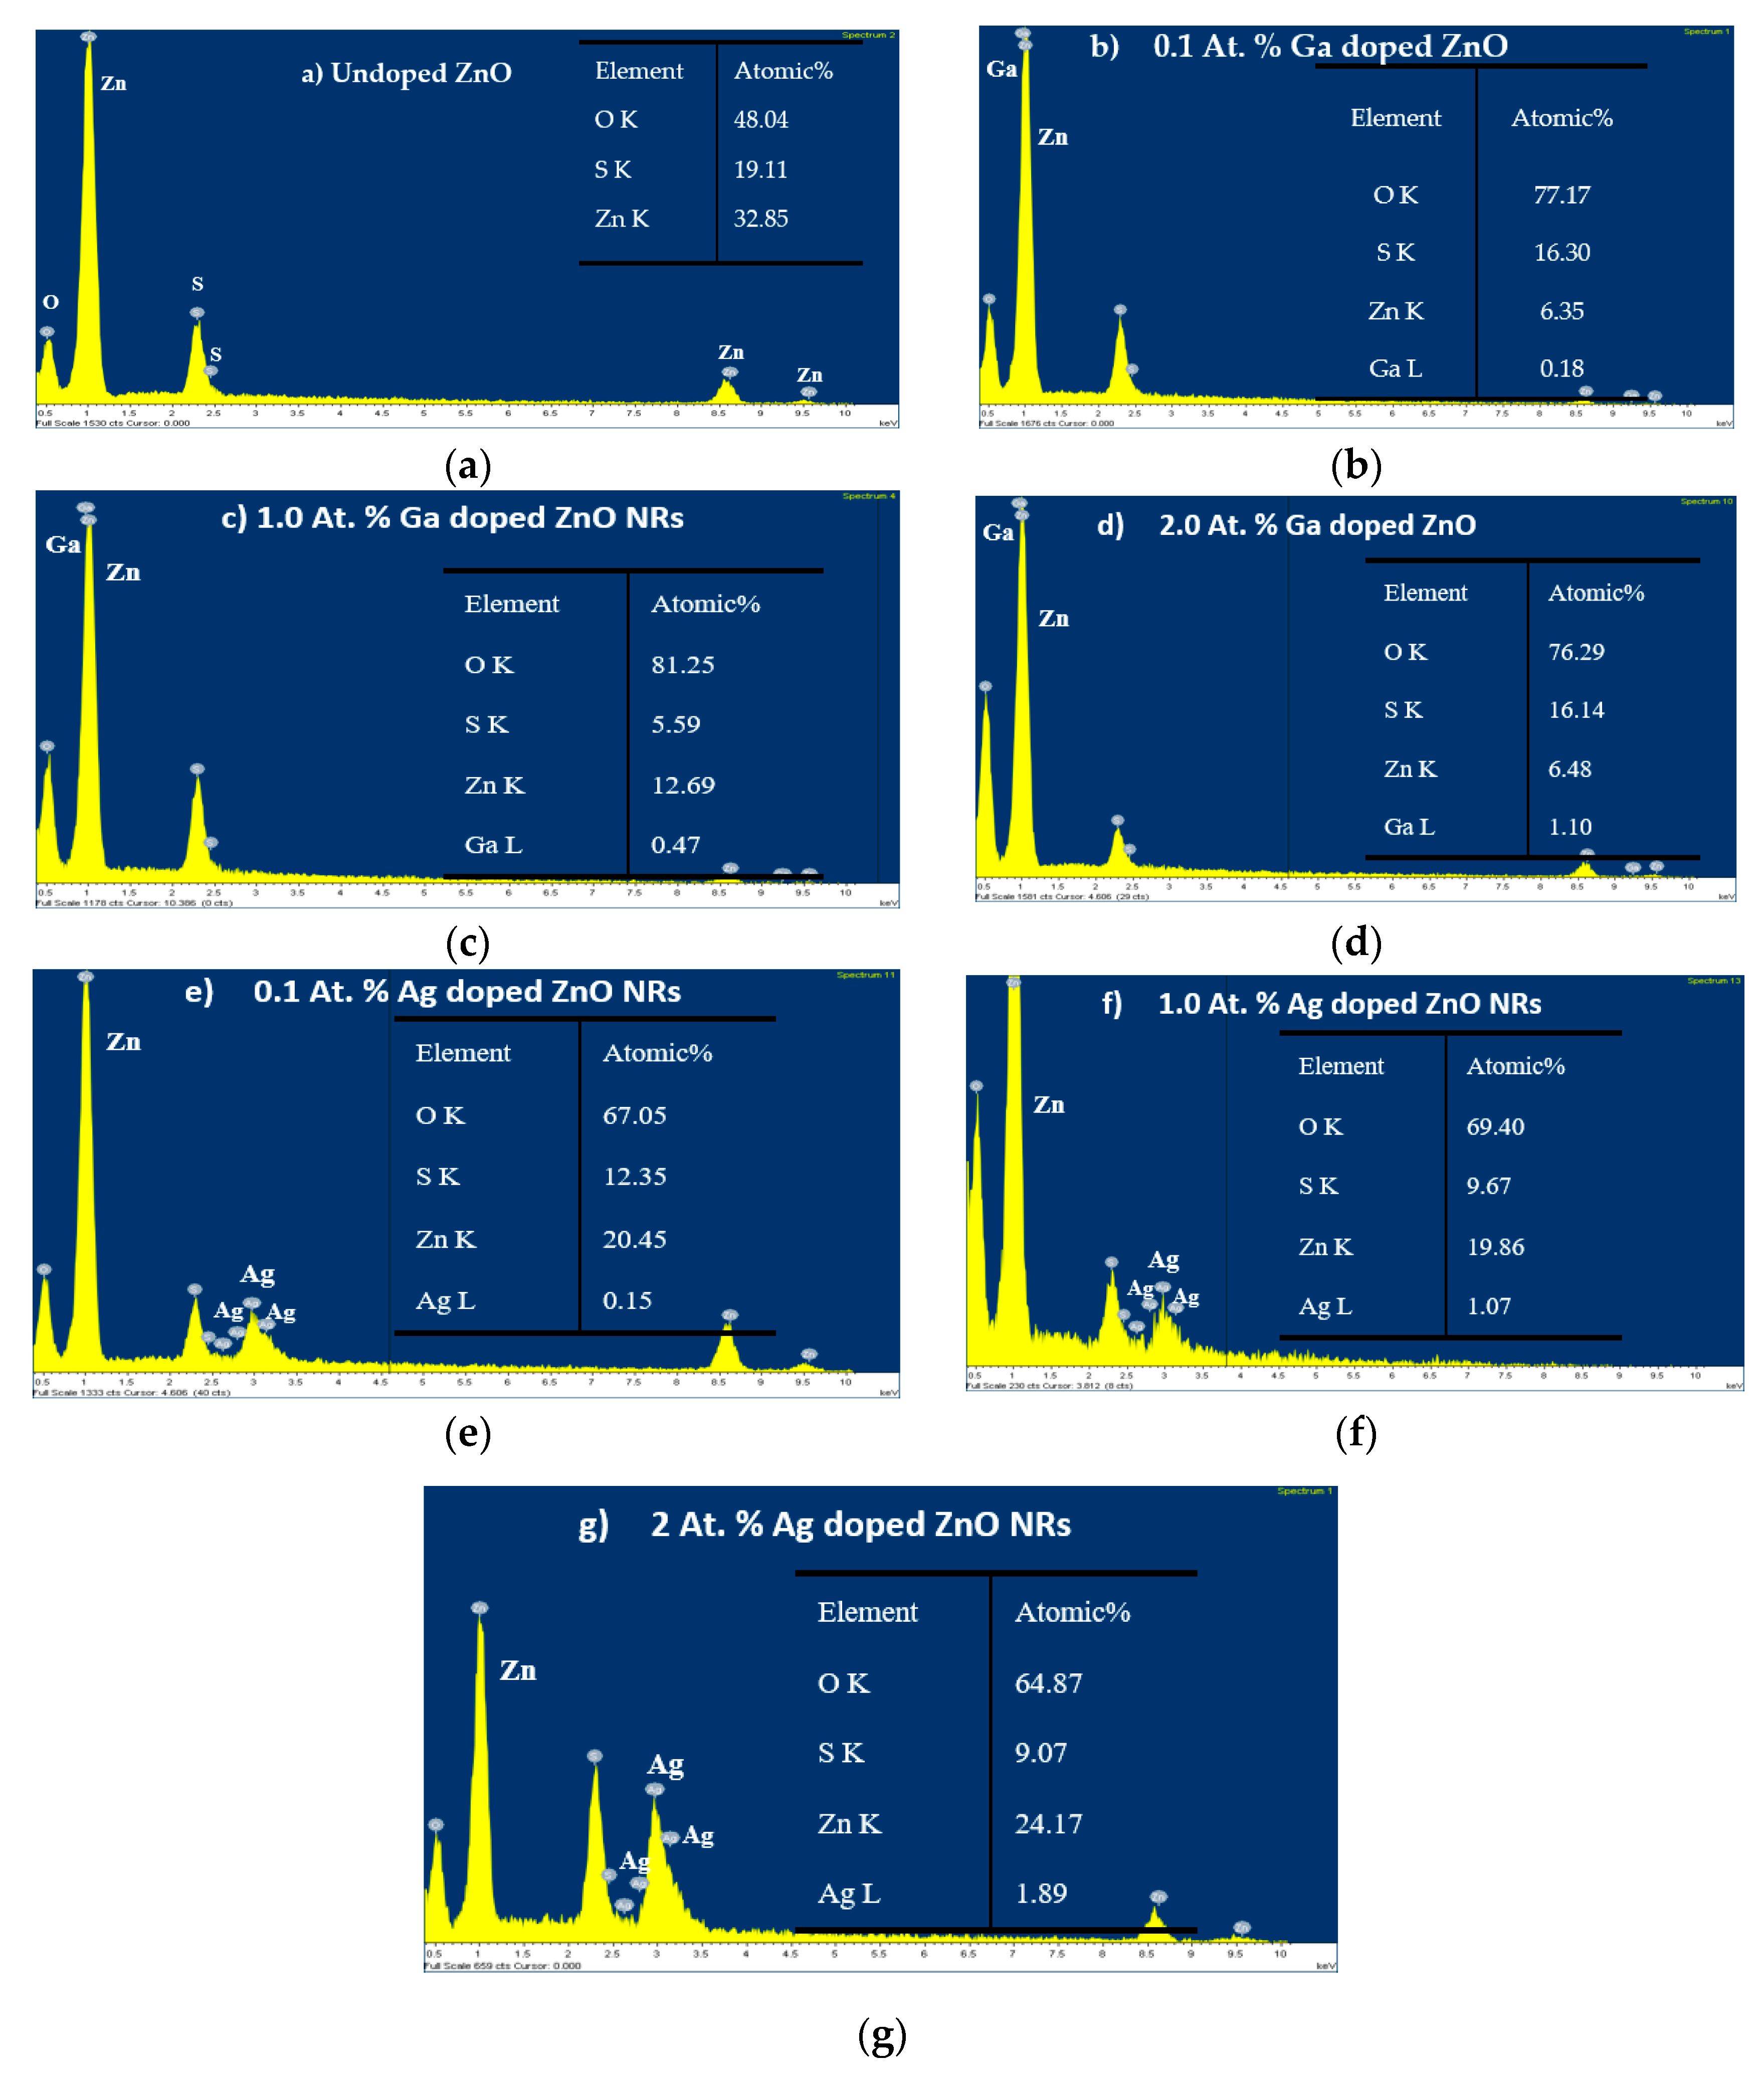
2.2.2. Chemical Composition

Figure 3 shows the energy-dispersive X-ray spectroscopy (EDS) spectrums of undoped and doped ZnO NRs. Figure 3b–d show that Ga doped synthesized ZnO nanorods includes elements such as Zn, O, and Ga, confirming the incorporation of Ga into ZnO NRs. Meanwhile Ag doped ZnO nanorods include elements such as Zn, O, and Ag (Figure 3e–g). The S peak present in all spectrums is from the thiolated substrate. Regarding the doping content (Figure 3 insets), it can be deduced that even when silver is larger than gallium, it was better incorporated into the ZnO network. This occurs probably due to a better solubility of Ag than Ga in the precursor solution.

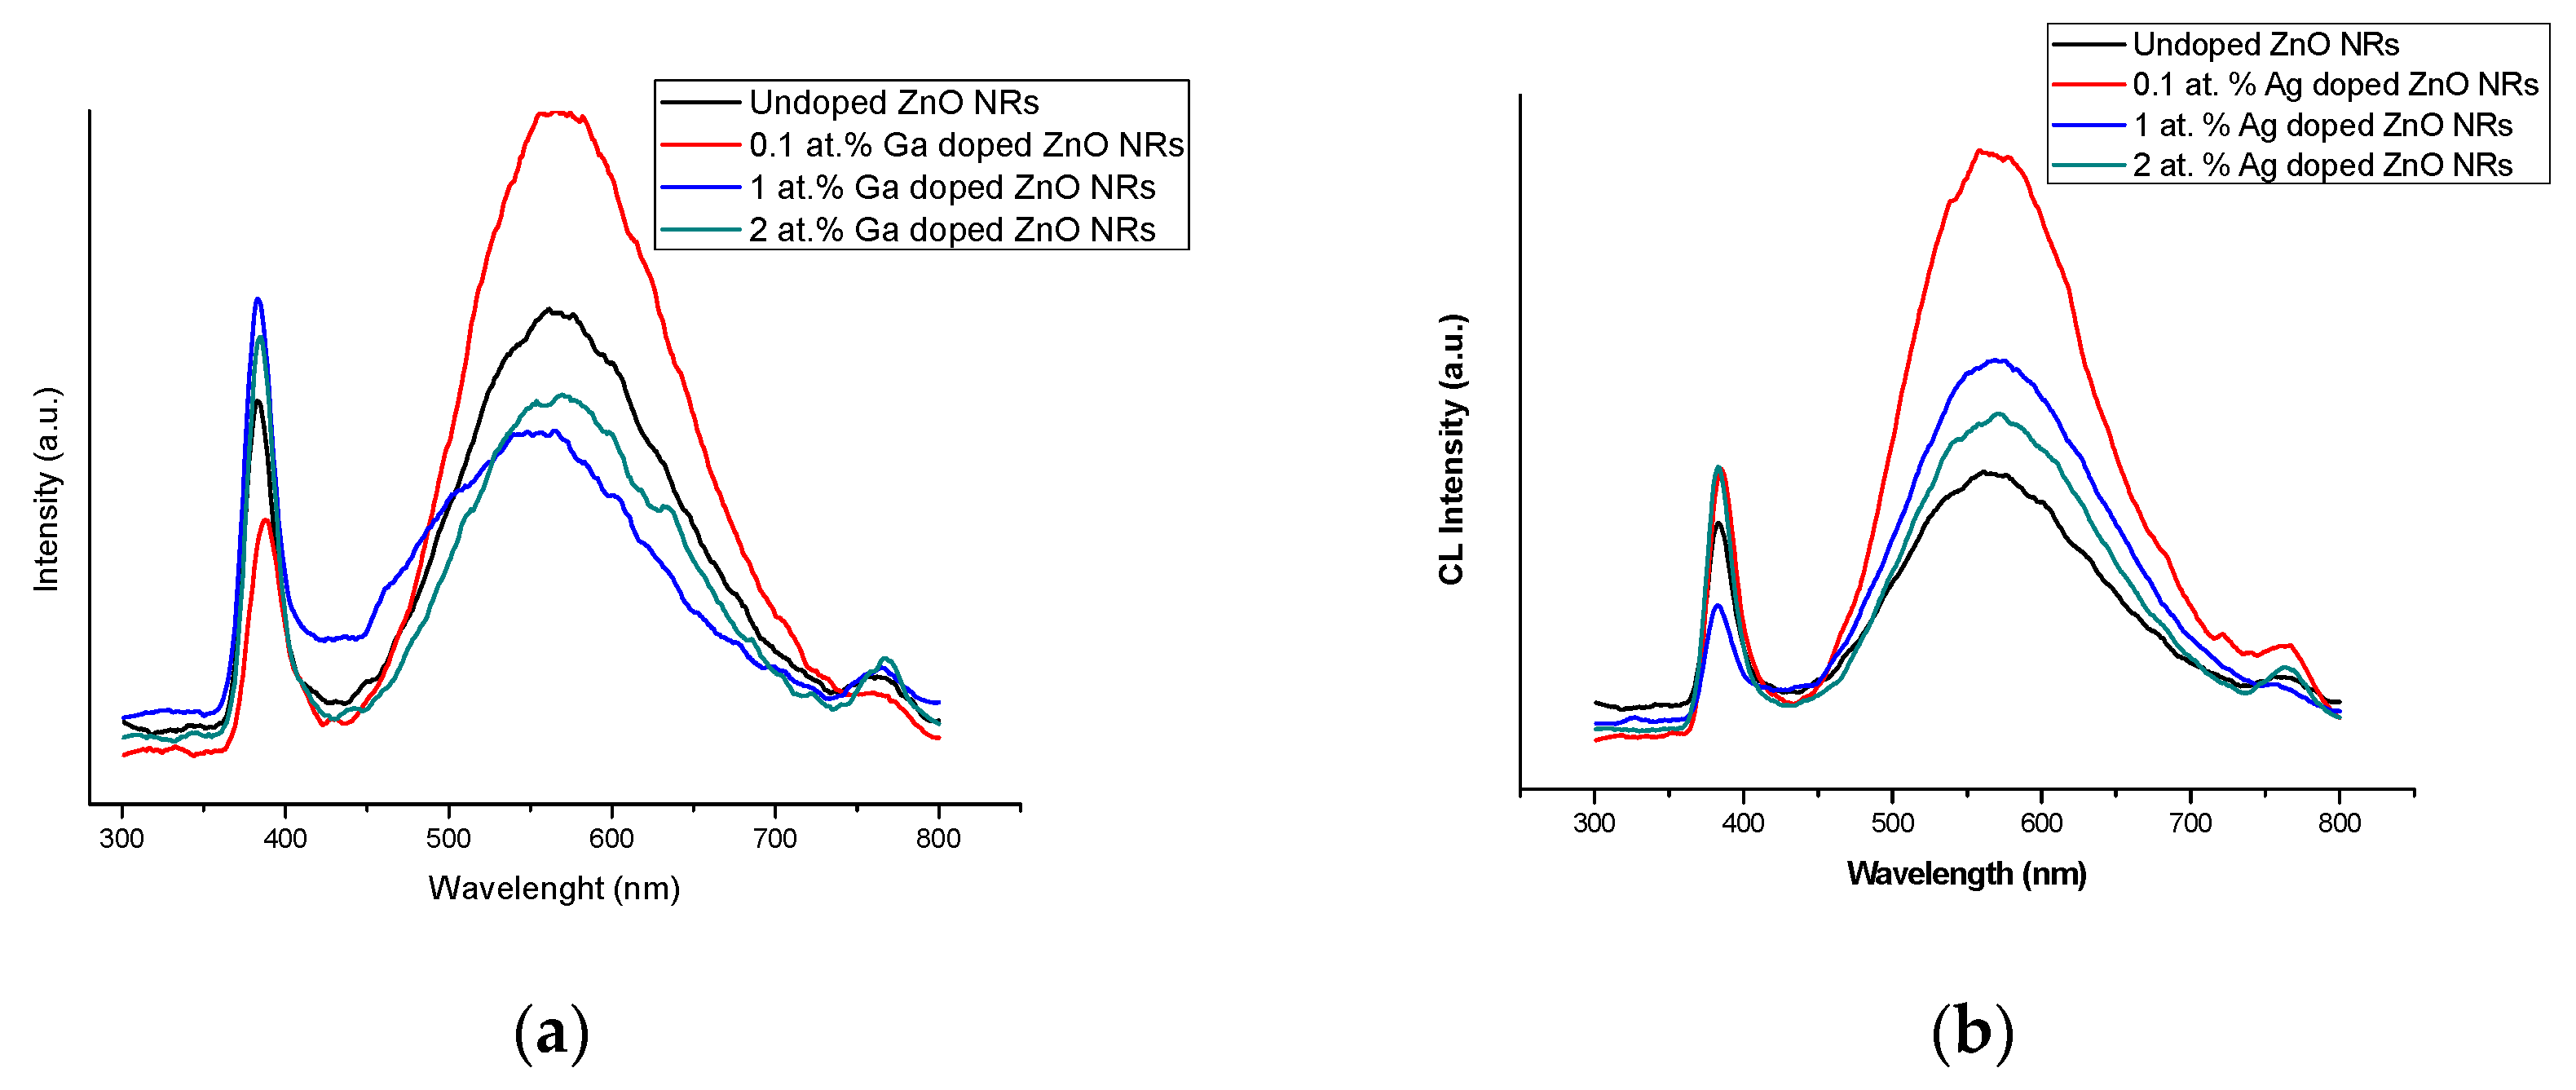
2.2.3. Optical Properties

The ZnO NRs optical properties were investigated by cathodoluminescence (CL) (Figure 4a,b). For all samples, it can be observed a UV emission band around 383–387 nm (3.25–3.21 eV) and a broad emission band from ~450 to 700 nm in the visible region. In the literature, the ZnO UV emission is attributed to near band edge emission (NBE) resulted by radiative recombination of excitons [28] and the broad visible emission band at 450 to 620 nm is often attributed to electron–hole recombination at deep levels caused by intrinsic defects such as oxygen vacancies and/or zinc interstitials [29]. Figure 3a shows the CL spectrum of Ga doped ZnO NRs. The higher intensity of the near band edge emission corresponded to 1 at % Ga doped ZnO NRs. Near band emission of samples shifted from 383 eV to 387 nm as the dopant concentration increases from 0.0 to 0.1 at %. However, at a high Ga concentration of 1 and 2 at %, NBE shifted to a shorter wavelength of 384 nm due to a probable decrement of free-carrier concentration. This behavior can be due to a monotonic redshift with increasing carrier concentration rather than the dopant concentration [30]. Higher concentration of Ga doping (1 and 2 at %) resulted in an relative intensity increment of the near band edge emission respect to the undoped ZnO NRs indicating that Ga dopants stimulated the recombination of photo-generated electrons and holes. Ga doping produced a light red shift for all the defect band emission, being pronounced in 1 at % Ga doped ZnO NRs.
Figure 4b shows the CL spectrum for Ag doped ZnO NRs. Low doping concentration of Ag (0.1 at %) increases the intensity of the near band edge emission and the defects related band emission. The Ag+ ions can be incorporated in to the ZnO lattice either by substituting Zn+2 ions creating doubly ionized oxygen vacancies or as interstitials Ag+ [31]. It has found that for low doping concentrations e.g., 0.5% Ag+ ions could incorporate in to the ZnO interstitially, leading predominantly to extrinsic lattice defects [32]. 0.1 at % Ag doped ZnO NRs presented a slight red shift of the near band emission from 383 to 385 nm (3.25 to 3.22 eV) respect to the undoped ZnO NRs.

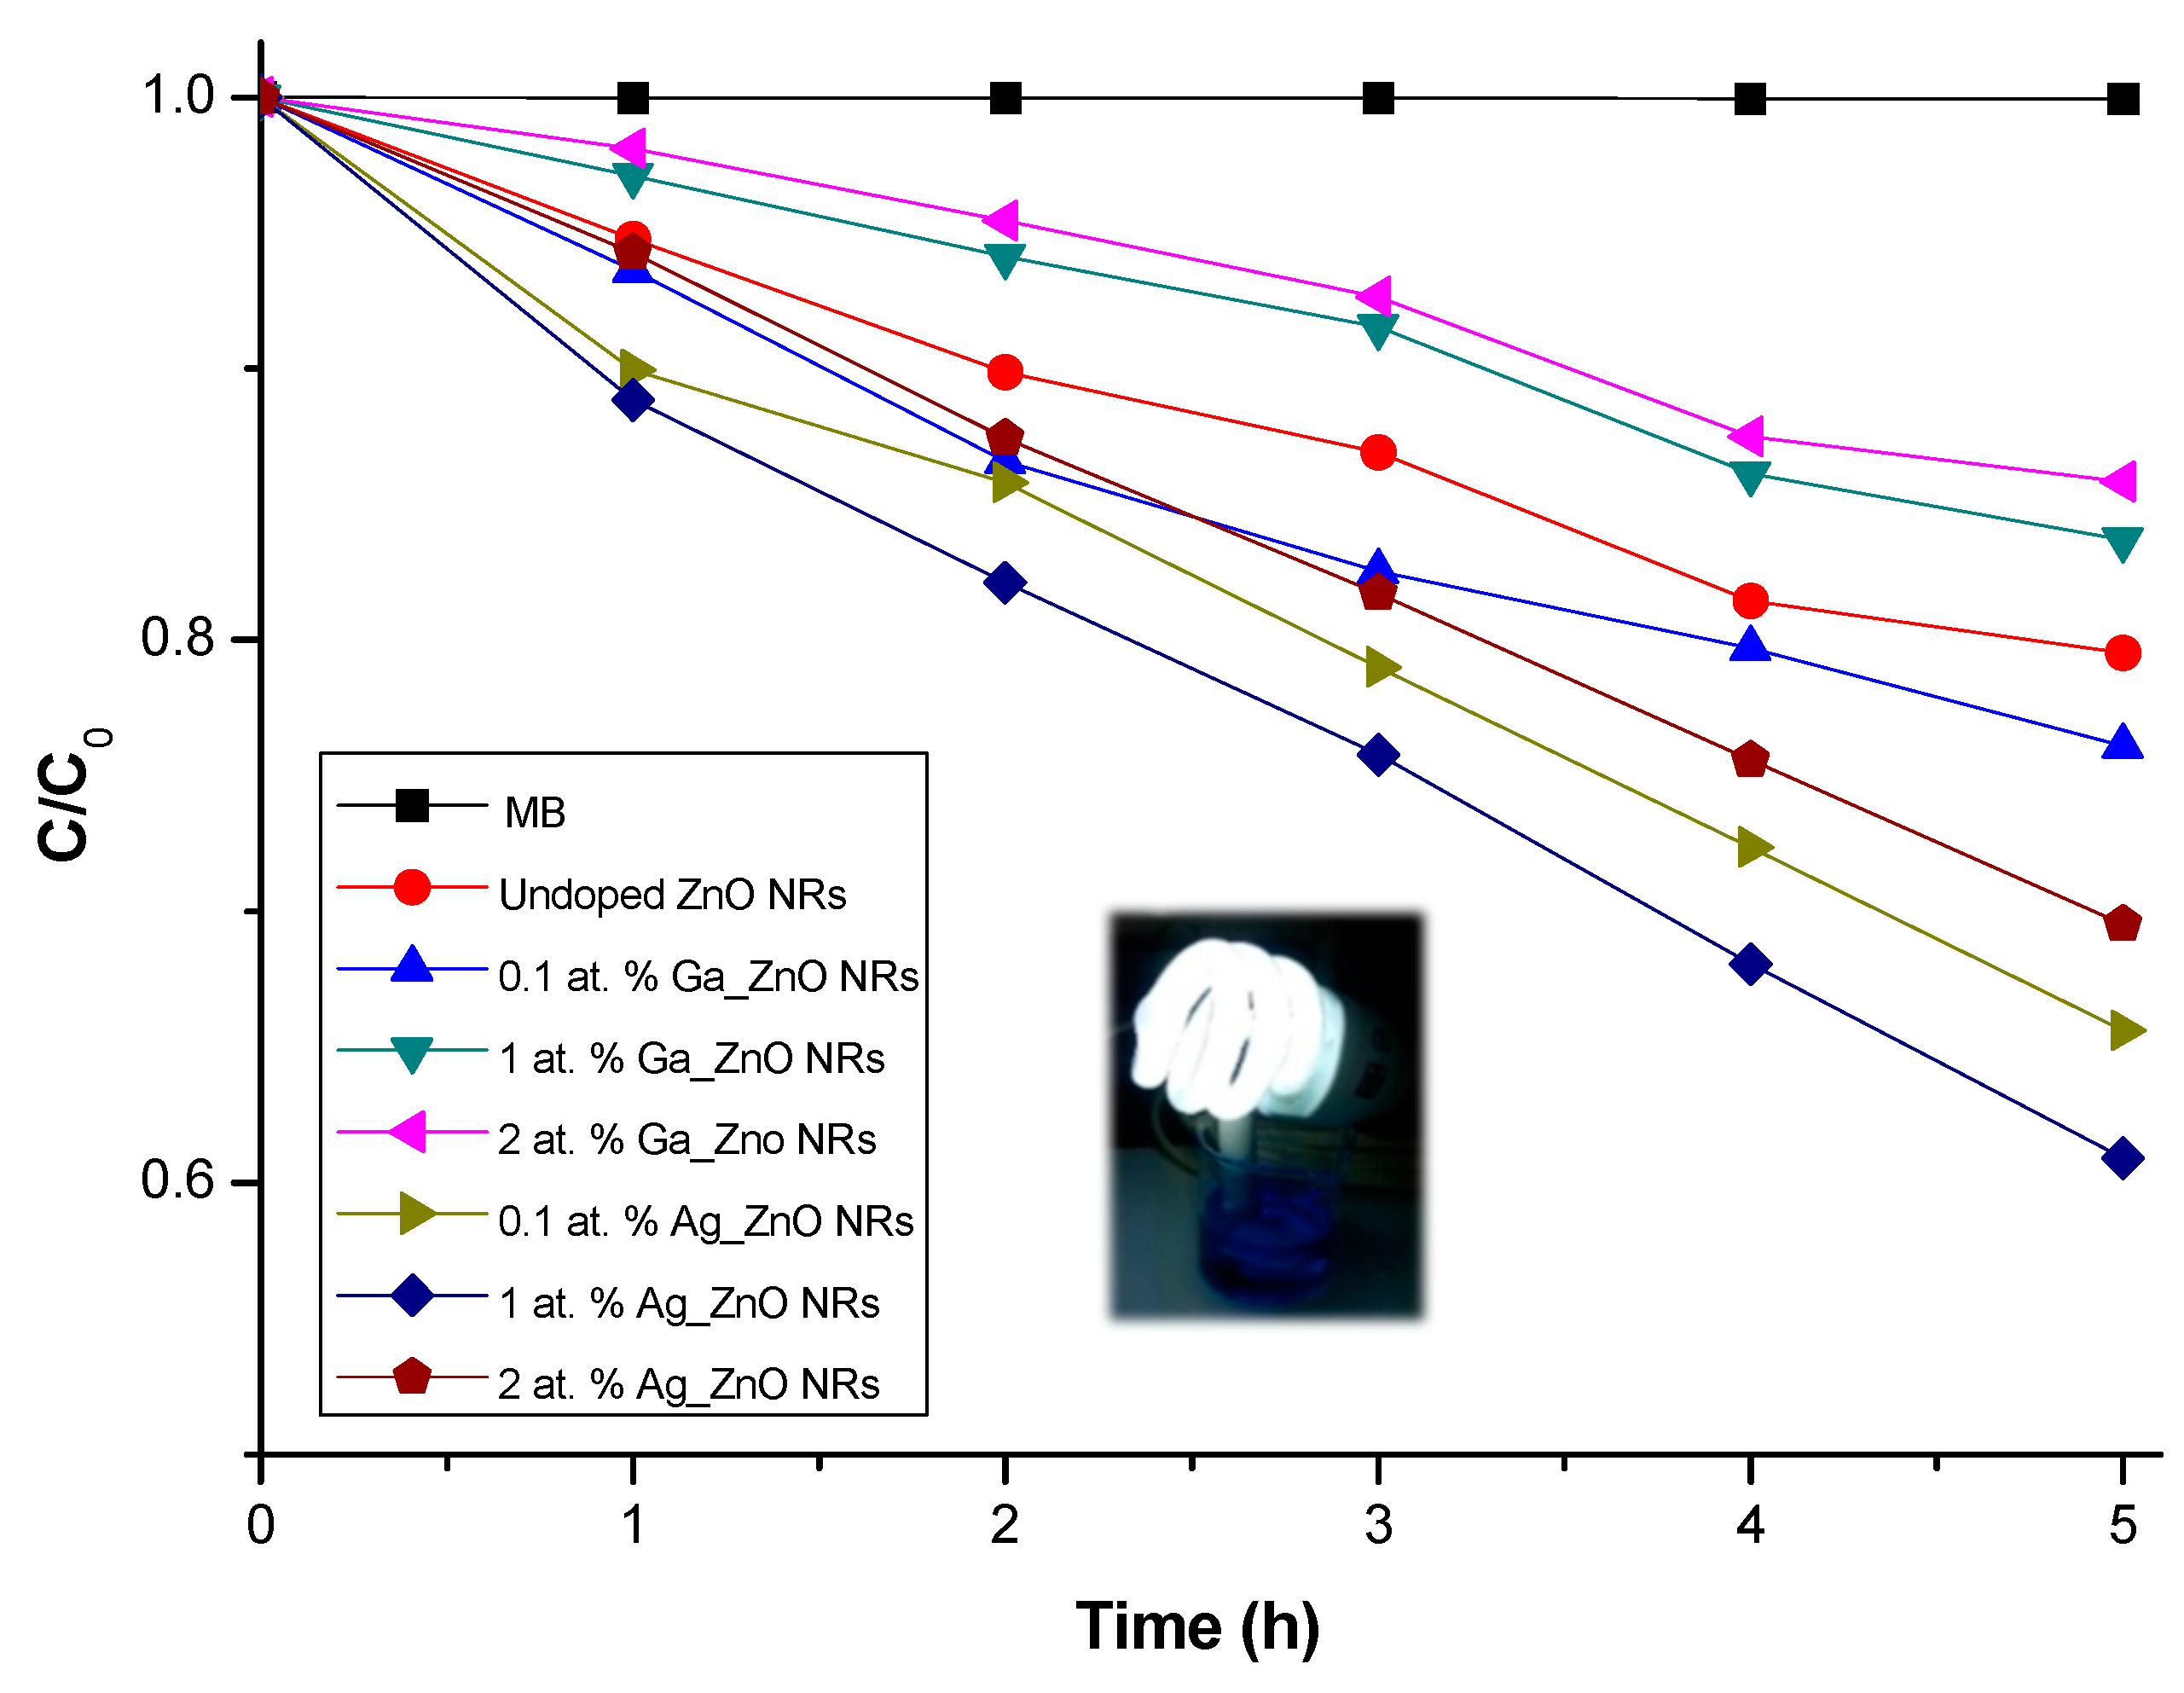
2.3. Photocatalytic Activity

The photocatalytic activity of the synthesized undoped and doped NRs was evaluated under a visible light irradiation. It can be observed from Figure 5 that 1 and 2 at % of Ga doping diminished the photocatalytic activity when compared with undoped ZnO nanorods. Only the low doping concentration (0.1 at %) resulted with higher photocatalytic performance than the undoped ZnO nanorods. The photocatalytic activity of the Ga doped ZnO nanorods may decrease due to surface accumulation of dopant, covering the surface and preventing light and pollutant adsorption. In addition, it has been reported that at higher metal content, the metal could behave as recombinant center due the excessive accumulation of electrons, increasing the possibility of interaction between metal sites and photogenerated holes, promoting electron–hole recombination [33,34,35]. All Ag doping concentrations resulted with better photocatalytic activity than undoped ZnO nanorods. Although high dopant concentration (2 at %) showed a similar behavior of doping with high concentrations of Ga resulting in less photocatalytic activity than lower dopant concentrations. When comparing the photocatalytic activities of Ga doped ZnO nanorods vs. Ag doped ZnO nanorods, it can be considered that Ag+ ions had better surface dispersion than Ga+ ions, and hence Ga ions tend to form aggregates that diminishes the photocatalytic activity.

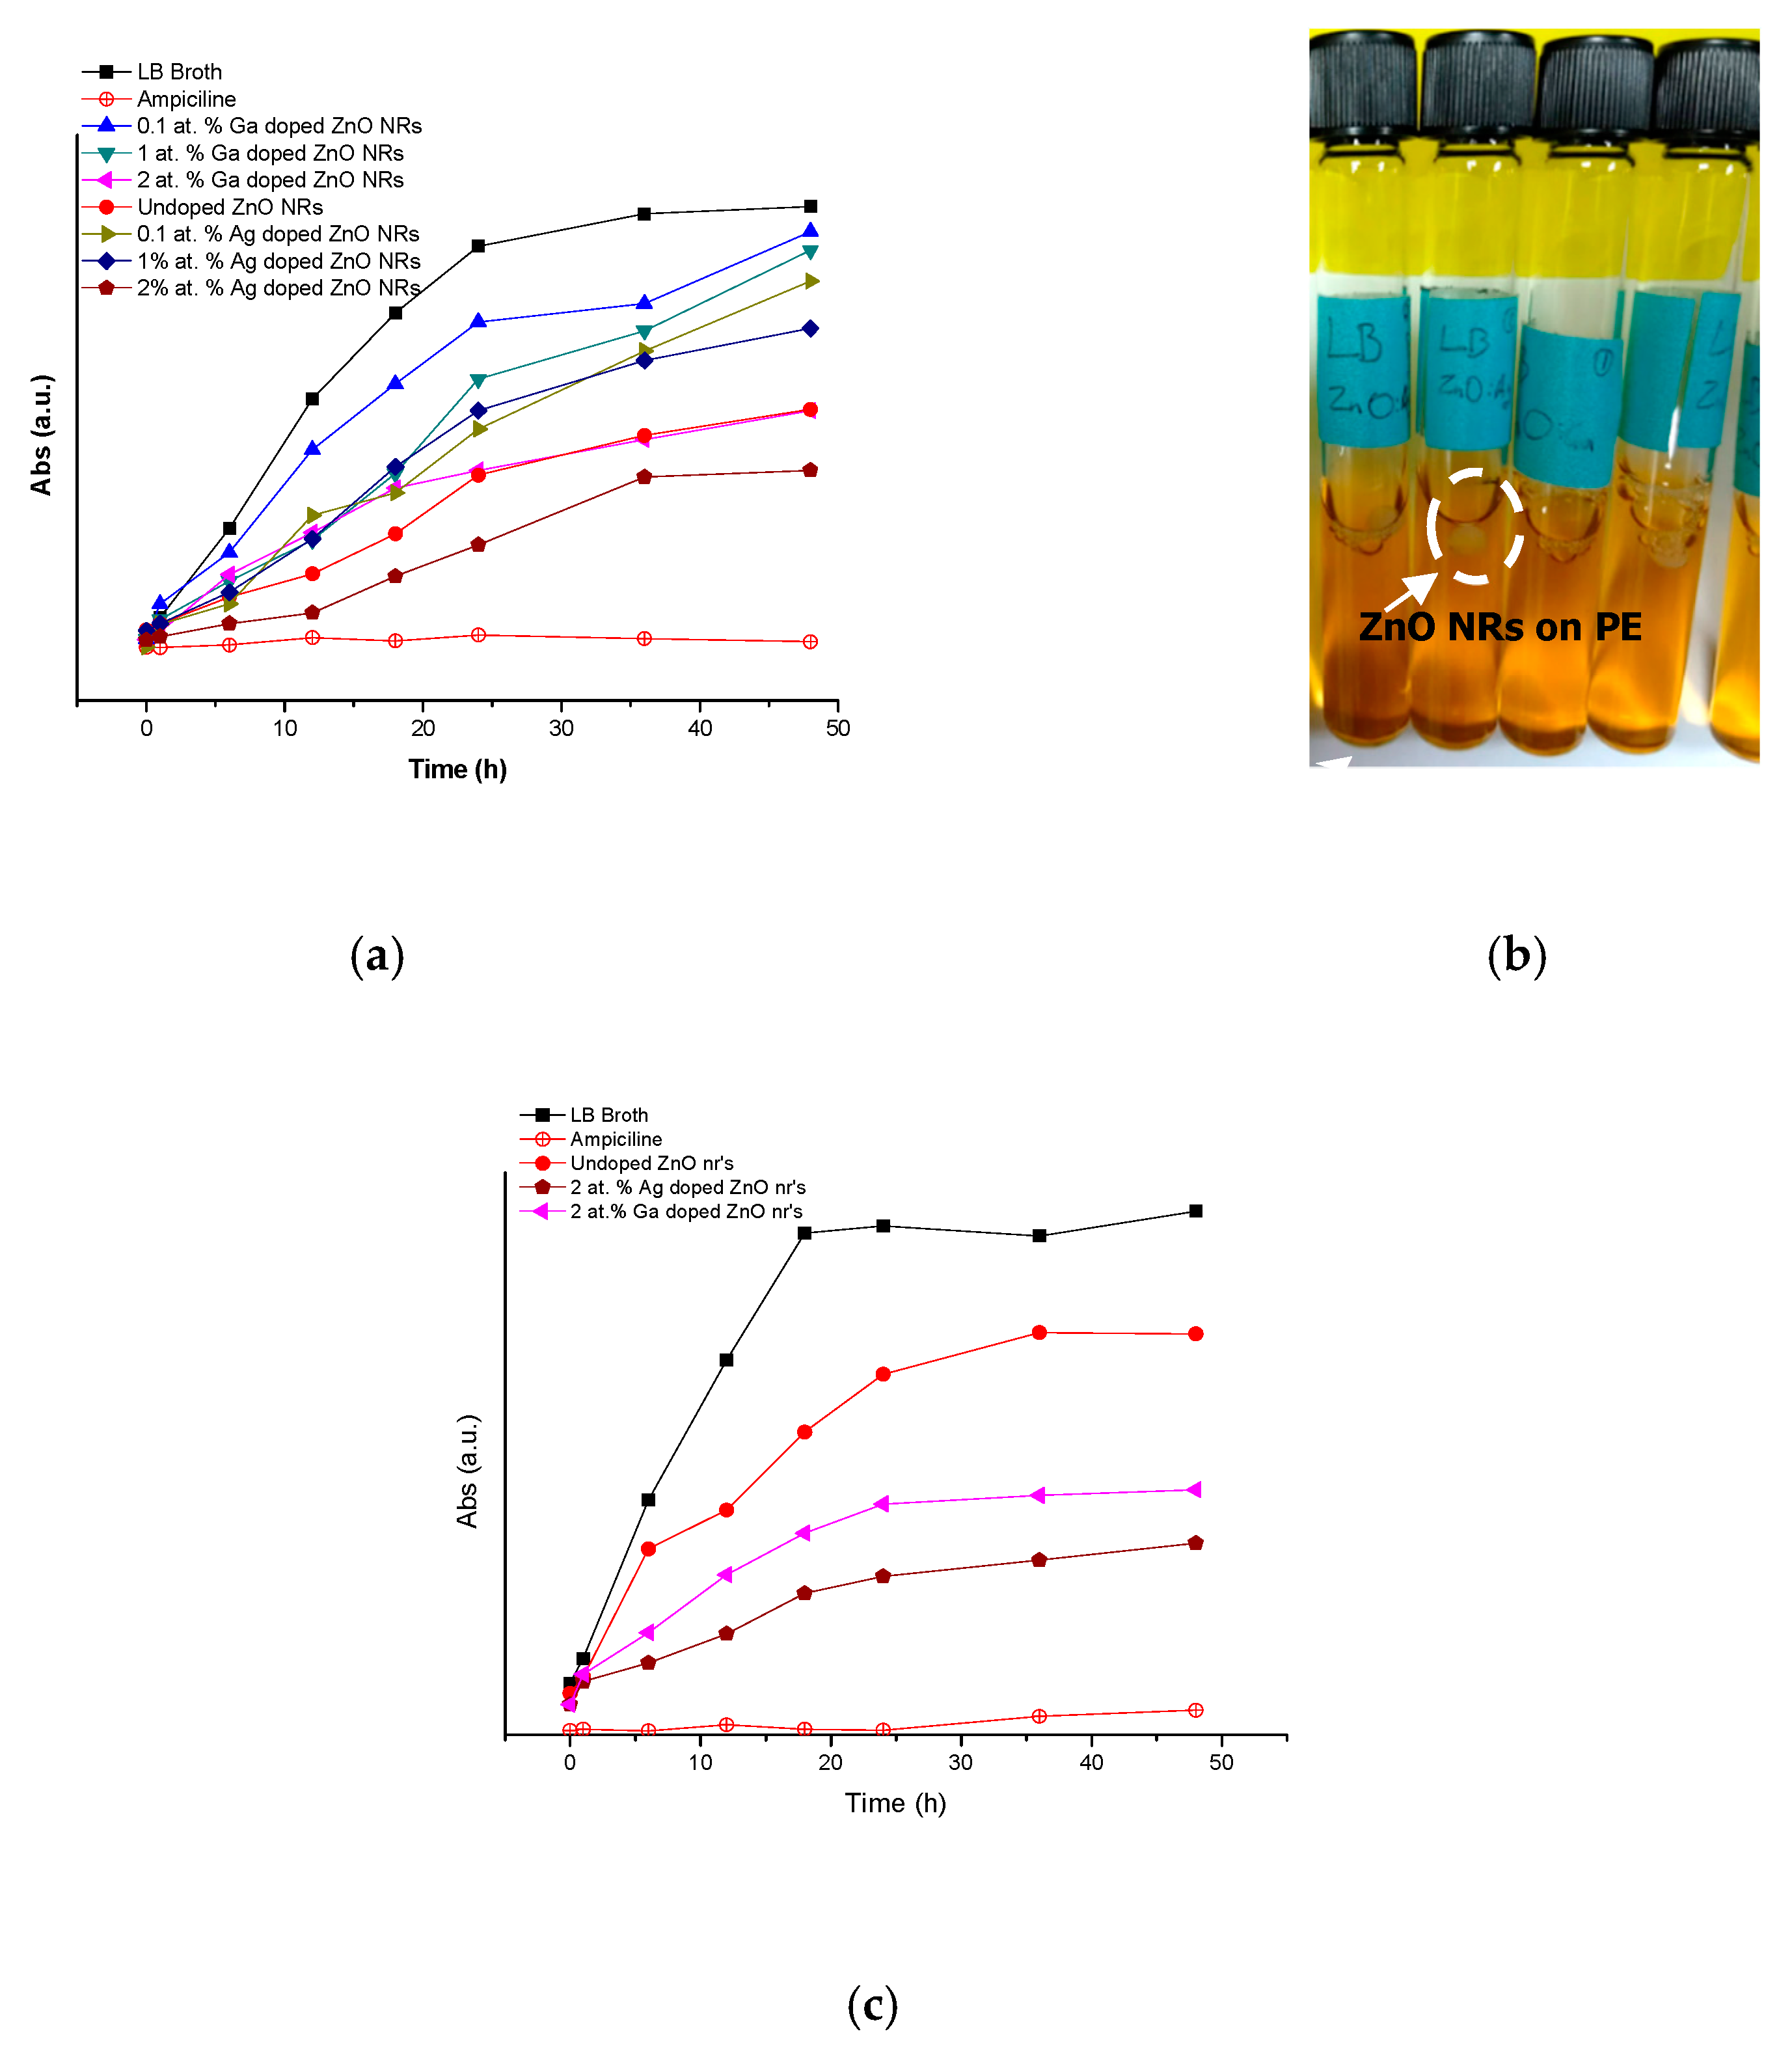
2.4. Antimicrobial Activity

The most significant reduction in the culture growth was observed at 2 at % Ag and 2 at % Ga doped ZnO nanorods with an approximately 50% growth reduction (Figure 6a). The Ag doped ZnO NRs showed the most significant inhibitory effect on growth rate at 24 h, respectively to non-antimicrobial agents control conditions. Ga doped ZnO NRs showed a similar antimicrobial effect, despite the higher toxicity associated to Ga ions, respectively to Ag.
E. coli bacterial cultures were also sensitive to undoped and doped ZnO NRs, with a significant delay in the growth rate in presence of 2 at % Ag and Ga doped ZnO NRs (Figure 6c). E. coli cultures were more sensitive to the antimicrobial activity of doped ZnO NRs, respecting the dopant metal (Figure 6c).

3. Discussion

The microwave fast synthesis resulted in a good method to obtain ZnO NRs absorbing photons in visible light range. Ag and Ga doping of ZnO nanorods affected the ZnO NRs optical properties, low concentration of Ga enhance the defect band of ZnO nanorods meanwhile higher concentrations incremented the intensity of the NBE. This is coherent to photocatalytic activity results where 0.1 at % Ga doping increase the photocatalytic activity of ZnO NRs, indicating that Ga low doping produces higher surface defects that trap the photogenerated electrons and holes diminishing their recombination and hence conducting a better degradation of the methylene blue (MB) by ROS. Ag low doping concentration increase the intensity of the NBE and the defects band, indicating a probably increase of lattice defects, that can act as recombination centers resulting in a slight reduction of the photocatalytic activity. When compared the photocatalytic activities of Ga doped ZnO NRs vs. Ag doped ZnO NRs, it can be considered that Ag+ ions had better surface dispersion than Ga+ ions, and hence Ga ions tend to form aggregates that diminishes the photocatalytic activity.
Our present study also revealed the efficacy of ZnO NRs as antibacterial agent, thereby indicating the importance of the concentration of superficial metal dopant on nanoparticles for killing bacteria. The 0.1, 1, and 2 at %, Ag and Ga doped ZnO NRs showed inhibition of growth kinetics for E. coli and Vibrio spp., implying greater susceptibility of E. coli than Vibrio spp.
ZnO NRs doped with Ag and Ga at 0.1 at % showed smaller dimensions than higher doping concentrations, and it suggested that its reduced size can contribute to higher contact surface area [35]. Despite the size, 0.1 and 1% Ag doped ZnO NRs and Ga doped ZnO NRs showed a reduced inhibition on Vibrio spp., probably associated to lower photocatalytic activity due to high turbidity of the cultures. Previous studies reported a size dependent inhibition of growth of antibiotic resistant Staphylococcus strain cultures by ZnO nanoparticles of ~10 nm, whereas diminished inhibition was observed with larger size materials ~100 nm [36].
Comparatively, ZnO NRs at 2 at % of Ag and Ga showed higher antimicrobial activity with a 50% reduction of growth on both strain cultures. We found an inverse relation between size and photocatalytic activity for 2 at % doped ZnO NRs. Recent studies reported that conditions where nanoparticles coexist with and without their free ions, should be take into account for toxicity profile of material, since Ag either used as dopant or free ion showed significant antimicrobial effect [37]. Further research could address the antimicrobial effect of higher concentrations of metal dopants, since the modification of aspect ratio could reduce the photocatalytic activity, but higher load of Ag and Ga can increase cytotoxicity.

4. Materials and Methods

4.1. ZnO Nanoparticles Synthesis and Characterization

A ZnO nanoparticles colloidal solution was prepared following the procedure reported by Bahnemann et al [38] starting with a solution of 1 mM zinc acetate (Zn(CH3COO)2 Sigma, St. Louis, MO, USA, 99.99% trace metals basis) in 20 mL of 2-propanol ((CH3)2CHOH Sigma 99.5%) under stirring at 50 °C and then diluted in 230 mL of 2-propanol at room temperature. Later 20 mL of 20 mM NaOH (lentils, Jalmek, San Nicolas de los Garza, México) solution was added dropwise. Finally, the solution was kept in a water bath at 60 °C for 60 min. The nanoparticles presence was observed by high resolution transmission electron microscopy images in a JEOL JEM-2010 (Tokyo, Japan) at 200 kV.

4.2. ZnO Nanorods Microwave Synthesis on Polyethylene Substrate

A ZnO nanorods synthesis procedure reported by Baruah et al. [39] was modified in order to achieve more surface oxygen vacancies and hence improved the visible light absorption of the synthesized nanorods. First step was the thiolated of 1 × 1 in. square polyethylene (PE) substrates treating it with a 1% dodecanolthiol solution in methanol, in water bath at 100 °C for 15 min. The substrates were seeded by dipping the thiolated substrates into the prepared colloidal solution of ZnO nanoparticles in 2-propanol. Then the substrates were heated at 150 °C for 10 min to evaporate the solvent. The nanorods were grown by preparing a precursor solution in a chemical bath containing an equimolar 3 mM solution of zinc nitrate hexahydrate (Zn(NO3)2 × 6H2O, Sigma 99% purity) and hexamethylenetetramine (C6H12N4, Sigma 99.5%) in water and heating it with a commercially available microwave oven at 300 W for 60 min. The 0.1, 1, and 2 at % Ga doped ZnO nanorods and Ag doped nanorods were synthesized adding gallium oxide (Ga2O3, Sigma 99.99%) or silver nitrate (AgNO3, Jalmek, San Nicolas de los Garza, México, 99% purity) respectively to the precursor solution before heating at 300 W in a microwave oven (model WM1311DS, Whirlpool, Apodaca, México).

4.3. ZnO Nanorod Characterization

4.3.1. SEM

The synthesized doped and undoped ZnO nanorods morphology and size were characterized by scanning electron microscopy (SEM) using a JEOL-JIB 4500 microscope (Tokyo, Japan).

4.3.2. EDS

The elemental analyses of the synthesized nanorods were obtained in-situ in JEOL-JIB 4500 microscope equipped with an energy dispersive X-ray (EDS) microanalysis (OXFORD INCA Energy System, Concord, MA, USA) at an accelerating voltage of 15 kV.

4.3.3. CL

The optical properties of the grown nanowires were investigated in a JEOL-JIB 4500 microscope equipped with a Gatan MonoCL4 cathodoluminescence detector (Pleasanton, CA, USA).

4.4. Photocatalytic Performance

Photocatalytic performance experiments of the doped and undoped ZnO nanorods were achieved placing the nanorods/PE in a 6 mg/L methylene blue (MB) solution. The samples were then exposed to a fluorescent Phillips lamp (65 W, Amsterdam, Netherlands). The variation of the concentration of MB was measured spectrophotometrically every hour in an Agilent Cary 60 UV–Vis spectrophotometer (Santa Clara, CA, USA) at 664 nm wavelength.

4.5. Antimicrobial Evaluation

4.5.1. Bacterial Strains

Vibrio spp. and Escherichia coli Dh5α strains were kindly provided by Amelia Portillo and Ivone Giffard Mena academic researchers from Universidad Autónoma de Baja California (Baja California Autonomous University).

4.5.2. Growth Kinetics of Vibrio spp. and E. coli Using ZnO NRs

To determine the growth curve of Vibrio spp. and E. coli in presence of doped and undoped ZnO nanorods, bacterial cells were cultured in 50 mL LB broth at 25 or 37 °C overnight, respectively. Growth kinetics were performed in 5 mL capped slants after adding 5% inoculum from overnight cultures in LB supplemented with doped and undoped ZnO nanorods. A control group for each strain without any nanorods was also maintained but supplemented with ampicillin at 100 mg/mL. Each culture was supplemented with a ‘chip’ of 5 mm diameter of doped and undoped ZnO nanorods immobilized on PE. The absorbance at 595 nm was monitored every six hours in Cary UV–vis spectrophotometer (Agilent) at 25 or 37 °C with shaking for 48 h. For each strain, three independent growth curves were measured and the data were fitted.

5. Conclusions

This work shows that Ag and Ga can improve the photocatalytic and antimicrobial properties of ZnO nanorods, and it can be applied as an alternative material in PMR for water treatment systems. It also shows the important relationship of doping concentrations with the toxicity effect of the nanorods toward bacteria and the ZnO nanorods photocatalytic performance.

Author Contributions

Supervision, investigation and writing—original draft M.N.C.-C.; investigation and writing—original draft, A.V.-L.; Investigation A.V.-G.; writing—review and editing O.E.C.; writing—review and editing S.Á.; writing—review and editing J.M.R.-H.

Funding

This research work was supported by SEP through PRODEP UABC-PTC-644-511-6/17-8051 project, Conacyt through the Fordecyt project 272894 and UNAM through DGAPA-PAPIIT project IA103117.

Acknowledgments

We acknowledge SEP, Conacyt and UNAM for their financial support. We are thankful to Francisco Ruiz, Israel Gradilla, Eloisa Aparicio, Jesus A. Díaz, David Domínguez, Eduardo Murillo and Jaime Mendoza for technical assistance.

Conflicts of Interest

The authors declare no conflict of interest.

References

  1. Chong, M.N.; Jin, B.K.; Chow, C.W.K.; Saint, C. Recent developments in photocatalytic water treatment technology: A review. Water Res. 2010, 44, 2997–3027. [Google Scholar] [CrossRef] [PubMed]
  2. Molinari, R.; Lavorato, C.; Argurio, P. Recent progress of photocatalytic membrane reactors in water treatment and in synthesis of organic compounds. A review. Catal. Today 2017, 281, 144–164. [Google Scholar] [CrossRef]
  3. Schneider, J.; Matsuoka, M.; Takeuchi, M.; Zhang, J.; Horiuchi, Y.; Anpo, M.; Bahnemann, D.W. Understanding TiO2 Photocatalysis: Mechanisms and Materials. Chem. Rev. 2014, 114, 9919–9986. [Google Scholar] [CrossRef] [PubMed]
  4. Romanos, G.E.; Athanasekou, C.P.; Likodimos, V.; Aloupogiannis, P.; Falaras, P. Hybrid Ultrafiltration/Photocatalytic Membranes for Efficient Water Treatment. Ind. Eng. Chem. Res. 2013, 52, 13938–13947. [Google Scholar] [CrossRef]
  5. Zhao, L.; Deng, J.; Sun, P.; Liua, J.; Ji, Y.; Nakad, N.; Qiao, Z.; Tanaka, H.; Yang, Y. Nanomaterials for treating emerging contaminants in water by adsorption and photocatalysis: Systematic review and bibliometric analysis. Sci. Total Environ. 2018, 627, 1253–1263. [Google Scholar] [CrossRef]
  6. Zheng, X.; Shen, Z.-P.; Shi, L.; Cheng, R.; Yuan, D.-H. Photocatalytic Membrane Reactors (PMRs) in Water Treatment: Configurations and Influencing Factors. Catalysts 2017, 7, 224. [Google Scholar] [CrossRef]
  7. Athanasekou, C.P.; Moustakas, N.G.; Morales-Torres, S.; Pastrana-Martínez, L.M.; Figueiredo, J.L.; Faria, J.L.; Silva, A.M.T.; Dona-Rodriguez, J.M.; Romanos, G.E.; Falaras, P. Ceramic photocatalytic membranes for water filtration under UV and visible light. Appl. Catal. B 2015, 178, 12–19. [Google Scholar] [CrossRef]
  8. Zhang, Q.; Quan, X.; Wang, H.; Chen, S.; Su, Y.; Li, Z. Constructing a visible-light-driven photocatalytic membrane by g-C3N4 quantum dots and TiO2 nanotube array for enhanced water treatment. Sci. Rep. 2017, 7, 3128. [Google Scholar] [CrossRef]
  9. Cantarella, M.; Di Mauro, A.; Gulino, A.; Spitaleri, L.; Nicotra, G.; Privitera, V.; Impellizzeri, G. Selective photodegradation of paracetamol by molecularly imprinted ZnO nanonuts. Appl. Catal. B 2018, 238, 509–517. [Google Scholar] [CrossRef]
  10. Zhou, Q.; Wen, J.Z.; Zhao, P.; Anderson, W.A. Synthesis of Vertically-Aligned Zinc Oxide Nanowires and Their Application as a Photocatalyst. Nanomaterials 2017, 7, 9. [Google Scholar] [CrossRef]
  11. Vaiano, V.; Iervolino, G.; Rizzo, L. Cu-doped ZnO as efficient photocatalyst for the oxidation of arsenite to arsenate under visible light. Appl. Catal. B Environ. 2018, 238, 471–479. [Google Scholar] [CrossRef]
  12. Baruah, S.; Mahmood, M.A.; Myint, M.T.Z.; Bora, T.; Dutta, J. Enhanced visible light photocatalysis through fast crystallization of zinc oxide nanorods. Beilstein J. Nanotechnol. 2010, 1, 14–20. [Google Scholar] [CrossRef] [PubMed]
  13. Horikoshi, S.; Serpone, N. Microwaves in Nanoparticle Synthesis: Fundamentals and Applications; Wiley-VCH Verlag: Weinheim, Germany, 2013. [Google Scholar]
  14. Cravotto, G.; Carnaroglio, D. Microwave Chemistry; DeGruyterTextbook; De Gruyter: Berlin, Germany, 2017. [Google Scholar]
  15. Dąbrowska, S.; Chudoba, T.; Wojnarowicz, J.; Łojkowski, W. Current Trends in the Development of Microwave Reactors for the Synthesis of Nanomaterials in Laboratories and Industries: A Review. Crystals 2018, 8, 379. [Google Scholar] [CrossRef]
  16. Türkyılmaz, S.S.; Güy, N.; Özacar, M. Photocatalytic efficiencies of Ni, Mn, Fe and Ag doped ZnO nanostructures synthesized by hydrothermal method: The synergistic/antagonistic effect between ZnO and metals. J. Photochem. Photobiol. A Chem. 2017, 341, 39–50. [Google Scholar] [CrossRef]
  17. Ashebir, M.E.; Tesfamariam, G.M.; Nigussie, G.Y.; Gebreab, T.W. Structural, Optical, and Photocatalytic Activities of Ag-Doped and Mn-Doped ZnO Nanoparticles. J. Nanomater. 2018, 9. [Google Scholar] [CrossRef]
  18. Park, G.C.; Hwang, S.M.; Choi, J.H.; Kwon, Y.H.; Cho, H.K.; Kim, S.-W.; Lim, J.H.; Joo, J. Effects of In or Ga doping on the growth behavior and optical properties of ZnO nanorods fabricated by hydrothermal process. Phys. Status Solidi A 2013, 210, 1552–1556. [Google Scholar] [CrossRef]
  19. Minandri, F.; Bonchi, C.; Frangipani, E.; Imperi, F.; Visca, P. Promises and failures of gallium as an antibacterial agent. Future Microbiol. 2014, 9, 379–397. [Google Scholar] [CrossRef]
  20. Hijazi, S.; Visaggio, D.; Pirolo, M.; Frangipani, E.; Bernstein, L.; Visca, P. Antimicrobial Activity of Gallium Compounds on ESKAPE Pathogens. Front. Cell. Infect. Microbiol. 2018, 8, 316. [Google Scholar] [CrossRef]
  21. Rzhepishevska, O.; Ekstrand-Hammarstrom, B.; Popp, M.; Bjorn, E.; Bucht, A.; Sjostedt, A.; Antti, H.; Ramstedt, M. The Antibacterial Activity of Ga3+ Is Influenced by Ligand Complexation as Well as the Bacterial Carbon Source. Antimicrob. Agents Chemother. 2011, 55, 5568–5580. [Google Scholar] [CrossRef]
  22. Jung, W.K.; Koo, H.C.; Kim, K.W.; Shin, S.; Kim, S.H.; Park, Y.H. Antibacterial Activity and Mechanism of Action of the Silver Ion in Staphylococcus aureus and Escherichia coli. Appl. Environ. Microbiol. 2008, 74, 2171–2178. [Google Scholar] [CrossRef]
  23. Wang, L.; Chen, H.; Longquan, S. The Antimicrobial Activity of Nanoparticles: Present Situation and Prospects for the Future. Int. J. Nanomed. 2017, 12, 1227–1249. [Google Scholar] [CrossRef] [PubMed]
  24. Salomoni, R.; Leo, P.; Montemor, A.F.; Rinaldi, B.G.; Rodrigues, M.F.A. Antibacterial Effect of Silver Nanoparticles in Pseudomonas Aeruginosa. Nanotechnol. Sci. Appl. 2017, 10, 115–121. [Google Scholar]
  25. López-Esparza, J.; Espinosa-Cristóbal, L.F.; Donohue-Cornejo, A.; Reyes-López, S.Y. Antimicrobial Activity of Silver Nanoparticles in Polycaprolactone Nanofibers against Gram-Positive and Gram-Negative Bacteria. Ind. Eng. Chem. Res. 2016, 55, 12532–12538. [Google Scholar] [CrossRef]
  26. Le Ouay, B.; Stellacci, F. Antibacterial activity of silver nanoparticles: A surface science insight. Nano Today 2015, 10, 339–354. [Google Scholar] [CrossRef]
  27. Yue, L.; Zhang, Z.; Ma, Y.; Zhang, W. Effect of Na Doping on the Nanostructures and Electrical Properties of ZnO Nanorod Arrays. J. Nanomater. 2016, 22, 1–5. [Google Scholar] [CrossRef]
  28. Kong, Y.C.; Yu, D.P.; Zhang, B.; Fang, W.; Feng, S.Q. Ultraviolet-emitting ZnO nanowires synthesized by a chemical vapor deposition approach. Appl. Phys. Lett. 2001, 78, 407. [Google Scholar] [CrossRef]
  29. Tam, K.H.; Cheung, C.K.; Leung, Y.H.; Djurisic, A.B.; Ling, C.C.; Beling, C.D.; Fung, S.; Kwok, W.M.; Phillips, D.L.; Ding, L.; et al. Defects in ZnO nanorods prepared by a hydrothermal method. J. Phys. Chem. B 2006, 110, 20865–20871. [Google Scholar] [CrossRef]
  30. Ye, J.D.; Gu, S.L.; Zhu, S.M.; Liu, S.M.; Zheng, Y.D.; Zhang, R.; Shi, Y. Fermi-level band filling and band-gap renormalization in Ga-doped ZnO. Appl. Phys. Lett. 2005, 86, 192111. [Google Scholar] [CrossRef]
  31. Kuo, S.-T.; Tuan, W.-H.; Shieh, J.; Wang, S.-F. Effect of Ag on the microstructure and electrical properties of ZnO. J. Eur. Ceram. Soc. 2007, 27, 4521–4527. [Google Scholar] [CrossRef]
  32. Kakhki, R.M.; Tayebee, R.; Ahsani, F. New and highly efficient Ag doped ZnO visible nano photocatalyst for removing of methylene blue. J. Mater. Sci. Mater. Electron. 2017, 28, 5941–5952. [Google Scholar]
  33. Lu, W.; Gao, S.; Wang, J. One-pot synthesis of Ag/ZnO self-assembled 3D hollow microspheres with photocatalytic performance. J. Phys. Chem. C 2008, 112, 16792–16800. [Google Scholar] [CrossRef]
  34. Whang, T.-J.; Hsieh, M.-T.; Chen, H.-H. Visible-light photocatalytic degradation of methylene blue with laser-induced Ag/ZnO nanoparticles. Appl. Surf. Sci. 2012, 258, 2796–2801. [Google Scholar] [CrossRef]
  35. Liu, H.R.; Shao, G.X.; Zhao, J.F.; Zhang, Z.X.; Zhang, Y.; Liang, J.; Liu, X.G.; Jia, H.S.; Xu, B.S. Worm-like Ag/ZnO core-shell heterostructural composites: fabrication, characterization, and photocatalysis. J. Phys. Chem. C 2012, 116, 16182–16190. [Google Scholar] [CrossRef]
  36. Raghupathi, K.R.; Koodali, R.T.; Manna, A.C. Size-Dependent Bacterial Growth Inhibition and Mechanism of Antibacterial Activity of Zinc Oxide Nanoparticles. Langmuir 2011, 27, 4020–4028. [Google Scholar] [CrossRef]
  37. Choi, Y.; Kim, H.-A.; Kim, K.-W.; Lee, B.-T. Comparative toxicity of silver nanoparticles and silver ions to Escherichia coli. J. Environ. Sci. 2018, 66, 50–60. [Google Scholar] [CrossRef] [PubMed]
  38. Bahnemann, D.W.; Kormann, C.; Hofmann, M.R. Preparation and characterization of quantum size zinc oxide: A detailed spectroscopic study. J. Phys. Chem. 1987, 91, 3789–3798. [Google Scholar] [CrossRef]
  39. Baruah, S.; Thanachayanont, C.; Dutta, J. Growth of ZnO nanowires on nonwoven polyethylene fibers. Sci. Technol. Adv. Mater. 2008, 9, 025009. [Google Scholar] [CrossRef]
Figure 1. (a) Low-resolution transmission electron microscopy (TEM) micrograph of ZnO nanoparticles, (b) high resolution TEM micrograph of ZnO nanoparticles showing the lattice fringes.
Catalysts 09 00165 g001
Figure 2. SEM (scanning electron microscopy) images of the synthesized ZnO nanorods: (a) high magnification and (b) low magnification of undoped ZnO NRs; (c) Ga 0.1 at %.; (d) Ag 0.1 at %; (e) Ga 1.0 at %; (f) Ag 1.0 at %; (g) Ga 2.0 at %; and (h) Ag 2.0 at % doped ZnO NRs.
Catalysts 09 00165 g002
Figure 3. EDS (energy-dispersive X-ray spectroscopy) spectrums of (a) undoped ZnO NRs, (bd) Ga doped ZnO NRs, and (eg) Ag doped ZnO NRs. The insets show the atomic percentages of the found elements in the nanorods.
Catalysts 09 00165 g003
Figure 4. Cathodoluminescence spectrum of undoped ZnO NRs and (a) Ga doped ZnO NRs and (b) Ag doped ZnO NRs.
Catalysts 09 00165 g004
Figure 5. Methylene blue photodegradation under light irradiation from a fluorescent lamp for undoped, Ga and Ag doped ZnO NRs (inset: photocatalytic experiment).
Catalysts 09 00165 g005
Figure 6. (a) Vibrio spp. cell culture growth kinetics with doped and undoped ZnO NRs. (b) Tubes for growth kinetics experiment showing the ship of ZnO NRs. (c) E. coli cell culture growth kinetics with 2 at % doped and undoped ZnO NRs.
Catalysts 09 00165 g006
Table 1. Doped and undoped ZnO nanorods diameters obtained from scanning electron microscopy (SEM) images.
% At.Ga Doped ZnO NRs Diameter (nm)Ag Doped ZnO NRs Diameter (nm)
0.0150–250150–250
0.1100–200150–250
1.0150–250200–300
2.0300–500500–800

