Article

Mass and Heat Transfer Coefficients in Automotive Exhaust Catalytic Converter Channels

by
Chrysovalantis C. Templis
and
Nikos G. Papayannakos
*
School of Chemical Engineering, National Technical University of Athens, 9, Heroon Polytechniou Str., Gr-15780 Zografos, Athens, Greece
*
Author to whom correspondence should be addressed.
Catalysts 2019, 9(6), 507; https://doi.org/10.3390/catal9060507
Submission received: 9 May 2019 / Revised: 28 May 2019 / Accepted: 3 June 2019 / Published: 4 June 2019
(This article belongs to the Special Issue Reactors and Models in Catalysis)

Abstract

:
Mass and heat transfer coefficients (MTC and HTC) in automotive exhaust catalytic monolith channels are estimated and correlated for a wide range of gas velocities and prevailing conditions of small up to real size converters. The coefficient estimation is based on a two dimensional computational fluid dynamic (2-D CFD) model developed in Comsol Multiphysics, taking into account catalytic rates of a real catalytic converter. The effect of channel size and reaction rates on mass and heat transfer coefficients and the applicability of the proposed correlations at different conditions are discussed. The correlations proposed predict very satisfactorily the mass and heat transfer coefficients calculated from the 2-D CFD model along the channel length. The use of a one dimensional (1-D) simplified model that couples a plug flow reactor (PFR) with mass transport and heat transport effects using the mass and heat transfer correlations of this study is proved to be appropriate for the simulation of the monolith channel operation.

1. Introduction

The growing concern about the environmental impact of the exhaust emission pollutants has led to the need for the development of increasingly efficient exhaust gas after-treatment systems and catalytic converters [1].
In gasoline engine applications, the toxicity of exhaust emissions is reduced by employing catalytic converters as an afterburning reactor [2]. The catalytic converter is usually a multiple-channel reactor with a honeycomb structure. The catalytic combustion reactions occur in a thin washcoat of a catalyst on the reactor wall [3]. Although the flow in the exhaust piping of an engine is normally turbulent, Reynolds (Re) numbers in the converter monolith channels are always safely in the laminar region (Re < 300) [4] with fully developed flow in the greatest part of the reactor [3]. These structured reactors are characterized by enhanced heat and mass transfer, relatively low pressure drop, large geometric surface area and high catalyst efficiency due to the low thickness of the catalyst film that is deposited on the substrate wall and in which the heterogeneous chemical reactions take place [5].
A major simplification in models used in the literature is to represent the multiple-channel reactor by a single channel with the assumption of equivalent passages with no interaction [6,7]. The catalyst is assumed to be perfectly insulated and it is exposed to a uniform flow. The effects of thermal gradients in the radial direction are considered to be insignificant and the temperature and concentration profiles are assumed to be the same in all channels [6]. These assumptions simplify the problem significantly leading to a “single channel” model, and the performance predicted for one channel can be extended to the entire reactor [1].
Two broadly classified hierarchical models are used in the literature: Three- or two-dimensional (3-D or 2-D) convection–diffusion models with a wall reaction [8,9,10,11] and 1-D models, which describe the axial variation of a radially average concentration and temperature in a channel cross-section [2,6,8,12,13,14]. Over the years, 1-D models became more popular because of their simplicity and the less computational time required for the solution of the pertinent differential equations [6] while they provide sufficiently accurate predictions and also allow for fast kinetic investigations.
The catalyst performance is influenced by the mass and heat transfer from the exhaust gases to the catalyst surface [2]. Hence, a correct description of the mass and heat transfer processes is important in catalyst models and simulation. The mass and heat transfer coefficients introduced in the 1-D models are often expressed in terms of dimensionless numbers Sherwood (Sh) and Nusselt (Nu) and they depend on various parameters, such as shape and dimensions of the channel, fluid properties, flow rates, washcoat characteristics and reaction rates [7,15]. It is very difficult, if not impossible, to experimentally measure local concentrations and temperatures, and especially wall concentrations and temperatures in narrow channel monoliths [16], but the mass and heat transfer coefficients may be computed from the radial temperature and concentration gradients computed by using two or three dimensional models [3,7].
Various correlations have been proposed concerning the mass transfer coefficient in monolithic reactors based on experiments [6,8,17,18,19,20,21]. Correlations of heat and mass transfer coefficient based on numerical solutions through channels have also been published in literature [12,15,17,22,23,24,25,26]. The experimentally estimated values of transfer coefficients correspond to the average values in the reactor, while estimations from numerical solutions resulted in coefficients as a function of channel length.
For the mass/heat transport two limiting cases of boundary conditions are extensively discussed in the literature for common channel geometries. In the one case the concentration/temperature on the wall is considered constant (NuT, ShT) and in the other one the mass and heat fluxes to and through the wall is constant (NuF, ShF). However, in the case of catalytically reacting fluids the boundary conditions at the wall are not constant, which might lead to different values of Nu and Sh numbers. Groppi et al. [27] proposed an interpolation formula between NuT and NuF with the introduction of the Damkohler number (Da) for the calculation of the local Nu at reacting conditions.
Using a constant value for Sherwood and Nusselt numbers and not taking into account the dependence on the velocity or position and reaction parameters may lead to the incorrect prediction of the ignition and extinction points for exothermic surface catalyzed reactions [2,15]. Since Sherwood and Nusselt numbers can have a significant effect on the predicted emissions for automotive catalysts, accurate knowledge of mass transfer coefficients is essential for 1-D mathematical modeling of the converter performance [6] and local values of heat and mass transfer coefficients are needed for the correct simulation of the monolithic converters operation [2,3].
Sh correlations in monolith channels at reaction conditions have been proposed in the literature [15], however they have been derived considering only one first order reaction taking place in the washcoat. Arrighetti et al. [11] used a computational fluid dynamics three-dimensional (3-D) model coupled to a surface chemistry solver (Cantera) for the calculation of Sh and Nu along the monolith length in a multi-component gas phase, but they did not propose any correlation. The latter publication indicates that the traditional correlations, as well as the use of heat/mass transfer analogy that is commonly used in simulations, may give remarkable errors in the evaluation of the converter performance. Hayes and Kolaczkowski [16], Groppi et al. [27] and Heck et al. [28] calculated Nu at non-isothermal reacting conditions but they did not provide correlations of the Sh and Nu with the operating conditions and the position of the channel.
The objective of this work is the estimation and the development of correlations for mass transfer coefficients of species and heat transfer coefficient from the bulk of the gas phase to channel wall according to the thin film theory, considering a real multi-component gas mixture and representative kinetics of the reactions taking place on the channel wall of automotive converters. The MTCs and HTCs were calculated and correlated for a circular channel as most of the monolith cross section shapes, square, hexagonal and of course circular, closely resemble a circular cross section after wash coating during which the wash coat preferentially covers the edges of the monolithic structures. The transfer coefficients were correlated along the monolith cell length using dimensionless numbers taking into account fluid properties and geometric characteristics. The proposed correlations have been developed for a wide range of velocities and conditions and therefore, they can be used in simulation studies not only from lab up to real size automotive catalytic converters but also for a wide range of monolithic reactors operating with gas feeds.

2. Models

2.1. 2-D Computational Fluid Dynamic (CFD) Models

The mass transfer coefficients of each species in the gas mixture and the heat transfer coefficient were calculated along the monolith channel length according to the thin film theory by developing and running detailed 2-D computational fluid dynamic (CFD) models in Comsol Multiphysics and combining their results with a 1-D model in which mass and heat transfer coefficients account for transport phenomena. For the determination of the mass transfer coefficients, an isothermal CFD model incorporating the momentum and mass transport phenomena inside the monolith channel was used. For the determination of the heat transfer coefficient, a non-isothermal CFD model incorporating in detail the momentum, mass and heat transport in the monolith channel was employed.
The CFD calculations were performed by considering a typical monolithic converter with cylindrical cells of 1.1 mm internal diameter and a 2-D geometry of the cylindrical monolith channel with axial symmetry.
The computation of heat and mass transfer fluxes requires the knowledge of kinetics, and the kinetic model is of crucial importance in the calculation of the total conversion rates and evidently of the pertinent transfer coefficients. In this study, a technical kinetic model of the reactions taking place in a typical commercial automotive converter was used. All the reactions were considered to be heterogeneously catalyzed by the active species in the washcoat on the channel walls. The technical kinetic model was determined using experimental data that were obtained with a commercial cordierite monolithic converter in crushed form and a size range of 250–350 μm. All the data for the estimation of the reaction kinetics are given in Supplementary Materials (S.M.).

2.1.1. Isothermal 2-D CFD Model

The isothermal CFD model incorporates in detail the momentum and mass transport through the monolith channel at isothermal conditions.
For the momentum transport the Incompressible Navier Stokes equations were used to describe the laminar and isothermal flow of the gas mixture.
ρ u u = [ p I + μ ( u + ( u ) T ) ] ,
u = 0 .
The gas phase was considered to be a mixture of ideal gases. The no slip condition was set on the channel wall. Normal inflow velocity was set as the boundary condition at the inlet of the channel and the ambient pressure and no viscous stress condition was set at the cell outlet.
A convective and diffusive model according to Fick’s law was used to describe mass transport in the gas phase as the diffusing species were dilute with respect to the abundant N2.
( D i C i ) + u C i = 0 .
The heterogeneous reactions that take place on the washcoat were set as a mass flux boundary condition on the wall of the washcoat that is in contact with the gas phase. No diffusion in the normal direction was considered at the outlet (convective flux boundary condition). The gas feed composition was set as the boundary condition at the cell inlet. Convective transport inside the porous washcoat was neglected.
The boundary conditions for the momentum and mass transport in the isothermal CFD model are summarized in Table 1.

2.1.2. Non-Isothermal 2-D CFD Model

The non-isothermal CFD model incorporates in detail the momentum, mass and heat transport through the monolith channel. For the CFD calculations, momentum, mass and heat transport partial differential equations (PDE’s) were coupled and solved simultaneously.
For the momentum transport the weakly compressible Navier Stokes equations were used to describe the laminar and non-isothermal flow of the gas mixture through the channel,
ρ u u = [ p I + μ ( u + ( u ) T ) 2 μ 3 ( u ) Ι ] ,
( ρ u ) = 0 .
A convective and diffusive model according to Fick’s law was also used in this model to describe mass transport in the gas phase as the diffusing species were dilute with respect to N2 excess,
( D i C i + C i u ) = 0 .
For the heat transport, a convective and conductive model was used to describe the heat transport in the gas phase,
( k T ) = ρ C p u T ,
ρ = M n ( p + p ref ) R g T .
In the gas phase, there was no heat source or sink, as the homogeneous reactions were not taken into account. As the reaction was considered taking place on the wall of the washcoat, which is in contact with the gas phase, similarly the heat of reaction released was set as a boundary condition on the wall,
q ( T ) = R j Δ H R j ( T ) .
The channel was considered to be adiabatic. No conduction in the normal direction was considered at the gas phase outlet (convective flux boundary condition). The inlet gas feed temperature was set as the boundary condition at the cell inlet.
The boundary conditions for the momentum, mass and heat transport in the non-isothermal 2-D CFD model are summarized in Table 2.

2.2. 1-D Thin Film Model

A 1-D simplified model that couples a plug flow reactor (PFR) with mass and heat transport effects according to the thin film theory, using the correlation for mass and heat transfer of this study, has been developed. The mathematical model consists of the differential mass balances, one for each component that takes part in the reactions and appears in the kinetic model, the differential heat balance and the algebraic equations for mass and heat transfer.
dC CO , b dz = ( R 1 R 5 + 3 R 6 + R 7 + 3 R 8 ) S v u ,
dC NO , b dz = R 5 S v u ,
dC CH 4 , b dz = ( R 2 R 7 ) S v u ,
dC C 3 H 6 , b dz = ( R 3 R 8 ) S v u ,
dC C 3 H 8 , b dz = ( R 4 R 6 ) S v u ,
dC O 2 , b dz = ( 0 . 5 R 1 2 R 2 4 . 5 R 3 5 R 4 ) S v u ,
dC H 2 O , b dz = ( 2 R 2 + 3 R 3 + 4 R 4 3 R 6 R 7 3 R 8 ) S v u .
At non-isothermal conditions, the differential heat balance is also solved.
dT b dz = ( R j Δ HR j ) S v ρ uCp .
The algebraic equations for mass transport of each component i according to the thin film theory is:
R i = K gs , i ( C i , s C i , b ) .
The algebraic equations for heat transport according to the thin film theory is:
( R j Δ HR j ) = K t ( T s T b ) .
The reactions and the reaction rate equations are given by Equations S1.1–S8.2 involved in Supplementary Materials.
The differential mass balances were solved using the Runge Kutta 4th order method and Fortran programming language.

2.3. Conditions of Calculations

The calculations of the mass and heat transfer coefficients were performed for inlet temperatures 200, 300, 400 and 500 °C. Forty in total interstitial velocities (ten velocities at each temperature) within the range of 0.028–7.2 m/s covering the total range of the working conditions with a laboratory and real size monolith and two gas feed compositions, lean and rich as described in Table S1 given in Supplementary Materials, were tested. The gas–solid mass transfer coefficients for six species NO, CO, O2, CH4, C3H6 and C3H8 were calculated. A total cell length of 1 cm was tested for the low velocities and of 12 cm for the high velocities. The conditions selected to perform simulations for the calculation of the gas–solid mass transfer coefficients are summarized in Table 3.

3. Mass Transfer Coefficients

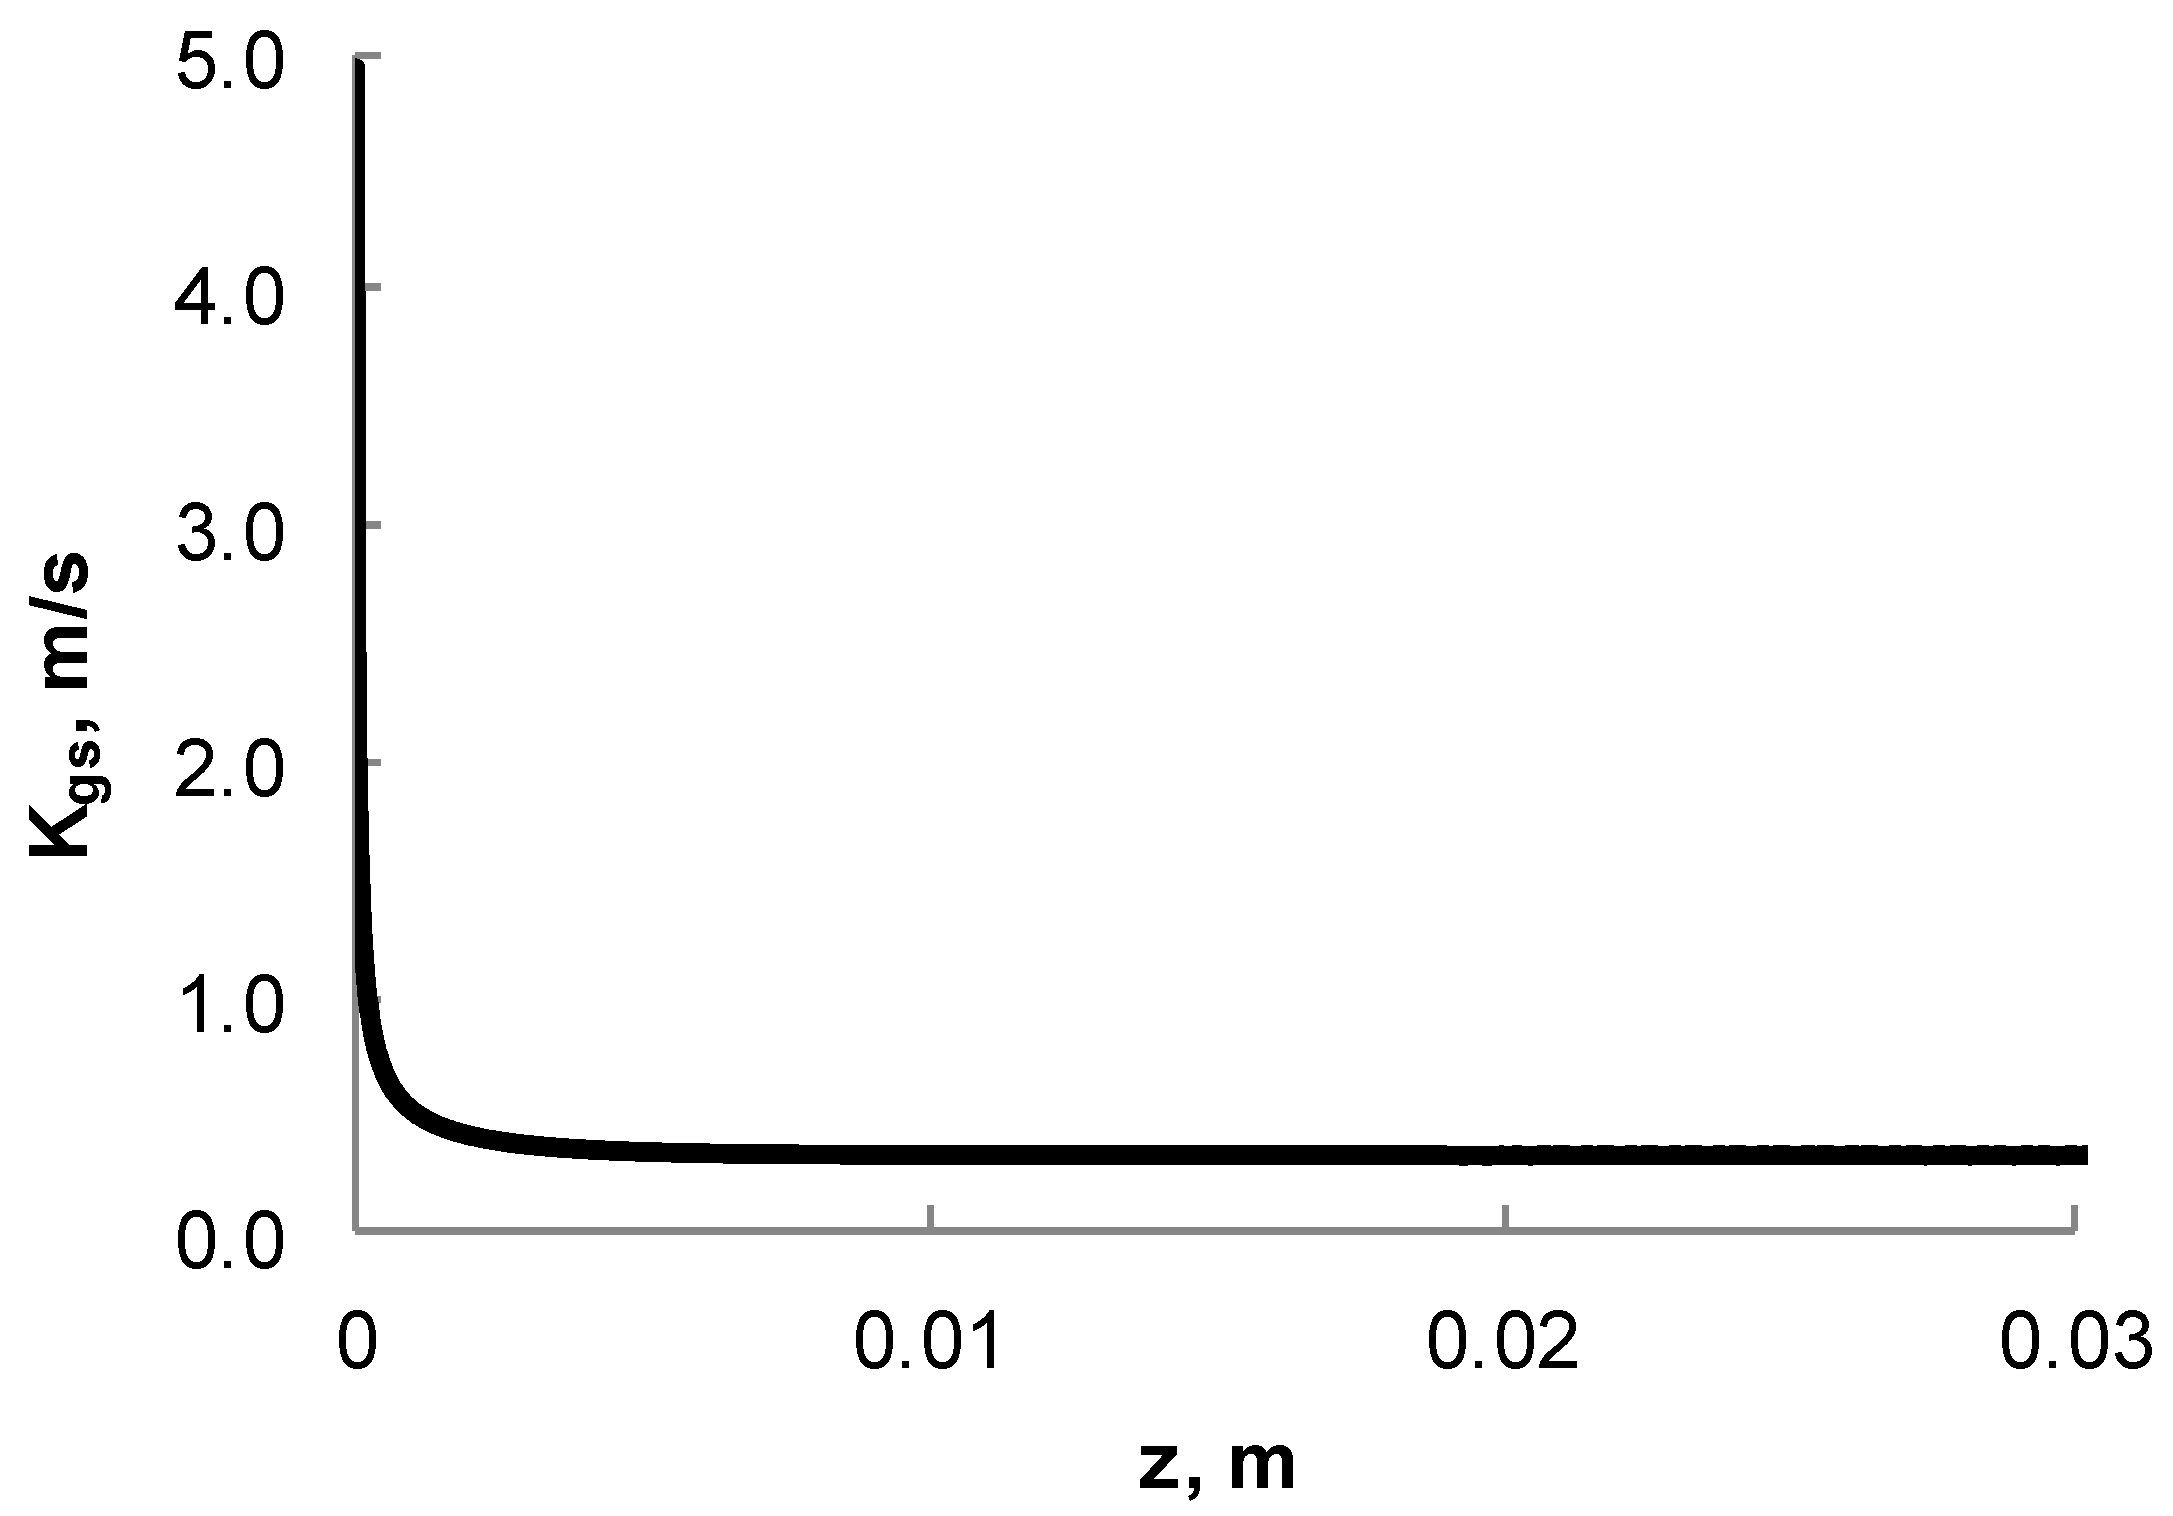
3.1. Calculation of Effective Gas–Solid Mass Transfer Coefficient Profiles Along the Channel

The effective mass transfer coefficients Kgs,i for each component i, were calculated according to the thin film theory, running the detailed 2-D CFD model and combining its results with the following 1-D model equation along the channel length:
( R i ) z = ( K gs , i ) z ( ( C i , s ) z ( C i , b ) z ) ,
where (Ri)z represents the reaction rate at the position z of the cell length coordinate expressed per square meter of the washcoat wall, (Ci,s)z corresponds to the component’s i concentration at the position z of the cell length coordinate on the wash coat and (Ci,b)z stands for the mean bulk concentration at the position z of the cell length coordinate. The mean concentration of the component i along the channel radius was calculated by Equation (21).
( C i , b ) z = ( C i u ) z ( u ) z ,
where
( C i   u ) z = ( 1 π R 2 ) r = 0 r = R ( C i ) z , r ( u ) z , r 2 π r dr ,
( u ) z = ( 1 π R 2 ) r = 0 r = R ( u ) z , r 2 π r dr .
The mass transfer coefficients change with the coordinate of the length, z. A typical profile of mass transfer coefficient along the monolith cell length is presented in Figure 1.
As shown in Figure 1 the mass transfer coefficient near the entrance had a high value and it steeply decreased with length at the first millimeter from the cell entrance, and then after some millimeters it reached a plateau, and remained constant for the rest of the length. This is due to the fact that at the entrance of the channel the concentration of the reactants is uniform along the channel radius and the difference between the concentration in the bulk of the gas phase and in the gas phase over the washcoat is very small while the reaction rates are high due to the high surface concentration of the reactants. Thus, the mass transfer coefficient appears to be high close to the entrance and decreases with the channel length, as concentration profiles are developed along the radius.

3.2. Correlation of the Effective Gas–Solid Mass Transfer Kgs,i

The mass transfer coefficients were correlated along the monolith cell length using the dimensionless numbers of Sherwood, Schmidt and Reynolds numbers according to the following equation form, which has been proposed by Grigul and Tratz [22]:
Sh ( z ) = a + b ( z * 10 3 ) c exp ( e z * ) ,
where:
z * = z d 1 Re Sc ,
Sc = μ ρ D i ,
Re = ρ   u   d μ ,
Sh = K gs , i d D i .
The parameter a is related to the Kgs,i value at which the Kgs,i profile is stabilized and reaches a plateau, the parameter b is related to the initial value that the Kgs,i takes on the cell entrance and the parameters c and d are related to the curvature of the profile during the profile drop and the length from the entrance that is demanded for the Kgs,i profile to be stabilized reaching a plateau.
The final correlation was derived using four hundred and eighty (480) profiles of gas–solid mass transfer coefficients Kgs,i along the cell length at the tested conditions (six species, four temperatures for each species, 10 velocities at each temperature and two gas feed compositions). The Re number at the tested conditions lies within the range 0.51–122 and the Schmidt (Sc) number lies within the range 0.63–1.31.

3.2.1. Correlation Parameters

For the lean and the rich feed compositions the same correlation of the gas–solid mass transfer coefficient Kgs,i resulted. For the best fitting of the correlation to the Kgs,i profiles derived from CFD calculations and thus for their better prediction, different Sh correlations are proposed for the groups of species CO, NO and O2 from one side and hydrocarbons CH4, C3H6 and C3H8 to the other side. Sh correlations, which are chemical species dependent, have been also reported by Santos and Costa [6]. For an Re lower than 27.5, Re does not affect the Kgs,i profile and in this case Re must be considered equal to 27.5 for all species for a better prediction of the proposed correlation.

Mass Transfer Correlation for Species CO, NO and O2

For the species CO, NO and O2 a branched correlation derived. The best fitting of the correlation to the Kgs,i profiles derived from CFD calculations was achieved for parameters:
if   u 298 T ( K ) > 0.232   m / s if   u 298 T ( K ) < 0.232   m / s while   if   Re < 27.5 } a = 4.2 , b = 18 , c = 0.55 , e = 40 ; a = 4.2 0.389 * ln [ u * 298 / T ] 0.5857 , b = 18 , c = 0.55 , e = 70 ; Re = 27.5 .

Mass Transfer Correlation for Hydrocarbons CH4, C3H6 and C3H8

For hydrocarbons also a branched correlation was derived. Using common correlation parameters for all the hydrocarbon species, the best fitting of the correlation to the Kgs,i profiles derived from CFD calculations was achieved for the parameters reported below.
For   Re > 0.51 a = 4.25 , b = 16.5 , c = 0.7 , e = 40 ; while   if   Re < 27.5 Re = 27.5 .

3.2.2. Mass Transfer Correlation Fitting

In Figure 2 typical cases of the correlation fitting to mass transfer coefficients Kgs,i profile along the monolith cell as derived from CFD calculations are presented for all the species at the middle interstitial velocity and Re. In these Figures the concentration profiles of species in the bulk of the gas phase and in the gas phase over the catalytic surface are also presented. In Figure 2 the fitting up to length L/10 (where L is the total length of the monolith converter) is presented, while for the rest of the channel a plateau was reached.
In Figure 3, the parity plot for the asymptotic values of the Kgs,i profiles, i.e., practically for z > L/10, for all the species and at all the tested conditions are presented.
For the asymptotic values of the Kgs,i profiles a very good fitting was achieved for the species NO, CO and O2 with a maximum deviation less than 4%. For the species C3H6, C3H8 and CH4 a maximum deviation of 20% was achieved between the predicted values and the calculated ones with the detailed CFD model.
The average relative error of prediction of the mass transfer coefficient for CO was 2.1%, for NO 2.3% and for O2 2.6% while for CH4 it was 3.7%, for C3H8 4.2% and for C3H6 7%. These deviations are low and their effects in simulation results were negligible.
The effect of the cell diameter on the mass transfer correlation fitting was tested by conducting CFD calculations with two more cell diameters, 0.9 and 1.3 mm. It was proven that the proposed correlation fit very well to the calculated Kgs,i profiles of each species for the two other cell diameters tested. The error of prediction was the same to the one calculated for the cell diameter 1.1 mm for which the correlation was derived.
The effect of the reaction rate on the mass transfer correlation fitting was also tested by conducting calculations with one order of magnitude lower and higher reaction rates for all the reactions taking place. Extreme cases were selected, one order of magnitude lower reaction rates were tested at low temperature 300 °C and one order of magnitude higher reaction rates were tested at high temperature 500 °C. In the case of using one order of magnitude higher reaction rates at 500 °C the average relative prediction error of the correlation was 10.6% for CO, 6.6% for NO, 4.5% for O2, 10.7% for C3H6, 8.6% for C3H8 and 5.4% for CH4. In the case of using one order of magnitude lower reaction rates at 300 °C the average relative prediction error of the correlation was 7.6% for CO, 8.1% for NO, 8.1% for O2, 8.7% for C3H6, 3.3% for C3H8 and 2.4% for CH4.

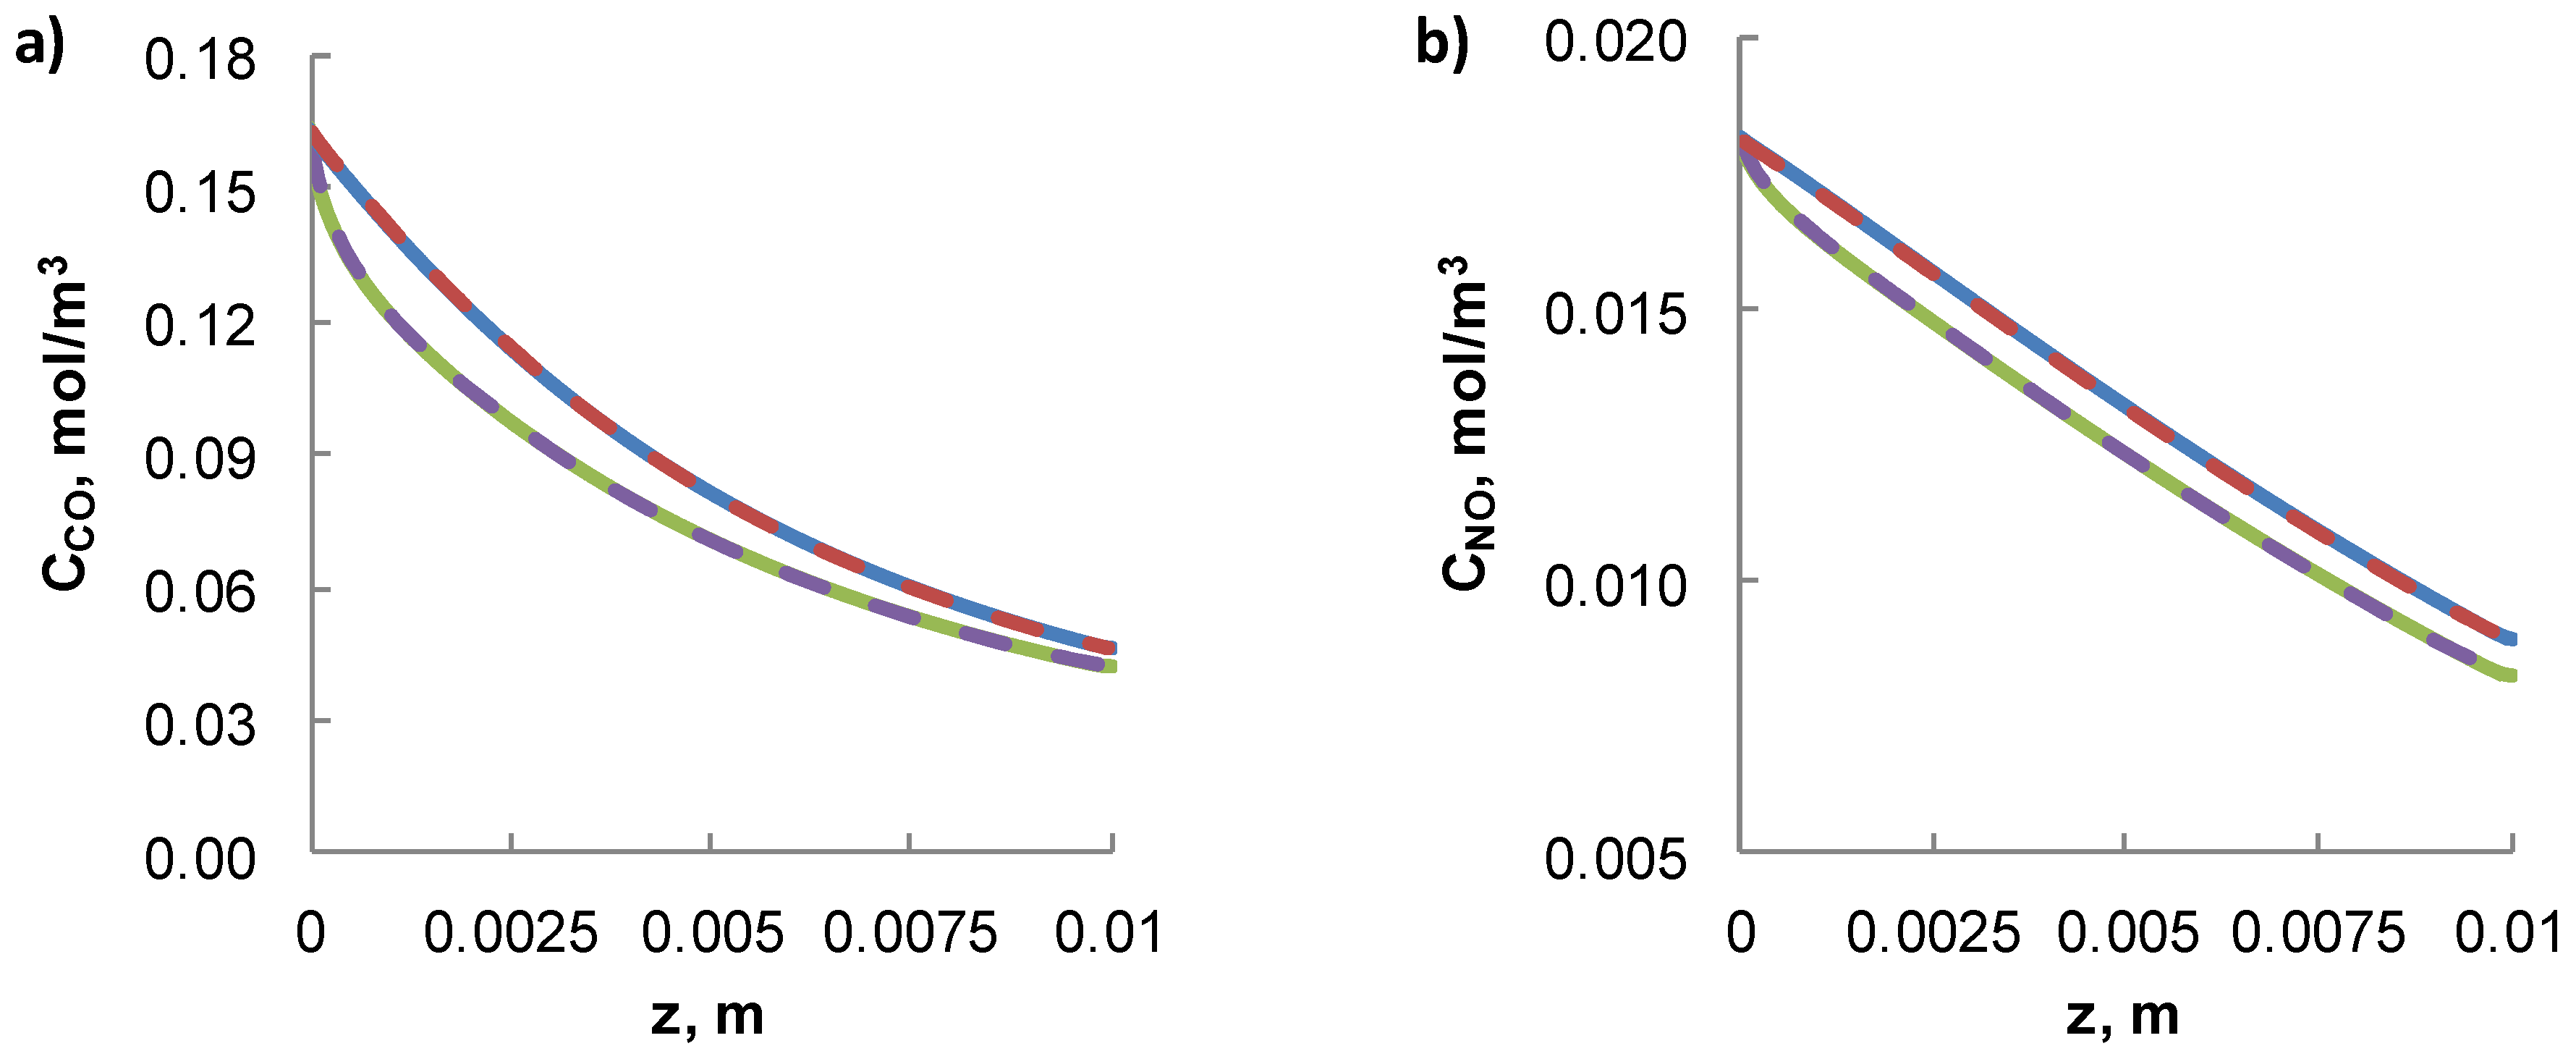
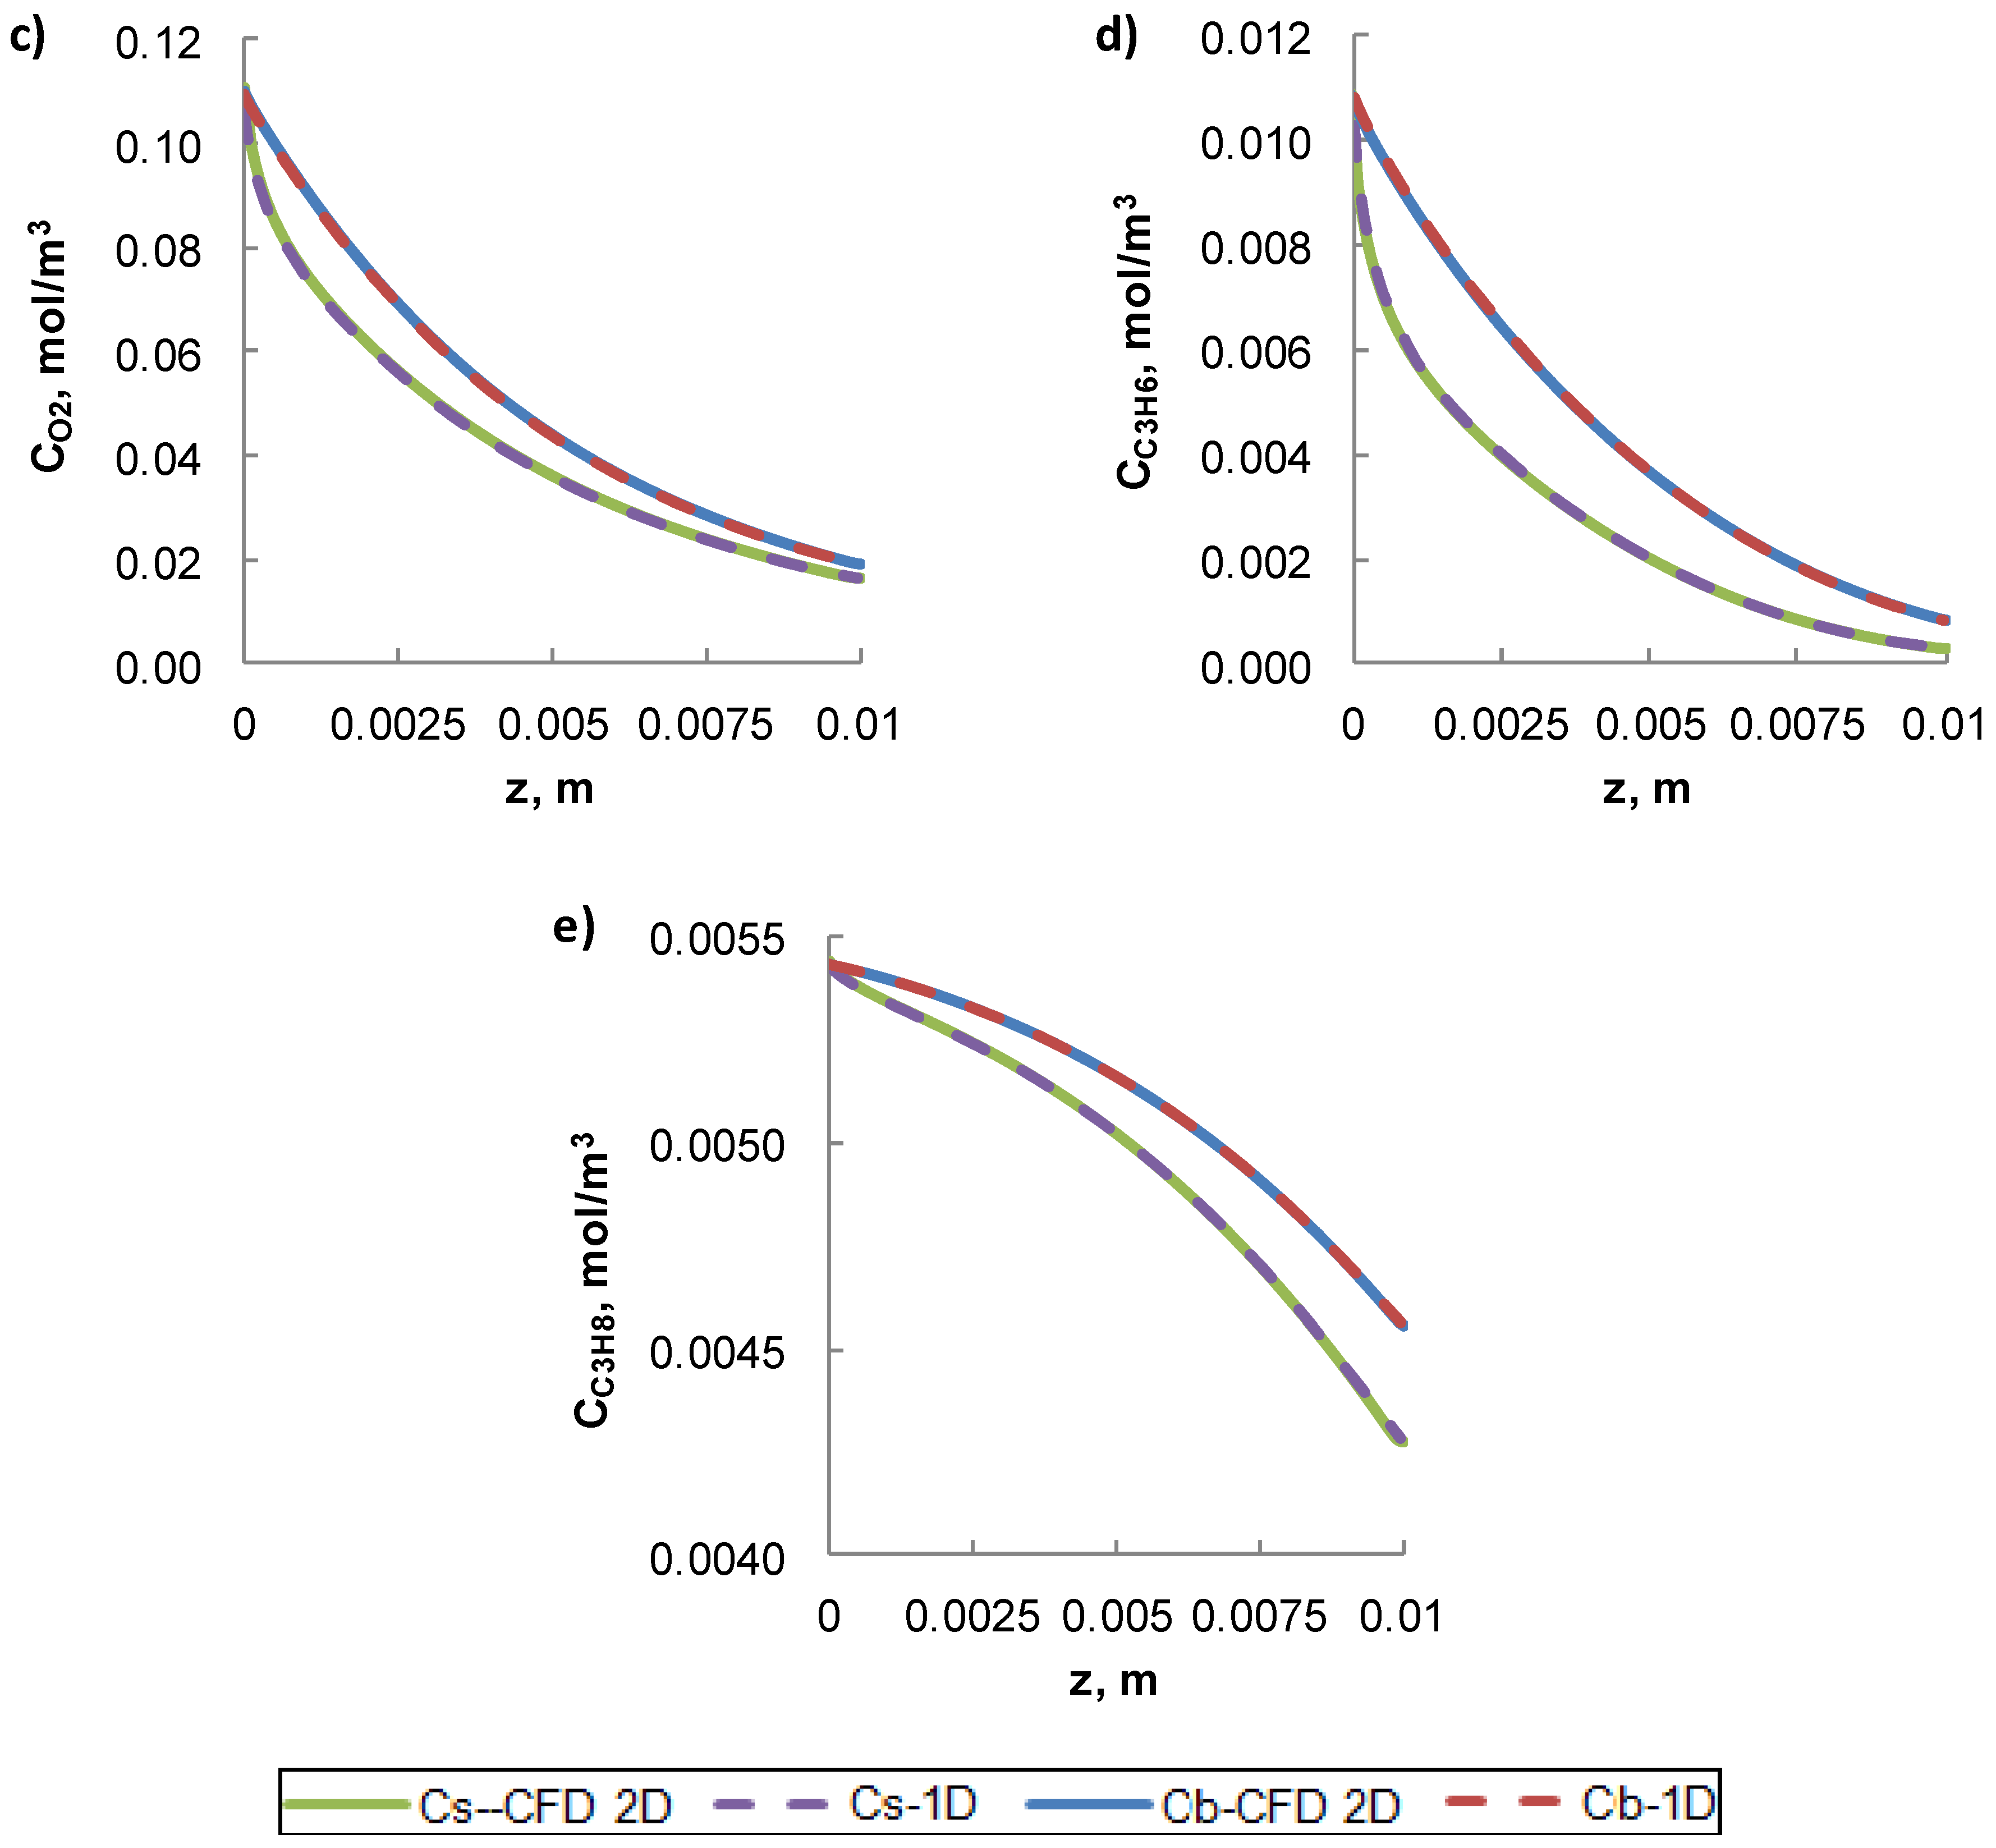
3.3. 2-D Isothermal CFD Model vs 1-D Isothermal Simplified Model

The effectiveness of a 1-D simplified model that couples PFR with mass transport effects using the correlation for mass transfer of this study was also tested. In Figure 4 a typical diagram of the concentration profiles derived from the 2-D CFD model and the concentration profiles derived from the 1-D model combined with the proposed 1-D correlation for mass transfer are presented for all the species.
From the concentration profiles of Figure 4 the operation of monolith was successfully simulated using a 1-D PFR model coupled with gas–solid mass transfer effects as described by the effective mass transfer coefficient derived from the proposed correlation and the predictions are the same like those with the detailed 2-D CFD model.

3.4. Comparison with Other Published Correlations

In Figure 5, a comparison of the mass transfer coefficients in monolith channels predicted by correlations proposed in this work and by Ramanathan et al. [12] and Grigul and Tratz [22] is presented. The correlations proposed by Ramanathan et al. [12] were derived for developing flow and constant wall flux (ShF) while those proposed by Grigul and Tratz [22] were derived for fully developed flow and constant wall flux (ShF) and constant wall concentration (ShT). Typical diagrams of mass transfer coefficient for CO along the cell length at temperature 400 °C are presented for five values of Re in the range of the Re tested.
The correlations published by Ramanathan et al. [12] and Grigul and Tratz [22] show deviation of the mass transfer coefficient at the initial part that the mass transfer coefficient decreases with the cell length. The error of prediction at this part is getting significantly big especially at low velocities. The correlations published by Ramanathan et al. [12] and Grigul and Tratz [22] for the constant wall flux fit satisfactorily to the asymptotic values that were predicted with the correlation of this study. Some deviations that are not high were observed for the lower velocities.

4. Heat Transfer Coefficients

4.1. Calculation of Effective Heat Transfer Coefficient Profiles Along the Cell

The effective heat transfer coefficient Kt, was calculated running the detailed non-isothermal 2-D CFD model and combining its results with the following 1-D model equation along the channel length:
( q ) z = ( K t ) z ( ( T s ) z ( T b ) z ) .
For the calculation of the bulk temperature profiles along the cell’s length, the mean radial temperature was calculated at each ordinate of the length according to the following equation:
( T b ) z = ( 1 π R 2 ) r = 0 r = R ( T ) z , r 2 π r dr ) .
The heat transfer coefficient changes with the coordinate of the length z. A typical profile of heat transfer coefficient along the monolith cell length is presented in Figure 6.
As shown in Figure 6 the heat transfer coefficient near the entrance has a high value and it steeply decreases at the first mms from the cell entrance, reaching in some cases a plateau or having a small inclination with the length at high velocities.

4.2. Correlation of the Heat Transfer Coefficient Kt

The heat transfer coefficient values along the monolith cell length were correlated with operating conditions by using dimensionless numbers of Nusselt, Prandtl and Reynolds according to the following equation:
Nu ( z ) = a + b ( z * 10 3 ) c exp ( e z * ) ,
where:
z * = z d 1 Re Pr ,
Pr = μ C p k ,
Nu = K t d k .
The parameter a is related to the Kt value at which the heat transfer coefficient reaches a plateau or alters less significantly with the cell length, away from the cell entrance; the parameter b is related to the initial value that the Kt takes at the cell entrance, and the parameters c and d are related with the curvature of the profile and the distance from the entrance that is demanded for the Kt profile to level off.
The final correlation was derived using eighty (80) profiles of heat transfer coefficient Kt along the cell length at the tested conditions. The Re number at the tested conditions lies within the range 0.51–101.

4.2.1. Heat Transfer Correlation Parameters

For Re lower than 27.5 the Re does not affect the Kt profile and in this case for a better prediction of the proposed correlation, Re must be considered equal to Re = 27.5. Therefore a branched correlation was derived from the fitting of correlation to the Kt profiles that were resulted from CFD calculations.
The best fitting of the correlation to the calculated Kt profiles derived from CFD calculations was achieved for the following parameters.
if   u 298 T ( K ) > 0.232   m / s if   u 298 T ( K ) < 0.232   m / s if   Re < 27.5 } a = 5.9 , b = 23 , c = 0.7 , d = 40 ; a = 5.9 0.389 * ln [ u * 298 / T ] 0.5857 , b = 23 , c = 0.7 , d = 70 ; Re = 27.5 .
Due to the non-isothermal conditions, the temperature changes along the monolith channel length and thus the gas phase properties such as density, velocity, viscosity, thermal capacity and thermal conductivity must be calculated at each point. For the estimation of the correlation parameters, the alteration of the gas phase properties along the monolith channel was taken into account.
The mean radial property along the channel length was calculated according to the following equation:
( prop ) z = ( 1 π R 2 ) r = 0 r = R ( prop ) z , r 2 π r dr ,
where prop is the desirable property to be calculated.

4.2.2. Heat Transfer Correlation Fitting

In Figure 7, typical cases of the correlation fitting to the heat transfer coefficient Kt profile along the monolith cell as derived from CFD calculations are presented at low, middle and high velocities and Re. In these figures the temperature profiles of the bulk of the gas phase and of the gas phase over the catalytic surface are also presented.
The average relative error of prediction for the heat transfer coefficients is 2.2%.
The effect of the cell diameter on the heat transfer correlation fitting was tested by conducting calculations with two more cell diameters 0.9 and 1.3 mm. The proposed heat transfer correlation fits very well to the calculated Kt profile for the two other cell diameters tested. The error of prediction is the same to the one calculated for the cell diameter 1.1 mm for which the correlation was derived.
The effect of the reaction rates on the heat transfer correlation fitting was tested by conducting calculations with one order of magnitude lower and higher reaction rates for all the reactions taking place. Extreme cases were selected for the tests, one order of magnitude lower reaction rates at low temperature 300 °C and one order of magnitude higher reaction rates at high temperature 500 °C. In the case of using one order of magnitude higher reaction rates at 500 °C the average relative prediction error of the heat transfer correlation was 3.7%. In the case of using one order of magnitude lower reaction rates at 300 °C the average relative prediction error of the heat transfer correlation was 3.5%.

4.3. Non-Isothermal 2-D CFD Model vs Non-Isothermal 1-D Simplified Model

The effectiveness of the non-isothermal 1-D simplified model that couples PFR with mass and heat transport effects using the correlations for mass and heat transfer of this study was also tested. In Figure 8, a typical diagram of the profiles of the temperature difference between the surface and bulk gas temperature derived from the non-isothermal 2-D CFD model and the profiles derived from the non-isothermal 1-D model combined with the proposed 1-D correlation for mass and heat transfer are presented.
From the temperature profiles of Figure 8 it was implied that the operation of monolith was successfully simulated using a 1-D PFR model coupled with mass and heat transfer effects as described by the proposed correlations of this study, and the predictions were practically the same like those with the detailed 2-D CFD model.

4.4. Comparison with Other Published Correlations

In Figure 9, a comparison between the heat transfer coefficient calculated by the proposed correlation in this study and by the correlation proposed by Ramanathan et al. [12] for developing flow and constant wall flux (NuF) and by Grigul and Tratz [22] for fully developed flow with constant wall flux (NuF) and wall temperature (NuT) is presented. Typical diagrams of heat transfer coefficient along the cell length at temperature 400 °C are presented for five values of Re in the range of the Re tested.
The heat transfer correlations published by Ramanathan et al. [12] and Grigul and Tratz [22] for the case of the constant wall flux and constant wall temperature show deviations from the prediction of the correlation derived from the CFD calculations in this paper. The differences were very high close to the entrance of the monolith and especially at low gas velocities. The correlation derived from the CFD calculations in this paper shows higher asymptotic values in comparison to the asymptotic values derived from both the constant wall flux NuF and constant wall temperature NuT correlations of Ramanathan et al. [12] and Grigul and Tratz [22].

5. Conclusions

The mass and heat transfer correlations proposed in this work predicted satisfactorily the mass and heat transfer coefficients profiles along the monolith channel length that were calculated according to thin film theory using the 2-D CFD model within a wide range of velocities and conditions for lab up to real size monoliths.
The fitting of the proposed relations was proven to be very satisfactory for a wide range of reaction rates for all the reactions taking place during operation. The applicability of the correlation was also satisfactory for two other channel diameters 0.9 and 1.3 mm.
Comparing the predictions of the proposed correlations in this study for the mass transfer coefficient with those of other published correlations reveals high deviations at the initial part of the channel where the mass transfer coefficient decreases with the cell length. This is attributed to the fact that the correlations published by Ramanathan et al. [12] were derived for constant wall flux (ShF) and by Grigul and Tratz [22] for constant wall flux (ShF) and constant wall concentrations (ShT). In the case of the constant wall flux, published correlations fitted satisfactorily to the asymptotic Kgs values predicted by the correlation of this study. However, those correlations predicted lower Kt values and high deviations from the heat transfer coefficient profiles predicted by the correlation of this study.
A 1-D PFR model coupled with gas–solid mass transfer effects and heat transfer effects by using the proposed mass and heat transfer correlations of this study, successfully simulates the operation of monolith channel, giving the same results with the 2-D CFD model.

Supplementary Materials

The following are available online at https://www.mdpi.com/2073-4344/9/6/507/s1, Table S1. Gas feed compositions experimentally tested, Table S2. Set of kinetic parameters of reactions taking place in the simulated monolith. Equations S1.1–S8.2 reactions and reaction rate equations.

Author Contributions

C.C.T.: Methodology software validation, writing—original draft preparation. N.G.P.: conceptualization, methodology, supervision, project administration.

Funding

This research was funded by the European Project No 686086 entitled “Development of novel, high Performance hybrid TWV/GPF Automotive afteR treatment systems by raTIonAL design: substitution of PGMs and Rare earth materials’’ in the framework of the Horizon 2020 program.

Conflicts of Interest

The authors declare no conflict of interest.

Nomenclature

a,b,c,eHeat and mass transfer correlation coefficients
CiThe concentration of component i in the gas phase (mol/m3)
Ci,inThe concentration of component i in the gas phase at cell inlet (mol/m3)
Ci,sThe concentration of component i in the gas phase over the catalytic surface (mol/m3)
Ci,bThe concentration of component i in the bulk of the gas phase (mol/m3)
CpThermal capacity of the gas phase (J/K)
dDiameter of the monolith cell (m)
DiThe diffusion coefficient of component i in the gas phase (m2/s)
EajActivation energy of reaction j (J/mol)
IUnit vector
KjiAdsorption constant of component i at reaction j (m3/mol)
KRjReaction rate constant of reaction j (m4/mol/s)
Kgs,iGas solid mass transfer coefficient for the component i (m/s)
kThermal conductivity of the gas phase (W/m/K)
KtHeat transfer coefficient (W/m2/K)
LChannel length (m)
MnMolar mass of the gas phase (Kg/mol)
nThe vector direction normal to the boundary surface (-)
NuNusselt number (-)
NuFNusselt number for constant wall flux (-)
NuTNusselt number constant wall temperature (-)
qHeat released due to reactions take place on the washcoat wall (W/m2)
pPressure (Pa)
( prop ) z The mean radial property prop at each z ordinate of the length
PrPrandtl number (-)
RRadius of monolith cell (m)
rRadius coordinate (m)
RgUniversal constant of gas (= 8.314 J/mol/K)
RjReaction rate of reaction j = 1,2,... (mol/m2/s)
RiReaction rate of component i = NO,CO,O2,C3H6,C3H8,CH4 (mol/m2/s)
ReReynolds number (-)
ShSherwood number (-)
ShFSherwood number for constant wall flux (-)
ShTSherwood number constant wall concentration (-)
ScSchmidt number (-)
SvExternal surface for gas solid mass transfer per void volume (m2/m3)
TTemperature (K)
TbTemperature of the bulk of the gas phase (K)
TsTemperature of the gas phase over the catalytic surface (K)
uThe vector of velocity field (m/s)
uVelocity (m/s)
uinVelocity at inlet (m/s)
zLength coordinate, distance from the cell inlet (m)
Greek
Δ H R 0 Standard enthalpy of reaction (KJ/mol)
ΔHRjEnthalpy of reaction j at temperature T (KJ/mol)
μViscosity (Pas)
ρDensity of the gas phase (Kg/m3)

References

  1. Bertrand, F.; Devals, C.; Vidal, D.; de Préval, C.S.; Hayes, R.E. Towards the simulation of the catalytic monolith converter using discrete channel-scale models. Catal. Today 2012, 188, 80–86. [Google Scholar] [CrossRef]
  2. Shamim, T. Effect of heat and mass transfer coefficients on the performance of automotive catalytic converters. Int. J. Engine Res. 2003, 4, 129–141. [Google Scholar] [CrossRef]
  3. Hayes, R.E.; Kolaczkowski, S.T. A study of Nusselt and Sherwood numbers in a monolith reactor. Catal. Today 1999, 47, 295–303. [Google Scholar] [CrossRef]
  4. Koltsakis, G.C.; Stamatelos, A.M. Catalytic automotive exhaust aftertreatment. Prog. Energy Combust. Sci. 1997, 23, 1–39. [Google Scholar] [CrossRef]
  5. Iwaniszyn, M.; Piatek, M.; Gancarczyk, A.; Jodłowski, P.J.; Łojewska, J.; Kołodziej, A. Flow resistance and heat transfer in short channels of metallic monoliths: Experiments versus CFD. Int. J. Heat Mass Transf. 2017, 109, 778–785. [Google Scholar] [CrossRef]
  6. Santos, H.; Costa, M. Analysis of the mass transfer controlled regime in automotive catalytic converters. Int. J. Heat Mass Transf. 2008, 51, 41–51. [Google Scholar] [CrossRef]
  7. Bhattacharya, M.; Harold, M.P.; Balakotaiah, V. Mass-Transfer Coefficients in Washcoated Monoliths. AIChE J. 2004, 50, 2939–2955. [Google Scholar] [CrossRef]
  8. Holmgren, A.; Andersson, B. Mass transfer in monolith catalysts-CO oxidation experiments and simulations. Chem. Eng. Sci. 1998, 53, 2285–2298. [Google Scholar] [CrossRef]
  9. Balakotaiah, V.; Gupta, N.; West, D. A simplified model for analyzing catalytic reactions in short monoliths. Chem. Eng. Sci. 2000, 55, 5367–5383. [Google Scholar] [CrossRef]
  10. Canu, P.; Vecchi, S. CFD Simulation of Reactive Flows: Catalytic Combustion in a Monolith. AIChE J. 2002, 48, 2921–2935. [Google Scholar] [CrossRef]
  11. Arrighetti, C.; Cordiner, S.; Mulone, V. Heat and Mass Transfer Evaluation in the Channels of an Automotive Catalytic Converter by Detailed Fluid-Dynamic and Chemical Simulation. J. Heat Transf. 2007, 129, 536–547. [Google Scholar] [CrossRef]
  12. Ramanathan, K.; Balakotaiah, V.; West, D.H. Light-off criterion and transient analysis of catalytic monoliths. Chem. Eng. Sci. 2003, 58, 1381–1405. [Google Scholar] [CrossRef]
  13. Depcik, C.; Assanis, D. One-dimensional automotive catalyst modelling. Prog. Energy Combust. Sci. 2005, 31, 308–369. [Google Scholar] [CrossRef]
  14. Holder, R.; Bollig, M.; Anderson, D.R.; Hochmuth, J.K. A discussion on transport phenomena and three-way kinetics of monolithic converters. Chem. Eng. Sci. 2006, 61, 8010–8027. [Google Scholar] [CrossRef]
  15. Gupta, N.; Balakotaiah, V. Heat and mass transfer coefficients in catalytic monoliths. Chem. Eng. Sci. 2001, 56, 4771–4786. [Google Scholar] [CrossRef]
  16. Hayes, R.E.; Kolaczkowski, S.T. Mass and heat transfer effects in catalytic monolith reactors. Chem. Eng. Sci. 1994, 49, 3587–3599. [Google Scholar] [CrossRef]
  17. Hawthorn, R.D. Afterburner catalysts-effects of heat and mass transfer between gas and catalyst surface. Am. Inst. Chem. Eng. 1974, 21, 849–853. [Google Scholar]
  18. Votruba, J.; Mikus, O.; Nguen, K.; Hlavacek, V.; Skrivanek, J. Heat and mass transfer in monolithic honeycomb catalysts—II. Chem. Eng. Sci. 1975, 30, 201–206. [Google Scholar] [CrossRef]
  19. Bennett, C.J.; Kolaczkowski, S.T.; Thomas, W.J. Determination of heterogeneous reaction kinetics and reaction rates under mass transfer controlled conditions for a monolith reactor. Trans. Inst. Chem. Eng. Part B 1991, 69, 209–220. [Google Scholar]
  20. Ullah, U.; Waldram, S.P.; Bennett, C.J.; Truex, T. Monolithic reactors: Mass transfer measurements under reacting conditions. Chem. Eng. Sci. 1992, 47, 2413–2418. [Google Scholar] [CrossRef]
  21. Uberoi, M.; Pereira, C.J. Mass transfer coefficients for monolith catalysts. Ind. Eng. Chem. Res. 1996, 35, 113–116. [Google Scholar] [CrossRef]
  22. Grigull, U.; Tratz, H. Thermischer Einlauf in ausgebildeter laminarer Rohrstromung. Int. J. Heat Mass Transf. 1965, 8, 669–678. [Google Scholar] [CrossRef]
  23. Shah, R.K.; London, A.L. Laminar Flow Forced Convection in Ducts; Academic Press: New York, NY, USA, 1978. [Google Scholar]
  24. Tronconi, E.; Forzatti, P. Adequacy of lumped parameter models for SCR reactors with monolith structures. AIChE J. 1992, 38, 201–210. [Google Scholar] [CrossRef]
  25. Kirchner, T.; Eigenberger, G. Optimization of the cold-start behavior of automotive catalysts using an electrically heated pre-catalyst. Chem. Eng. Sci. 1996, 51, 2409–2418. [Google Scholar] [CrossRef]
  26. Gundlapally, S.R.; Balakotaiah, V. Heat and mass transfer correlations and bifurcation analysis of catalytic monoliths with developing flows. Chem. Eng. Sci. 2011, 66, 1879–1892. [Google Scholar] [CrossRef]
  27. Groppi, G.; Belloli, A.; Tronconi, E.; Forzatti, P. A comparison of lumped and distributed models of monolith catalytic reactors. Chem. Eng. Sci. 1995, 50, 2705–2715. [Google Scholar] [CrossRef]
  28. Heck, R.H.; Wei, J.; Katzer, J.R. Mathematical modelling of monolithic catalysts. AIChE J. 1976, 22, 477–483. [Google Scholar] [CrossRef]
Figure 1. Typical profile of mass transfer coefficient along the monolith cell length.
Catalysts 09 00507 g001
Figure 2. Representative figures for the comparison of Kgs profiles along the cell length predicted by the proposed correlation with those derived from CFD calculations as well as a comparison of the concentration profiles in the bulk of the gas phase and over the catalytic surface. Cell diameter d = 1.1 mm. Temperature 400 °C. Velocity 0.261 m/s. Re = 4.6. (a) CO at lean gas feed composition, (b) NO at rich gas feed composition, (c) O2 at rich gas feed composition, (d) C3H6 at lean gas feed composition, (e) C3H8 at rich gas feed composition and (f) CH4 at rich gas feed composition. Total length L = 1 cm.
Catalysts 09 00507 g002
Figure 3. Parity plot for the asymptotic values that the Kgs profiles stabilized at all the tested conditions. Cell diameter d = 1.1 mm. (a) CO, (b) NO, (c) O2, (d) C3H6, (e) C3H8 and (f) CH4.
Catalysts 09 00507 g003
Figure 4. Concentration profiles derived from the 2-D CFD model vs the concentration profiles derived from the 1-D model combined with the 1-D correlation for mass transfer. Rich gas feed composition. Temperature 400 °C. Velocity 1.3 m/s. Re = 22.7. (a) CO, (b) NO, (c) O2, (d) C3H6 and (e) C3H8.
Catalysts 09 00507 g004aCatalysts 09 00507 g004b
Figure 5. Comparison of the mass transfer correlation for monoliths published in the literature by Ramanathan et al. [12] and Grigul and Tratz [22] with the one proposed in this paper. Diagrams of mass transfer coefficient along the cell length for CO species at temperature 400 °C. Cell diameter d = 1.1 mm. (a) Velocity u = 6.27 m/s. Re = 109, (b) Velocity u = 0.521 m/s. Re = 9, (c) Velocity u = 0.033 m/s. Re = 0.58.
Catalysts 09 00507 g005
Figure 6. Typical profile of heat transfer coefficient along the monolith cell length.
Catalysts 09 00507 g006
Figure 7. Representative figures for the comparison of Kt profiles along the cell length predicted by the proposed correlation with those derived from CFD calculations as well as comparison of the temperature profile in the bulk of the gas phase and over the catalytic surface. Cell diameter d = 1.1 mm. Lean feed composition. Inlet temperature: 500 °C. (a) Inlet velocity 0.037 m/s. Re = 0.53, (b) inlet velocity 0.3 m/s. Re = 4.3, (c) inlet velocity 7.2 m/s. Re = 100.
Catalysts 09 00507 g007
Figure 8. Profiles of the temperature difference between the surface and bulk gas derived from the non-isothermal 2-D CFD model vs the profiles derived from the non-isothermal 1-D model combined with the 1-D correlations for heat and mass transfer. Rich gas feed composition. Inlet temperature 400 °C. Inlet velocity 1.1 m/s. Re = 19.1.
Catalysts 09 00507 g008
Figure 9. Comparison of the heat transfer correlation for monoliths published in the literature by Ramanathan et al. [12] and Grigul and Tratz [22] with the one proposed in this paper. Diagrams of heat transfer coefficient along the cell length at temperature 400 °C. Cell diameter d = 1.1 mm. (a) Velocity u = 6.27. Re = 109, (b) Velocity u = 0.521. Re = 9, (c) Velocity u = 0.033. Re = 0.58.
Catalysts 09 00507 g009
Table 1. Boundary conditions for the momentum and mass transport in the isothermal 2-D computational fluid dynamic (CFD) model for the determination of the gas–solid mass transfer coefficients.
BoundaryMomentum TransportMass transport
Symmetry boundaryAxial Symmetry
r = 0
Axial Symmetry
r = 0
Substrate wallNo Slip
I.u = 0
Mass Flux (Reaction Rate Ri)
n ( D i C i + C i u ) = R i
InletNormal Inflow Velocity:
u = −uinn
Feed Composition
Ci = Ci,in
OutletAmbient Pressure, No Viscous Stress
p = 101323 Pa
μ ( u + ( u ) T ) n = 0
Convective Flux
(No Diffusion in the Normal Direction)
n ( D i C i ) = 0
Table 2. Boundary conditions for the momentum, mass and heat transport in the non isothermal 2-D CFD model.
BoundaryMomentum TransportMass transportHeat transport
Symmetry boundaryAxial Symmetry
r = 0
Axial Symmetry
r = 0
Axial Symmetry
r = 0
Substrate wallNo Slip
II.u = 0
Mass Flux (Reaction Rate Ri)
n ( D i C i + C i u ) = R i
Heat flux
n ( k T + ρ C p T u = j R j Δ H R j
InletNormal Inflow Velocity:
u = –uinn
Feed Composition
Ci = Ci,in
Feed Temperature
T = Tin
OutletAmbient Pressure, No Viscous Stress
p = 101323 Pa
[ μ ( u + ( u ) T ) 2 μ 3 ( u ) Ι ] n = 0
Convective Flux (No Diffusion in the Normal Direction)
n ( D i C i ) = 0
Convective Flux (No Conduction in the Normal Direction)
n ( k T ) = 0
Table 3. Simulation conditions for the determination of mass and heat transfer coefficients.
Inlet Temperatures (°C)200, 300, 400 and 500
Velocities uin (m/s)0.028–7.2
Inlet CompositionsRich, Lean
Cell length (cm)1–12
At the tested conditions the flow of the gas phase through the monolith channel is laminar.

