Article

Properties of Barium Cerate Thin Films Formed Using E-Beam Deposition

1
Physics Department, Kaunas University of Technology, LT-51368 Kaunas, Lithuania
2
Institute of Nanotechnology and Materials Engineering, Faculty of Applied Physics and Mathematics and Advanced Materials Centre, Gdańsk University of Technology, 80-233 Gdańsk, Poland
3
Department of Materials Engineering and Bonding, Faculty of Mechanical Engineering, Gdańsk University of Technology, 80-233 Gdańsk, Poland
*
Author to whom correspondence should be addressed.
Crystals 2020, 10(12), 1152; https://doi.org/10.3390/cryst10121152
Submission received: 30 October 2020 / Revised: 4 December 2020 / Accepted: 16 December 2020 / Published: 18 December 2020

Abstract

:
This article focuses on the properties of the BaCeO3 thin films formed by electron-beam vapor deposition and investigates the formation of barium cerates on supports with different thermal expansion coefficients (Stainless Steel, Invar, Glass Sealing, and Inconel substrates) and the influence of the technological parameters on the properties of the formed thin films with an emphasis on the stability of the films. Morphology and phase composition and mechanical and electrical properties were investigated. It was found that the main factors influencing the phase composition and morphology of the films are the temperature of the support and the deposition rate. However, the mechanical properties of the films are mostly influenced by strains introduced to thin films by using different supports. Two interesting features of the electrical properties of the studied strained films were noticed: the film with the highest in-plane tensile strain showed the lowest activation energy of total conductivity, whereas the film with the lowest strain showed the highest value of total conductivity.

1. Introduction

Many electrochemical devices utilizing either oxide-ion or proton-conducting oxides, e.g., solid oxide fuel cells, proton ceramic fuel cells, electrolyzers (SOFCs, PCFCs, SOECs, PCECs, etc.), and various gas sensors are constructed as thin layer systems. In many cases, functional layers are deposited on metal supports. Given the increasing interest in metal-supported oxide film systems, for instance, in metal-supported proton fuel cells [1,2], it is very important to study the properties of metal-supported oxide films. Several factors influence the properties of metal-supported oxide films. The important parameters are the thickness of the films and the strain. Recently, ultrathin oxide films on metal supports have been intensively studied because of their properties intrinsically connected with interfacial interactions between oxide and metal. In particular, charge-transfer processes through the oxide film and the development of built-in electric fields were proposed to result in interesting physical and chemical properties of oxide films, especially their higher catalytic activity [3]. Moreover, a strain may modify the properties of metal oxide films. Recently, strain engineering has been employed to modify the properties of electroceramic thin films [4]. For instance, the influence of strain on oxygen ionic conductivity of such oxides as yttrium-stabilized zirconia and cerium oxide has been reported [5,6]. Proton ceramic conductors have not yet received much attention; however, Fluri et al. [7] showed that when BaZr0.8Y0.2O3 changed the strain from compressive to tensile, the effective activation energy for bulk proton transport decreased by 0.07eV. Moreover, in thin-film systems, the presence of strain is inevitable because of the differences between crystal structures, unit cell parameters, and thermal expansion coefficients of the support and film materials.
This article investigates the formation of barium cerates using the electron beam vapor deposition technique and the influence of the technological parameters on the properties of the formed thin films. Special attention will be devoted to the stability of the films.

2. Materials and Methods

To investigate the peculiarities of the evaporation of barium cerates on the substrates with a different thermal expansion coefficient, the deposition of BaCeO3 (BCO) thin films was performed on four different substrates (0.2 mm thickness, Goodfellow): Invar, Stainless Steel (SST), Inconel alloy 600, and glass sealing alloy (GSA). The chemical compositions and thermal expansion coefficients of the substrates and BCO are summarized in Table 1. All the thin films deposited with the same technological parameters were deposited at the same time.
BCO thin films were formed using an E-beam physical vapor deposition system (Kurt J. Lesker EB-PVD 75, Hastings, UK). The formation of thin films was carried out using deposition rates of 12 nm/min (2 Å/s), 24 nm/min (4 Å/s), 48 nm/min (8 Å/s), and 72 nm/min (12 Å/s). The thickness (~1500 nm) and deposition rate were controlled with an INFICON (Inficon, Bad Ragaz, Switzerland) crystal sensor. The temperature of the substrates was changed from room temperature (20 °C) to 600 °C. To get a homogenous thin film, substrates were rotated at 8 rpm speed. The acceleration voltage of the electron gun was 7.9 kV, and the required deposition rate was achieved by adjusting the E-beam current, which was in the range of 60–100 mA. The initial pressure of ~2.0 × 10⁻⁴ Pa and working pressure of ~2.0 × 10⁻² Pa was maintained in the vacuum chamber during the experiments. The substrates were cleaned in an ultrasonic bath for 10 min before being introduced to the deposition chamber and treated in Ar+ ion plasma for 10 min before the deposition. The powders of BCO were pressed into pellets and used as evaporating material.
After the deposition, the formed thin films were analyzed by profilometer XP-200 (Ambios Technology) to investigate the thickness of the formed films. The microstructure of the films was studied by scanning electron microscopy (SEM, Hitachi). An accelerating voltage of 3 kV was used for the scanning.
X-ray diffraction (XRD, D8 Discover Bruker AXS GmbH, and Philips X’Pert MPD systems) data were collected at room temperature with a diffractometer using Cu Kα radiation.
Nanoindentation tests were carried out using a nanoindenter (NanoTest Vantage, Micro Materials Ltd., Wrexham, UK) using a pyramidal, diamond, three-sided Berkovich indenter, with an apical angle of 124.4°. The tests were performed for the loads below 5 mN. The 15 independent measurements were performed for each of the samples with the loading time set up at 15 s. The distance between the measurements was 10 µm.
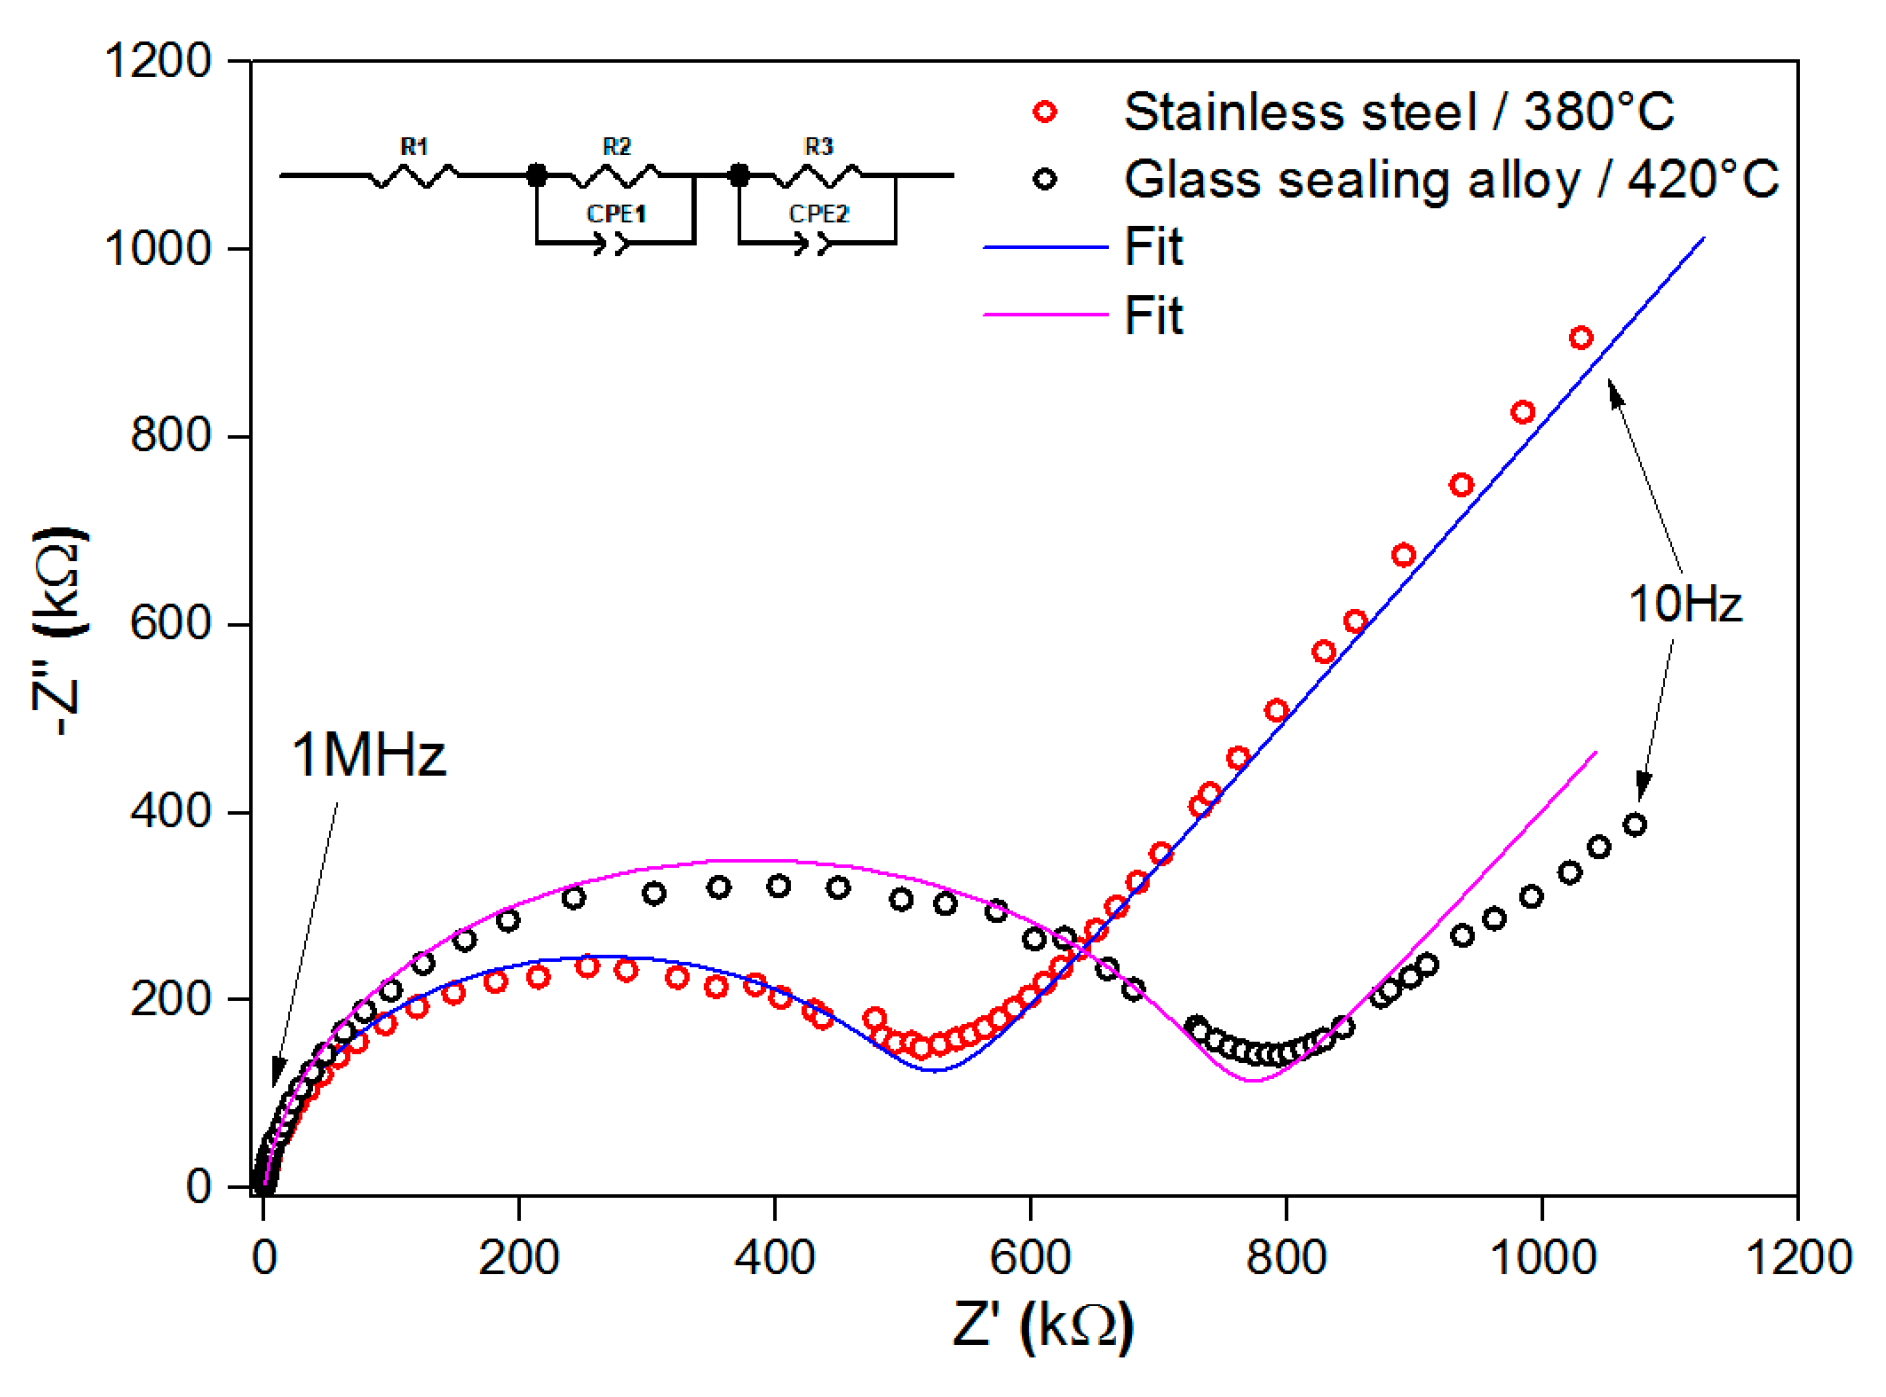
Electrochemical Impedance Spectroscopy measurements were performed using Gamry Reference 3000 potentiostat in the temperature range of 300 °C to 600 °C with 50 °C steps and the frequency range of 1Hz to 1MHz. ProboStat unit (Norecs AS) was used to mount and prepare the sample for through-plane measurements, which were carried out in dry and wet argon. The wetting stage consisted of a bubbler with deionized H2O (pH2O = 0.02 atm). The obtained data were fitted using ZView Software (Scribner Associates Inc., 150 E Connecticut Ave, Southern Pines, NC, USA). The spectra were deconvoluted to two separate semicircles described by (RQ)(RQ) equivalent circuits expressed in Circuit Description Code [9]. Basing on the calculated resistance and the total conductivity, the activation energy was determined using the Arrhenius conductivity equation:
σ = σ 0 T e ( E A k T )
where σ0 is the pre-exponential factor, EA is the activation energy, k is the Boltzmann′s constant, and T is the absolute temperature.

3. Results and Discussion

The morphology, chemical stability, and mechanical/electrical properties of undoped barium cerates were of interest in this research article. It is well known that the mismatch of thermal expansion coefficients introduces strains into the films and may have an influence on the morphology of the formed thin films. Depending on the difference between the TECs of substrate and BCO, the in-plane strain may be tensile or compressive when the difference is negative or positive, respectively.

3.1. Morphology and Phase Composition

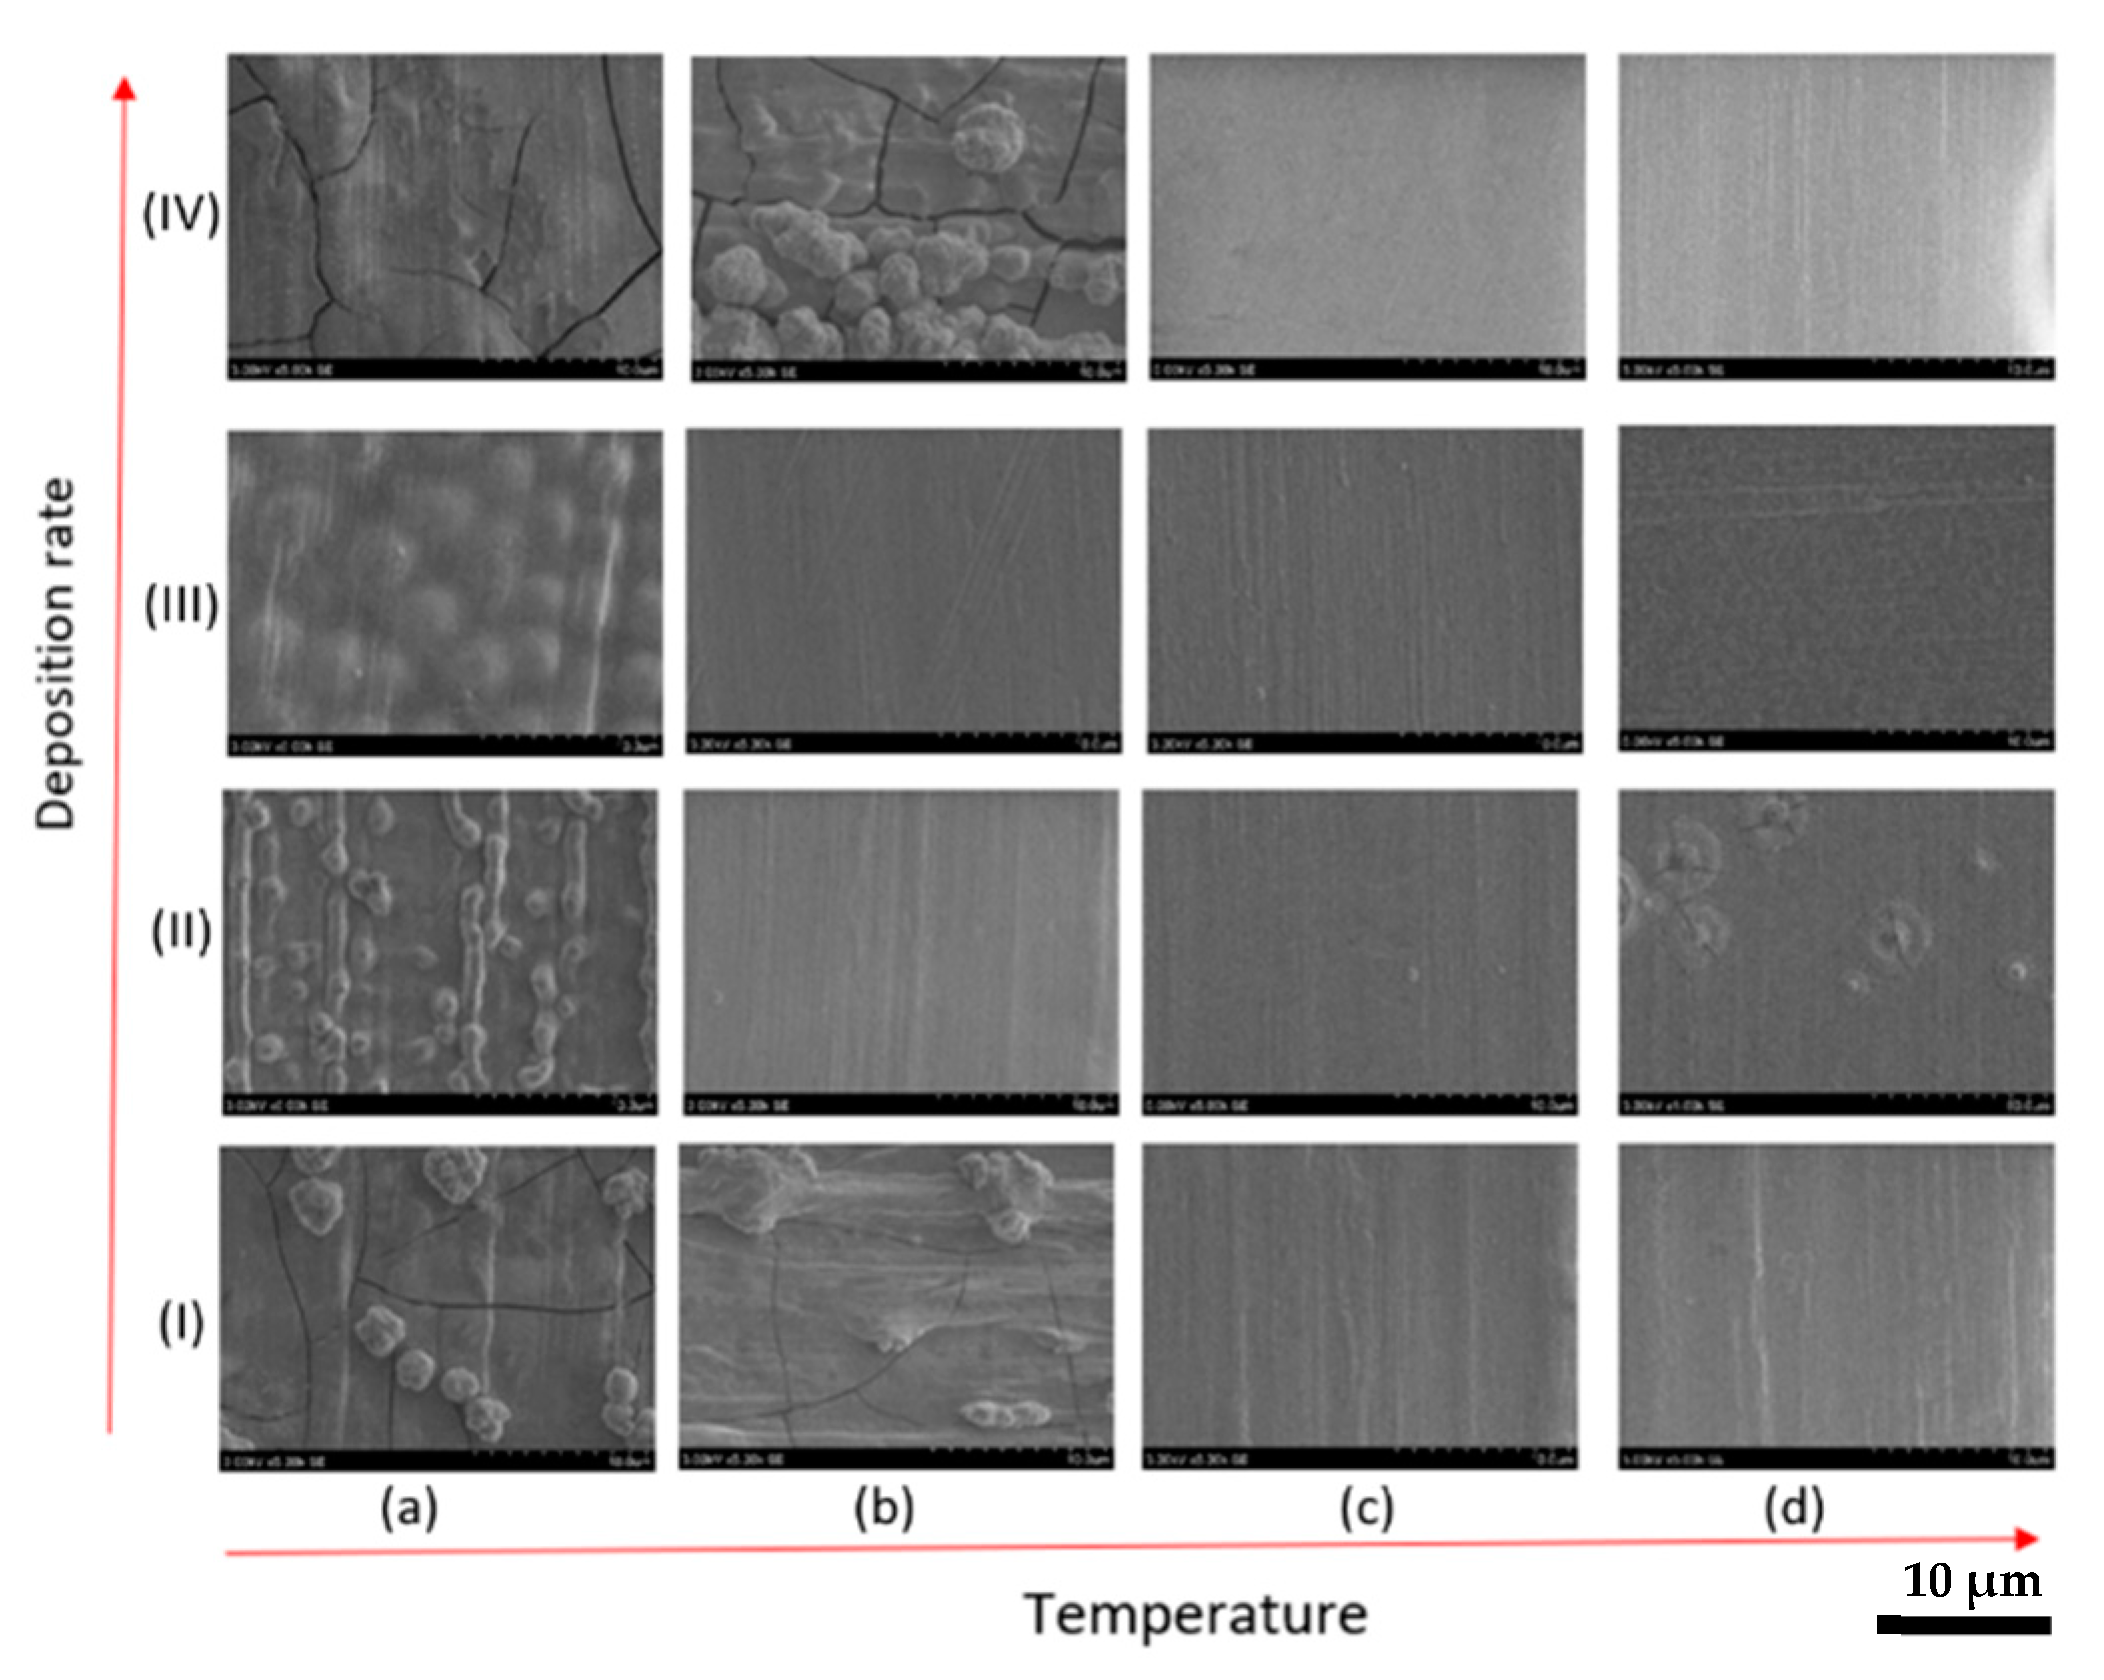
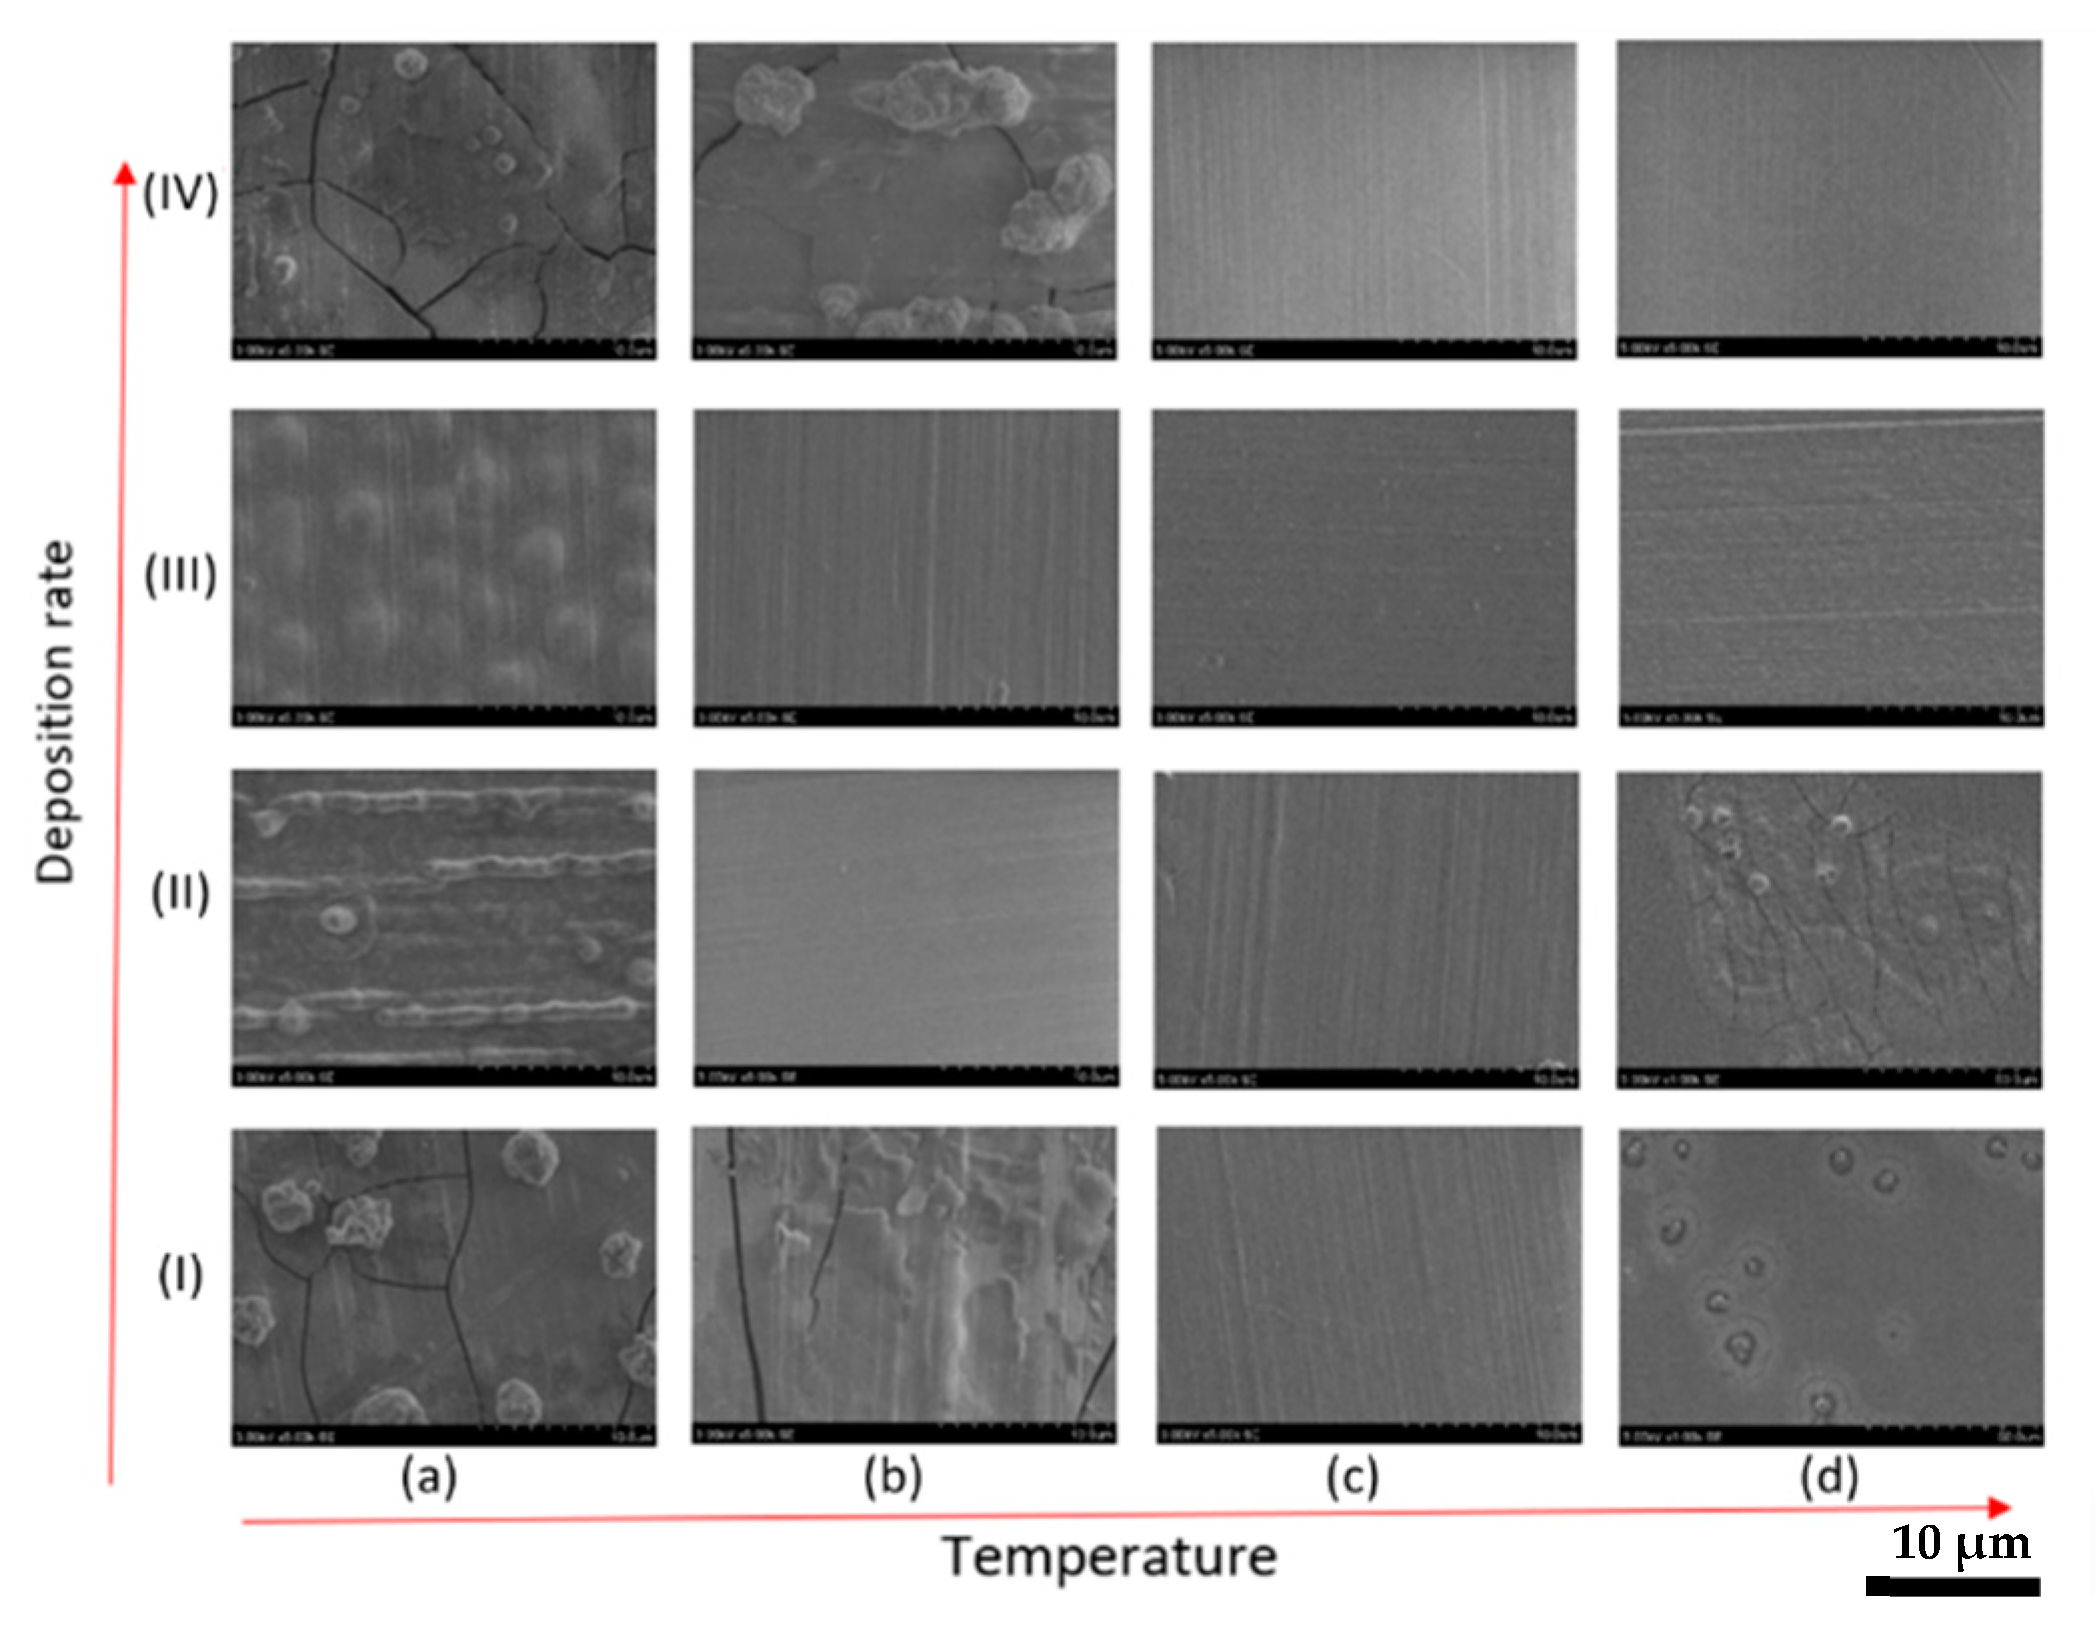
Scanning microscope images of the BCO films deposited using different conditions on metal supports are displayed in Figure 1, Figure 2, Figure 3 and Figure 4. Several common features of the films deposited on different metal supports were found. First of all, regardless of the substrate type, the microstructure of the films deposited at room temperature was similar. The films deposited at room temperature exhibited the formation of clusters, indicating that surface diffusivity was low [10]. In some cases, e.g., for BCO deposited at a rate of 4 Å/s on GSA, Inconel, and Invar, fibrous structures formed by the clusters may be seen. Such structures were also present in some films deposited at 150 °C (e.g., GSA, Inconel, and Invar for 2 and 4 Å/s). Secondly, the thin films tended to be denser and the number of spherical clusters decreases as the temperature of the substrates increased. Nevertheless, in some cases in the films obtained at 450 and 600 °C, isolated clusters were seen. The films deposited at room temperature and 150 °C, especially those formed at high deposition rates, were cracked. Some cracks were also seen in the films obtained at 600 °C. Interestingly, in the films on the substrates at 450 °C, no cracks were seen. The different stress pattern introduced in the material depends on the material and substrate, but it also can be altered by the temperature and deposition rate. Materials with high melting point such as BCO, having low material mobility and a characteristic columnar growth, exhibited only tensile film stresses with increasing film thickness [11]. There was no stress relaxation after the growth of the thin film was finished, resulting in higher growth rates and lower temperatures producing higher tensile stress during the film growth, which leads to the cracking of the films.
The growth of a thin film begins when the particles from the vapor phase arrive at the surface of the substrate. The process is complex and consists of several steps: nucleation, island growth, coalescence of islands, formation of polycrystalline islands and channels, development of continuous structure, and thickness growth [12,13,14]. The most important stage is nucleation. Adatom that arrived at the surface usually has non-zero mobility and can diffuse on the surface. The diffusion of adatom occurs until it finds and joins an existing island and meets another adatom. Dimmer or nucleus dissociates if other adatoms do not arrive at a certain time, i.e., if the nucleus does not reach critical size [15]. The distance that should be covered by adatom to join an island decreases with increasing number of islands and finally becomes lower than the diffusion distance. At this moment, the nucleation of new islands is prevented, and all adatoms join existing islands. The number of islands (N) depends on the deposition rate (F) and diffusion coefficient (D) N = F/D [16]. The number of islands is higher if the deposition rate is higher and lower if the diffusion coefficient is higher (substrate temperature and arrived particle energy). Moreover, the growth of thin films after the nucleation phase strongly depends on the ratio of the substrate temperature (Ts) to the melting temperature of thin-film material (Tm), Ts/Tm and may be described by the structure zone models [17]. Since melting temperature of BaCeO3 is 1743 °C [18], the Ts/Tm ratio is 0.145, 0.21, 0.35, and 0.43 for the substrate temperatures of 20, 150, 450, and 600 °C, respectively. If Ts/Tm < 0.2 (Zone I), as it is for the thin films formed at low temperatures, the surface diffusion is negligible. Thus, thin films consist of small randomly oriented grains that develop during nucleation and growth stages. The grains grow at the same rate independently of their orientation and form a fibrous structure [13]. Indeed, such morphology of the films may be seen in the cases of the films deposited at room temperature on all studied metallic supports. SEM images of some films obtained at 150 °C also indicate the fibrous microstructure. If 0.2 < Ts/Tm < 0.4 (Zone T), the surface diffusion predominates, and competitive growth occurs [13,19]. At lower temperatures, adatoms deposited near grain boundaries have a higher probability of becoming incorporated at a low diffusivity surface than at high diffusivity planes. Therefore, grains with low surface diffusivities grow faster [12]. However, at higher temperatures, island coalescence starts to occur due to increased surface diffusion and grain boundary motion. During the coalescence process, the grains with the densest planes are predominant, e.g., (111) for face-centered cubic lattice [9]. Grains have a V shape and roughness as the temperature increases. At higher temperatures, when Ts/Tm > 0.4 (Zone II), surface and bulk diffusion becomes significant. Therefore, grain boundary migration occurs not only during coalescence but also through the thickening process and the large textured grains dominate in Zone II [13]. The films deposited at 450 and 600 °C may be considered as being on the border between the T and II zones.
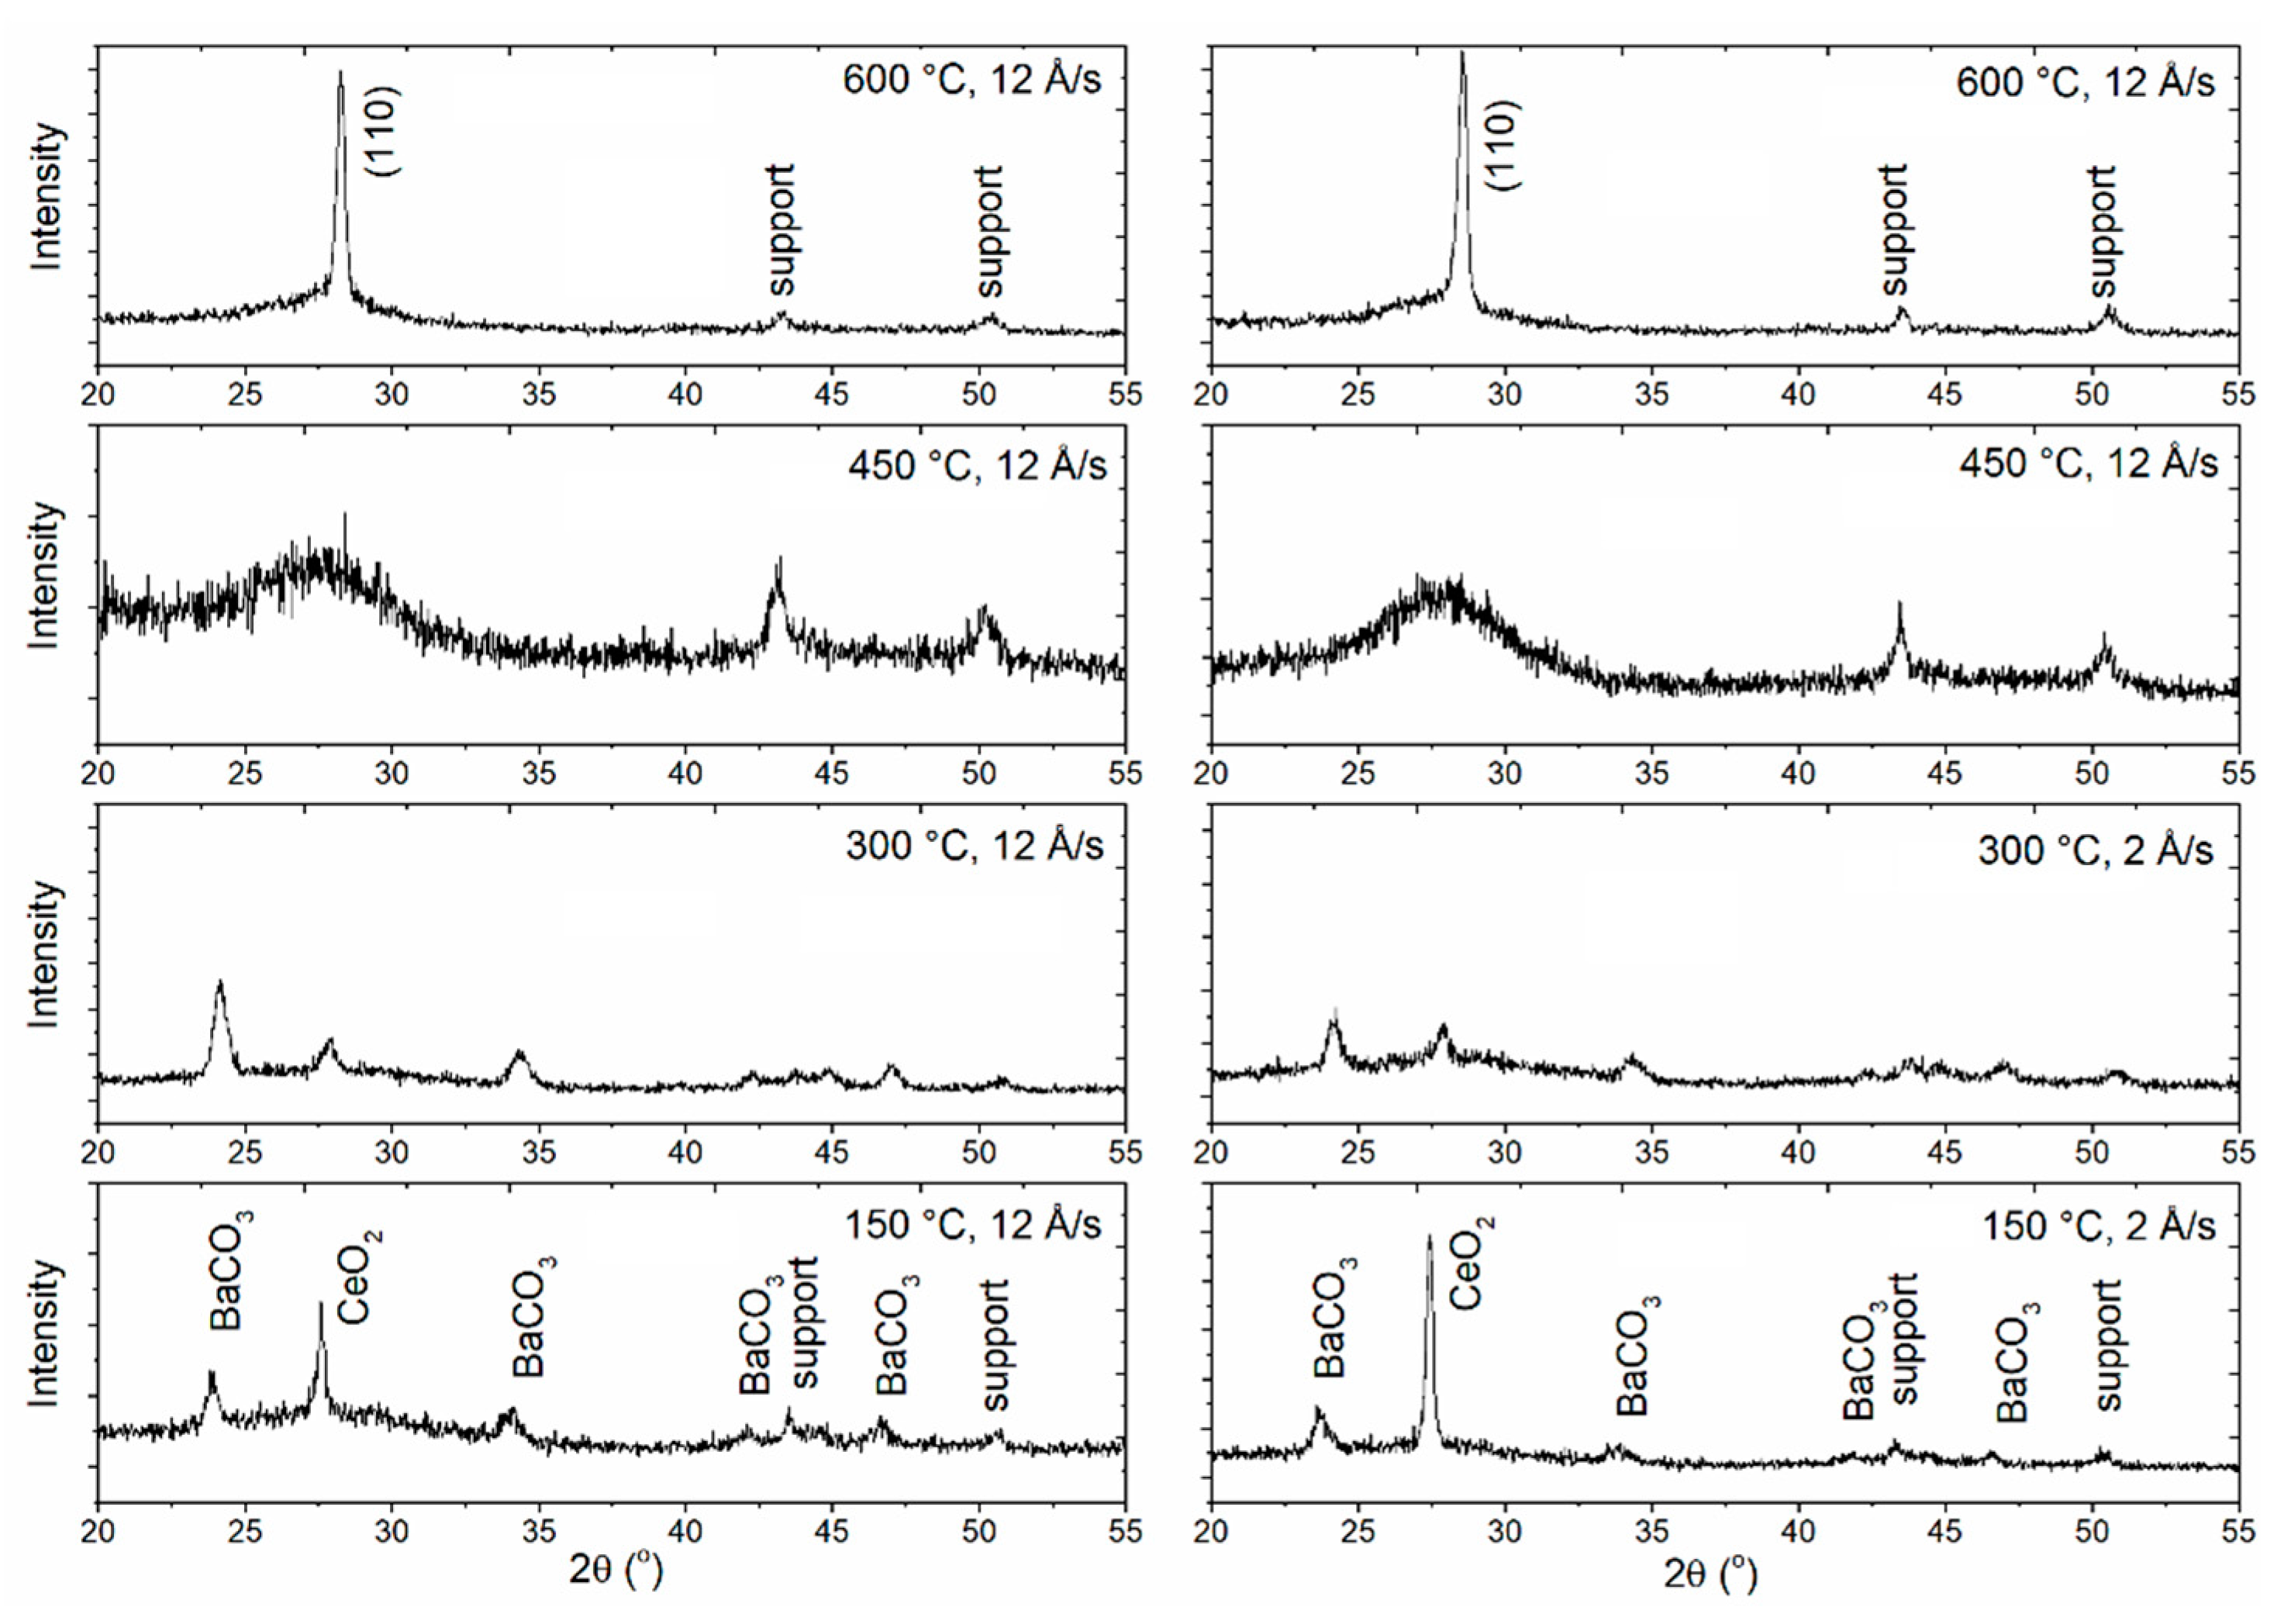
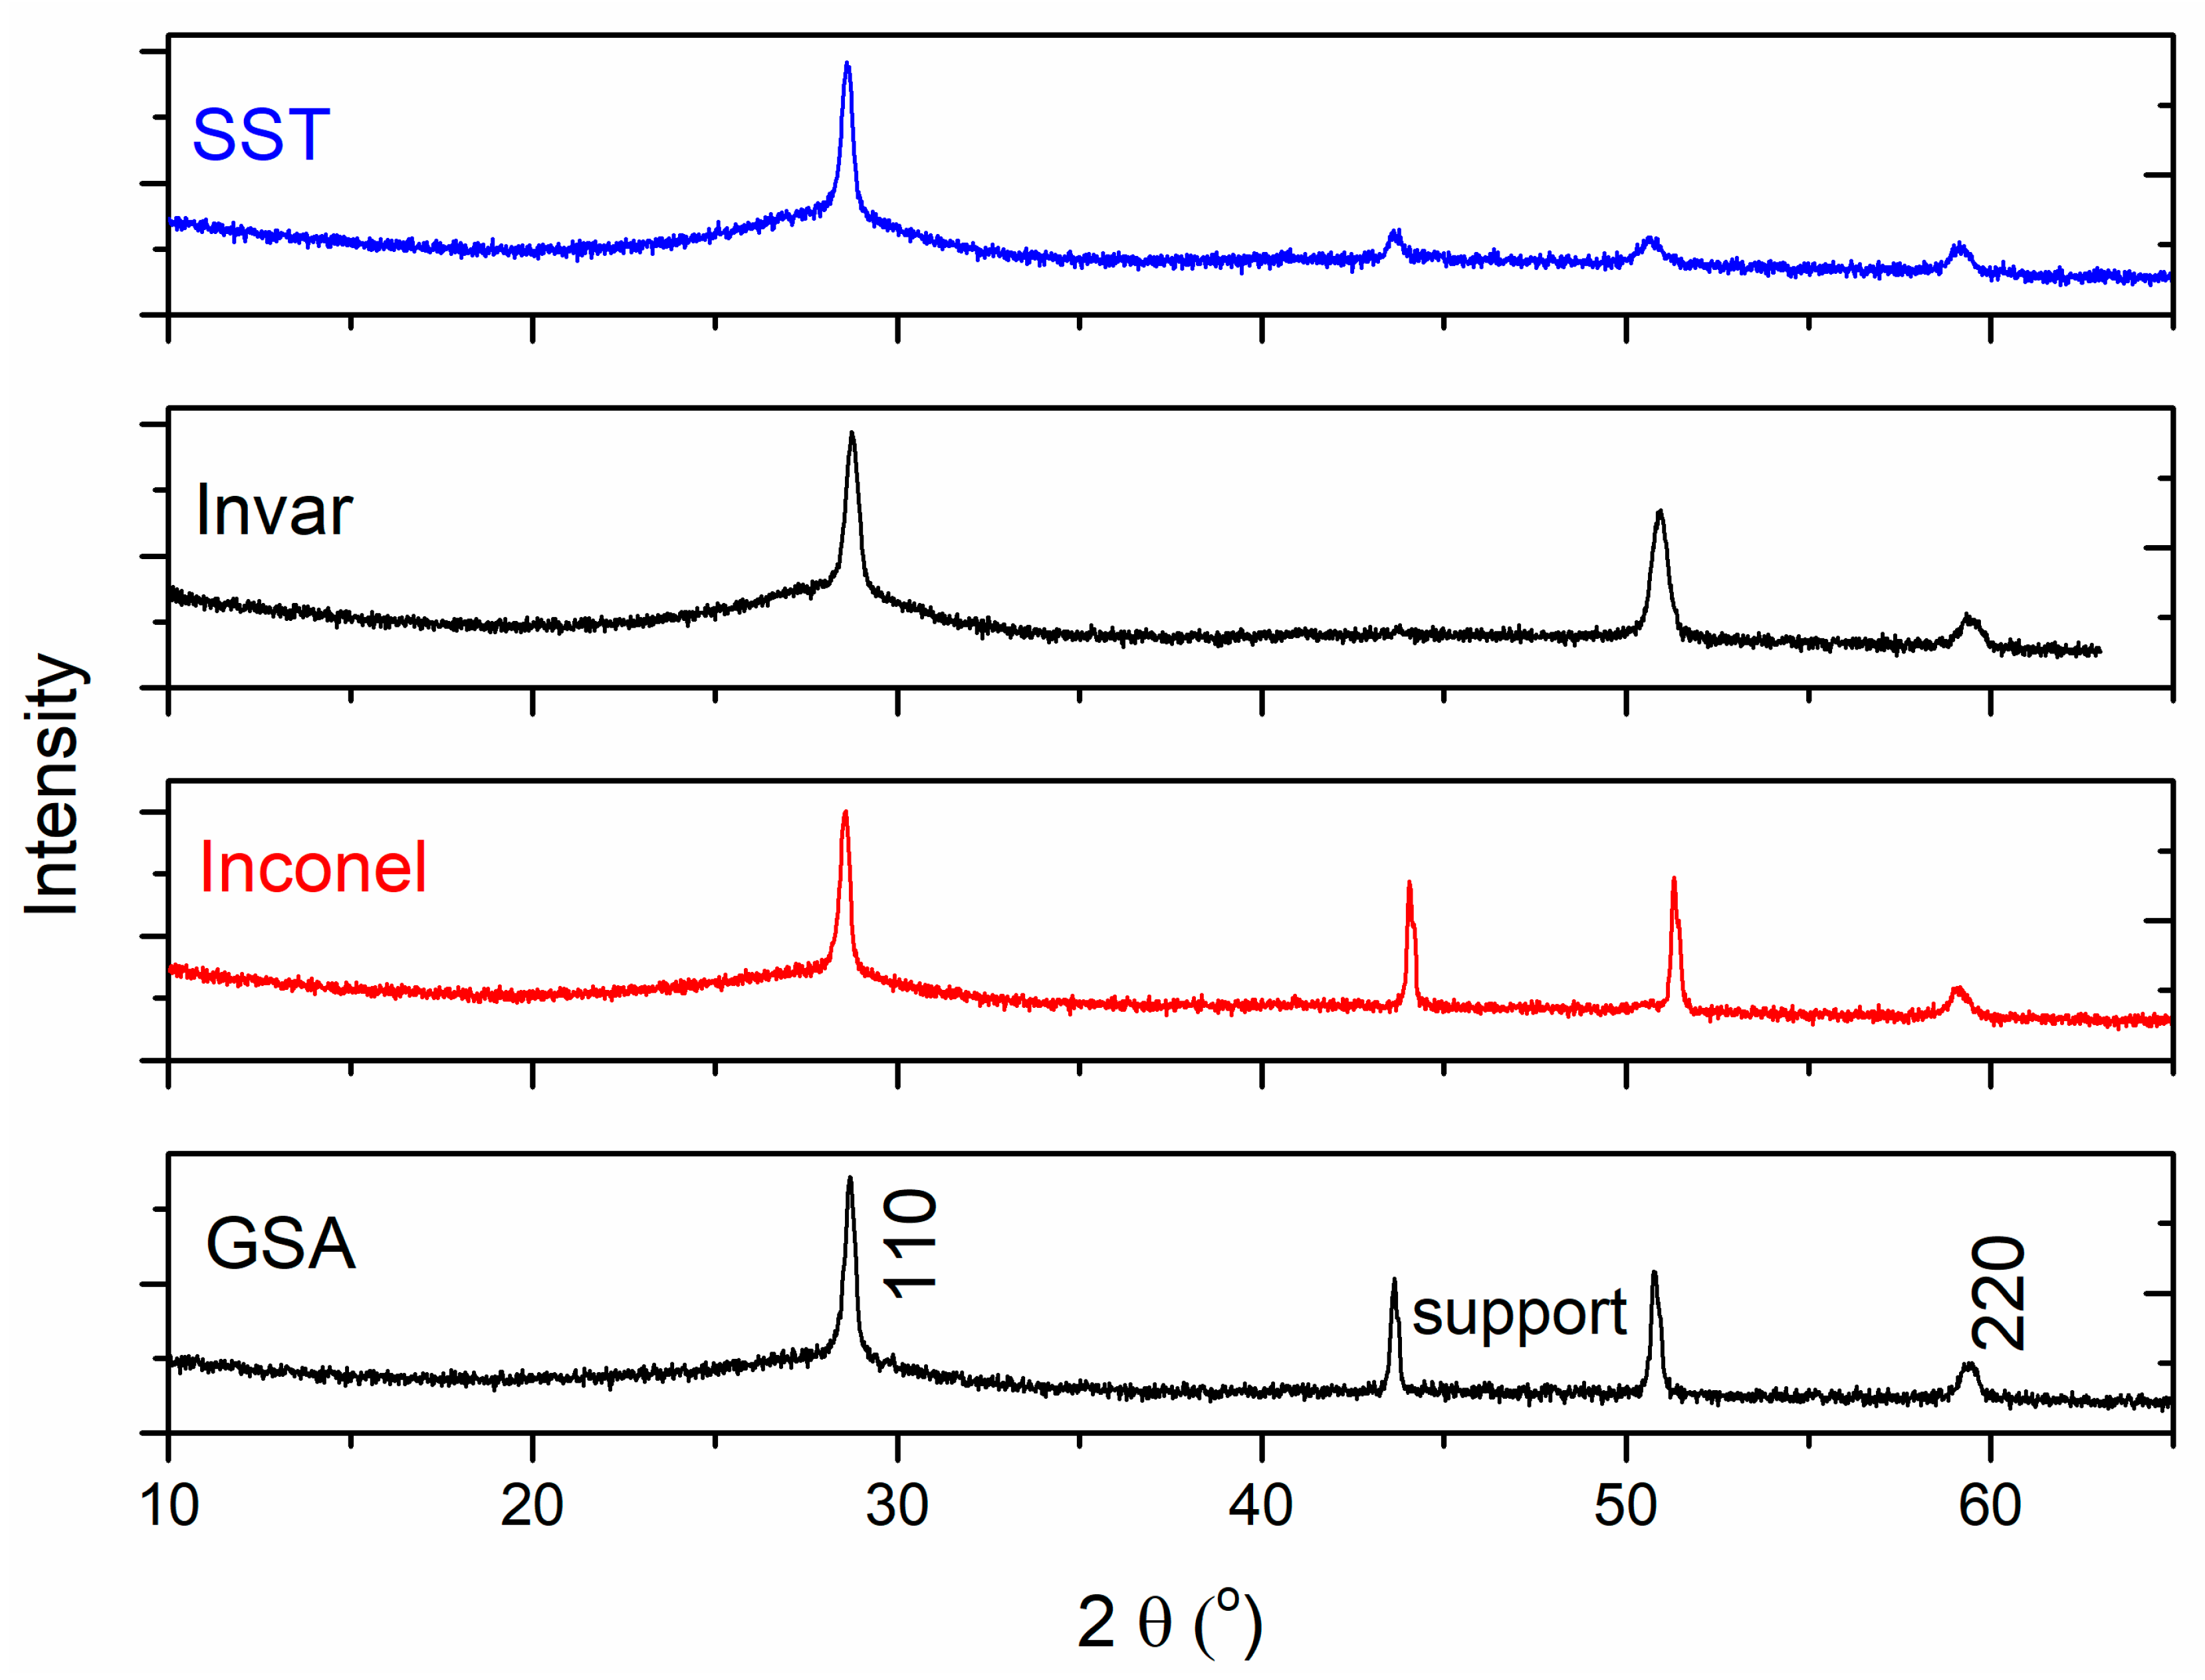
Figure 5 and Figure 6 present the X-ray diffraction patterns of the films obtained in different conditions on the metallic supports.
Figure 5 displays the XRD patterns of the films deposited on the stainless steel support using 2 Å/s and 12 Å/s deposition rates and different support temperatures. The results shown in Figure 5 are representative also of the films obtained at other substrates and with other deposition rates. Figure 6 shows patterns of the films deposited on different substrates at a temperature of 600 °C and a deposition rate of 12 Å/s. The reflections at 2θ = 28.65° and 60°, which correspond to the (110) and (220) planes of the pseudocubic unit cell of BaCeO3, may be seen in the patterns of the films deposited at 600 °C (Figure 6). On the other hand, the deposition temperatures between 150 and 300 °C enabled obtaining only a mixture of amorphous phase and crystalline BaCO3 and CeO2. The wide reflection around 2θ = 28° observed in the patterns of the films deposited at 450 °C indicates that films of BaCeO3 and/or CeO2 nanocrystalline phases formed at this temperature. Therefore, sufficiently high substrate temperature not only enables the formation of the dense films but also provides the energy necessary for the crystallization of single-phase barium cerate. The XRD analysis indicates that the deposition rate and the substrate temperature are the most influencing parameters of thin-film phase composition and crystallinity. The high deposition rate and high substrate temperature cause the appearance of crystalline cubic BCO structure on every substrate used, disregarding its strains origin. The unit cell parameters for the films deposited on Invar, GSA, Inconel, and SST were 4.394 Å, 4.405 Å, 4.419 Å, and 4.415 Å, respectively; however, it should be taken into consideration that with only two reflections present in the BCO patterns, the precision of the unit cell parameter determination is low. This value is similar to that of Glavee et al. [20], where BaCeO3 film sintered at 1100 °C in the SrTiO3 (100) substrate was reported.
Since both the microstructural analysis and X-ray diffraction analysis showed that the higher temperature and higher deposition rate are necessary to get homogenous and dense thin films, for further studies, the films deposited at 600 °C with 12 Å/s deposition rate were used.

3.2. Mechanical Properties

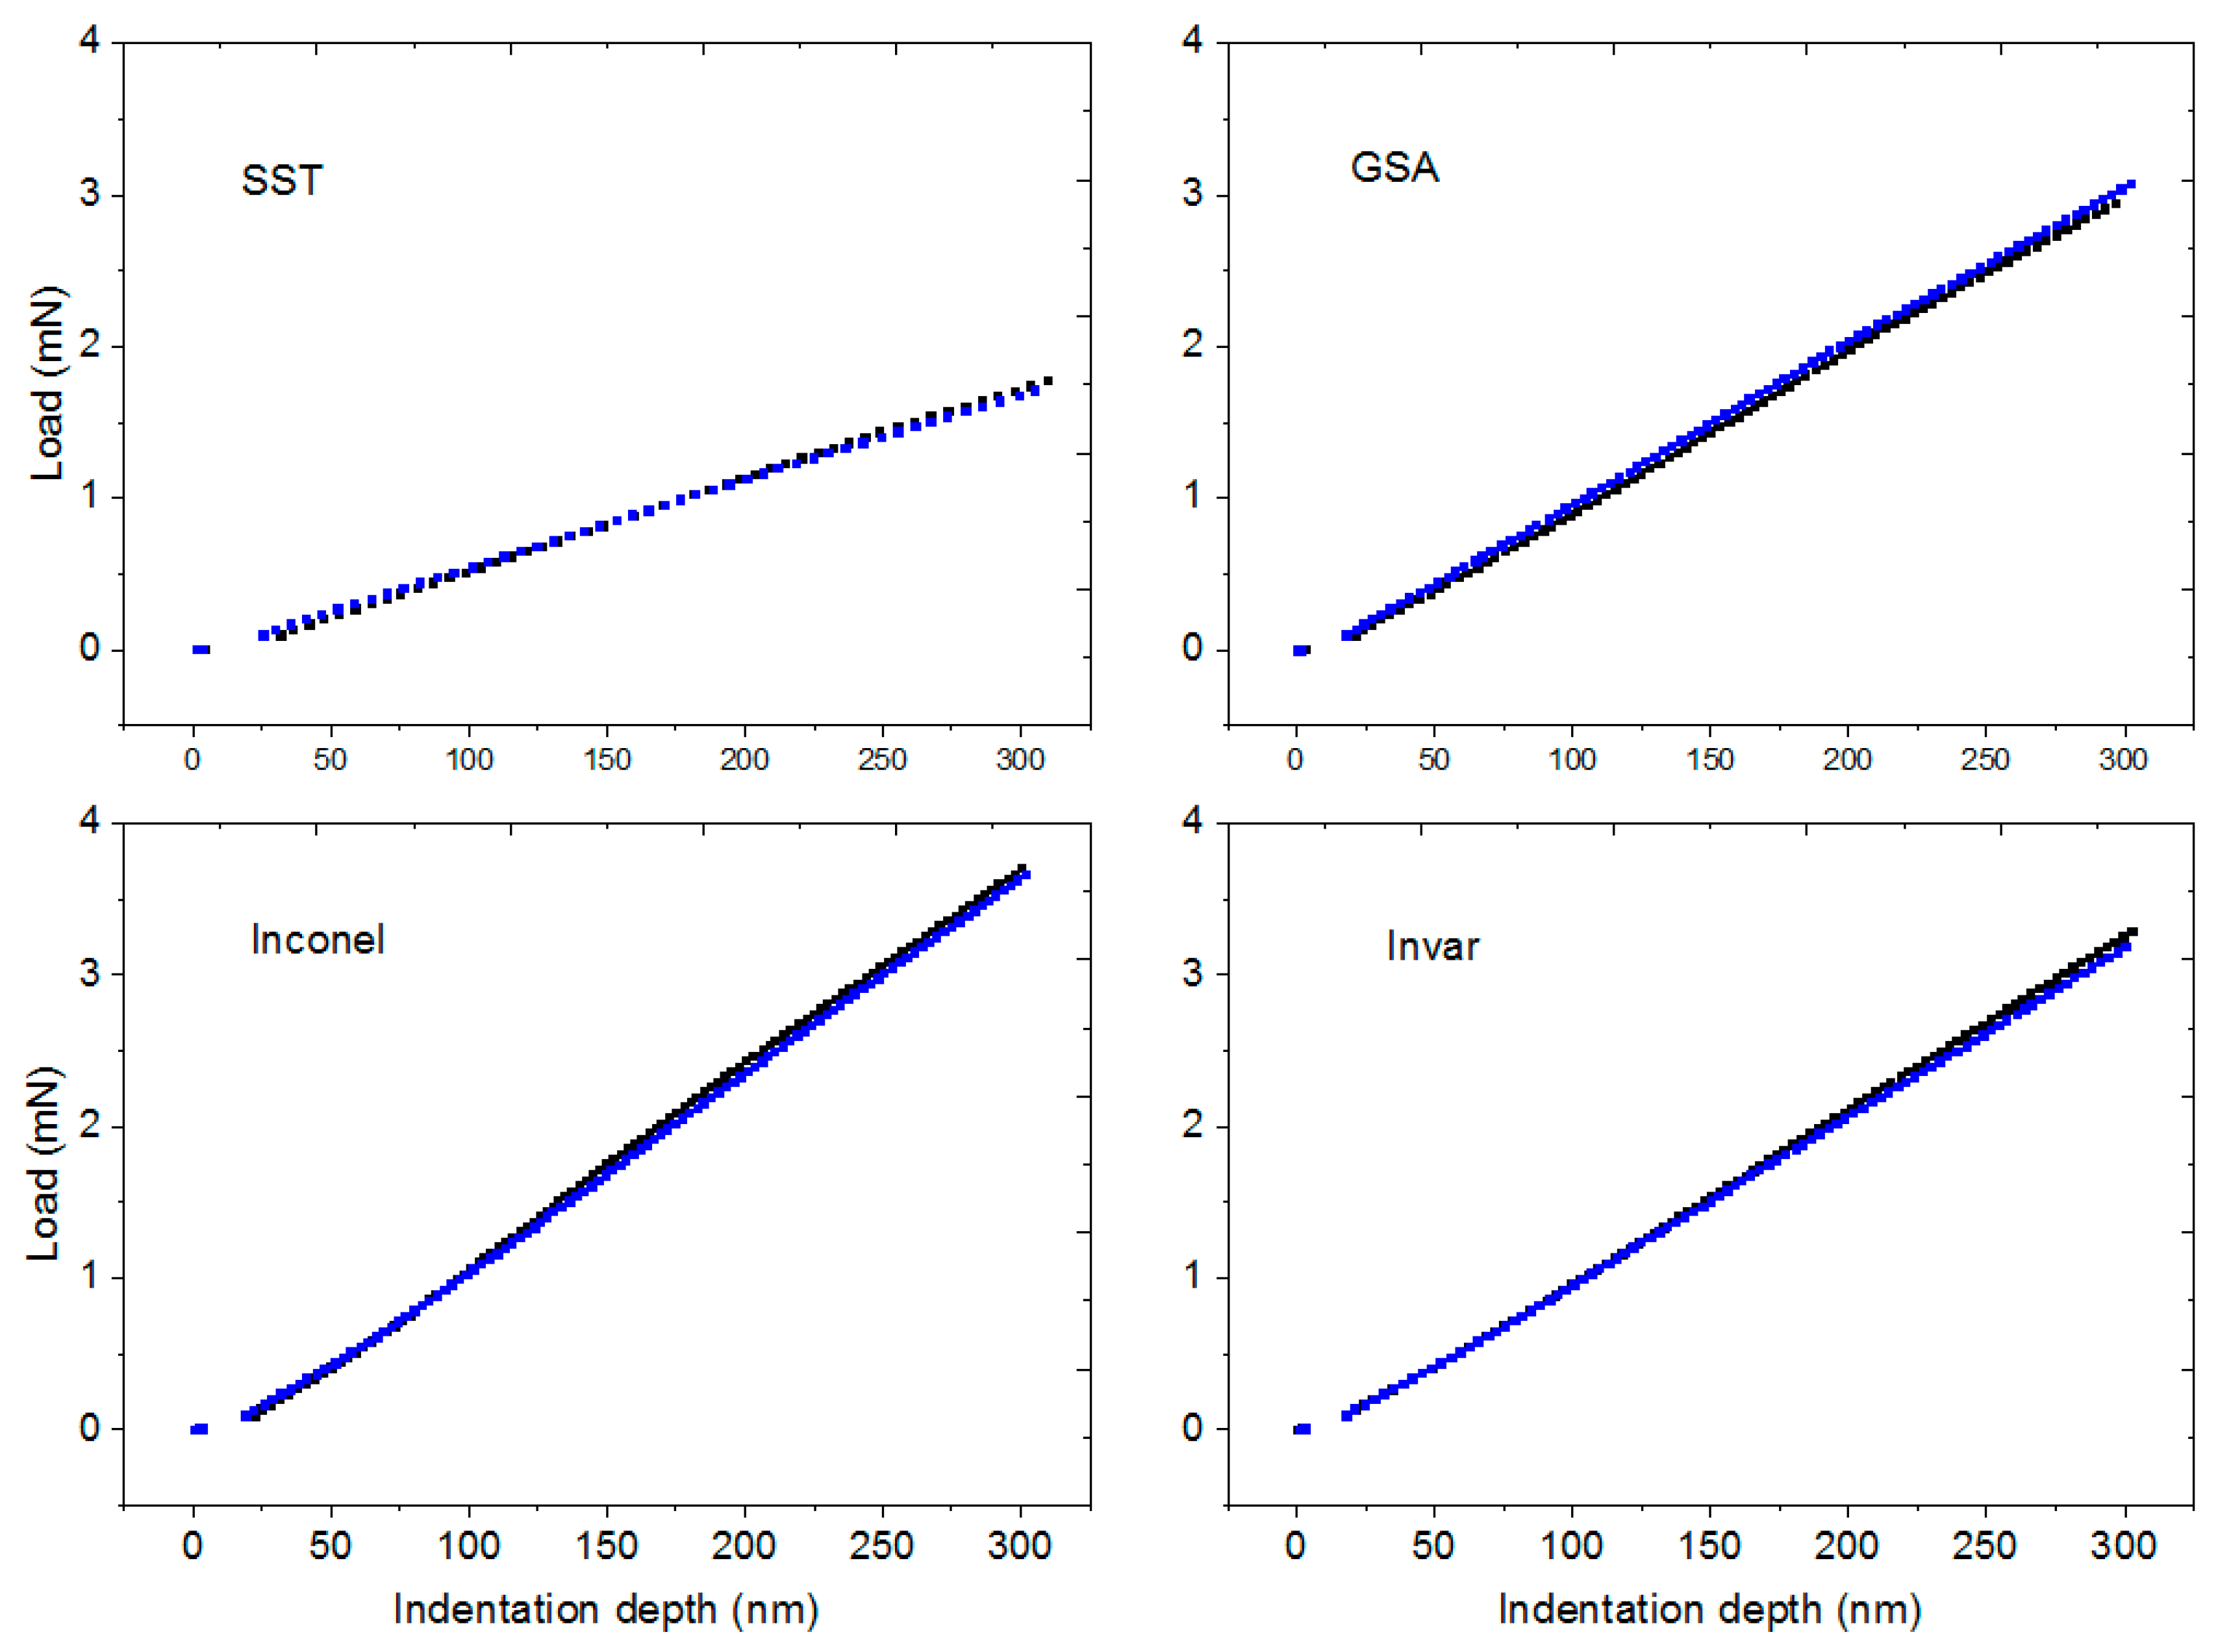
The results of the nanoindentation tests performed for the BaCeO3 film are shown in Figure 7. The indentation curves obtained with the increasing force for the indentation depth below 300 nm in two exemplary points for each support are shown. Since the film thickness is about 1500 nm, for the indentation depth below 300 nm, the observed curves may be considered as determined by the film properties, not by the mechanical properties of the supports [21]. It may be seen that 300 nm displacement was achieved for 1.66 ± 0.06, 2.92 ± 0.28, 3.22 ± 0.05, 3.67 ± 0.09 mN in the case of the films deposited on Stainless Steel, Glass Sealing alloy, Invar, and Inconel alloy, respectively. The higher force necessary to reach the same displacement of the indenter indicates higher hardness.
Therefore, it can be seen that the film deposited on the Inconel alloy may be considered the hardest, whereas that on the stainless steel was the weakest. It should be stressed that the stainless steel and Inconel supports have similar hardness. Since, as shown by SEM, different substrate TECs have a minor influence on the surface microstructure of the formed thin films, we believe that observed differences in mechanical properties are caused by different strain present in the films deposited at particular supports. The TEC of the Inconel support is very close to that of barium cerate, which indicates that unstrained film is harder than the strained one. The Invar and glass sealing alloys have TECs lower than that of BCO; hence, at room temperature, the films are tensed in-plane and, because of positive Poisson constant, compressed perpendicularly to the support surface. The mechanical properties of these films are lower than those of the film on Inconel, which is typical of the films with in-plane tensile strain; however, the difference is not large. On the other hand, the film on SST support compressed in-plane and tensed perpendicularly to the surface shows the lowest hardness. Such an influence of strain on the hardness is in contrast with expectations, since compressive strain usually increases a film hardness. For instance, the TiCxN1–x films deposited on carbide supports (93.5 wt.% WC + 6 wt.% Co + 0.5 wt.% (Ta, Nb, C) showed increasing hardness with increasing compressive strain [22].
The unexpected influence of strain on the mechanical properties may be related to its influence on either grain size or defect structure and concentration. It is assumed that the influence on grain size may be neglected since the type of support was found not to affect the morphology of the films. On the other hand, an influence of the strain and the composition of the metallic support on the defect formation, which may influence the bond strength, cannot be excluded. Another possible reason for the lower-than-expected hardness of the films on the stainless steel is that the compressive strain worsens the adhesion of the film to the support. Possible loss of adhesion by the coating on the SST substrate due to high compressive stresses resulting from a much higher SST thermal expansion coefficient than that of BCO may cause the coating to bend perpendicularly to the substrate. If this occurs, during the nanoindentation test, the indenter indents into the tested coating and causes it to deflect (due to the lack of support). Consequently, the least load on the indenter is required to move the indenter over a distance of 300 nm.

3.3. Electrical Properties

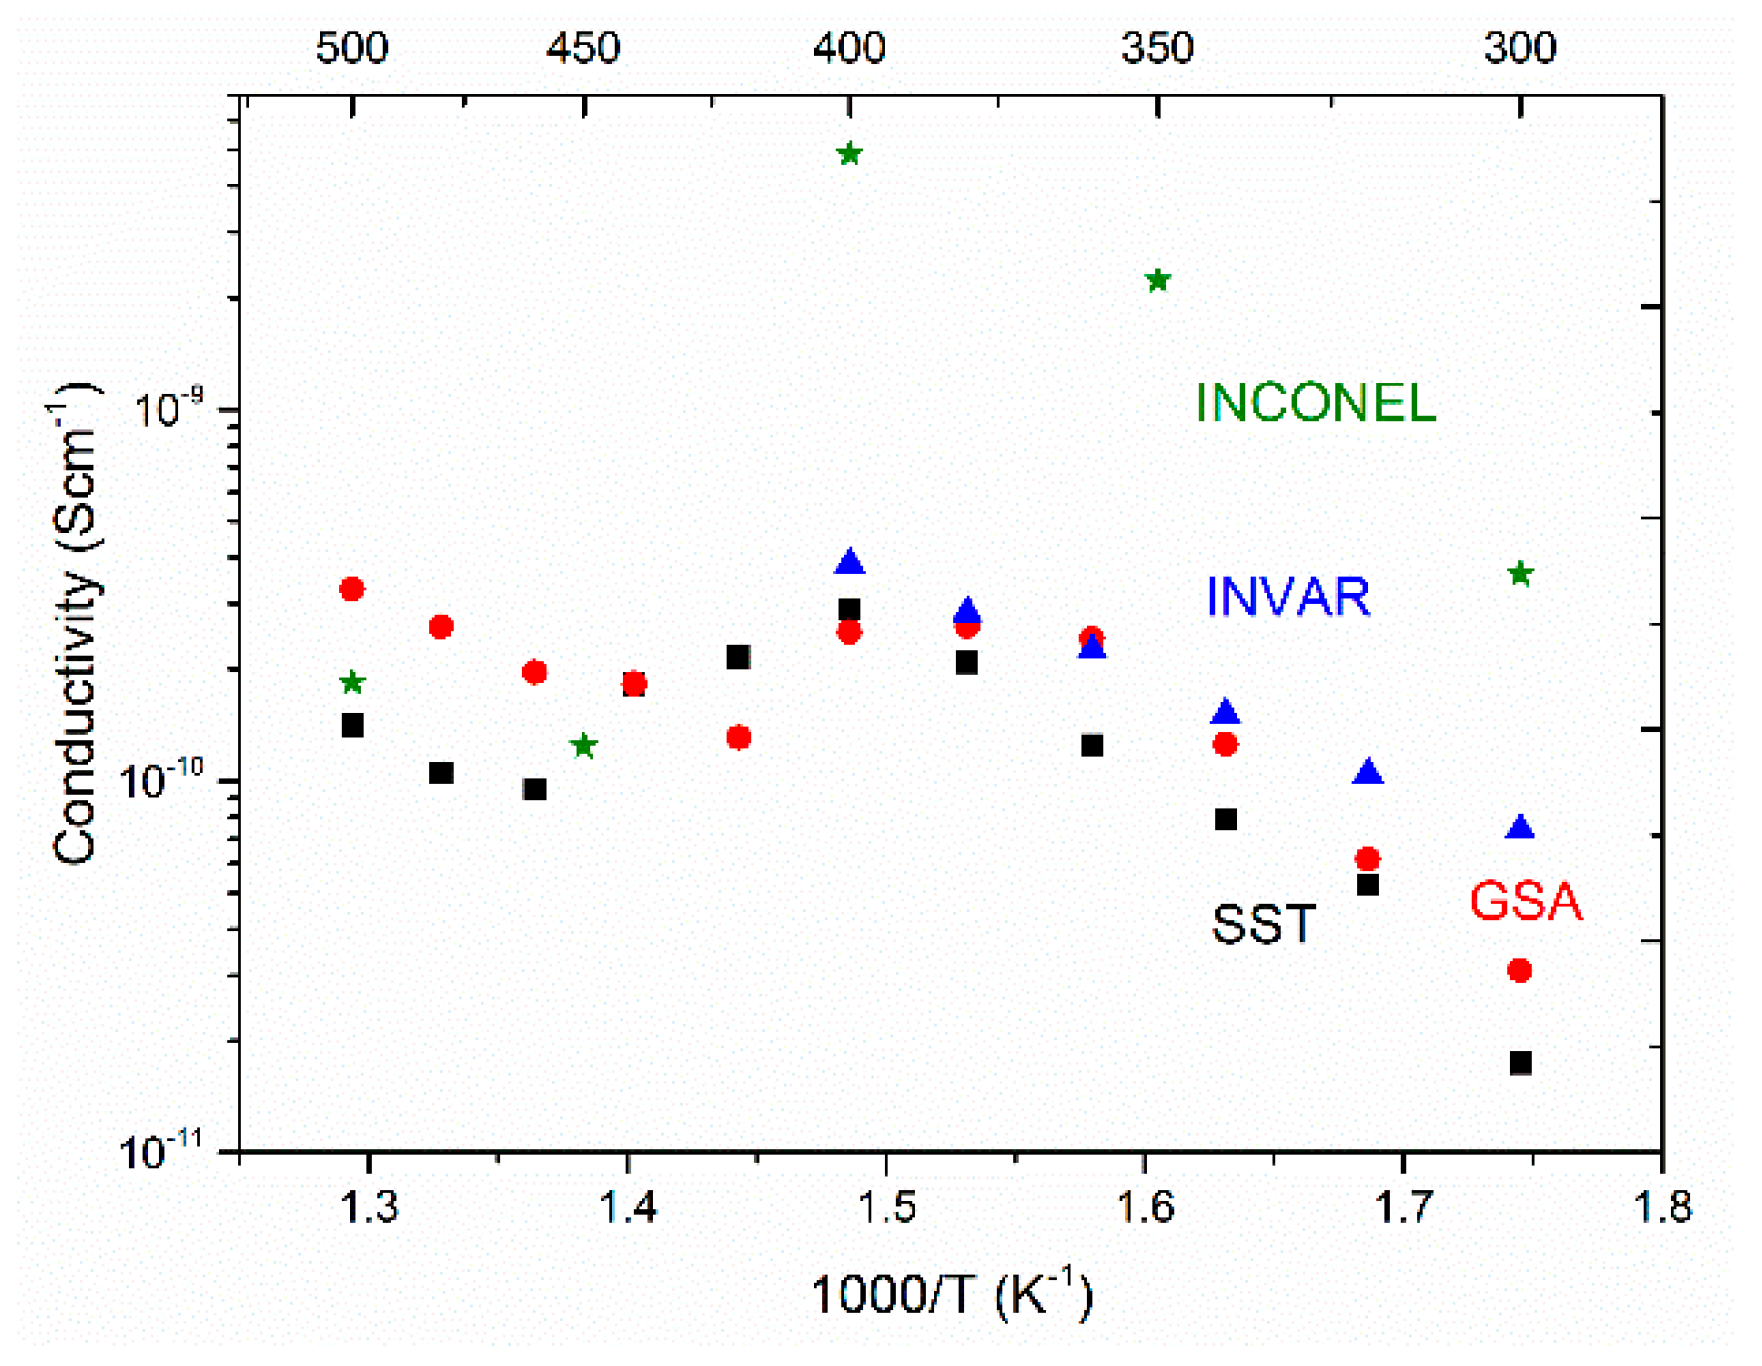
To study whether the strain present in the films modifies electrical transport properties, the conductivity of the films was studied. Because of the low resistance of metallic support compared with the BCO, the impedance spectroscopy measurements were carried out perpendicularly to the surface of the film. As indicated by the XRD analyses, the films studied in this work are partially oriented with the (110) planes parallel to the support surface. Therefore, the conductivity data correspond mainly to the [110] direction. To avoid support oxidation, an argon atmosphere was used during the investigations. Exemplary results of Nyquist plots and the total conductivity are presented in Figure 8 and Figure 9 respectively. The uncertainty of each measurement is within the thickness of the point.
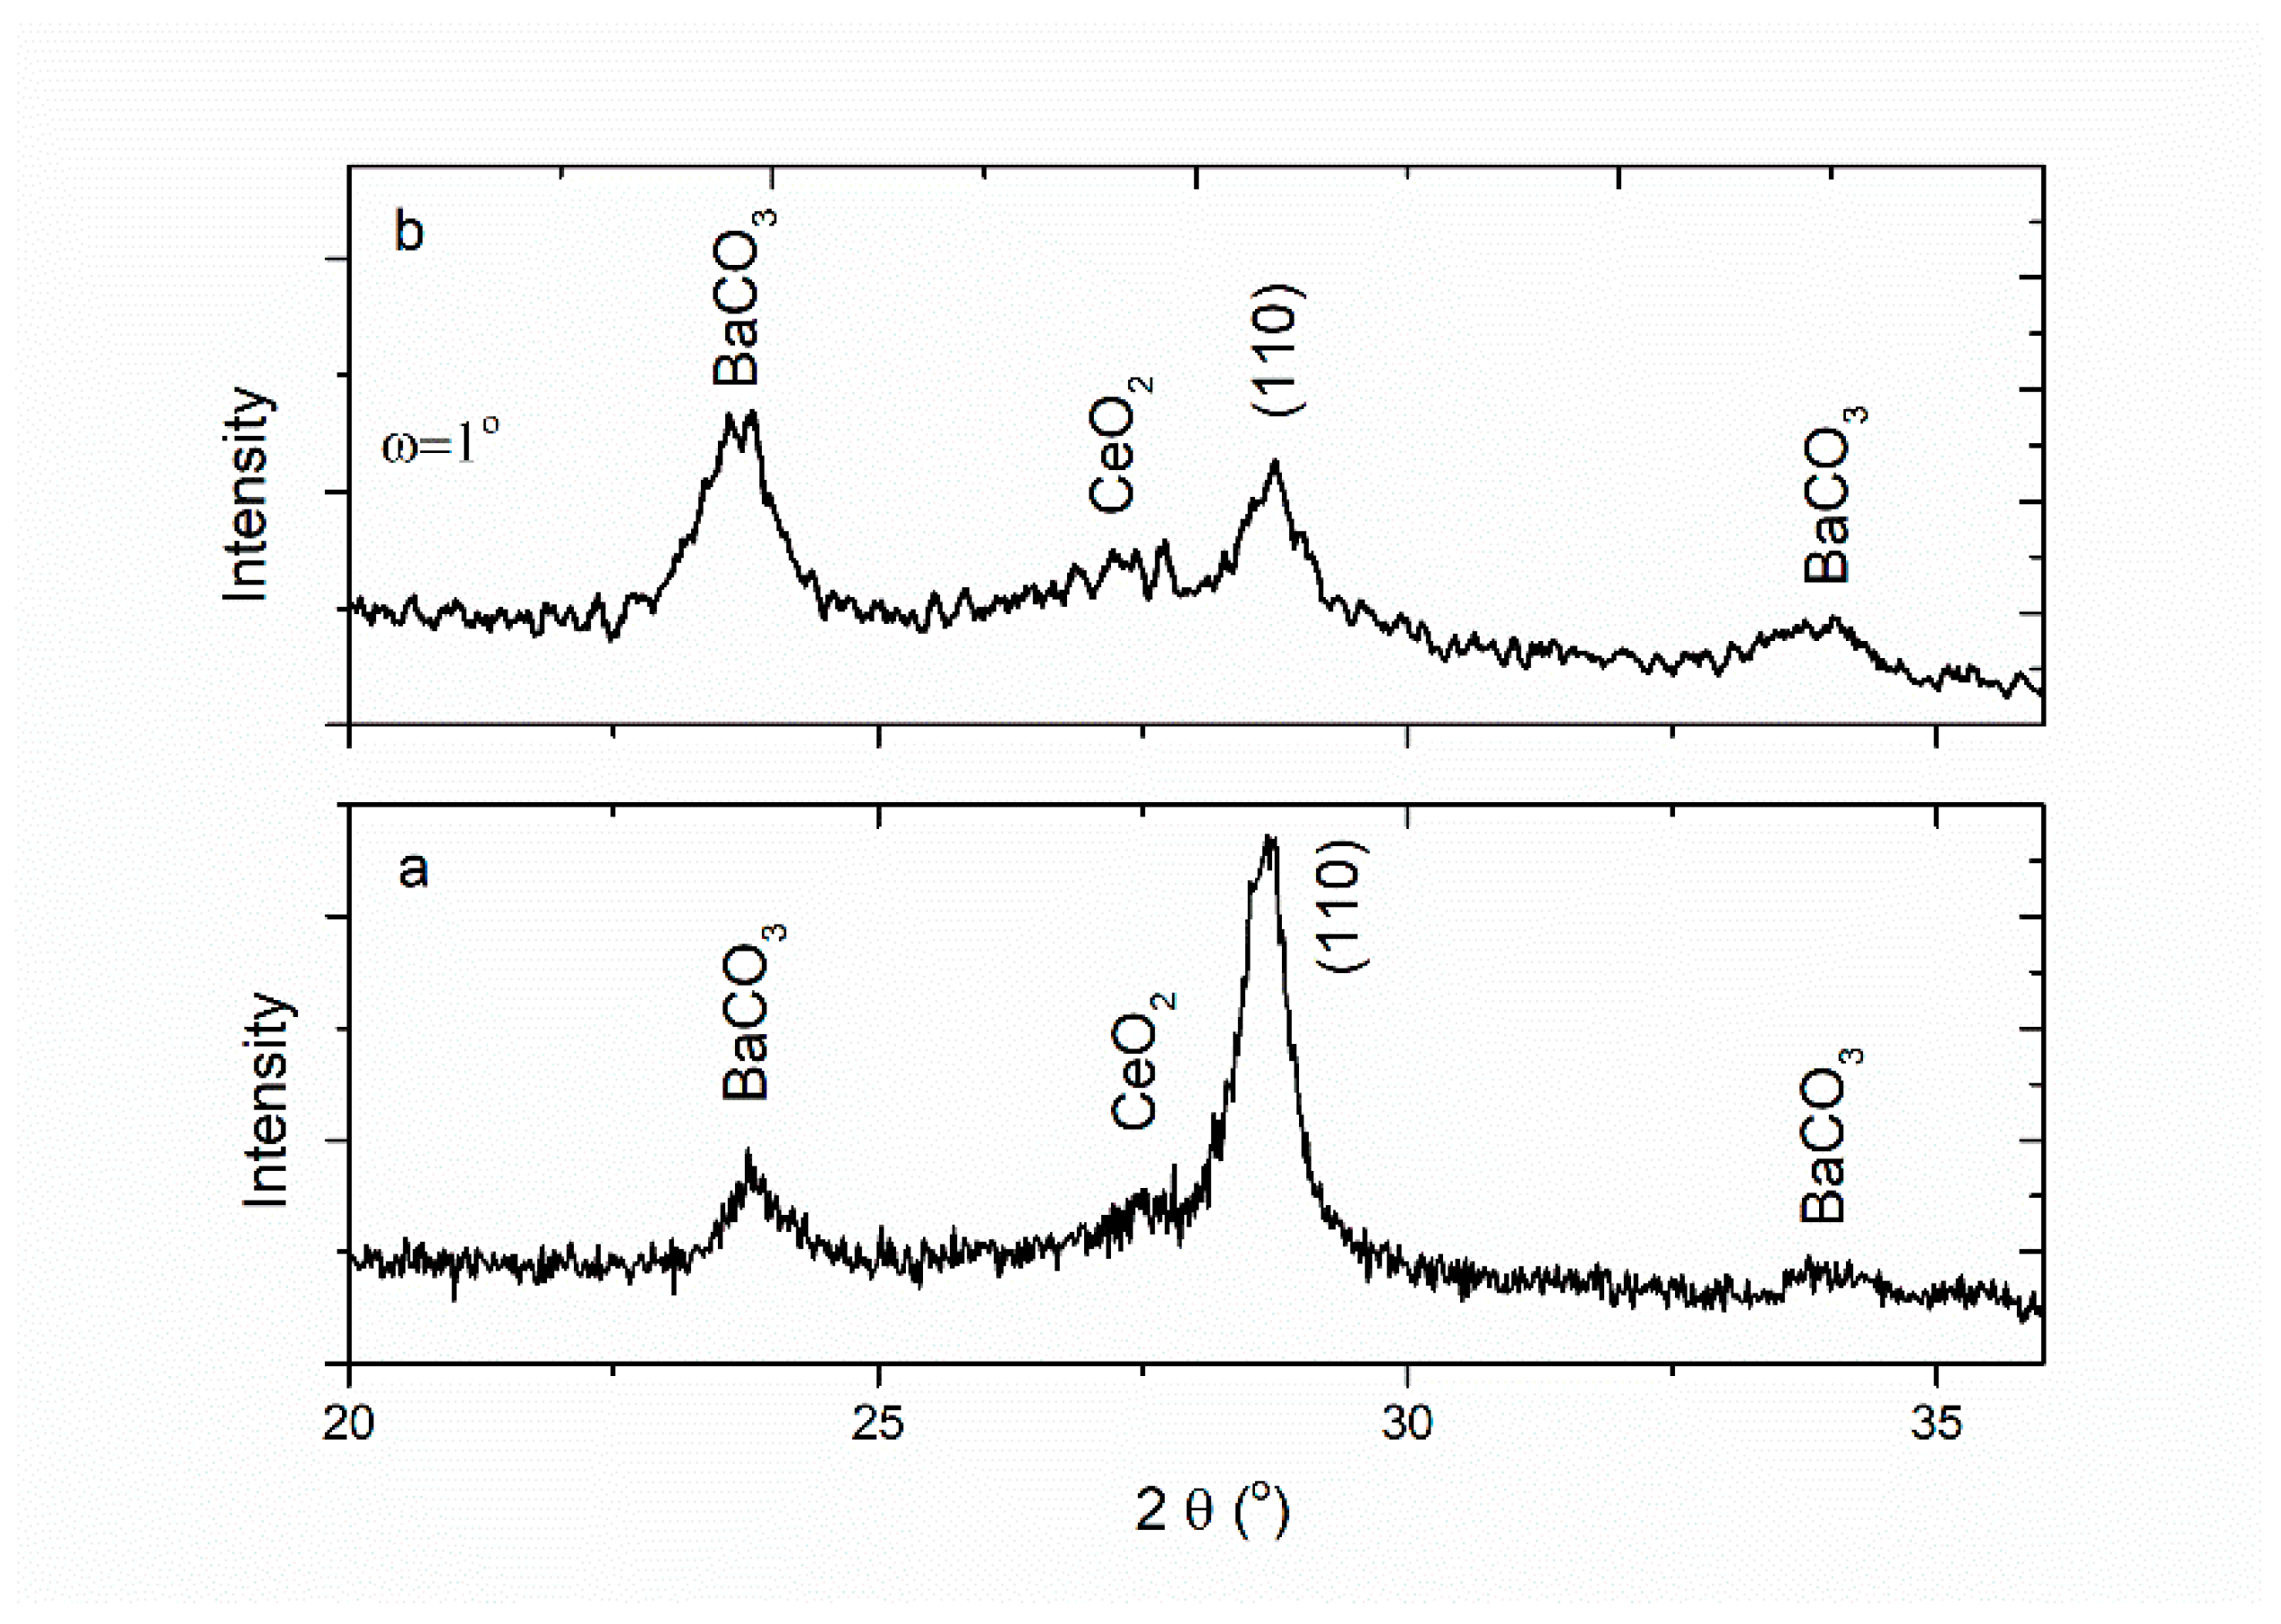
The results displayed in Figure 9 show that the temperature dependence of conductivity is not monotonic. Non-monotonic temperature dependence of conductivity is related to the processes that occur in the films and/or in the metallic substrates, as well as on the interface between them. The degradation process starts at a temperature of about 400 °C and leads to a decrease in total conductivity. To explain the degradation process, XRD analyses of the films after IS measurements were carried out. The exemplary results are presented in Figure 10.
It can be seen that new reflections corresponding to the formation of barium carbonate and cerium oxide are observed in the diffractogram. Simultaneously, the main reflection of the barium cerate (2θ about 30°) became weaker. The comparison of grazing incidence diffractogram obtained with the incidence angle of 1° and the diffractogram obtained with θ-θ scan shows that the rate of the intensities of the main barium carbonate reflection (2θ about 24.5°) and the (110) barium cerate is significantly higher for the low incidence angle. This indicates that the barium carbonate layer is located on the surface of the barium cerate film. The content of carbon dioxide in argon gas in which the measurements were carried out was minute so that the reason for that has not been explained so far. Nevertheless, it may be noticed that other authors studying barium cerate-zirconate films often present the data obtained below 400 °C (e.g., Fluri et al. showed the conductivity below 380 °C [7]). The apparent activation energy of total conductivity was determined in the temperature range from 300 °C to the degradation onset temperature. The electrical properties of the barium cerate films deposited on different substrates at a temperature of 600 °C with a 12 Å/s deposition rate are collected in Table 2.
It may be noted that the values of BCO films’ total conductivity at 350 °C are comparable with bulk conductivity in dry Ar (10−9–10−10 S/cm) [23]. Its activation energy is between 0.6 and 1.2 eV, which is lower than in the reported cases since, in bulk, undoped BaCeO3 in dry Ar is about 1.5 eV [23]. Two interesting features of the electrical properties of the studied strained films may be noticed.
Firstly, the film with the highest in-plane tensile strain shows the lowest activation energy of total conductivity. In our study, the conductivity was measured perpendicularly to the plane; therefore, it is the compressive strain that is experienced by the film in this direction. According to Fluri et al., in the case of undoped barium zirconate, the compressive strain, through the influence of oxygen–oxygen distances, causes an increase in proton diffusivity and a decrease in its activation energy [7]. Though the proton conductivity in a dry atmosphere is not expected to be high, the oxygen–oxygen distance is relevant for the transport of other charge carriers as well. Therefore, a similar influence of strain on the activation energy of total conductivity may be expected for the undoped barium cerate. The presence of strain directly influencing the distance between ions also changes the hopping distance that has to be covered by charge carriers. Moreover, the strain is related to stress, which modifies the electric potential in which hopping occurs. Strain/stress influence on transport phenomena allows for tailoring materials properties. This is especially interesting and promising in the case of epitaxial films or these polycrystalline but with the oriented crystal structure.
Secondly, the film deposited on the Inconel support, which is one that may be considered as not strained, shows the highest total conductivity. Interestingly, this film also was found to be harder than the other, strained films. As mentioned before, the influence of either the strain and/or support composition on the defect formation in the film may be considered as a possible reason for that. Fluri et al. observed that the tensile strain of 0.7% increased the conductivity of strained film at 200 °C of a factor of 2 in comparison to the relaxed film [7]. Since in the films studied in this work we observe approximately 10 times higher conductivity at 350 °C in the film that is not strained, we believe that other factors cause such a difference. Apart from the lack of strain, the chemical composition of the Inconel support makes this film different from the others. In particular, it is the largest Ni content in the Inconel alloy that may cause an increase in the total conductivity of the film. The chemical composition of the supports may indirectly influence the conductivity. One of the relevant mechanisms for this is Schottky barrier formation, which introduces the space charge into the film. Since the electron work function from the alloy depends on its elemental composition, the electric field, as well as the Debye length, may be different in the films deposited on the metallic supports.

4. Conclusions

Based on the investigation of the properties of barium cerate formed by E-beam deposition on metallic supports, we can conclude that it is the temperature of the support and the deposition rate that determine the phase composition and morphology of the films, while the thermal expansion coefficient of the support influences only selected properties of the films.
The films deposited at low temperature, in which surface diffusivity is slow, showed the presence of clusters in most cases forming fibrous morphology, which could be described within the structure zone model as zone I. Both the microstructural and X-ray diffraction analyses showed that higher temperature and higher deposition rate are necessary to get homogenous and dense thin films. Between 150 and 300 °C, a mixture of an amorphous phase crystalline BaCO3, and CeO2 were formed, whereas at 450 °C, dense films containing nanocrystalline BaCeO3 and CeO2 were formed. The films deposited at 600 °C with 12 Å/s deposition rate had oriented, crystalline cubic BCO structure on each substrate used disregarding its strain origin.
The barium cerate films deposited on different supports showed different mechanical properties. The highest hardness was observed in the case of the film with the lowest strain (Inconel). On the other hand, the hardness of the films with the tensile in-plane strain (GSA, Invar) was slightly lower, whereas that with the compressive in-plane strain (SST) was the lowest. Such an influence of strain on the hardness is considered unexpected and may be related to the influence of either the strain or the composition of the metallic support on the defect formation, which may influence the bond strength.
Two interesting features of the electrical properties of the studied strained films were noticed: the film with the highest in-plane tensile strain showed the lowest activation energy of total conductivity, whereas the film with the lowest strain showed the highest value of total conductivity. A decrease in total conductivity between 360 and 400 °C accompanied the disadvantageous decomposition of the BCO films.

Author Contributions

Conceptualization, M.G., G.L.; methodology, T.M., M.G., M.S. (Mantas Sriubas), M.S.C.C., M.S. (Marek Szkodo), K.B., G.L.; formal analysis, M.G., K.B., M.S. (Mantas Sriubas), M.S.C.C., G.L.; investigation, P.W, T.M., W.S., M.B., D.J., M.G., K.B., M.S. (Marek Szkodo), M.S.C.C., G.L.; writing—original draft preparation, K.B., M.S. (Mantas Sriubas), M.S.C.C., G.L.; writing—review and editing, P.W., M.G., M.S. (Marek Szkodo), K.B., G.L.; visualization, P.W., M.G., M.S. (Mantas Sriubas), M.S.C.C.; supervision, M.G., G.L.; project administration, M.G., K.B., G.L.; funding acquisition, M.G., G.L. All authors have read and agreed to the published version of the manuscript.

Funding

The research was financially supported by Research Council of Lithuania (LMTLT), agreement No. S-LL-18-3 and the National Science Centre, Poland project No. 2017/27/L/ST5/03185.

Conflicts of Interest

The authors declare no conflict of interest.

References

  1. Jeong, S.; Yamaguchi, T.; Okamoto, M.; Zhu, C.; Habazaki, H.; Nagayama, M.; Aoki, Y. Proton Pumping Boosts Energy Conversion in Hydrogen-Permeable Metal-Supported Protonic Fuel Cells. ACS Appl. Energy Mater. 2019, 3, 1222–1234. [Google Scholar] [CrossRef] [Green Version]
  2. Dogdibegovic, E.; Wang, R.; Lau, G.Y.; Karimaghaloo, A.; Lee, M.H.; Tucker, M.C. Progress in durability of metal-supported solid oxide fuel cells with infiltrated electrodes. J. Power Sources 2019, 437. [Google Scholar] [CrossRef] [Green Version]
  3. Shao, X.; Nilius, N.; Myrach, P.; Freund, H.-J.; Martinez, U.; Prada, S.; Giordano, L.; Pacchioni, G. Strain-induced formation of ultrathin mixed-oxide films. Phys. Rev. B 2011, 83, 2–6. [Google Scholar] [CrossRef] [Green Version]
  4. Tuller, H.L.; Bishop, S.R. Point Defects in Oxides: Tailoring Materials Through Defect Engineering. Annu. Rev. Mater. Res. 2011, 41, 369–398. [Google Scholar] [CrossRef]
  5. Wen, K.; Lv, W.; He, W. Interfacial lattice-strain effects on improving the overall performance of micro-solid oxide fuel cells. J. Mater. Chem. A 2015, 3, 20031–20050. [Google Scholar] [CrossRef]
  6. Shi, Y.; Lee, S.C.; Monti, M.; Wang, C.; Feng, Z.A.; Nix, W.D.; Toney, M.F.; Sinclair, R.; Chueh, W.C. Growth of Highly Strained CeO2 Ultrathin Films. ACS Nano 2016, 10, 9938–9947. [Google Scholar] [CrossRef]
  7. Fluri, A.; Marcolongo, A.; Roddatis, V.; Wokaun, A.; Pergolesi, D.; Marzari, N.; Lippert, T. Enhanced Proton Conductivity in Y-Doped BaZrO3 via Strain Engineering. Adv. Sci. 2017, 4, 1700467. [Google Scholar] [CrossRef]
  8. Løken, A.; Ricote, S.; Wachowski, S.L. Thermal and Chemical Expansion in Proton Ceramic Electrolytes and Compatible Electrodes. Crystals 2018, 8, 365. [Google Scholar] [CrossRef] [Green Version]
  9. Boukamp, B.A. A Nonlinear Least Squares Fit procedure for analysis of immittance data of electrochemical systems. Solid State Ionics 1986, 20, 31–44. [Google Scholar] [CrossRef] [Green Version]
  10. Chang, I.; Paek, J.Y.; Cha, S.-W. Parametric study of Y-doped BaZrO3 thin film deposited via pulsed laser deposition. J. Vac. Sci. Technol. A 2015, 33, 21515. [Google Scholar] [CrossRef]
  11. Abermann, R. Measurements of the intrinsic stress in thin metal films. Vaccum 1990, 41, 1279–1282. [Google Scholar] [CrossRef]
  12. Petrov, I.; Barna, P.B.; Hultman, L.; Greene, J.E. Microstructural evolution during film growth. J. Vac. Sci. Technol. A 2003, 21, S117–S128. [Google Scholar] [CrossRef]
  13. Barna, P.; Adamik, M. Fundamental structure forming phenomena of polycrystalline films and the structure zone models. Thin Solid Film. 1998, 317, 27–33. [Google Scholar] [CrossRef]
  14. Greene, J.E. Thin Film Nucleation, Growth, and Microstructural Evolution: An Atomic Scale View. In Handbook of Deposition Technologies for Films and Coatings; Martin, P.M., Ed.; William Andrew Publishing: Boston, MA, USA, 2010; pp. 554–620. [Google Scholar] [CrossRef]
  15. Evans, J.W.; Thiel, P.; Bartelt, M. Morphological evolution during epitaxial thin film growth: Formation of 2D islands and 3D mounds. Surf. Sci. Rep. 2006, 61, 1–128. [Google Scholar] [CrossRef]
  16. Metiu, H.; Lu, Y.-T.; Zhang, Z. Epitaxial Growth and the Art of Computer Simulations. Science 1992, 255, 1088–1092. [Google Scholar] [CrossRef] [PubMed]
  17. Kaiser, N. Review of the fundamentals of thin-film growth. Appl. Opt. 2002, 41, 3053–3060. [Google Scholar] [CrossRef] [PubMed]
  18. Yamanaka, S.; Fujikane, M.; Hamaguchi, T.; Muta, H.; Oyama, T.; Matsuda, T.; Kobayashi, S.-I.; Kurosaki, K. Thermophysical properties of BaZrO3 and BaCeO3. J. Alloys Compd. 2003, 359, 109–113. [Google Scholar] [CrossRef]
  19. Knuyt, G.; Quaeyhaegens, C.; D’Haen, J.; Stals, L. A quantitative model for the evolution from random orientation to a unique texture in PVD thin film growth. Thin Solid Films 1995, 258, 159–169. [Google Scholar] [CrossRef]
  20. Glavee, G.; Hunt, R.; Paranthaman, M. Low temperature preparation of BaCeO3 and Ce0.75Zr0.25O2 thin films using sol-gel processing techniques. Mater. Res. Bull. 1999, 34, 817–825. [Google Scholar] [CrossRef]
  21. Pharr, C.M.; Oliver, W.C. Measurement of Thin Film Mechanical Properties Using Nanoindentation. MRS Bull. 1992, 17, 28–33. [Google Scholar] [CrossRef]
  22. Karlsson, L.; Hultman, L.; Sundgren, J.-E. Influence of residual stresses on the mechanical properties of TiCxN1–x (x = 0, 0.15, 0.45) thin films deposited by arc evaporation. Thin Solid Films 2000, 371, 167–177. [Google Scholar] [CrossRef]
  23. Shima, D.; Haile, S.M. The influence of cation non-stoichiometry on the properties of undoped and gadolinia-doped barium cerate. Solid State Ion. 1997, 97, 443–455. [Google Scholar] [CrossRef]
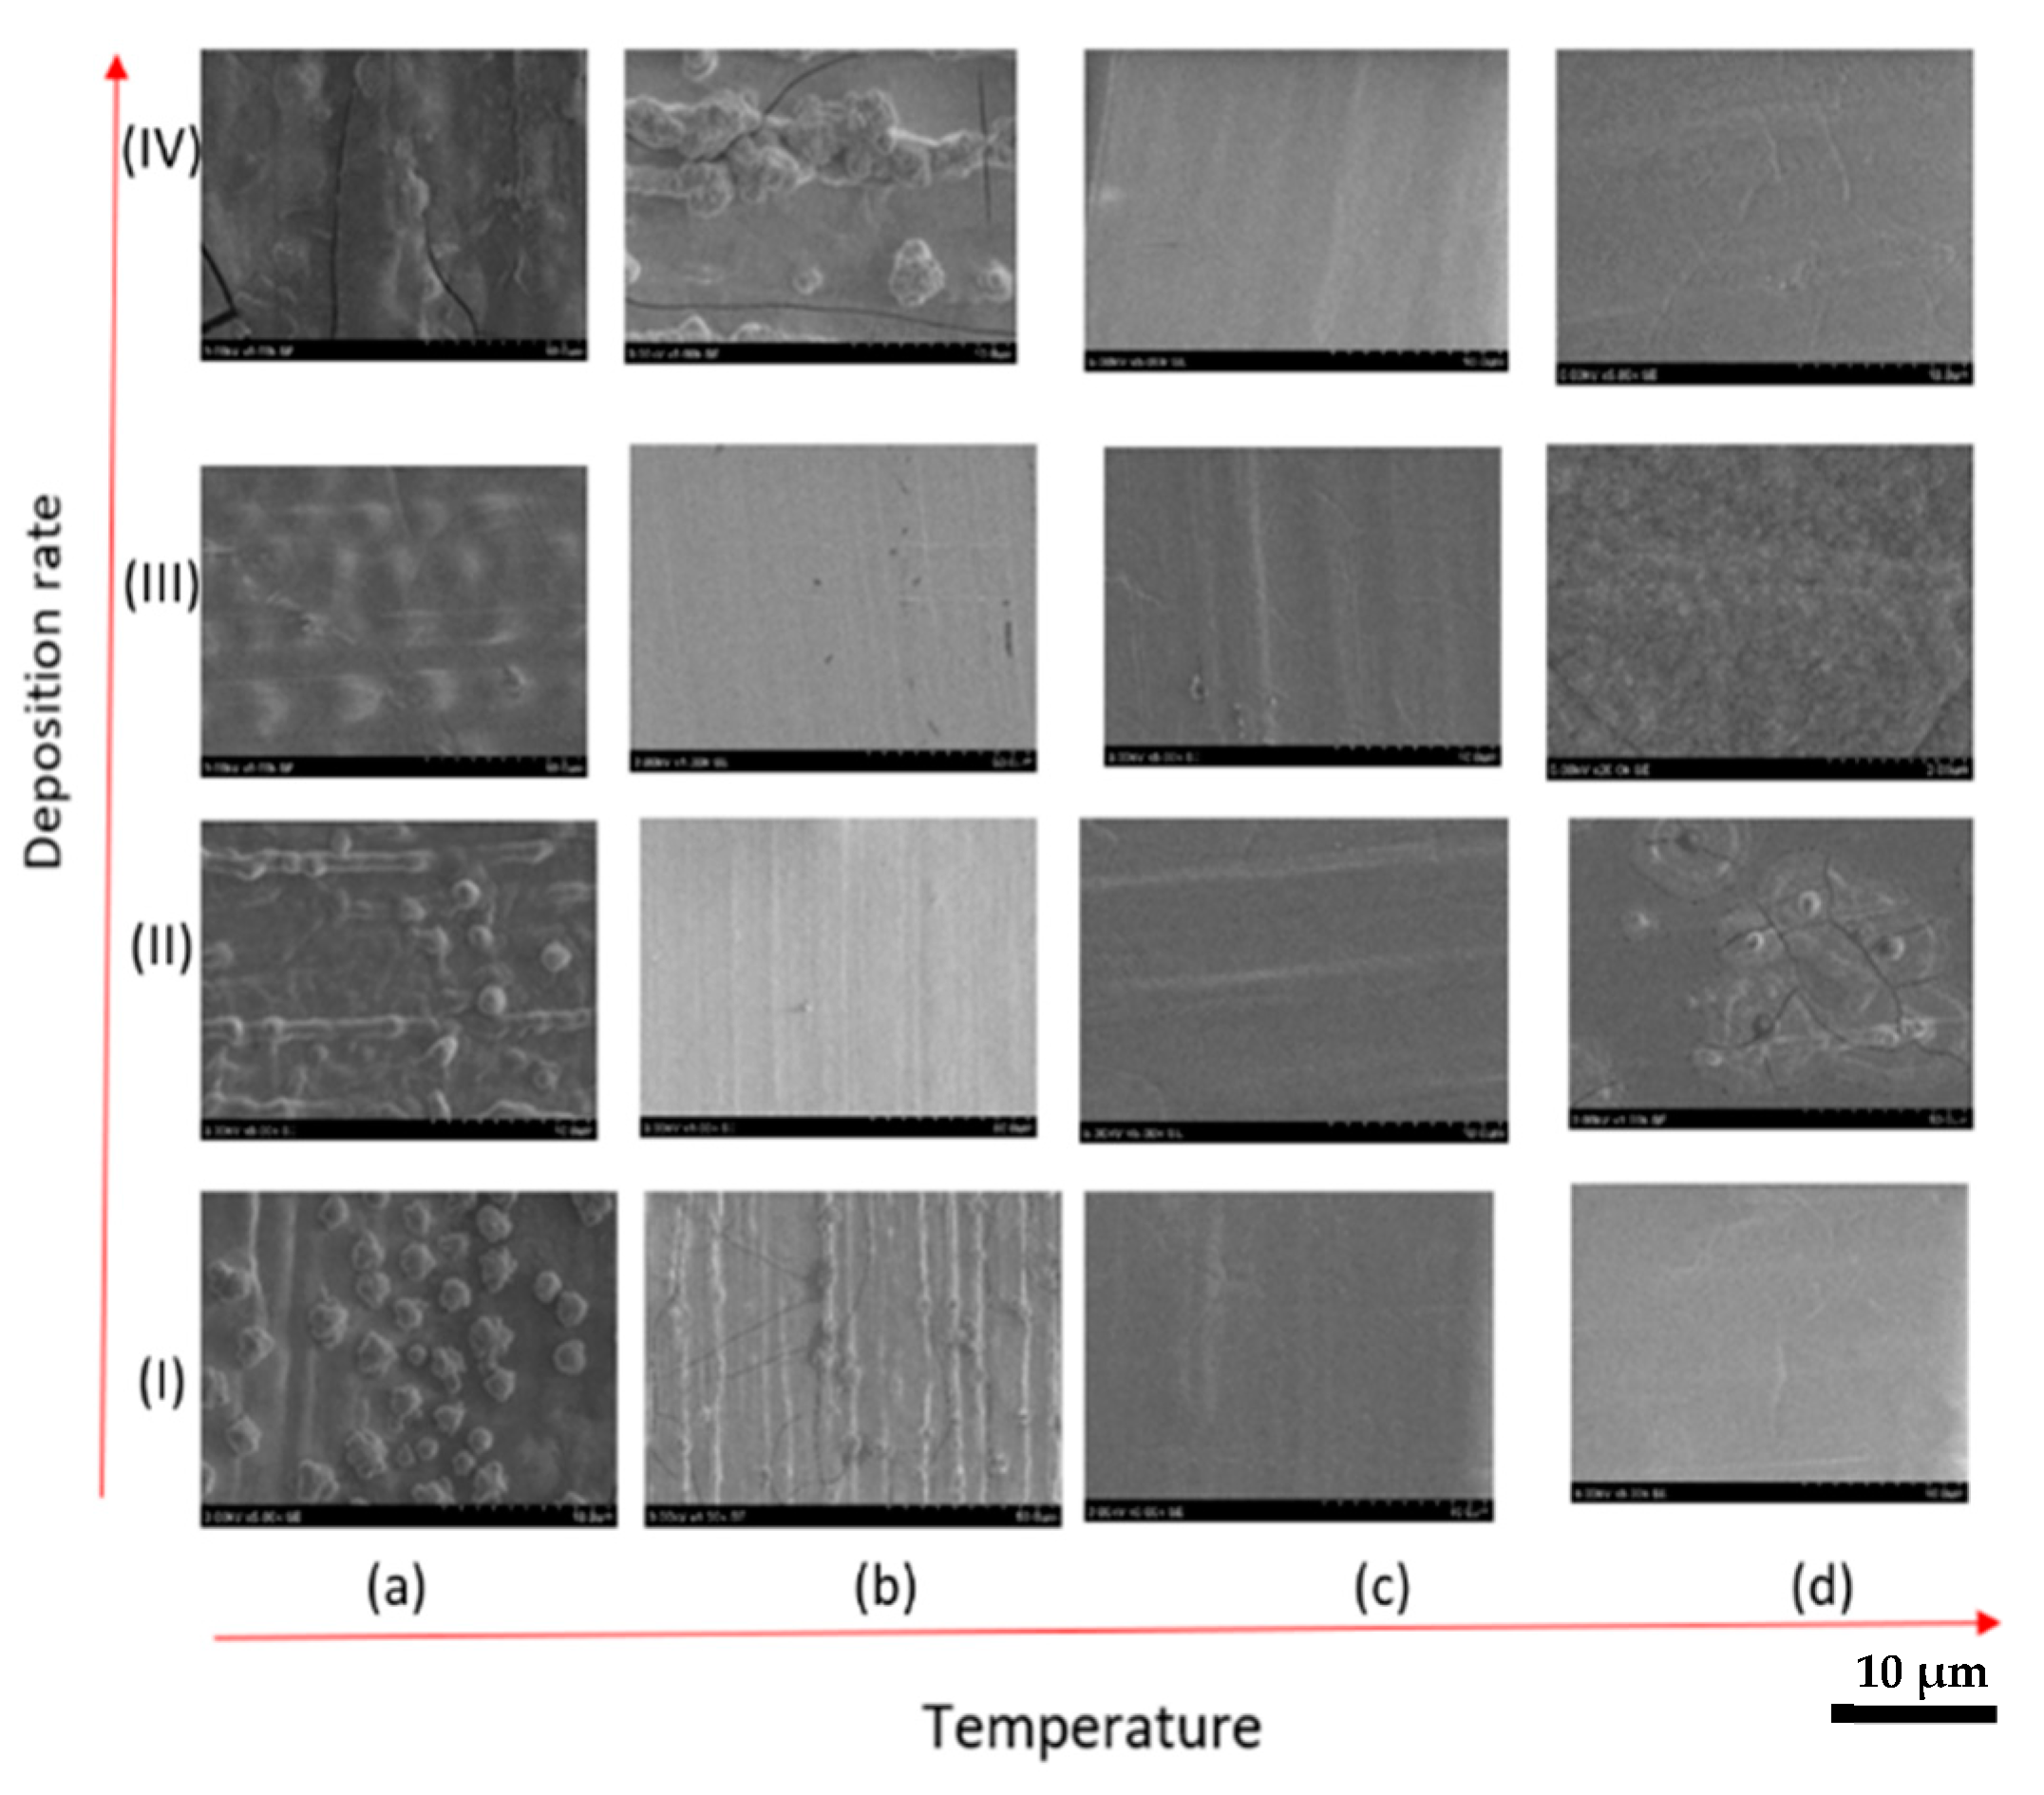
Figure 1. SEM of BCO thin films (×5 k magnification) on glass sealing alloy substrate at different temperatures (20 °C (a), 150 °C (b), 450 °C (c), 600 °C (d)) and deposition rates (2 Å/s (I), 4 Å/s (II), 8 Å/s (III), 12 Å/s (IV)).
Crystals 10 01152 g001
Figure 2. SEM of BCO thin films (×5 k magnification) on stainless steel substrate at different temperatures (20 °C (a), 150 °C (b), 450 °C (c), 600 °C (d)) and deposition rates (2 Å/s (I), 4 Å/s (II), 8 Å/s (III), 12 Å/s (IV)).
Crystals 10 01152 g002
Figure 3. SEM of BCO thin films (×5 k magnification) on Inconel alloy substrate at different temperatures (20 °C (a), 150 °C (b), 450 °C (c), 600 °C (d)) and deposition rates (2 Å/s (I), 4 Å/s (II), 8 Å/s (III), 12 Å/s (IV)).
Crystals 10 01152 g003
Figure 4. SEM of BCO thin films (×5 k magnification) on Invar substrate at different temperatures (20 °C (a), 150 °C (b), 450 °C (c), 600 °C (d)) and deposition rates (2 Å/s (I), 4 Å/s (II), 8 Å/s (III), 12 Å/s (IV)).
Crystals 10 01152 g004
Figure 5. X-ray diffraction patterns of the films deposited on the stainless steel support using 2 Å/s and 12 Å/s deposition rates and different support temperatures. Miller indices of the (110) plane denote the main reflection of the barium cerate perovskite.
Crystals 10 01152 g005
Figure 6. XRD patterns of the films deposited on different substrates at a temperature of 600 °C and with a deposition rate of 12 Å/s.
Crystals 10 01152 g006
Figure 7. Examples of load–displacement curves obtained with Berkovich indenter. The data recorded in two different film points for the indentation depth not exceeding 300 nm are presented.
Crystals 10 01152 g007
Figure 8. Exemplary Nyquist plots for BaCeO3 deposited on stainless steel (SST) and glass sealing alloy (GSA) (open symbols) with their fits (lines).
Crystals 10 01152 g008
Figure 9. Temperature dependence of total conductivity in barium cerate films deposited on the metallic substrates at 600 °C with 12 Å/s. Conductivity was measured in a dry argon atmosphere. The uncertainty of each measurement is within the thickness of the point.
Crystals 10 01152 g009
Figure 10. XRD patterns of the BCO films deposited on Inconel carried out after the Impedance Spectroscopy measurements. The patterns were obtained as (a) a typical θ-θ scan and (b) a grazing incidence scan.
Crystals 10 01152 g010
Table 1. Composition of the different substrates and barium cerate.
SubstrateThermal Expansion Coefficient (TEC), 10−6·K−1Chemical Composition
Invar1.7–2.0Fe, 64%
Ni, 36%
May have traces of Mn, Si, and C
Glass sealing alloy (GSA)4.8Fe, 54%
Ni, 29%
Co, 17%
May have traces of Cu, Mn, Si, and C
Inconel alloy 60011.5–13.3Fe, 8%
Ni, 72%
Cr, 16%
May have traces of Cu, Mn, Si, C, and S
Stainless steel (SST)18Fe, 73%
Ni, 7%
Cr, 17%
Mn, 2%
Si, 1%
May have traces of P, S, C, and N
BaCeO311.2 [8]
Table 2. Electrical properties of the barium cerate films deposited on different substrates at a temperature of 600 °C with 12 Å/s deposition rate.
SubstrateType of the
in-Plane Strain
σ (350 °C, Dry Ar)
(S/cm) × 10−10
EA
(eV)
Degradation Onset Temperature (°C)
Invartensile1.90.6400
Glass sealing alloy (GSA)tensile2.21.13360
Inconel alloy 600quasi not strained220.9400
Stainless steel (SST)compressive1.00.95400
Publisher’s Note: MDPI stays neutral with regard to jurisdictional claims in published maps and institutional affiliations.