Article

The Methods to Crystallize Anhydrous L-Phenylalanine from Methanol-Water Solution

1
Guangxi Key Laboratory for Polysaccharide Materials and Modifications, Key Laboratory of Chemical and Biological Transformation Process of Guangxi Higher Education Institutes, School of Chemistry and Chemical Engineering, Guangxi University for Nationalities, Nanning 530006, China
2
Guangxi Tobacco Monopoly Bureau, Nanning 530006, China
3
Shengtong Technology and Development Company, Tianjin 300000, China
*
Author to whom correspondence should be addressed.
Crystals 2020, 10(2), 60; https://doi.org/10.3390/cryst10020060
Submission received: 11 November 2019 / Revised: 25 December 2019 / Accepted: 3 January 2020 / Published: 22 January 2020

Abstract

:
In this paper, the transformation water activity of L-Phenylalanine (L-Phe) in a methanol-water solution at a different temperature was measured by the ternary diagram. The influence of water activity on the transformation temperature and on the transformation rate was investigated. The solubility of the metastable form of different water activities was estimated based on the thermodynamic equilibrium and the results showed that the anhydrous L-Phe can be synthesized at room temperature by decreasing water activity, the transformation rate from monohydrate to anhydrate was enhanced with the increase of water activity. The predicted solubility value is in good agreement with the experimentally obtained. Meanwhile, tailor-made additives were applied into the system as to investigate the transformation behavior of L-Phe. Their mechanism was proposed based on the Langmuir model fitting. The result manifested that the addition of L-Trp/L-His amino acid in the L-Phe solution decelerated the transformation rate. When the concentration of L-Trp amino acid reached 0.7 × 10⁻⁴ mol/mL, the transformation behavior of L-Phe can be fully impeded, and the transformation behavior can be partially inhibited with the addition of L-Trp at 313.15 K or with the addition of L-His at 283.15 K/313.15 K.

1. Introduction

Hydrate is an ordinary pharmaceutical polymorph [1,2,3], 57% of pharmaceuticals can form hydrate polymorphs. Different polymorphs may present different properties, such as solubility, physical, bioavailability and product performance [4,5,6,7,8]. It is of great significance to understand and control the transformation behavior during pharmaceutical development and manufacturing processes [9,10]. Recently, much attention has been focused on the regulation of polymorphism and various methods have been used to control the polymorphism crystal form, such as temperature, additives and the time of crystal transformation. Now, the method of regulating water activity to realize production control of hydrated polymorphism due to low contaminate is put forward in this paper. Recently, much attention has been focused on the regulation of polymorphism and various methods have been used to control transformation, such as temperature, additives and solvents. Now, the method of regulating water activity to realize the production control of hydrated polymorphism due to low contaminate is put forward in this paper.
In the present work, L-Phenylalanine (L-Phe, C38H72N2O12) (Figure 1) was chosen as a model system which exits in an anhydrous form and as a monohydrate form [11]. L-Phe is one of the nine essential amino acids and an important intermediate in the synthesis of many biological and chemical substances [12,13,14], widely used in the pharmaceutical, chemical and food industries [15,16,17,18]. Commonly, the anhydrous form was the target crystal form on account of its flaky habit, good fluidity, easy storage and transportation and its ability to be crystallized from the solution above 37 °C. The transformation behavior of L-Phe was discussed by Mohan [19] and Wang [20], and our preliminary work using amino-acids as a tailor-made additive was presented in [21]. Nevertheless, water activity was never applied in the solution to investigate the transformation behavior.
The target of this research is to obtain L-Phe anhydrate from solution by altering the water activity of the system. The transformation water activity in a methanol-water solution at different temperatures was determined by phase equilibrium, the influence of water activity on transformation (temperature, transformation rate) was investigated. Based on thermodynamic equilibrium, transformation water activity was calculated by using the solubility ratio of hydrate to anhydrate. Besides these, another regulation method-additives was applied in the system. The tailor-made additive has the same molecular structure as the parent molecule, but with a slight change in structure, which is easy to selectively interact with the active component. It has been proved to be an effective method to control solution crystallization kinetics. So the effect and mechanism of additives on the transformation behavior was discussed. All the results can provide a theoretical basis for the regulated transformation of hydrated polymorphs.

2. Materials and Methods

2.1. Materials

L-Phe was obtained from Maclean Biochemical Technology Co., Ltd (Shanghai, China). Methanol was supplied by Guangfu Chemical Co., Ltd (Tianjin, China). A chromatographic methanol class was obtained from Merck & Co., Inc. They were used as received.

2.2. Solubility Measurement

Several solubility determination methods have been summarized in [22]. In this work, the solubility of L-Phe was determined by a static method. The saturated solution was obtained by adding excessive L-Phe in glass vessels containing solvents. Once the solid-liquid equilibrium was arrived, the agitation was stopped, the upper solution was filtered by 0.22 μm filters and analyzed by HPLC (1200 Series, Agilent1200, New York, NY, USA). The remaining solid was separated and characterized by PXRD (Rigaku) D/max-2500).
The mole fraction solubility of L-Phe in binary solvent mixtures was calculated on the basis of the following equation:
x = m 1 / M 1 m 1 / M 1 + m 2 / M 2 + m 3 / M 3
where, x represents mole fraction solubility of L-Phe in binary solvent mixtures; m1, m2, and m3 represent the masses of L-Phe, organic solvent and water in the binary solvent mixtures; M1, M2 and M3 are the molecular weights of L-Phe, organic solvent and water in solvents.

2.3. Transition Water Activity Measurement

Excessive L-Phe was added to the water/methanol mixtures. (varying water mole fraction from 0.10 to 0.99), and water activity was assigned using the Wilson equation. Parameters of the Wilson equation for above solvents are listed in Section 3.2.

2.4. Transformation Controlled by Tailor-Made Additives

All transformation experiments were conducted using the method reported in the literature [23]. The saturated solution of L-Phe+H2O/L-Phe was prepared by dissolving excessive L-Phe+H2O or L-Phe in water or with a different concentration of L-Trp/L-His acid at the fixed temperature for 24 h. After that, the solution was filtered. A 40 g portion of the saturated solution of L-Phe+H2O/L-Phe with L-Phe/L-Phe+H2O powder (0.2 g) was employed in each experiment. The transformation was implemented in different water activity with continuous agitation. The temperature was kept at 283.15 K for transformation from L-Phe to L-Phe+H2O and at 323.15 K for transformation from L-Phe+H2O to L-Phe. Samples were taken out and filtered at the desired time intervals. The solid was dried at 303.5 K for 24 h and the transformation degree was analyzed by PXRD.

2.5. Methods of Analysis

X-ray diffraction: Minflex600 Rigaku was used to collect PXRD data of all samples. Cu Kα radiation was used as a source with wavelength λ = 1.5406 Å at 15 mA and 40 kV. All samples were scanned at 2θ range from 3° to 40° at a scanning rate of 1° min−1.
Differential scanning calorimetry: The melting temperature of L-Phe was determined by differential scanning calorimetry (DSC) (Mettler-Toledo, model DSC1/500, Switzerland) under a nitrogen atmosphere. Temperature ranged from 293.15 K to 1093.15 K, heating rate 10 K/min, the sample quantity was 9 mg.
The concentration of L-Phe was quantified by high performance liquid chromatography (1200 Series, Agilent1200, New York, NY, USA) at 260 nm, using a ZORBAX SB-C18 column (4.6 mm × 150 mm, 5-micron, Agilent, China). The mobile phase was 30% methanol (Vmethanol:Vwater = 3:7) with a flow rate of 1 mL/min.

3. Thermodynamic and Correlating Models

3.1. Correlation of Solubility with Temperature

The mole fraction solubility of L-Phe(x) with temperature (T) was fitted by the modified Apelblat [24,25,26,27] and λh Equation (3) [28], described by Equations (2) and (3).
l n x =   A + B T / K + C l n ( T / K )
1 x 1 = 1 λ { e x p [ λ h ( 1 T 1 T m ) 1 ] }
where Tm stands for the melting point of L-Phe; A, B, C, λ and h are the model parameters.
The models were evaluated by the relative average deviation (ARD) and root-mean-square deviation (RMSD) [29,30] which can be expressed by the following equation:
R M S D = [ 1 N i = 1 N ( x c x e ) 2 ] 1 / 2
R A D =   1 N ( | x c x e | x e )
where N stands for the number of experimental points x e and x c represents the experiment solubility and calculated ones.

3.2. Correlation of Water Activity

The relationship between water activity a[H2O] and the water mole fraction was reported in Rs [31], which is shown in Equation (6):
a [ H 2 O ] = γ 1 x 1
where a[H2O] stands for the water activity; and x1 stands for the water mole fraction in solvent mixtures; the γ1 represents the activity coefficient of water in methanol-water
The relationship between transition water activity aT[H2O] and the water activity a[H2O] was reported in Rs10 by Equation (7):
a T [ H 2 O ] = [ A ] x h [ A ] x a m × a [ H 2 O ]
where xh[A] and xa[A] stand for hydrate solubility and anhydrate solubility in the solvent. a[H2O] is the water activation for the binary system, aT[H2O] is the transition water activity, which is the water activation for the binary system when the crystals transform from one crystal to another.
The activity coefficient in methanol-water was calculated by the Wilson [32] equation, which described in Equations (8)–(12):
g E R T = x 1 ln ( x 1 + 12 x 2 ) x 2 + 21 x 1
ln γ 1 = ln ( x 1 + 12 x 2 ) + x 2 ( 12 x 1 + 12 x 2 21 x 2 + 21 x 1 )
ln γ 2 = ln ( x 2 + 21 x 1 ) + x 1 ( 21 x 2 + 21 x 1 12 x 1 + 12 x 2 )
21 = V 1 L V 2 L exp [ ( g 21 g 22 ) / R T ]
12 = V 2 L V 1 L exp [ ( g 12 g 11 ) / R T ]
where V 1 L and V 2 L represents the molar volume of water and methanol, respectively ( V 1 L equal to 18.018883; V 2 L equal to 39.57286 ), g12g11 and g21g22 can be obtained through the gas-liquid balance manual (g12g11 equal to 107.3832; g21g22 equal to 469.5509 [33]), x1 is the mole fraction of water in the solvent mixtures, x2 is the mole fraction of organic in the solvent mixtures, γ1 represents the activity coefficient of water in methanol-water and γ2 represents the activity coefficient of organic in methanol-water, ^12 and ^21 are the adjustable parameters for the Wilson equation.

3.3. Transformation Model

Davey and Mullin derived the following expression for the step velocity in the presence of impurity, assuming that the rate of surface diffusion of growth units to the steps, which is a rate-determining process, is reduced by impurities adsorbed on the terraces [34,35,36]:
v / v 0 = 1 e θ e q
v / v 0 = 1 [ e K c / ( 1 + K c ) ]
where v0 is the step velocity without impurity; e stands for an effectiveness factor; K stands for the Langmuir constant; θeq represents an adsorption factor.
v/v0 in Equation (4) can be substituted by the relative growth rate G/G0 provided that G is supposed to be proportionate to the v.
G / G 0 = 1 [ e K c / ( 1 + K c ) ]
Meanwhile, G is in inverse proportion to the transition time t. Thus, the equation can be rewritten as follows:
t 0 / t = 1 [ e K c / ( 1 + K c ) ]
where, t0 is the transition time without impurity.

4. Results and Discussion

4.1. Solubility in the Binary Solvent Mixtures

The solubility of L-Phe in binary solvent mixtures of (water-methanol) at the temperature ranging from 293.15 K to 322.15 K was measured and presented in Table 1. The results demonstrated that L-Phe anhydrate solubility was increased with temperature, but the increase was not large, which indicated that the solubility of L-Phe was not sensitive to temperature. At a certain temperature, the solubility increased with the water activity due to the solvent polarity increasing with the water activity.
The solubility data calculated by the modified Apelblat equation and λh equation were graphically shown in Figure 2, and the model parameters, ARD and RMSD values were all listed in Table 2. It can be seen that ARD and RMSD were acceptable, all no greater than 0.030 and 7.45 × 10⁻⁵.

4.2. The Ternary Phase Diagram

The representative PXRD patterns of L-Phe in different water activities at a temperature (293.15 K, 297.15 K and 302.15 K) were showed in Figure 3b–d, and the mass fraction solubility data are listed in Table 3. The ternary phase diagrams (TPDS) for the system of methanol/water/L-Phe at different temperatures are presented in Figure 4.
As illustrated in Figure 4, it is divided into 4 regions by the solubility curves of L-Phe (line b–c) and L-Phe+H2O (line a–b). The point of intersection of these two solubility curves b is the transformation point, where anhydrous L-Phe and L-Phe+H2O can coexist at this point. Region 1 means the undersaturated solution. Region 2/3 stands for the solution in equilibrium with anhydrous L-Phe and L-Phe+H2O, respectively. Region 4 signifies the coexistence of anhydrous L-Phe and L-Phe+H2OThe L-Phe+H2O is the most stable form when water activity is higher than the transition water activity, i.e., Region 3, and anhydrous L-Phe is the stable form if the water activity is lower than the transition, i.e., Region 2. In other words, anhydrous L-Phe is stable when a[H2O] < 0.921 (x1 < 2.27 × 10⁻³) and L-Phe+H2O is stable when a[H2O] > 0.982 (x1 > 2.89 × 10⁻³) at the temperature range from 293.15 K to 308.15 K. Based on the results mentioned above, an anhydrous L-Phe crystal can be obtained by adjusting a[H2O] during the temperature range studied. L-Phe can be gained by adjusting a[H2O] < 0.921. Meanwhile, the relationship between the transition water activity and temperature was investigated (Figure 4a). It can be seen that αw increased obviously with the increase of temperature, which can be described by Equation (17). Combining the obtained transition water activity, the solubility of metastable crystal form can be predicted by Equation (17) and Equation (7).
a T [ H 2 O ] = 0.00673 T 1.0506   R 2 = 0.99996
In the solubility measurement experiment, the solubility of L-Phe+H2O at 302.15 K temperature in methanol-water solvents with the water activity of 0.84 was 3.19 × 10⁻³, and the L-Phe solubility was 2.73 × 10⁻³ calculated by Equation (7). The solubility of L-Phe+H2O in the same system was determined to be 2.38 × 10⁻³ (see Table 1), which was consistent with the predicted results.

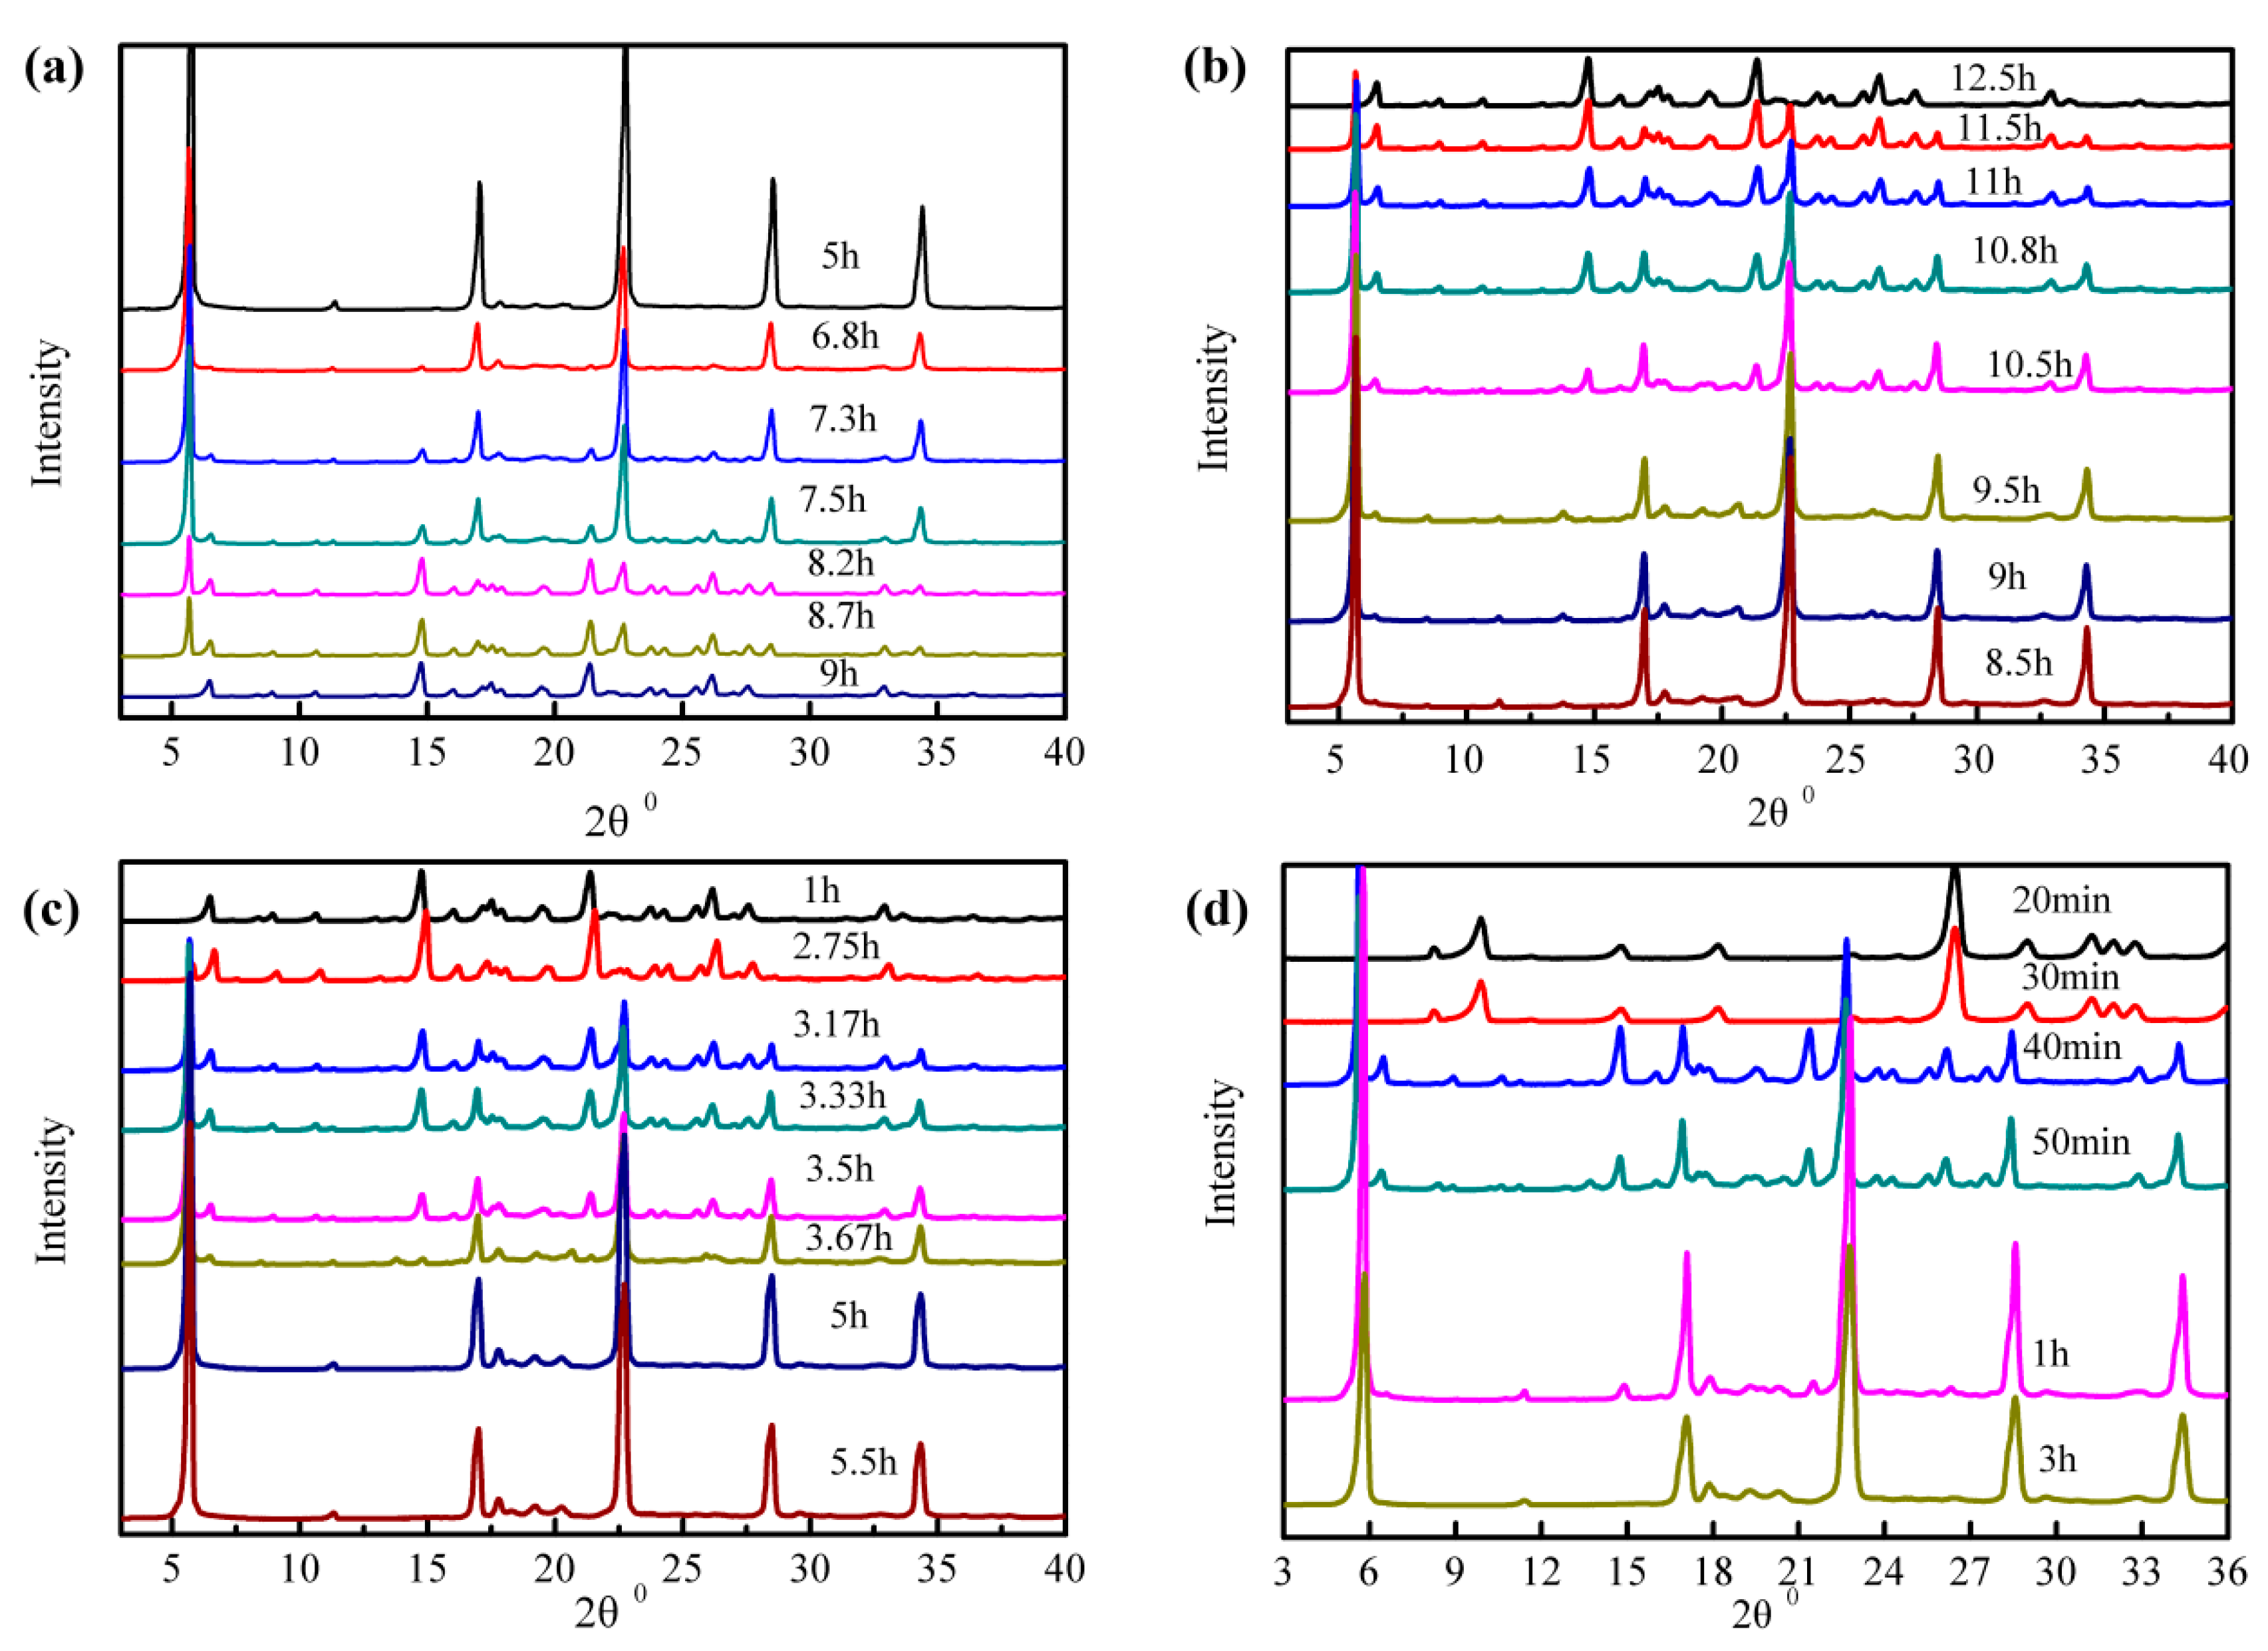
4.3. Transformation Kinetics

The transformation behavior from anhydrous L-Phe to L-Phe+H2O at temperature 283.15 K and from L-Phe+H2O to anhydrous L-Phe at temperature 323.15 K were carried out with the water activity of 0.77 and 0.84. The transformation of crystal form plotted in Figure 5, showed that at temperature 283.15 K, when the crystal transformation time reached 9 h (water activity equal to 0.84 as was shown in Figure 5a) and 12.5 h (water activity equal to 0.77 as was shown in Figure 5b), the anhydrous L-Phe were substantially completely converted into L-Phe+H2O. At temperature 283.15 K, When the crystal form conversion time reached 3 h (water activity equal to 0.84 as was shown in Figure 5c) and 5.5 h (water activity equal to 0.77 as was shown in Figure 5d), the L-Phe+H2O were substantially completely converted into anhydrous L-Phe. The transformation behaviors indicated that the crystal form conversion of L-Phe can be inhibited with reducing water activity, which can be applied to control the production of anhydrous L-Phe.

4.4. Transformation Controlling by Additive

The effects of additive concentration of L-His/L-Trp on transformation behavior of L-Phe from anhydrate/monohydrate to monohydrate/anhydrate were carried out in pure water at 283.15 K/313.15 K. The data were listed in Table 4 and calculated by Equation (16) were graphically shown in Figure 6. The inhibition behavior was represented by the Langmuir model (Figure 6). The values of fitting parameter K, e, and R2 are shown in Table 5. It was concluded that the transformation behavior was markedly inhibited by the concentration of L-His/L-Trp additives at temperature 283.15 K/313.15 K. The relative transformation time t0/t from anhydrate to monohydrate at 283.15 K decreased steeply (roughly linearly) with the increase of L-Trp concentration. When the concentration of L-Trp is up to 0.7 × 10⁻⁴ mol/mL, transformation behavior of L-Phe can be absolutely restrained, anhydrous L-Phe can be obtained at 283.15 K without transformation. Nevertheless, the L-Trp additive at 313.15 K and L-His additive at 283.15 K/313.15 K all only can achieve partial inhibition, much attention should be paid to the transformation problem, when anhydrous L-Phe was crystallized from solution.

5. Conclusions

In this work, the solubility of L-Phe in water-methanol solvent mixtures with temperatures ranging from 293.15 K to 322.15 K in different water activities were increased with temperature and water activity and were correlated by the modified Apelblat equation and λh equation. Meanwhile, the transition water activity at 293.15 K, 297.15 K and 302.15 K were measured and were 0.921, 0.948 and 0.982 respectively, which increased with temperature, obtaining the ternary phase diagram of methanol/L-Phe/water at that temperature. Results showed that anhydrous L-Phe could be produced by reducing the water activity in the system. Furthermore, the results of the transformation behavior of L-Phe showed that anhydrous L-Phe was substantially completely converted into L-Phe+H2O when the crystal form conversion time reached 9 h (water activity equal to 0.84) and 12.5 h (water activity equal to 0.77) at temperature 283.15 K, and L-Phe+H2O was substantially completely converted into anhydrous L-Phe when crystal form conversion time reached 3 h (water activity equal to 0.84) and 5.5 h (water activity equal to 0.77) at temperature 323.15 K. That is, transformation behavior can be inhibited by decreased water activity. Finally, the transformation behaviors of L-Phe from anhydrate/monohydrate to monohydrate/anhydrate in water with additives L-Trp/L-His acid were also investigated. The addition of L-Trp or L-His acid significantly impacted the transformation rate. When the concentration of L-Trp acid is larger than 0.7 × 10⁻⁴ mol/mL, the transformation behavior of L-Phe can be completely suppressed, and yet the transformation behavior only partly was inhibited with the addition of L-Trp at 313.15 K and L-His at 283.15 K/313.15 K.
In this paper, the thermodynamic and kinetic properties of L-Phe were measured, which made it possible to change the solubility and crystallizing time according to adjust water activity, thereby further realizing the regulation of L-Phe from the perspective of water activity. At the same time, the production of L-Phe anhydrate from the additive aspect was realized by investigating the effects of additives on the transformation behavior of the L-Phe crystal form.

Author Contributions

Conceptualization, J.Z.; methodology, J.Z., W.K., and X.C.; formal analysis, X.C.; investigation, X.C.; resources, S.J.; data curation, X.X.; writing—original draft preparation, X.C.; writing—review and editing, J.Z., Y.B., A.L. and P.L. All authors have read and agreed to the published version of the manuscript.

Funding

This research was funded by the National Natural Science Foundation of China, grant number 21606056, the Guangxi Natural Science Foundation of China, grant number 2017GXNSFAA198091, the Guangxi Biological Polysaccharide Separation, Purification and Modification Research Platform, grant number GKZY18076005, the Xiangsihu Young Scholars Innovative Research Team of Guangxi University For Nationalities, grant number 2016, and the Postgraduate Research Innovation Project of Guangxi University of Nationalities, grant number gxun-chxzb2018001 (gxun-chxps201817).

Acknowledgments

In this section you can acknowledge any support given which is not covered by the author contribution or funding sections. This may include administrative and technical support, or donations in kind (e.g., materials used for experiments).

Conflicts of Interest

The authors declare no conflict of interest.

References

  1. Bechtloff, B.; Nordhoff, S.; Ulrich, J. Pseudopolymorphs in industrial use. Cryst. Research. Technol. 2001, 36, 1315–1328. [Google Scholar] [CrossRef]
  2. Brittain, H.G. Polymorphism and solvatomorphism 2010. J. Pharm. Sci. 2012, 101, 464–484. [Google Scholar] [CrossRef]
  3. Vippagunta, S.R.; Brittain, H.G.; Grant, D.J. Crystalline solids. Adv. Drug Deliv. Rev. 2001, 48, 3–26. [Google Scholar] [CrossRef]
  4. Tian, F.; Qu, H.; Zimmermann, A.; Munk, T.; Jørgensen, A.C.; Rantanen, J. Factors affecting crystallization of hydrates. J. Pharm. Pharmacol. 2010, 62, 1534–1546. [Google Scholar] [CrossRef]
  5. Healy, A.M.; Worku, Z.A.; Kumar, D.; Madi, A.M. Pharmaceutical solvates, hydrates and amorphous forms: A special emphasis on cocrystals. Adv. Drug Deliv. Rev. 2017, 117, 25–46. [Google Scholar] [CrossRef] [Green Version]
  6. Neglur, R.; Hosten, E.; Aucamp, M.; Liebenberg, W.; Grooff, D. Water and the relationship to the crystal structure stability of azithromycin. J. Therm. Anal. Calorim 2018, 132, 373–384. [Google Scholar] [CrossRef]
  7. Zhu, H.J.; Yuen, C.M.; Grant, D.J.W. Influence of water activity in organic solvent plus water mixtures on the nature of the crystallizing drug phase. 1. Theophylline. Int. J. Pharm. 1996, 135, 151–160. [Google Scholar] [CrossRef]
  8. Li, Y.; Chow, P.S.; Tan, R.B.H. Effect of Water Activity on the Transformation between Hydrate and Anhydrate of Carbamazepine. Org. Process Res. Dev. 2008, 12, 264–270. [Google Scholar] [CrossRef]
  9. Shefter, E.; Higuchi, T. Dissolution Behavior of Crystalline Solvated and nonsolvated forms of some pharmaceuticals. J. Pharm. Sci. 1963, 52, 781–791. [Google Scholar] [CrossRef]
  10. Liu, C.; Dang, L.; Tong, Y.; Wei, H.Y. Influence of Polymorphs on the Transformation Water Activity of Theophylline. Ind. Eng. Chem. Res. 2013, 52, 14979–14983. [Google Scholar] [CrossRef]
  11. Cuellar, M.C.; Herreilers, S.N.; Straathof, A.J.J.; Heijnen, J.J.; Wielen, L.A.M.V.D. Limits of operation for the integration of water removal by membranes and crystallization of L-phenylalanine. Ind. Eng. Chem. Res. 2009, 48, 1566–1573. [Google Scholar] [CrossRef]
  12. Lu, J.; Li, Z.; Jiang, X.L. Solubility of L-phenylalanine in aqueous solutions. J. Chem. Eng. Jpn. 2010, 43, 810–813. [Google Scholar]
  13. Lu, J.; Lin, Q.; Li, Z.; Rohani, S. Solubility of L-phenylalanine anhydrous and monohydrate forms: Experimental measurements and predictions. J. Chem. Eng. Data 2012, 57, 1492–1498. [Google Scholar] [CrossRef]
  14. Lu, J.; Wang, J.; Li, Z.; Rohani, S. Characterization and pseudopolymorphism of L-phenylalanine anhydrous and monohydrate forms. Afr. J. Pharm. Pharmacol. 2012, 6, 269–277. [Google Scholar] [CrossRef] [Green Version]
  15. Li, R.R.; Ye, S.F.; Chen, Y.F. Solubility of sulfachloropyridazine in pure and binary solvent mixtures and investigation of intermolecular interactions. J. Chem. Eng. Data 2018, 63, 2002–2008. [Google Scholar] [CrossRef]
  16. Chao, Y.; Lo, T.; Luo, N. Selective production of L-aspartic acid and L-Phenylalanine by coupling reactions of aspartase and aminotransferase in Escherichia coli. Enzym. Microb. Technol. 2000, 27, 19–25. [Google Scholar] [CrossRef]
  17. Xu, H.; Wei, P.; Zhou, H.; Fan, W.P.; Ouyang, P.K. Efficient production of Lphenylalanine catalyzed by a coupled enzymatic system of transaminase and aspartase. Enzym. Microb. Technol. 2003, 33, 537–543. [Google Scholar] [CrossRef]
  18. Edahiro, J.; Nakamura, M.; Seki, M. Enhanced accumulation of anthocyanin in cultured strawberry cells by repetitive feeding of L-phenylalanine into the medium. J. Biosci. Bioeng. 2005, 99, 43–47. [Google Scholar] [CrossRef]
  19. Wang, Z.Z.; Li, Y.; Fang, W.Z.; Wang, Q.; Xiao, H.Z.; Dang, L.P. Salting effects on the solubility and transformation kinetics of L-phenylalanine anhydrate/monohydrate in aqueous solutions. Ind. Eng. Chem. Res. 2014, 53, 521–529. [Google Scholar] [CrossRef]
  20. Mohan, R.; Koo, K.K.; Strege, C.; Myerson, A.S. Effect of additives on the transformation behavior of L-phenylalanine in aqueous solution. Ind. Eng. Chem. Res. 2001, 40, 6111–6117. [Google Scholar] [CrossRef]
  21. Zhang, J.Y.; Cao, X.X.; Ji, S.C.; Lan, P.; Liao, A.P. Solubility and transformation behavior of l-phenylalanine anhydrate with amino acid additives. J. Therm. Anal. Calorim. 2018, 131, 1777–1781. [Google Scholar] [CrossRef]
  22. Su, J.H.; Qian, C.; Luo, N.Z.; Xiang, X.G.; Xu, Y.M.; Chen, X.Z. Experimental measurement and modeling of the solubility of biotin in six pure solvents at temperatures from 298.15 K to 333.85 K. J. Chem. Eng. Data 2014, 59, 3894–3899. [Google Scholar] [CrossRef]
  23. Cashell, C.; Corcoran, D.; Hodnett, B.K. Effect of amino acid additives on the crystallization of L-glutamic acid crystal. Cryst. Growth Des. 2005, 5, 593–597. [Google Scholar] [CrossRef]
  24. Manzurola, E.; Apelblat, A. Solubilities of l-glutamic acid, 3-nitrobenzoic acid, p-toluic acid, calcium-l-lactate, calcium gluconate, magnesium-dl-aspartate, and magnesium-l-lactate in water. J. Chem. Thermodyn. 2002, 34, 1127–1136. [Google Scholar] [CrossRef]
  25. Xie, Y.; Shi, H.W.; Du, C.B.; Cong, Y.; Zhao, H.K. Solubility determination and modeling for 4, 4-dihydroxydiphenyl sulfone in mixed solvents of (acetone, ethyl acetate, or acetonitrile)+ methanol and acetone + ethanol from (278.15 to 313.15) K. J. Chem. Eng. Data 2016, 61, 3519–3526. [Google Scholar] [CrossRef]
  26. Yang, P.; Du, S.H.; Qin, Y.J.; Zhao, K.F.; Li, K.L.; Hou, B.H.; Gong, G.B. Determination and correlation of solubility and thermodynamic properties of pyraclostrobin in pure and binary solvents. J. Chem. Thermodyn. 2016, 101, 84–91. [Google Scholar] [CrossRef]
  27. Yuan, F.H.; Wang, Y.L.; Xiao, L.P.; Huang, Q.Y.; Xu, J.C.; Jiang, C.; Hao, H.X. Solubility of cefoxitin acid in different solvent systems. J. Chem. Thermodyn. 2016, 103, 125–133. [Google Scholar] [CrossRef] [Green Version]
  28. Zhu, M.H.; Zhang, H.H.; Zhang, K.K.; Yang, Y.Y.; Jiang, S.; Xu, S.J.; Liu, Y.M.; Gong, J.B. Measurement and correlation of solubility of boscalid with thermodynamic analysis in pure and binary solvents from 288.15K to 313.15K. J. Chem. Thermodyn. 2017, 112, 178–187. [Google Scholar] [CrossRef]
  29. Choi, W.S.; Kim, K.J. Solubility of Forms I and II of Clopidogrel Hydrogen Sulfate in Methanol and 2-Propanol Mixture. J. Chem. Eng. Data 2011, 56, 43–47. [Google Scholar] [CrossRef]
  30. Hong, M.; Xu, L.; Ren, G.; Chen, J.; Qi, M. Solubility of lansoprazole in different solvents. Fluid. Phase. Equilibr. 2012, 331, 18–25. [Google Scholar] [CrossRef]
  31. Wang, X.F.; Dang, L.; Black, S.; Zhang, X.Y.; Wei, H.Y. How to Crystallize Anhydrous Racemic Tartaric Acid from an Ethanol—Water Solution. Ind. Eng. Chem. Res. 2012, 51, 2789–2796. [Google Scholar] [CrossRef]
  32. Wilson, G.M. Vapor-liquid equilibrium. XI. A new expression for the excess free energy of mixing. J. Am. Chem. Soc. 1964, 86, 127–130. [Google Scholar] [CrossRef]
  33. Gmehling, J.; Uo, W. Arlt: Vapor-Liquid Equilibrium Data Collection; Dechema: Frankfurt, Germany, 1981; Volume 1. [Google Scholar]
  34. Kubota, N.; Mullin, J.W.A. kinetic model for crystal growth from aqueous solution in the presence of impurity. J. Cryst. Growth 1995, 152, 203–208. [Google Scholar] [CrossRef]
  35. Davey, R.J.; Mullin, J.W. Growth of the 100 faces of ammonium dihydrogen phosphate crystals in the presence of ionic species. J. Cryst. Growth 1974, 26, 45–51. [Google Scholar] [CrossRef]
  36. Martins, P.M.; Rocha, F.; Damas, A.M.; Rein, P. Unsteady-state inhibition of crystal growth caused by solution impurities. CrystEngComm 2011, 13, 1103–1110. [Google Scholar] [CrossRef]
Figure 1. L-Phe structure.
Crystals 10 00060 g001
Figure 2. Mole fraction of L-Phe in methanol-water solvent mixtures calculated by Apelblat equation (a) and λh equation (b).
Crystals 10 00060 g002
Figure 3. The XRD patterns of L-Phe in different water activities: (a) 293.15 K, (b) 297.15 K, (c) 302.15 K and (d) at equilibrium.
Crystals 10 00060 g003
Figure 4. (a) Equilibrium water activity as a function of temperature; ternary phase diagram of methanol-L-Phe-water at temperature 293.15 K (b), 297.15 K (c) and (d) 307.15 K.
Crystals 10 00060 g004
Figure 5. XRD patterns of L-Phe from anhydrate to monohydrate with water activity of (a) 0.84 and (b) 0.77 at temperature 283.15 K; XRD patterns of L-Phe from monohydrate to anhydrate with water activity of (c) 0.84 (c) and (d) 0.77 at temperature 323.15 K.
Crystals 10 00060 g005
Figure 6. Fitting of the L-Phe transformation behavior data fitting in the presence of additive (a) L-His and (b) L-Trp at temperature 283.15 K and 313.15 K in pure water using the Langmuir model.
Crystals 10 00060 g006
Table 1. Experimental solubility (103 x) of L-Phe in methanol-water solvent mixtures with different water activities.
T/Kxexpxcal,Apelxcal,λhT/Kxexpxcal,Apelxcal,λhxexpxcal,Apelxcal,λhxexp
a[H2O] = 0.77a[H2O] = 0.90a[H2O] = 0
322.153.293.273.37322.153.493.523.67322.150.9473.523.67
317.152.973.003.02317.153.363.323.34317.150.8413.323.34
312.152.702.722.71312.153.093.083.03312.150.7603.083.03
307.152.462.452.42307.152.782.822.75307.150.6932.822.75
302.152.202.182.15302.152.532.542.49302.150.5792.542.49
297.151.941.921.91297.152.272.252.24297.150.5152.252.24
293.151.681.721.73293.152.022.022.06293.150.4232.022.06
a[H2O] = 0.84a[H2O] = 0.93a[H2O] = 1
322.153.423.433.52322.153.573.593.66322.153.793.593.66
317.153.183.153.17317.153.383.363.38317.153.683.363.38
312.152.852.872.85312.153.153.133.11312.153.453.133.11
307.152.552.592.56307.152.862.892.85307.153.212.892.85
302.152.382.322.29302.152.642.642.62302.153.072.642.62
297.152.032.052.04297.152.402.402.39297.152.762.402.39
293.151.831.841.85293.152.202.202.23293.152.572.202.23
a[H2O] = 0.87a[H2O] = 0.95
322.153.463.473.60322.153.623.663.70
317.153.243.213.24317.153.523.443.45
312.152.932.942.91312.153.213.223.20
307.152.622.652.60307.152.993.002.98
302.152.382.362.32302.152.742.782.76
297.152.092.082.07297.152.562.552.56
293.151.841.851.88293.152.402.382.40
xexp represents the solubility mole fraction determined by the test; xcal,Apel represents the solubility mole fraction calculated by the Apelblat equation; xcal,λh represents the solubility mole fraction calculated by the λh equation.
Table 2. Regressed parameters ARD and RMSD for L-Phe in different water activities by Apelblat and λh Equation.
Equation ModelParameter00.770.840.870.900.930.951
ApelblatA322.8169.60178.46246.33315.16149.9980.57223.12
B−17198.80−9805.76−10150.70−13260.89−16202.01−8473.50−5137.36−11537.24
C−47.73−25.09−26.43−36.51−46.84−22.39−12.16−33.40
R20.99280.99700.99490.99830.99260.99810.99030.9932
ARD0.0170.0100.0100.00620.00740.00450.00820.0071
105RMSD1.193.491.672.631.863.152.372.85
λhλ0.0250.0420.0380.0410.0280.0180.0120.010
10−3h103.0448.7450.9648.5560.3878.1596.40100.32
R20.97950.98890.99080.99130.98650.99500.99450.9783
ARD0.0150.0180.0130.0150.0190.00950.00800.030
105RMSD2.554.855.225.887.454.024.156.38
R2 represents the solubility mole fraction determined by the test.
Table 3. Mass fraction solubility data of anhydrous or monohydrate L-Phe in a mixed solvent at temperatures 293.15 K, 297.15 K and 302.15 K.
Water ActivitySolubility 103xStable CrystalWater ActivitySolubility 103xStable CrystalWater ActivitySolubility 103xStable Crystal
293.15 K297.15 K302.15 K
0.8371.89A0.5861.79A0.8372.38A
0.8752.03A0.6831.81A0.8692.38A
0.8872.07A0.7661.93A0.8992.53A
0.8992.11A0.8031.97A0.9272.64A
0.9102.16A0.8372.03A0.9372.67A
0.9212.27A + M0.8692.08A0.9532.74A
0.9322.29M0.8992.27A0.9682.83A
0.9532.40M0.9052.30A0.9722.88A
0.9102.34A0.9772.92A
0.9162.36A0.9822.89A + M
0.9212.38A0.9862.94M
0.9272.40A0.9962.98M
0.9322.47A13.01M
0.9432.50A
0.9482.37A + M
0.9532.46M
12.57M
A represents L-Phe+H2O anhydrous and M represents L-Phe+H2O monohydrate at equilibrium.
Table 4. Effect of additive concentration on the transformation behavior of L-Phenylalanine.
Additive Concentration ×105/(mol/ml)Transformation Time/hAdditive Concentration ×105/(mol/ml)Transformation Time/h
L-His
283.15 K313.15 K
0409
0.415.420.4823.17
0.826.500.8525
1.637.331.2129.17
2.437.831.6332
3.258.332.1140
4.278.502.4441.83
L-Trp
283.15 K313.15 K
0409
0.317.500.3818
0.6710.50.7622.2
0.93141.3024.17
1.24231.8825.5
1.5426.172.5627
1.8329.833.1428
2.5136.173.7128.33
Table 5. The parameters of the Langmuir model.
Additive TypeTemperatureTransformation BehaviorKeR2Additive Concentration/(mol/ml)Results
L-Trp283.15Kfrom A to M2.38 × 1051.060.9947.00 × 10−5Fully inhibited
313.15Kfrom M to A6.34 × 1050.710.999 partially inhibited
L-His283.15Kfrom A to M2.04 × 1050.590.998 partially inhibited
313.15Kfrom M to A4.88 × 1050.830.993 partially inhibited

