1. Introduction
The long-term clinical success of dental ceramics is influenced directly by several factors. Some of these factors include the crystal-based microstructure of the ceramic material, the fabrication process of the materials, technologies, and the clinical environment. All these steps can have a negative impact on the ceramic materials related to their brittle behavior [
1].
The surface structure of a material has a significant impact on bacterial accumulation, and several studies concluded that a rougher material accumulates more plaque on its surface [
2,
3]. Surface roughness can increase during laboratory procedures or chairside adjustments. Usually, the final ceramic restorations do not need more adjustments from the clinician, but sometimes additional occlusion modifications are necessary. These additional adjustments need polishing afterward, in order to prevent bacterial accumulation and later discoloration and excessive wear for the opposing teeth [
4,
5,
6]. Glazing the ceramic restoration is a laboratory procedure that seals the pores on the surface of the fired ceramic. Ceramic glazes are made of a mixture between a powder and a liquid fired on the ceramic surfaces, resulting in a glossy surface [
7].
The shape, size, and amplitude of the external and internal defects influence the strength of the material [
8]. A different glazing method has been developed to strengthen the materials. In the oral cavity, after glazing, adjustments of ceramic restorations can be made, resulting in a loss of the glazed layer. This aspect can harm the adjacent teeth and can produce inflammation of the soft tissue [
9,
10]. The ceramic surfaces can be smoothened after polishing once the glazed is eliminated, but the result is the same; the surfaces can remain rough. If the clinicians desire another glazing procedure, reglazing the ceramic material will induce an aesthetic appearance of the final restoration [
11].
Some factors, along with the heat-pressing procedures, can create flaws in the final structure of the ceramic restorations [
12,
13,
14]. Other defects, such as porosities and cracks around grains, can develop during the firing process [
15]. The deterioration of many ceramic materials can be linked with the distribution of the microcracks. The finishing procedures can induce these microcracks [
16,
17].
Even though dental ceramic materials display excellent mechanical properties, these materials can suffer changes in microhardness and surface roughness as an action of intrinsic and extrinsic factors [
18,
19,
20,
21]. Lithium disilicate glass-ceramic is one of the ceramics that have indications and gained popularity for anterior and posterior restorations due to its superior physical properties [
22]. Recently, new material has been introduced in dentistry; zirconia-reinforced lithium silicate ceramic that is enriched with zirconia (10% of its composition). Zirconia particles reinforce the glass-ceramic structure limiting the cracks [
23].
Thermocycling is a useful method to accelerate the artificial aging of the samples. It is useful because it can estimate the clinical performance by reproducing the temperature in the oral environment. Variations of the thermal and fatigue resistance of these materials can give information about their clinical failures [
24]. These temperature changes that appear upon drinking and eating cold and hot substances lead to contracting and expanding of the restorative materials [
25]. As a result of these changes, mechanical stresses and crack formations occur [
26]. In literature, bath temperature and a number of cycles have not been standardized, but a short dwell of 15–20 s represents the changes in temperature in the oral environment [
27,
28,
29]. Longer exposure times are not well tolerated [
30]. In the research field, commonly used bath temperatures of 5 °C and 55 °C for testing dental materials. Ten thousand cycles are approximately the equivalent to a year in the oral environment, based on the idea that dental restorations are subjected to 20 changes of temperature per day [
31,
32,
33,
34,
35,
36,
37,
38,
39,
40,
41]. This study investigated the effect of thermocycling and different surface treatments (polishing and glazing) on the microstructure, surface roughness, and microhardness of three types of heat-pressed glass-ceramic.
2. Materials and Methods
2.1. Specimens Preparation
Three types of heat-pressed glass-ceramic (n = 48) were included in this study. A feldspathic heat-pressed ceramic (Vita PM9, Vita Zahnfabrick, Bad Säckingen Germany), a lithium disilicate heat-pressed ceramic (IPS Emax Press; Ivoclar, Liechtenstein, Germany), and a heat-pressed, zirconia-reinforced lithium silicate glass-ceramic (Celtra Press, Dentsply, Hanau, Germany) were evaluated before and after thermocycling. The compositions of the tested materials are presented in
Table 1.
Prefabricated ceramic ingots were used to obtain disk-shaped pressed ceramic samples with a thickness of 1.5 ± 0.03 mm with a 1.5 mm diameter. The samples were heat-pressed following the manufacturer´s instructions. The parameters used for each ceramic can be found in
Table 2.
To provide standardization, the thickness of all the samples was processed using a grinding machine (Mecatech 264, Presi, Eybens, France) with a speed of 300 rpm and 600–2000 grit silicon carbide abrasive papers under running water. The final thickness of each sample was measured using a manual caliper (1.5 ± 0.03 mm) between the grinding and after the final grinding. The sample dimensions were chosen according to previous studies found in the literature [
42,
43,
44].
All the specimens were glazed (G) on one side, and polished (P) on the other side, and the resulting (n = 48) surfaces were analyzed. Polishing was completed using a diamond paste with 40 μm diamond particles (Zirkopol, Feguramed, Buchen, Germany) and diamond discs with 4000 grit at the polishing machine (Mecatech 264, Presi, France) at 400 rpm speed for 2 min each side of the sample. All the tested specimens were polished using the same technique. After polishing, each sample was cleaned using 99% alcohol and ultrasonically.
The glazed samples received two thin layers of specific glaze in a paste composition, and it was spread on the sample with a thin brush. Afterward, the firing was done according to the manufacturer’s recommendations in
Table 3 and
Table 4.
2.2. Surface Roughness Measurements
Surface roughness was measured on each side of the samples using a contact profilometer Surftest SJ-201 (Mitutoyo, Kawasaki, Japan), with a diamond stylus of a 2 μm. Five measurements were taken in five random areas of the ceramic samples. Values for parameters Ra (μm) and Rz (μm) were obtained. Parameter Ra (μm) represents average surface roughness, and parameter Rz (μm) represents maximum surface roughness. The sampling length was 0.8 mm, and a force of 0.7 mN was applied.
2.3. Artificial Aging of the Samples Using Thermocycling
A thermocycler (Thermocycler, SD Mechatronik, Feldkirchen-Westerham, Germany) with distilled water baths of 5 °C and 55 °C was used. After roughness measurements and structure investigations, the samples were aged for 10,000 thermocycles (Thermocycler, SD Mechatronik, Feldkirchen-Westerham, Germany) in distilled water. Samples were subjected to 10,000 cycles.
2.4. Scanning Electron Microscopy (SEM)
In the present study, the samples were evaluated using scanning electron microscopy (Inspect S (FEI Company, Hillsboro, OR, USA), which provided a qualitative analysis of the surface characteristics. The samples with different surface treatments were investigated before and after thermocycling.
2.5. Atomic Force Microscopy (AFM) Nano Surface Characterization
Each sample was examined before and after thermocycling with an atomic force microscope (Nanosurf Easy Scan 2 Advanced Research; NanosurfAG, Liestal, Switzerland), and values for Sa(nm) and Sq(nm) were obtained. Images with 625 × 625 pixels were obtained with a scan size of 20 × 20 μm and a scanning head of 10 μm. AFM generated a three-dimensional image of the sample surface.
2.6. Microhardness Testing (VH)
A hardness tester (HVS-10A1, Huatec, Beijing, China) was used to evaluate surface microhardness. Three indentations were made on the samples using a force of 0.3 kg for 10-s. The resulting indentations were reported in Vickers hardness (VH) units by the machine.
2.7. Methods of Statistical Analysis
The data were analyzed with a one-way ANOVA test. A significance level of α = 0.05 was set for comparison between the groups. Correlation between surface roughness (average surface roughness and maximum surface roughness) and surface microhardness was assessed using Pearson’s correlation.
3. Results
3.1. Micro Surface Roughness in Profilometry
Ra (μm) average surface roughness measurements for the materials included in this study, before and after thermocycling the samples, are presented in
Figure 1.
Before thermocycling, the values (0.067 ± 0.020) reported for Celtra glazed were higher than those of the other materials (p < 0.001), while the lowest surface roughness (Ra) (0.023 ± 0.007) was measured for the Celtra polished samples. Vita polished (0.06 ± 0.029) and Emax glazed (0.062 ± 0.022) experienced a high surface roughness.
After thermocycling, the values remained significantly high for the glazed samples, especially for Celtra glazed (0.117 ± 0.07) and Emax glazed (0.13 ± 0.08); however, a change appeared in the polished group, where Vita polished samples doubled their surface roughness values after thermocycling (0.122 ± 0.13). Rz (μm) maximum surface roughness measurements for the materials included in this study, before and after thermocycling the samples, are presented in
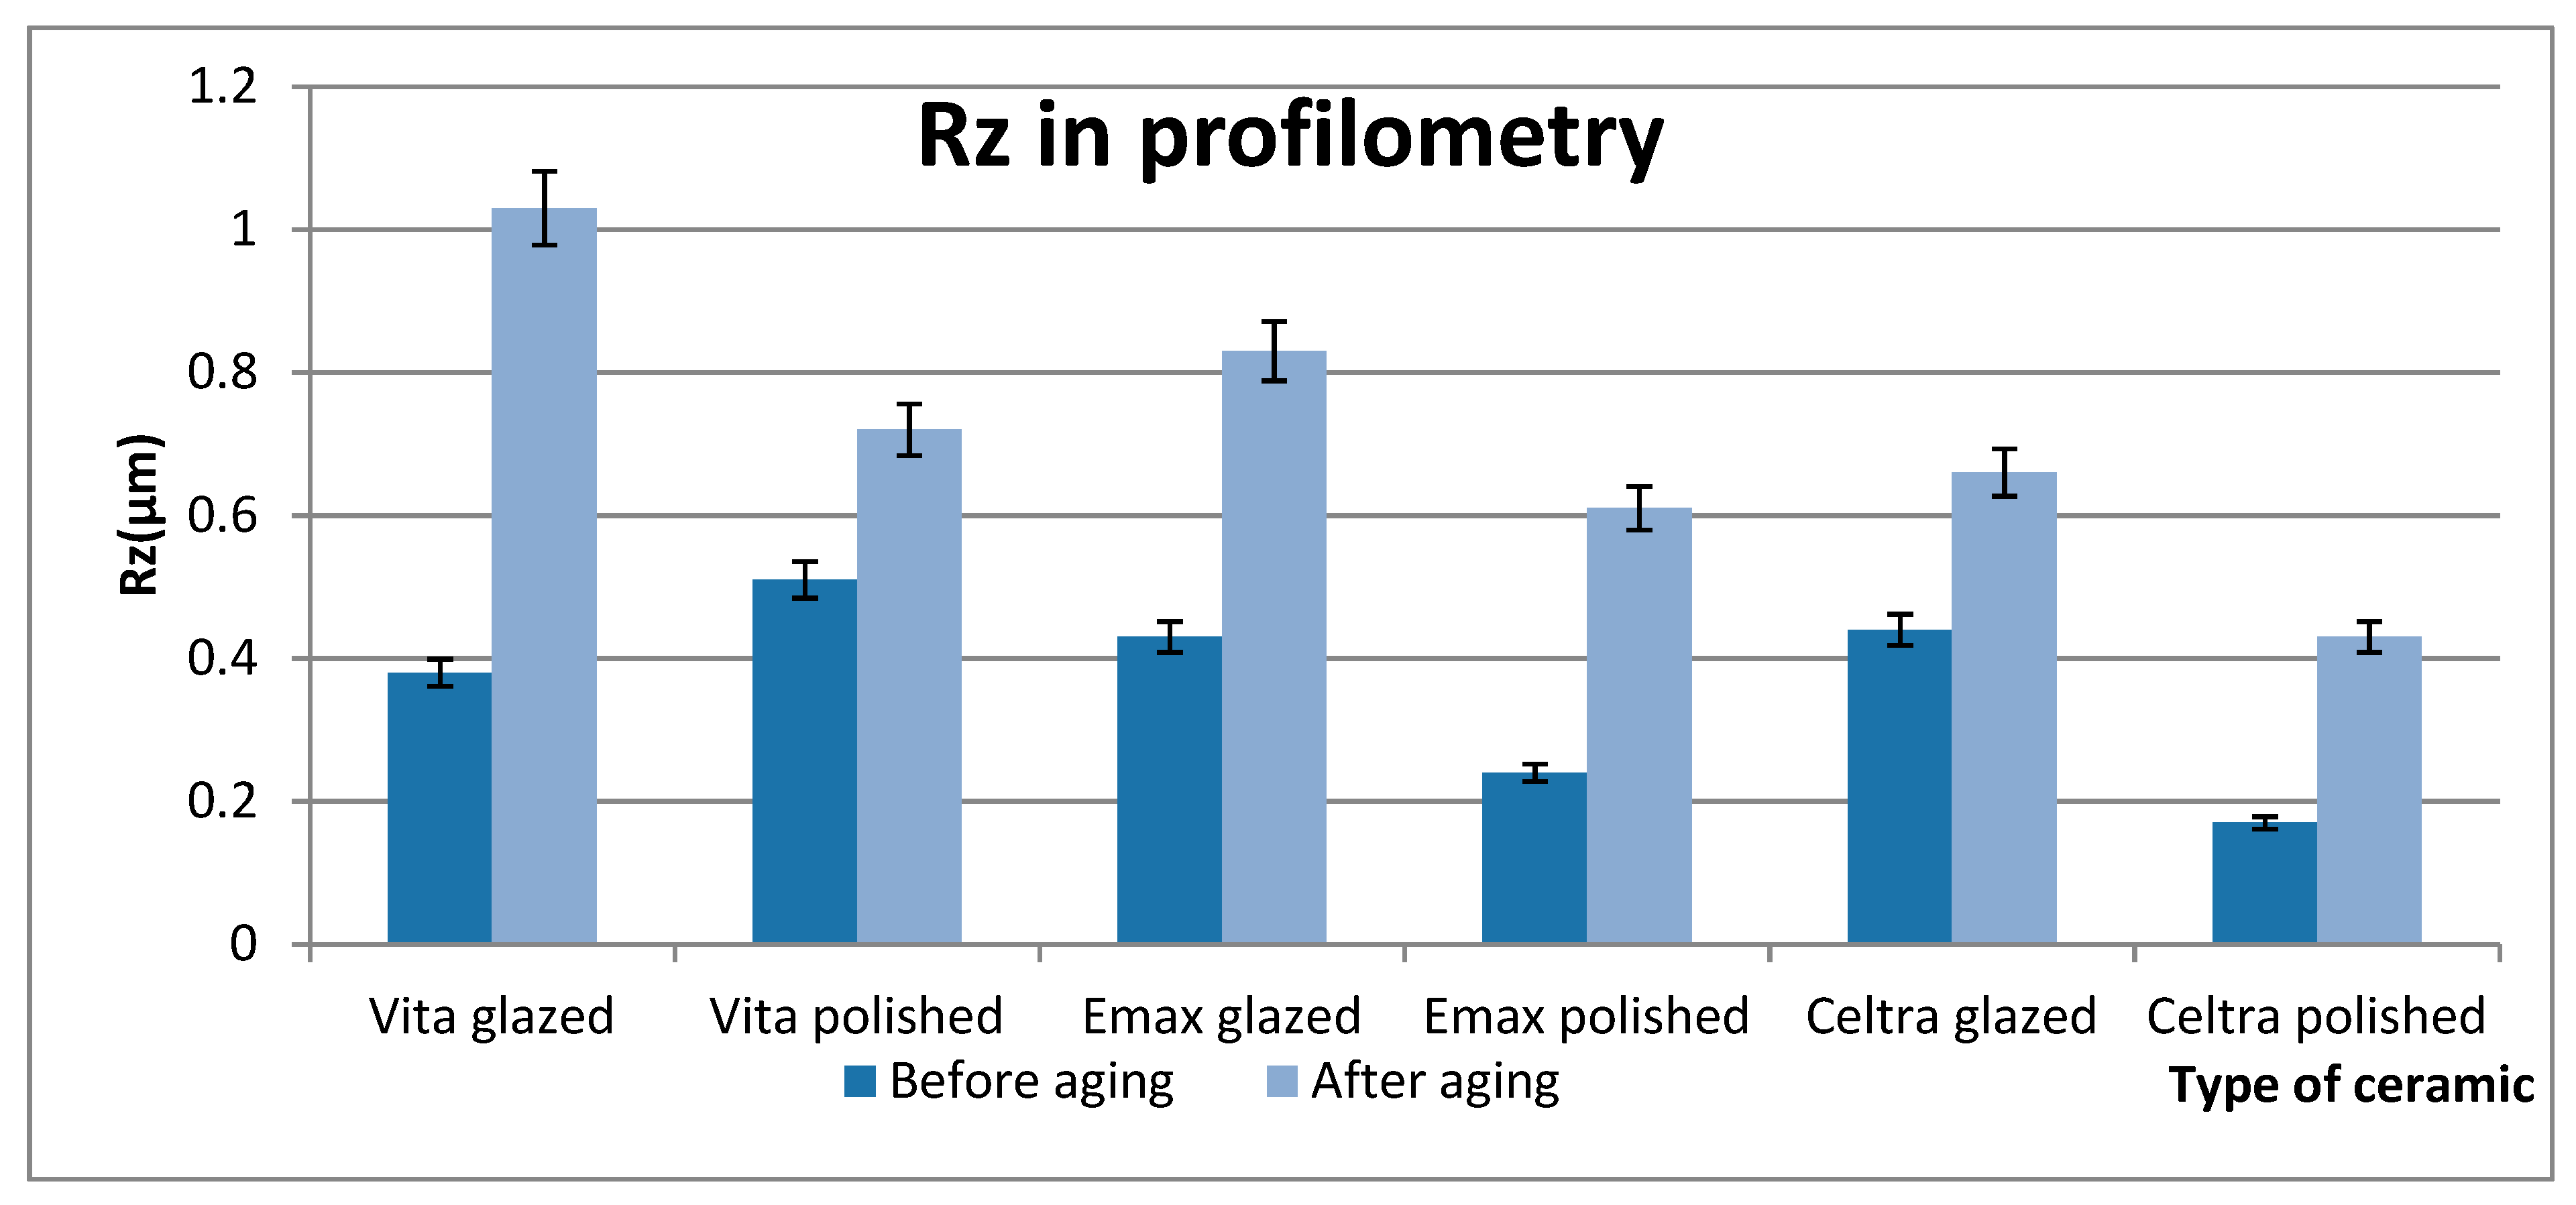
Figure 2.
Before thermocycling, the highest values were reported for Celtra glazed (0.084 ± 0.02), and Vita polished (0.081 ± 0.030), followed by Emax glazed (0.08 ± 0.033). The lowest surface roughness before thermocycling was measured for Celtra polished (0.032 ± 0.010) and Emax polished samples (0.04 ± 0.007).
After thermocycling, a significant change occurred for the Emax glazed (0.176 ± 0.10), followed by Vita glazed (0.18 ± 0.11) and Vita polished (0.156 ± 0.16).
Descriptive statistics for surface roughness for both of these parameters before and after thermocycling are shown in
Table 5 and
Table 6.
3.2. Test Carried Out by Atomic Force Microscope
Mean Sa (nm) values and the standard deviation of ceramics and surface treatments are shown in
Table 7.
Before thermocycling, the highest values for Sa (nm) were reported for the polished (48.00 ± 0.2 nm) and glazed (30.00 ± 0.01 nm) Celtra samples. The lowest values regarding nano-roughness were reported for the Vita glazed (0.840 ± 0.01 nm) and polished (1.00 ± 0.01 nm).
After thermal aging, the values changed significantly because the highest Sa (nm) values were reported for the Vita polished (61.10 ± 0.02 nm) samples, and Vita glazed (19.10 ± 0.01 nm). The lowest values were reported for the Celtra glazed (1.101 ± 0.01 nm) and polished (2.70 ± 0.01 nm) samples. The samples Emax glazed and polished did not suffer a significant change in the nano-roughness before and after thermocycling.
Mean Sq (nm) values and standard deviations are found in
Table 8.
Before thermocycling, the highest Sq (nm) values were evaluated for the polished Celtra samples (54.0 ± 0.06 nm) and Celtra glazed (35.10 ± 0.03 nm). The lowest values were found for Vita polished (1.50 ± 0.02 nm), and Vita glazed (1.50 ± 0.01 nm) samples, followed by Emax glazed (4.30 ± 0.03 nm) samples.
After aging, Vita polished had the highest values (76.20 ± 0.04 nm) followed by Emax polished (41.20 ± 0.01 nm). The lowest values were reported for the glazed (1.40 ± 0.02 nm) and polished (3.40 ± 0.01 nm) Celtra samples. Results showed that before thermocycling, the glazed samples had higher values, and after aging, the polished samples had higher values.
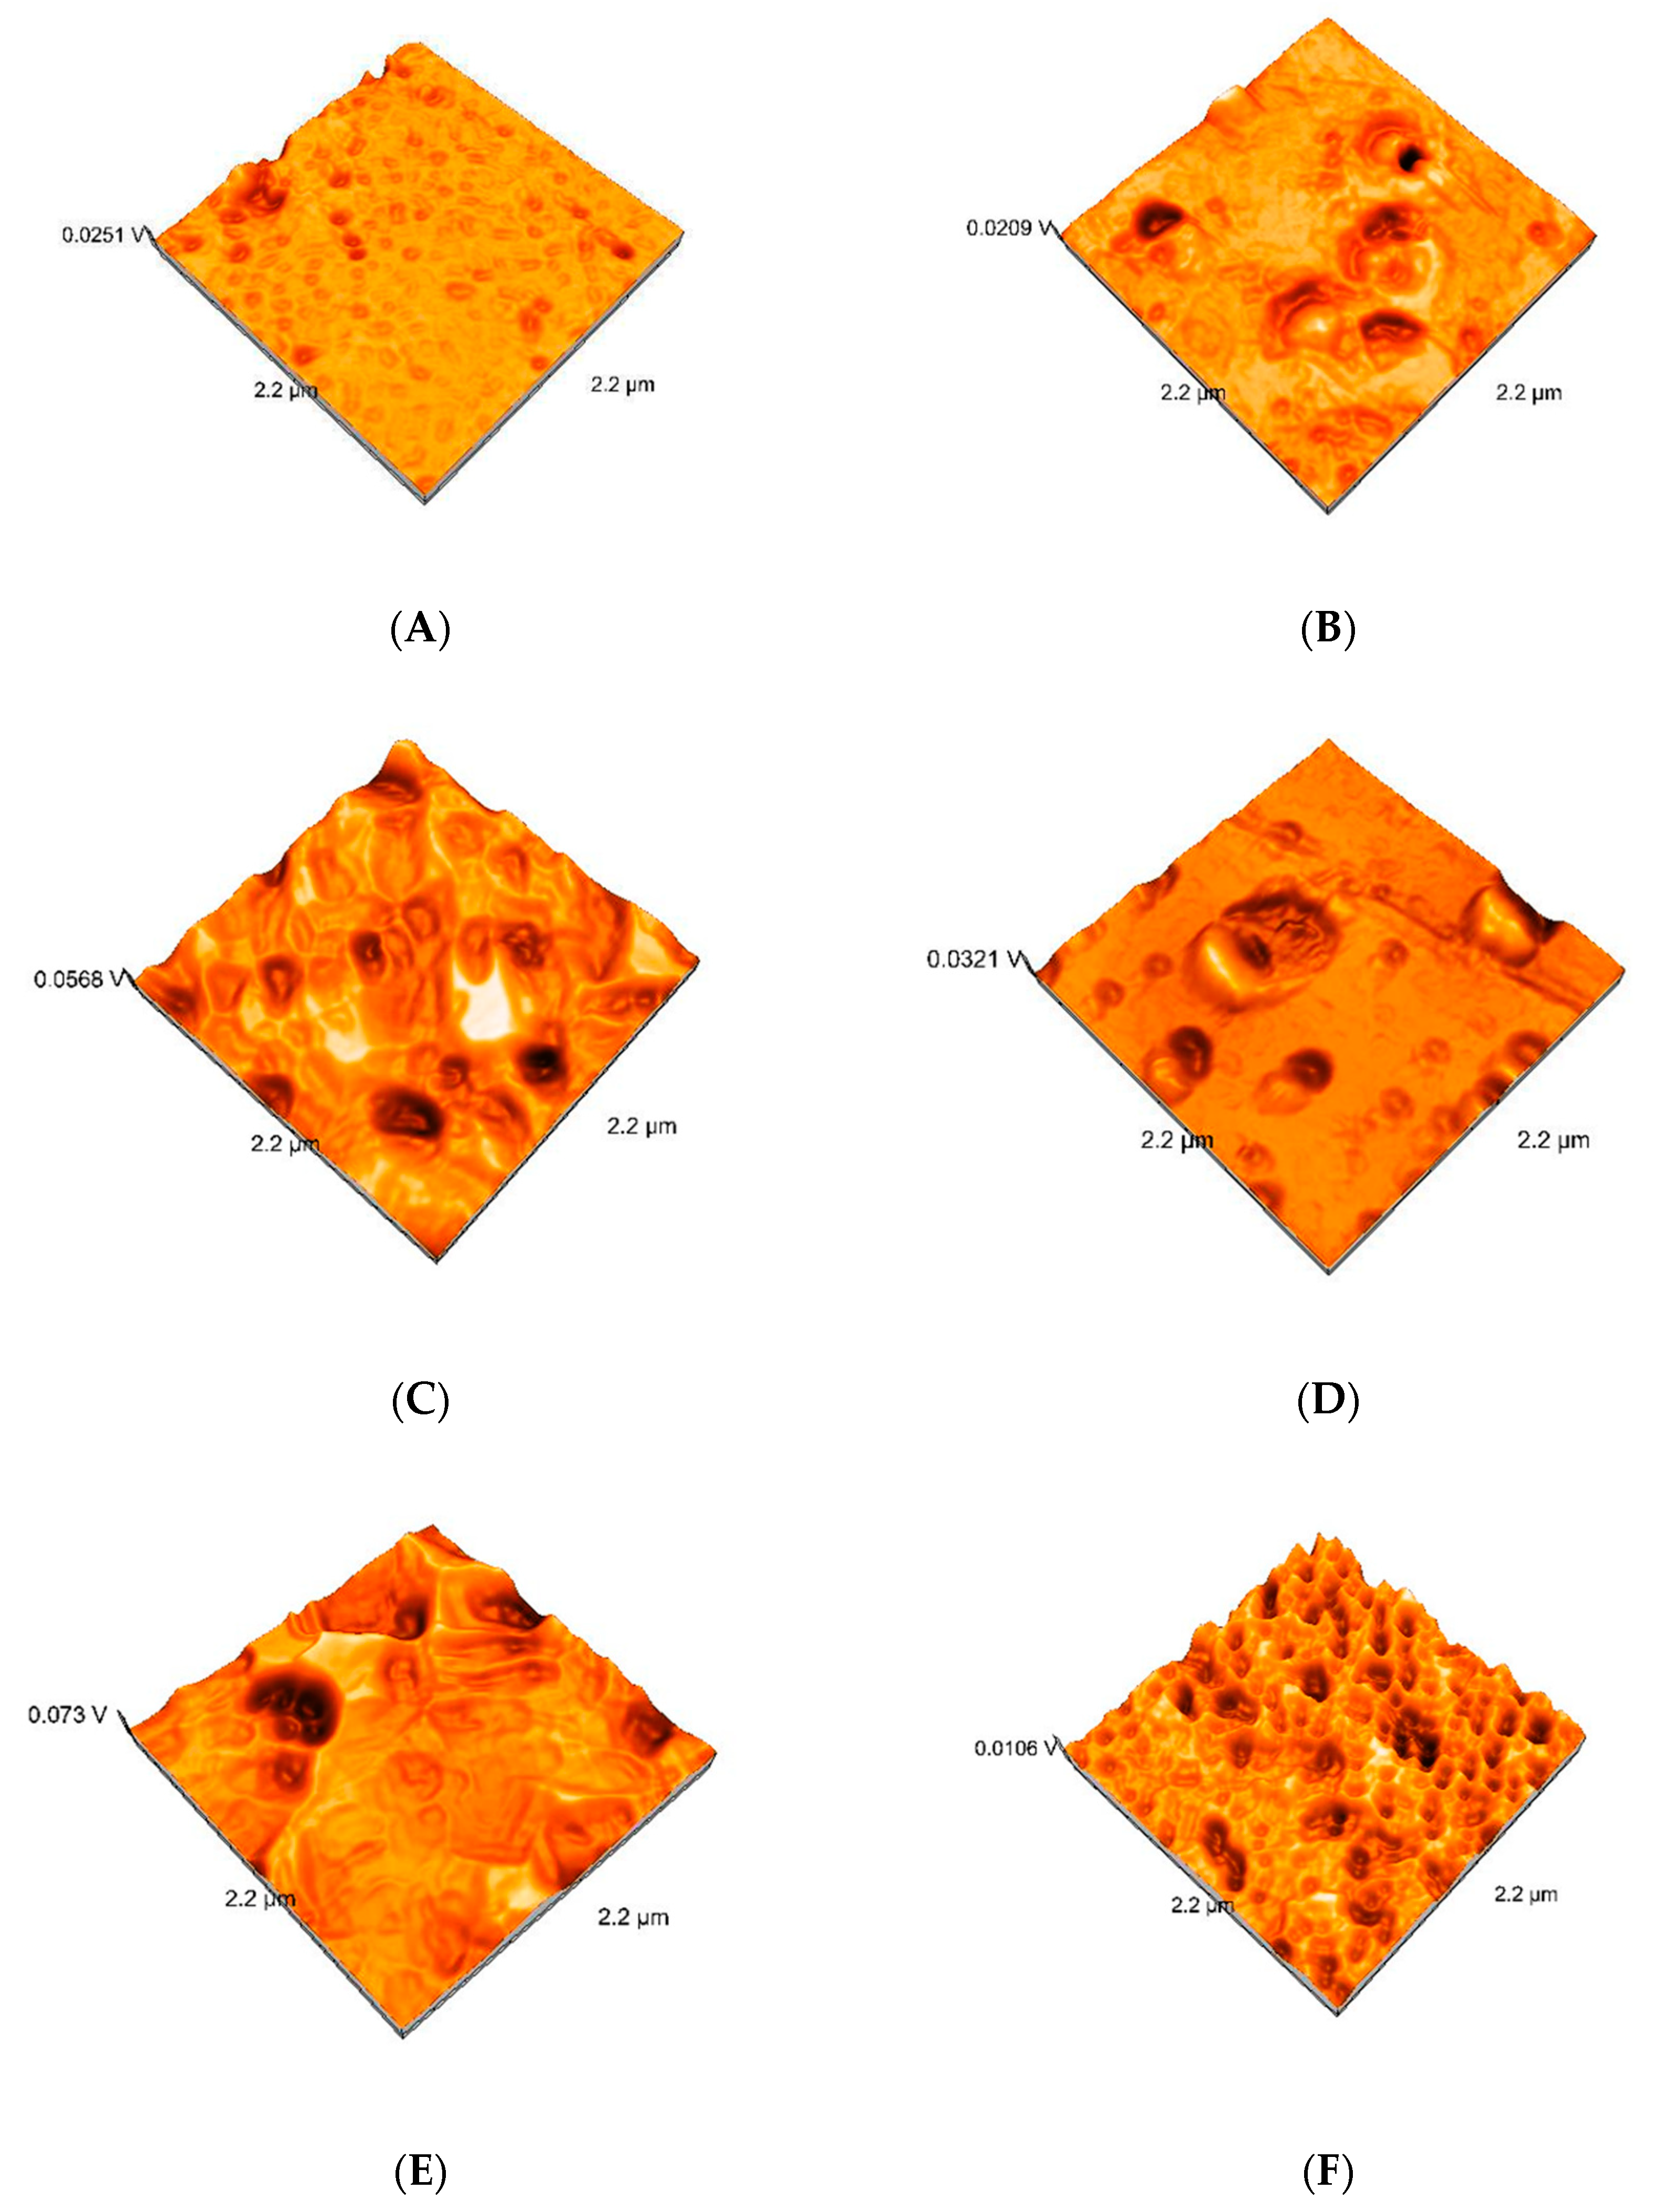
The AFM images showed Vita glazed and polished with the smoothest surface before thermocycling (
Figure 3A) and Celtra glazed with the roughest surface (
Figure 3F). In each ceramic type, the glazed surfaces detected several small irregularities as sharp spikes, which appeared smoother than the polished samples. The only exception was Celtra glazed.
After thermocycling the samples in
Figure 4, the AFM images show the roughest surface is Vita polished (
Figure 4A) and Vita glazed (
Figure 4B). Emax and Celtra samples (
Figure 4C–F), both polished and glazed, experienced smoother surfaces than before thermocycling.
3.3. Analysis with Scanning Electron Microscopy
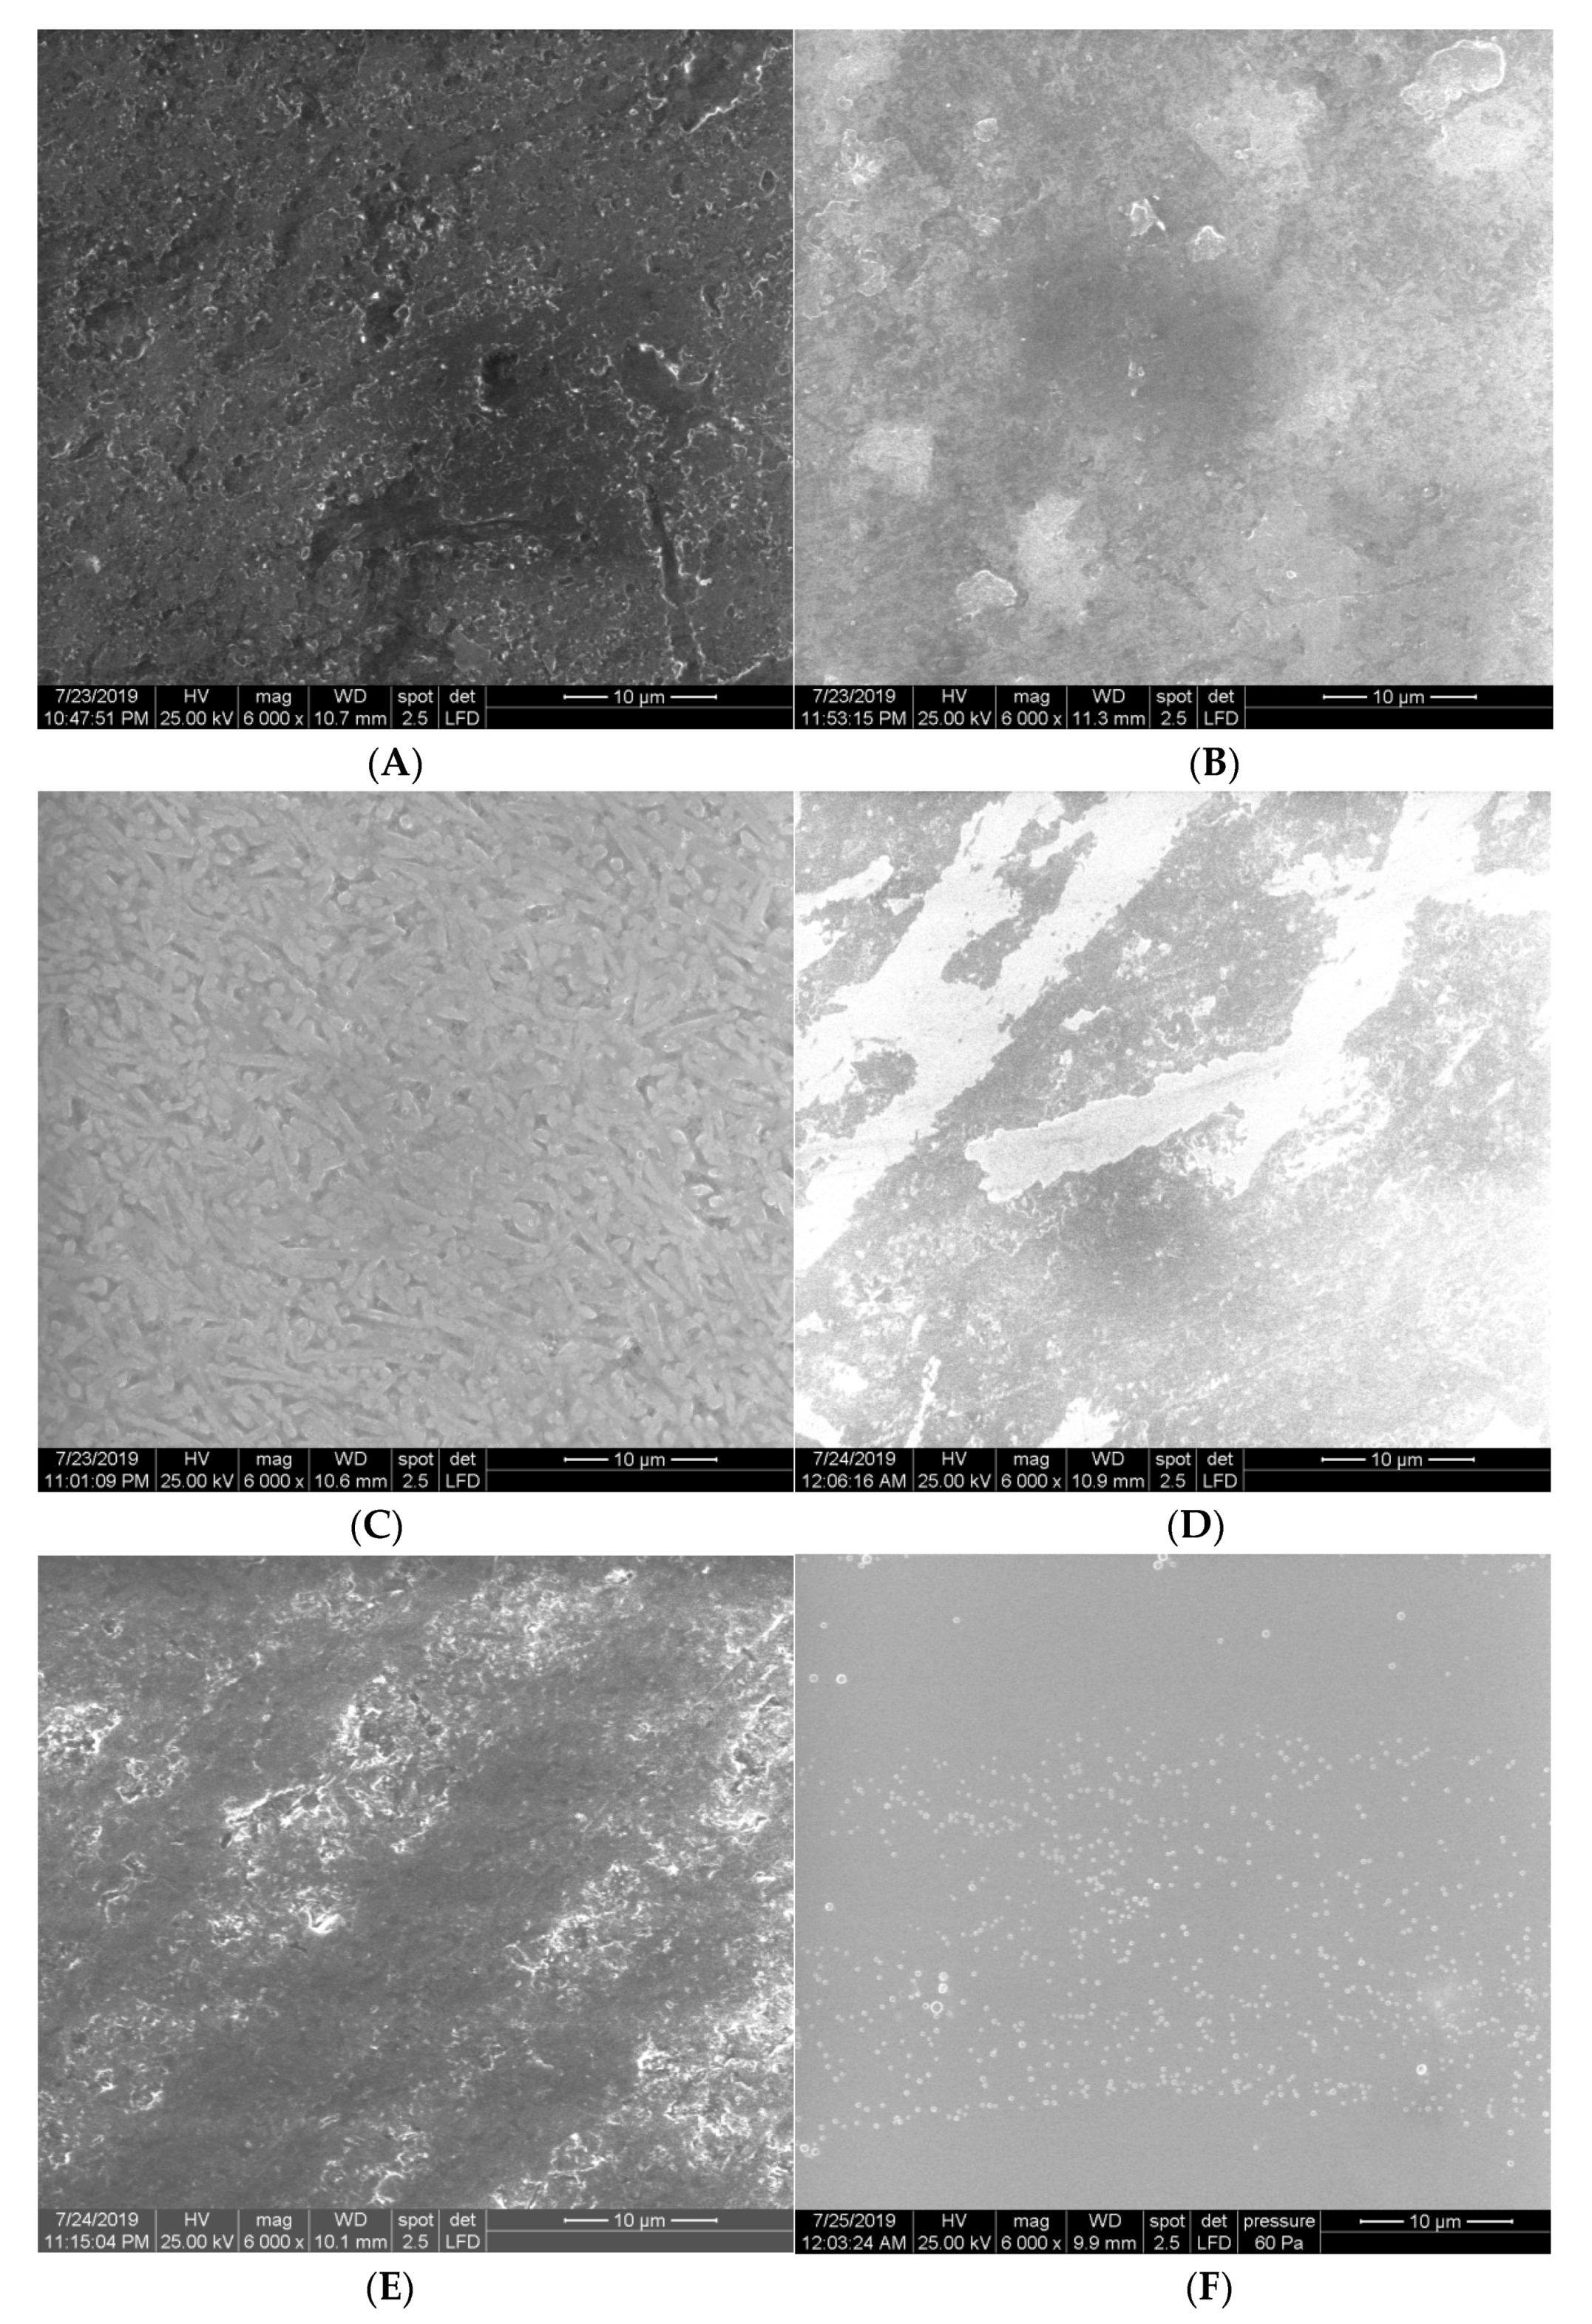
Figure 5 represents the SEM observations of the samples before thermocycling.
Figure 6 represents the thermocycled samples, in which the glazed samples from all the tested samples presented microcracks and displayed defects after thermocycling. No distortion was found for the Emax polished samples where crystals can be seen after thermocycling. For the polished Vita and Celtra samples, the leucite-crystals, respectively, the nanocrystals, cannot be distinguished after thermocycling.
3.4. Microhardness Testing
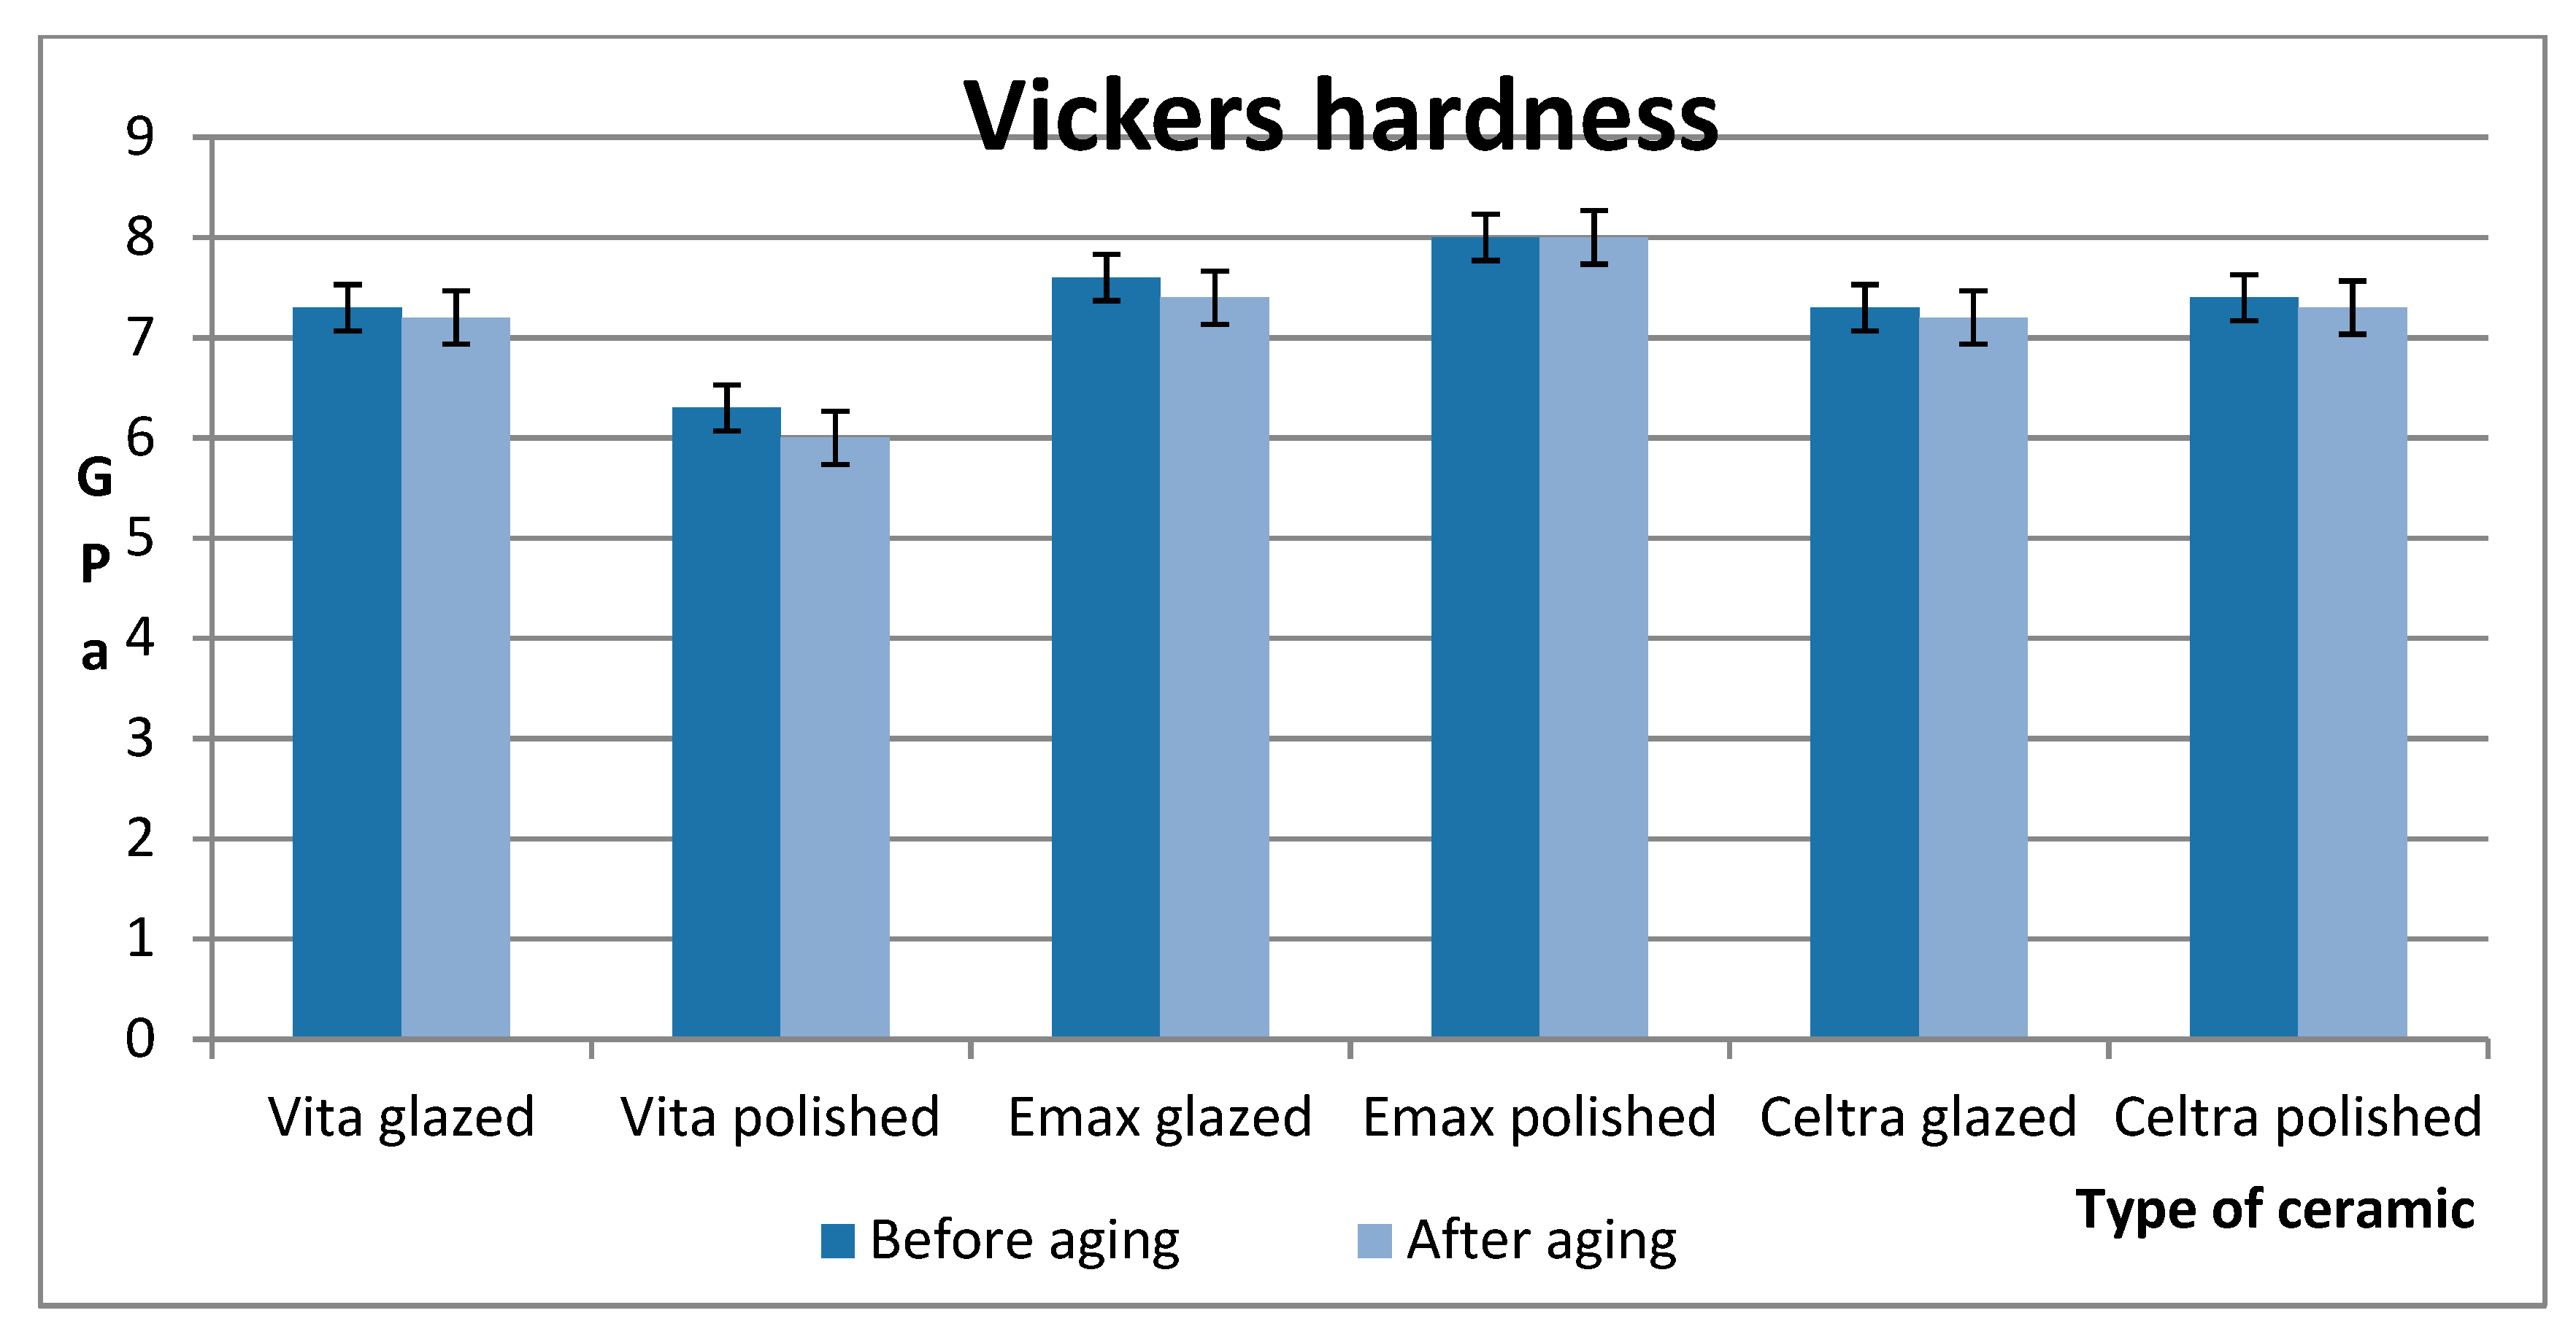
The mean values and statistical analysis of Vickers hardness of materials before and after thermocycling are presented in
Figure 7. One-way ANOVA showed that thermocycling had an insignificant impact on the tested materials; the only exception was for the Celtra glazed samples (
p < 0.001). The microhardness values for Emax polished and Emax glazed were significantly higher compared to Vita glazed and polished (
p < 0.01) and not significantly statistically compared to Celtra polished and glazed (
p > 0.05). There was a statistical difference between Vita and Celtra samples (
p < 0.05).
After thermocycling, there were statistically significant differences for Celtra samples (p < 0.01). There were no differences when comparing Emax and Celtra samples (p > 0.05). There was a decrease only for Vita polished samples and Celtra glazed after thermocycling and no decrease for the rest of the samples, Emax polished and glazed.
3.5. Statistical Analysis
As a result of thermocycling, a negative correlation was found between surface roughness and microhardness. The results were r = −0.46 for the correlation between the two dependent variables ∆Ra (average surface roughness before and after thermocycling) and ∆VH (the Vickers microhardness before and after thermocycling) and r = −0.66 between ∆Rz (maximum surface roughness before and after thermocycling) and ∆VH, meaning that after thermocycling, the surface roughness increases, and the microhardness decreases. The correlation was statistically analyzed.
4. Discussion
Significant changes in surface roughness, microhardness, and microstructure were reported after thermocycling for the tested glass-ceramics. Differences in surface micro- and nano-roughness were observed because they depend on the method of fabrication, surface treatments applied, and measurement methods [
45].
A surface profilometer can be used to detect the surface roughness. The measurements are made in some areas of the samples, and sometimes the obtained values do not show the topography of the ceramic samples [
46,
47]. Furthermore, examinations such as scanning electron microscopy and atomic force microscopy can help in gathering accurate visualization of the surface roughness [
48]. Scanning electron microscopy (SEM) is a useful examination of samples without metal coating [
49]. SEM micrographs illustrate information about ceramic material such as external morphology, crystalline structure, and chemical composition [
50]. Different roughness values were measured for the tested materials, even though all the materials were polished using the same paste and technique. It seems that the polishing method did not have the same effectiveness for all the ceramic types. The same findings were seen in articles in press [
51,
52]. Another article suggests that when polishing a material, its structure influences its ability to be polished [
53].
SEM and AFM provided a quality evaluation of the glazed and polished surface, revealing the changes in the structure after thermocycling. Before thermocycling in the SEM micrographs, crystals with specific sizes can be seen in the structure of the evaluated glass-ceramics. After thermocycling, these crystals are harder to distinguish for the feldspathic glass-ceramic and the zirconia-reinforced lithium silicate glass-ceramic. Lithium disilicate glass-ceramic was the least affected by thermocycling.
In this study, two conventional treatments of ceramic surfaces were applied. The first one is glazing, in which a paste is spread on the ceramic surface followed by firing, a process performed in the laboratory. The second treatment includes mechanical polishing using disks with different abrasiveness. The glazed groups presented in profilometry a mean Ra (μm) of 0.061 ± 0.05 μm and for polished samples 0.039 ± 0.018 μm and after thermocycling mean values for Ra (μm) were for the glazed samples 0.11 ± 0.001 μm and the polished 0.096 ± 0.02 μm. Maximum surface roughness was 0.41 ± 0.03 μm for the glazed samples and the polished 0.30 ± 0.17 μm and after thermocycling 0.84 ± 0.18 μm and 0.58 ± 0.14 μm, respectively. For the glazed samples, the mean Rz value doubled after thermal aging. In other studies, it was found that glazing reduces hardness; in this study, similar results were found except for the Emax and Celtra samples. This is a benefit for the antagonist’s teeth because it produces less wear. Differences in surface roughness of materials were also found in a similar study [
54]. These results show that mechanical polishing can result in lower Ra and Rz values before and after thermocycling, resulting in reduced microbial adhesion. The most significant changes in surface roughness were noticed in the glazed groups, and it can be related to an initial higher roughness value. The exception in this study is the Vita ceramic, which indicates glazing, the other ceramic systems included in this study can either be glazed or polished. From the findings in this study, Vita ceramic needs to be glazed, and Emax and Celtra can be only mechanical polished with paste. Thermocycling had an impact, especially on the glazed surface of the ceramic samples. The glaze layer did not maintain the uniform aspect, and several defects appeared after thermocycling. The polished surface experienced changes but less significant. However, Ra values for the tested ceramics were under 0.2 μm, and it has an impact on the plaque accumulation. Values above 0.2 μm are more susceptible to accumulate plaque and to be perceptible in the oral cavity by the patient [
55]. In the occlusal contact area, the surface roughness of enamel was found to be 0.6 μm, and this has high relevance when obtaining restorations. All studied ceramic systems proved to have lower roughness and can be considered clinically acceptable. Even though several studies reported that similar surface roughness could be obtained using polishing and glazing, polishing depends on many factors, such as presence or absence of water, rotation, speed, duration, and the type of polished ceramic [
56].
Atomic force microscope analysis holds an essential advantage in studying ceramic materials because it provides high-resolution and three-dimensional visualization of the studied surface. As for the Sa (nm) and Sq (nm) parameters, the atomic force microscope showed results that demonstrated that polished surfaces presented significantly higher values when compared to the glazed ones [
57]. The smoothest surface was achieved by glazing, especially for the Vita PM9 ceramic, which indicates glazing because of its high leucite content among the tested materials [
58]. This aspect was found both before and after thermocycling.
Surface hardness can be defined as a relative measure of resistance to successive indentation. Indentation has a direct influence on the capacity of the material to be polished and also has an impact on the resistance of the material to occlusal wear [
59]. Mechanical properties and surface roughness of ceramics are influenced by the microstructure and especially the crystalline phase [
60]. The reason for Emax samples having the highest microhardness, followed by Celtra samples, is linked to their crystal structures. SEM images of Emax specimens proved that lithium disilicate crystals were scattered regularly in the structure [
61]. Recent studies found that disilicate lithium ceramic proved to have superior hardness properties compared to feldspathic ceramic [
62,
63]. This finding was also seen in this study. In this study, the lowest microhardness was found for the Vita samples, followed by Celtra samples. These ceramics, and especially Vita, tend to be more brittle. Noticeable differences were found for the glazed group rather than for the polished one. Vita ceramic showed a significant reduction of hardness after thermocycling for the polished samples and an insignificant reduction for the glazed. In other studies, similar results were found, and it is possible that the presence of leucite crystals stopped possible crack propagation [
64,
65].
Thermocycling is one of the methods that can investigate the changes that occur in time with materials. There are also limitations to this method because it does not reproduce the real clinical conditions completely.

 ,
, 


