Article

Growth and Characterization of (Tb,Yb) Co-Doping Sprayed ZnO Thin Films

1
Group of Semiconductors and Environmental Sensor Technologies- Energy Research Center, Faculty of Science, Mohammed V University, B. P. 1014, Rabat 1957, Morocco
2
Faculty of Sciences, Mohammed V University, Rabat 1957, Morocco
3
Institute of Physics and Chemistry of Materials of Strasbourg, University of Strasbourg, CNRS UMR 7504, 23 rue du Loess, B.P. 43, CEDEX 2, F-67034 Strasbourg, France
4
Optics & Photonics Center, Moroccan Foundation for Advanced Science, Innovation and Research, MAScIR, X4JJ+VJ Rabat, Morocco
*
Author to whom correspondence should be addressed.
Crystals 2020, 10(3), 169; https://doi.org/10.3390/cryst10030169
Submission received: 6 December 2019 / Revised: 9 January 2020 / Accepted: 25 January 2020 / Published: 5 March 2020
(This article belongs to the Special Issue Optical and Microstructural Characterization of Thin Layers)

Abstract

:
Structural, optical and electrical properties of (ytterbium/terbium) co-doped ZnO thin films deposited on glass substrates using the spray pyrolysis method were investigated. The films exhibited the hexagonal wurtzite structure with a preferential orientation along (002) direction. No secondary phase was observed in the X-ray diffraction detection limit. Atomic force microscopy (AFM) was performed and root means square roughness (RMS) of our samples decreased with terbium content. Photoluminescence measurements showed a luminescence band at 980 nm which is characteristic of Yb3+ transition between the electronic levels 2F5/2 to 2F7/2. This is experimental evidence for an efficient energy transfer from the ZnO matrix to Yb. Hall Effect measurements gave a low electrical resistivity value around 6.0 × 10⁻³ Ω.cm. Such characteristics make these films of interest to photovoltaic devices.

1. Introduction

Zinc oxide (ZnO) is a type II-VI transparent semiconductor compound with n-type natural conductivity, which is ensured by the existence of "defects" related to interstitial zinc atoms and oxygen vacancies. Its notable properties: high exciton binding energy, a wide bandgap around 3.37 eV and a high chemical and physical stability [1]. These properties make it a suitable host material for different dopants, such as boron B [2], aluminum Al [3], gallium Ga [4] and fluoride F [5]. It is a promising candidate for applications in short-wavelength emitting devices [6,7], field emission devices [8,9], solar cells [10,11] and sensors [12,13]. Several techniques have been used to deposit undoped and doped ZnO thin films such as sol–gel [14], electron beam evaporation [15], spray pyrolysis [16] and radio frequency magnetron sputtering [17].
The rare earth elements are characterized by their rich energy levels and long-lived excited states and temperature-independent luminescence in both infrared and visible light ranges [18,19]. Their optical properties and their 4f shell transitions enhance the optical properties of ZnO films [20]. Besides, this doped ZnO can be used as a retrogradation and/or conversion layer within photovoltaic solar cells to improve their efficiency [21]. Most lanthanide ions are good candidates for luminescent centers due to their special 4f electron transition at the different energy levels and stable oxidation state 3+. Therefore, the rare-earth doping of the ZnO semiconductor became of interest for display applications involving ultraviolet, visible and infrared light emission [22].
The present investigation is focused on the study of the terbium rare earth effect on Yb-doped ZnO thin films prepared using the spray pyrolysis technique because of its simplicity, low cost, easy to add doping materials, and the possibility of varying the film luminescent properties by changing the composition of starting solution. It is also promising for high rate and mass production capability of uniform large area coatings in solar cell applications and optoelectronic devices [23,24]. The samples were characterized by various techniques to assess the effect of co-doping on the structural, optical and electrical properties.

2. Experimental Details

Undoped and co-doped ZnO films were prepared by the spray pyrolysis technique on silica glass substrates (SiO2). The solution was prepared by dissolving the precursors in distilled water at room temperature. We used a dilute solution of zinc acetate dihydrate (Zn (CH3COO)2, 2H2O) (molar concentration C = 0.05 mol/l) for the elaboration of thin layers of undoped ZnO. For co-doping, we used a mixture of zinc acetate and ytterbium chloride hexahydrate (YbCl3, 6H2O) (Sigma–Aldrich 99.9%) with a fixed concentration of (x = 5%) and terbium chloride hexahydrate (TbCl3, 6H2O) (Sigma–Aldrich 99.9%) with two different molar ratios of Tb, 1% and 3%. Subsequently, we added to our solution a few drops of acetic acid, while stirring magnetically for 30 minutes at room temperature, to obtain a clear homogeneous solution. The glass substrate was cleaned with ethanol and rinsed with distilled water, and subsequently dried under nitrogen gas flow before deposition. The substrate was then placed on a ceramic heating plate and heated progressively until the deposited temperature was reached. All films were deposited at 350 °C during 77 min with a flow rate of the solution fixed at 2.6 ml/min.
The phase purity and the crystallinity of the films were determined using an X-ray diffractometer (XRD, Malvern Panalytical, Almelo, Netherlands) (X’Pert Pro) using the Bragg–Brentano geometry (θ–2θ). This diffraction model consists of measuring the intensity diffracted by a displacement of the sample and the detector simultaneously and respectively with an angle θ and 2θ. X-rays were produced from a CuKα radiation source of wavelength λ = 1.54056 Å. The chemical composition of the films was determined using the energy dispersive x-ray spectroscopy (EDS) (JEOL JSM-6700F). The EDS x-ray detector measures the relative abundance of emitted x-rays versus their energy in the range of 0–10 keV. The detector is a lithium-drifted silicon, solid-state device. The morphology of the surfaces of the thin films was inspected by Digital Instrument Dimension 3100 atomic force microscopy (AFM, Digital Instruments (Veeco), Plainview, New York, United States). The optical properties of the films were verified using U–Perkin–Elmer Lambda 950 spectrophotometer measurements; we used a double beam recording spectrophotometer that can function in two configurations: transmission mode or reflection mode. It consists of three main parts: the source of radiation, the sample holder and reference. Photoluminescence (PL) experiments were carried out at room temperature using a 355 nm excitation line of a frequency-tripled neodymium-doped yttrium aluminum garnet Nd–YAG laser (HORIBA, Kisshoin, Minami-ku Kyoto, Japan). The electrical properties of the films were studied at room temperature, using an ECOPIA Hall effect measurement system, in the form of a horizontal bar and rectangular block. Copper metal was used as an ohmic contact.

3. Results and Discussion

3.1. Micro-Structural and Morphological Properties

Figure 1 shows both undoped and co-doped (Yb–Tb) ZnO X-ray diffraction spectra. All layers have a single polycrystalline phase and all peaks correspond to the hexagonal würtzite structure of ZnO. No rare earth dopant segregation is detected by XRD since no characteristic peak of a terbium or ytterbium oxide phase was seen in the XRD diagram. We observed that the introduction of both ytterbium and terbium results in the growth of both (100)/(002) and (101)/(002) peak intensity ratios relative to the undoped layer, indicating that the incorporation of Yb and Tb as elemental dopants slightly affects the preferential orientation. These films were preferably oriented in the direction of growth with the c-axis perpendicular to the substrate. The texture of the samples was estimated by calculating the texture coefficient, denoted Tc (hkl) [25]. We can see from Table 1 that the Tc (002) values decrease with co-doping, which is reflected by a degradation of the crystalline quality of our layers compared to undoped ones and even comparing them with mono-doping by Yb or Tb. For all co-doped samples, Tc (002) remains nearly constant, indicating that the increase in Tb did not change the preferential orientation. A similar result was found using rare-earth doping by other researchers [21]. The peaks are almost superimposed and in addition, there is almost no shift, which explains the constancy of the parameters a and c (Figure 1).
The values of the parameters of the lattice a and c are around 0.322 nm and 0.521 nm respectively. The grain size D of the ZnO layers was estimated from the Scherrer formula [28]. Table 1 shows a decrease of the values obtained the grain size ranging from 76 nm to 23 nm following co-doping Yb and Tb. It can be seen from Figure 1 that the widening of the diffraction peak (002) (full width at half maximum peak (FWHM)) is accompanied by a decrease in the size of the crystallites [29]. The thickness of the films was determined using a stylus profilometer and the values are given in Table 1.
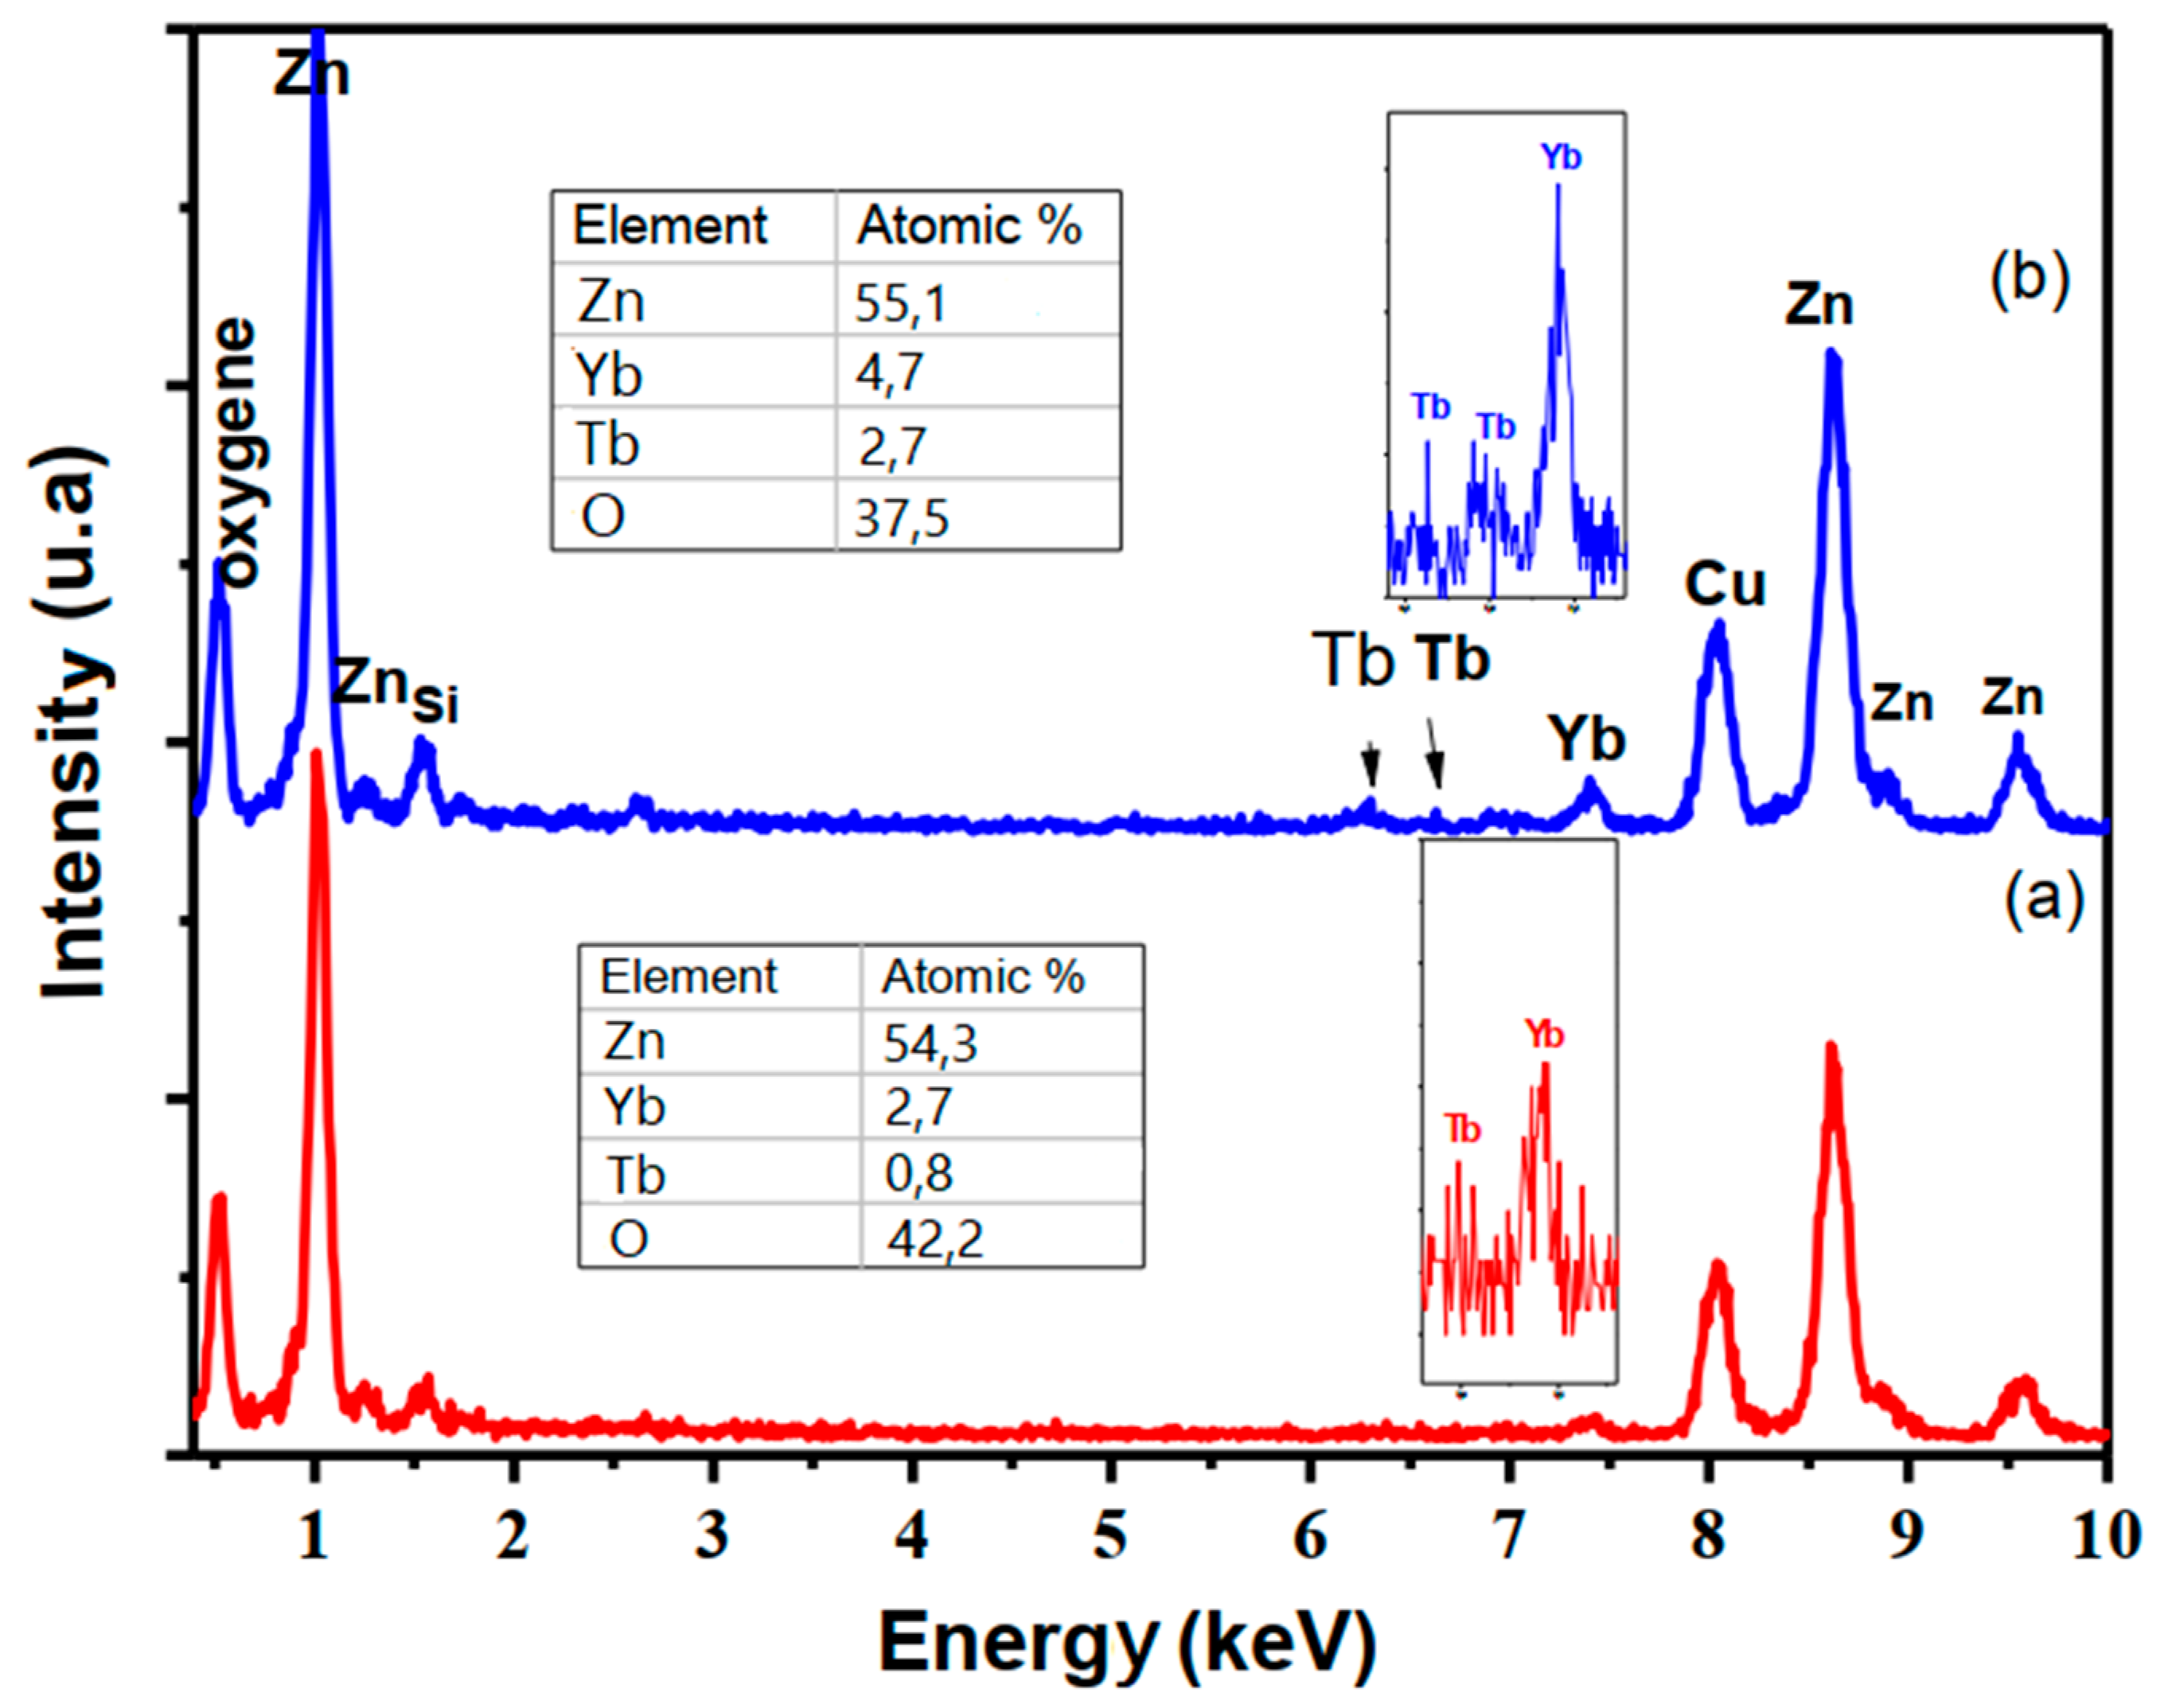
The local chemical compositions of the samples were characterized by EDS in different regions of the films surface, consequently giving an overall mapping of the sample. The EDS spectra of Tb and Yb co-doped ZnO films are shown in Figure 2. The attendance of the elements ytterbium, terbium, zinc, and oxygen could be observed in the spectra, the presence of the Si peak is endorsed to the glass substrate. One can notice that the Yb and Tb concentration in the film are lower than the nominal concentration in the sprayed solution. In the tables inserted in Figure 2, we have reported the percentages of Zn, Tb, Yb, and O obtained via this analysis. The percentage values of the concentration of Tb and Yb are slightly underestimated compared to the nominal value. The EDS analyses show that the ratio [Zn]/[O] is less than 1. As a consequence, this shows that the deposit is slightly in excess of oxygen on the one hand and part of it is due to the glass substrate from another hand.
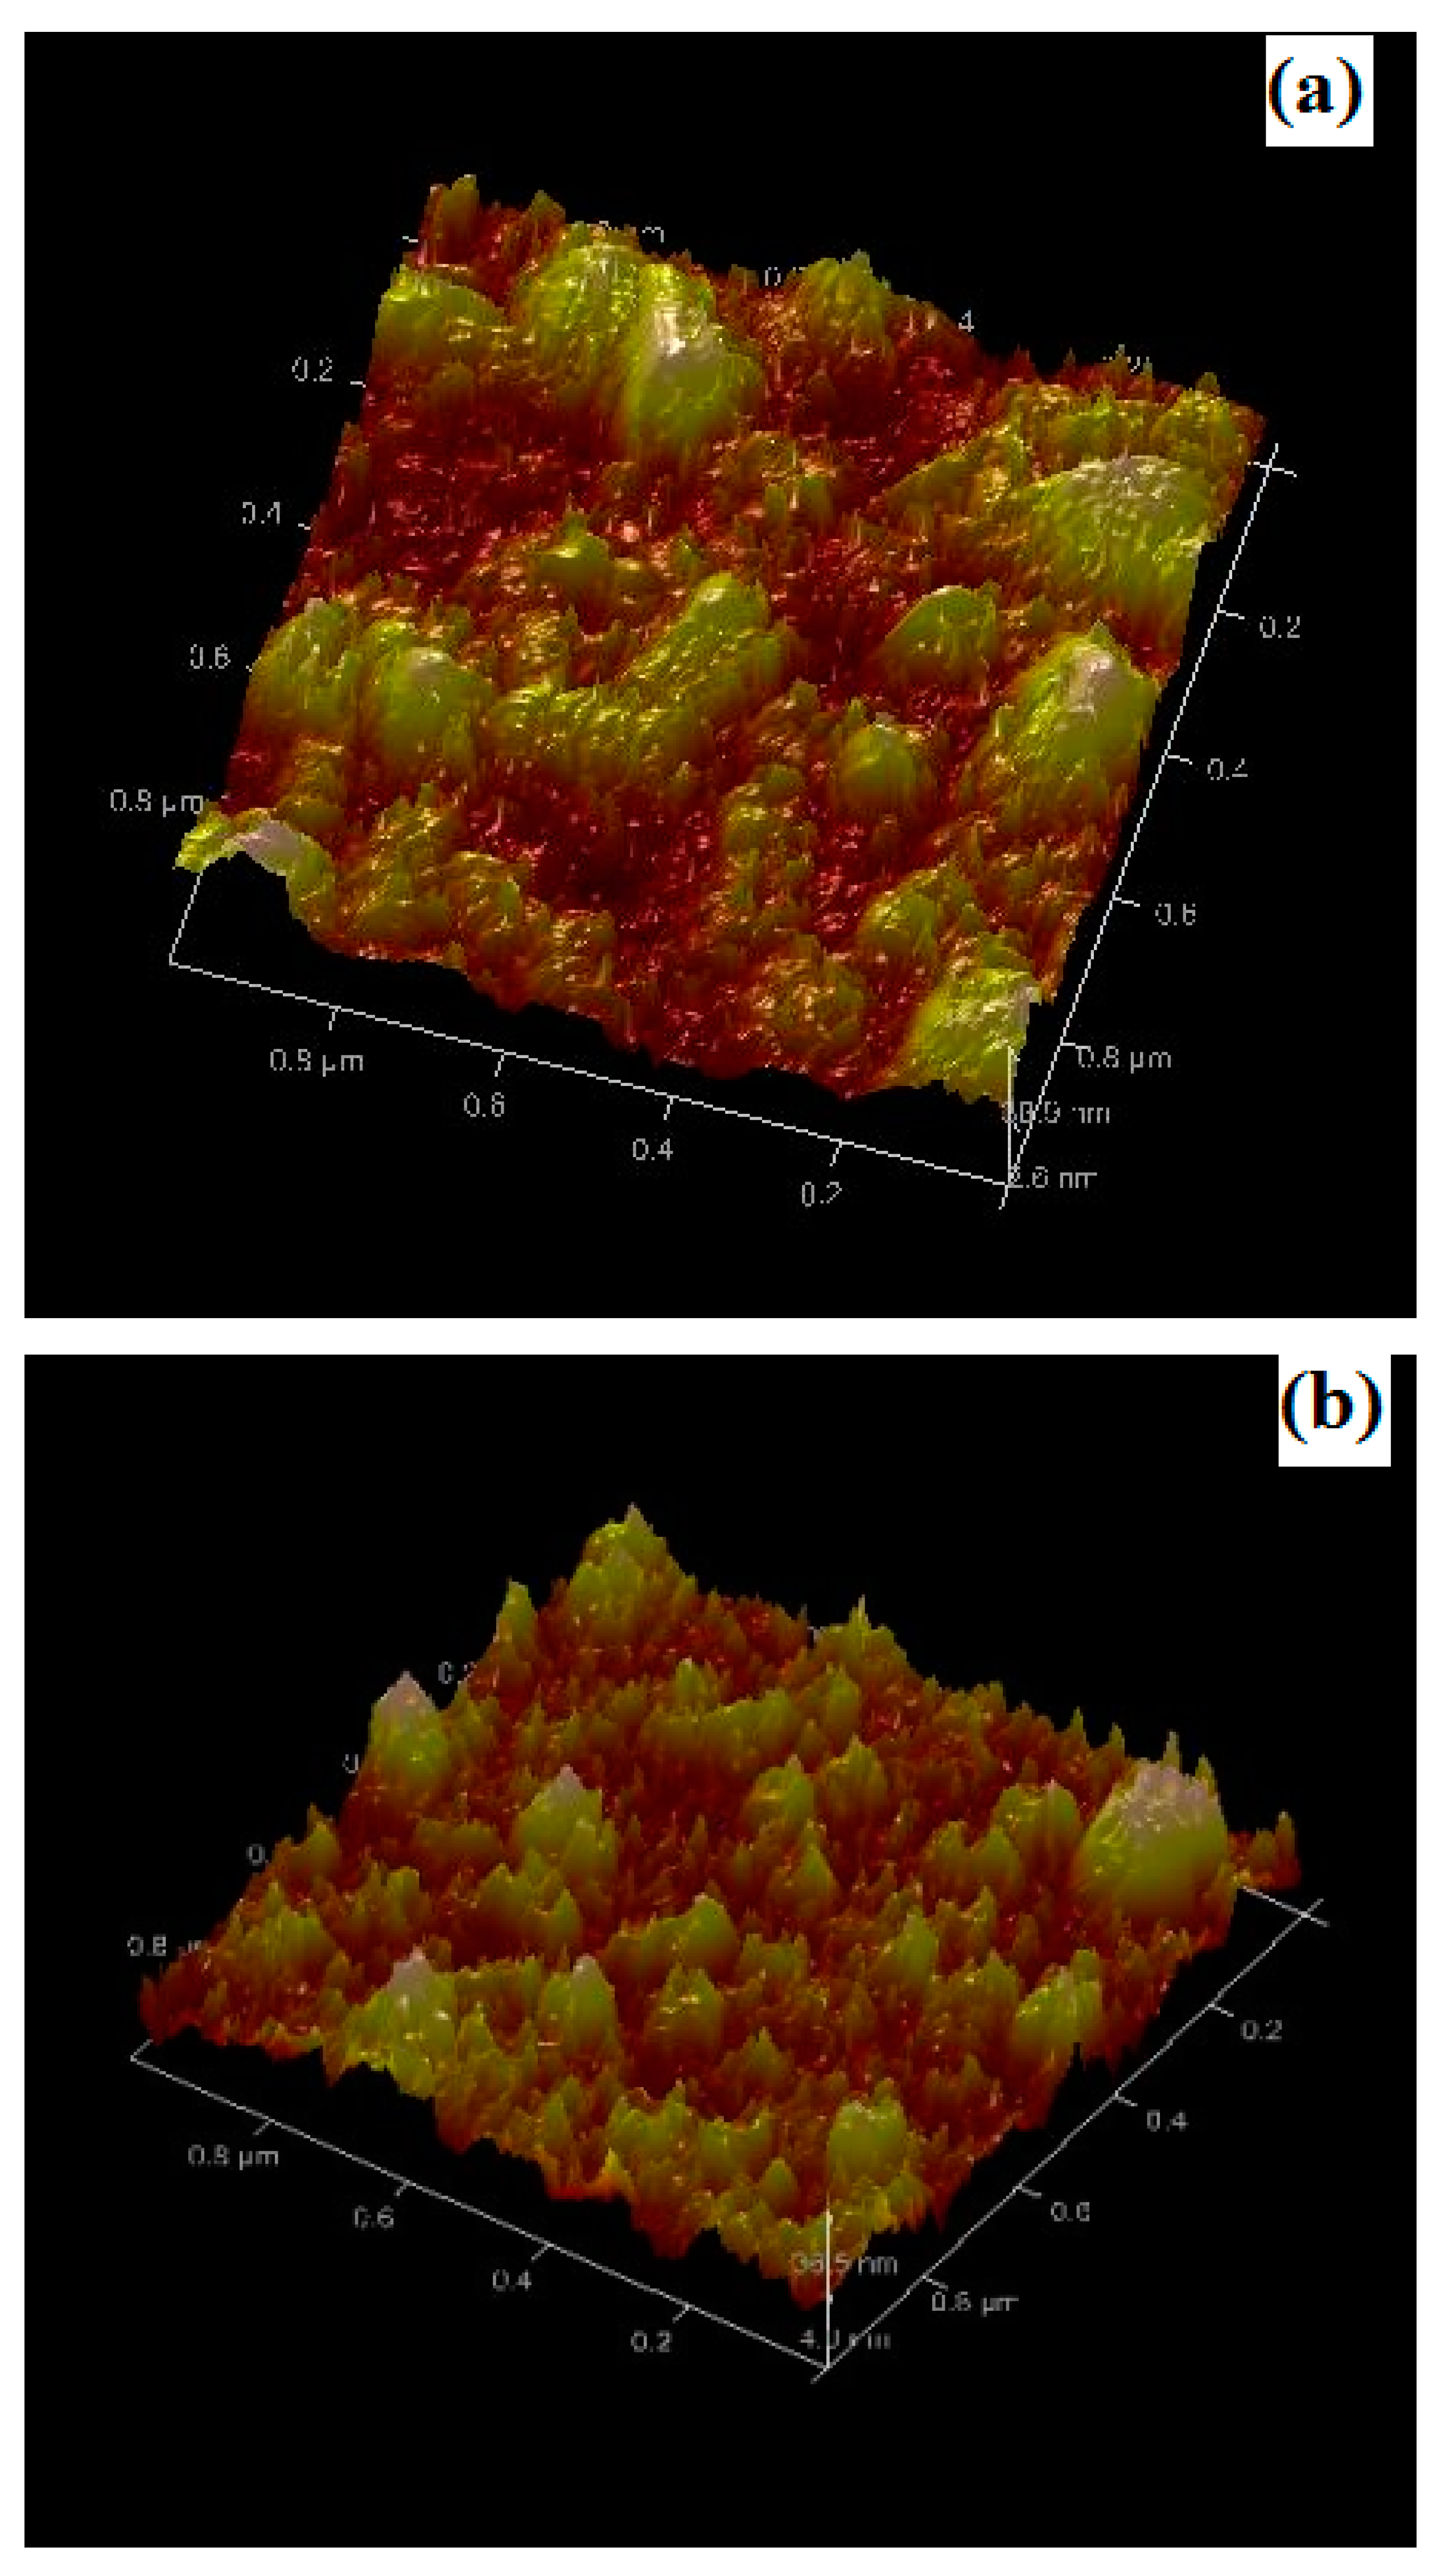
Figure 3a,b illustrate the AFM 3-dimensional images of Yb and Tb co-doped ZnO films. These micrographs illustrate a slight difference between the morphology of the deposited films, although a clear influence on the roughness has been measured. Samples without ytterbium content (Table 1) show high roughness values, whereas roughness decreases considerably (about 10 nm) when ytterbium is co-doped. Similar behavior is observed in the grain size variation estimated from XRD studies. Such low values of roughness are compatible with use in photovoltaics.

3.2. Optical Transmittance and Photoluminescence

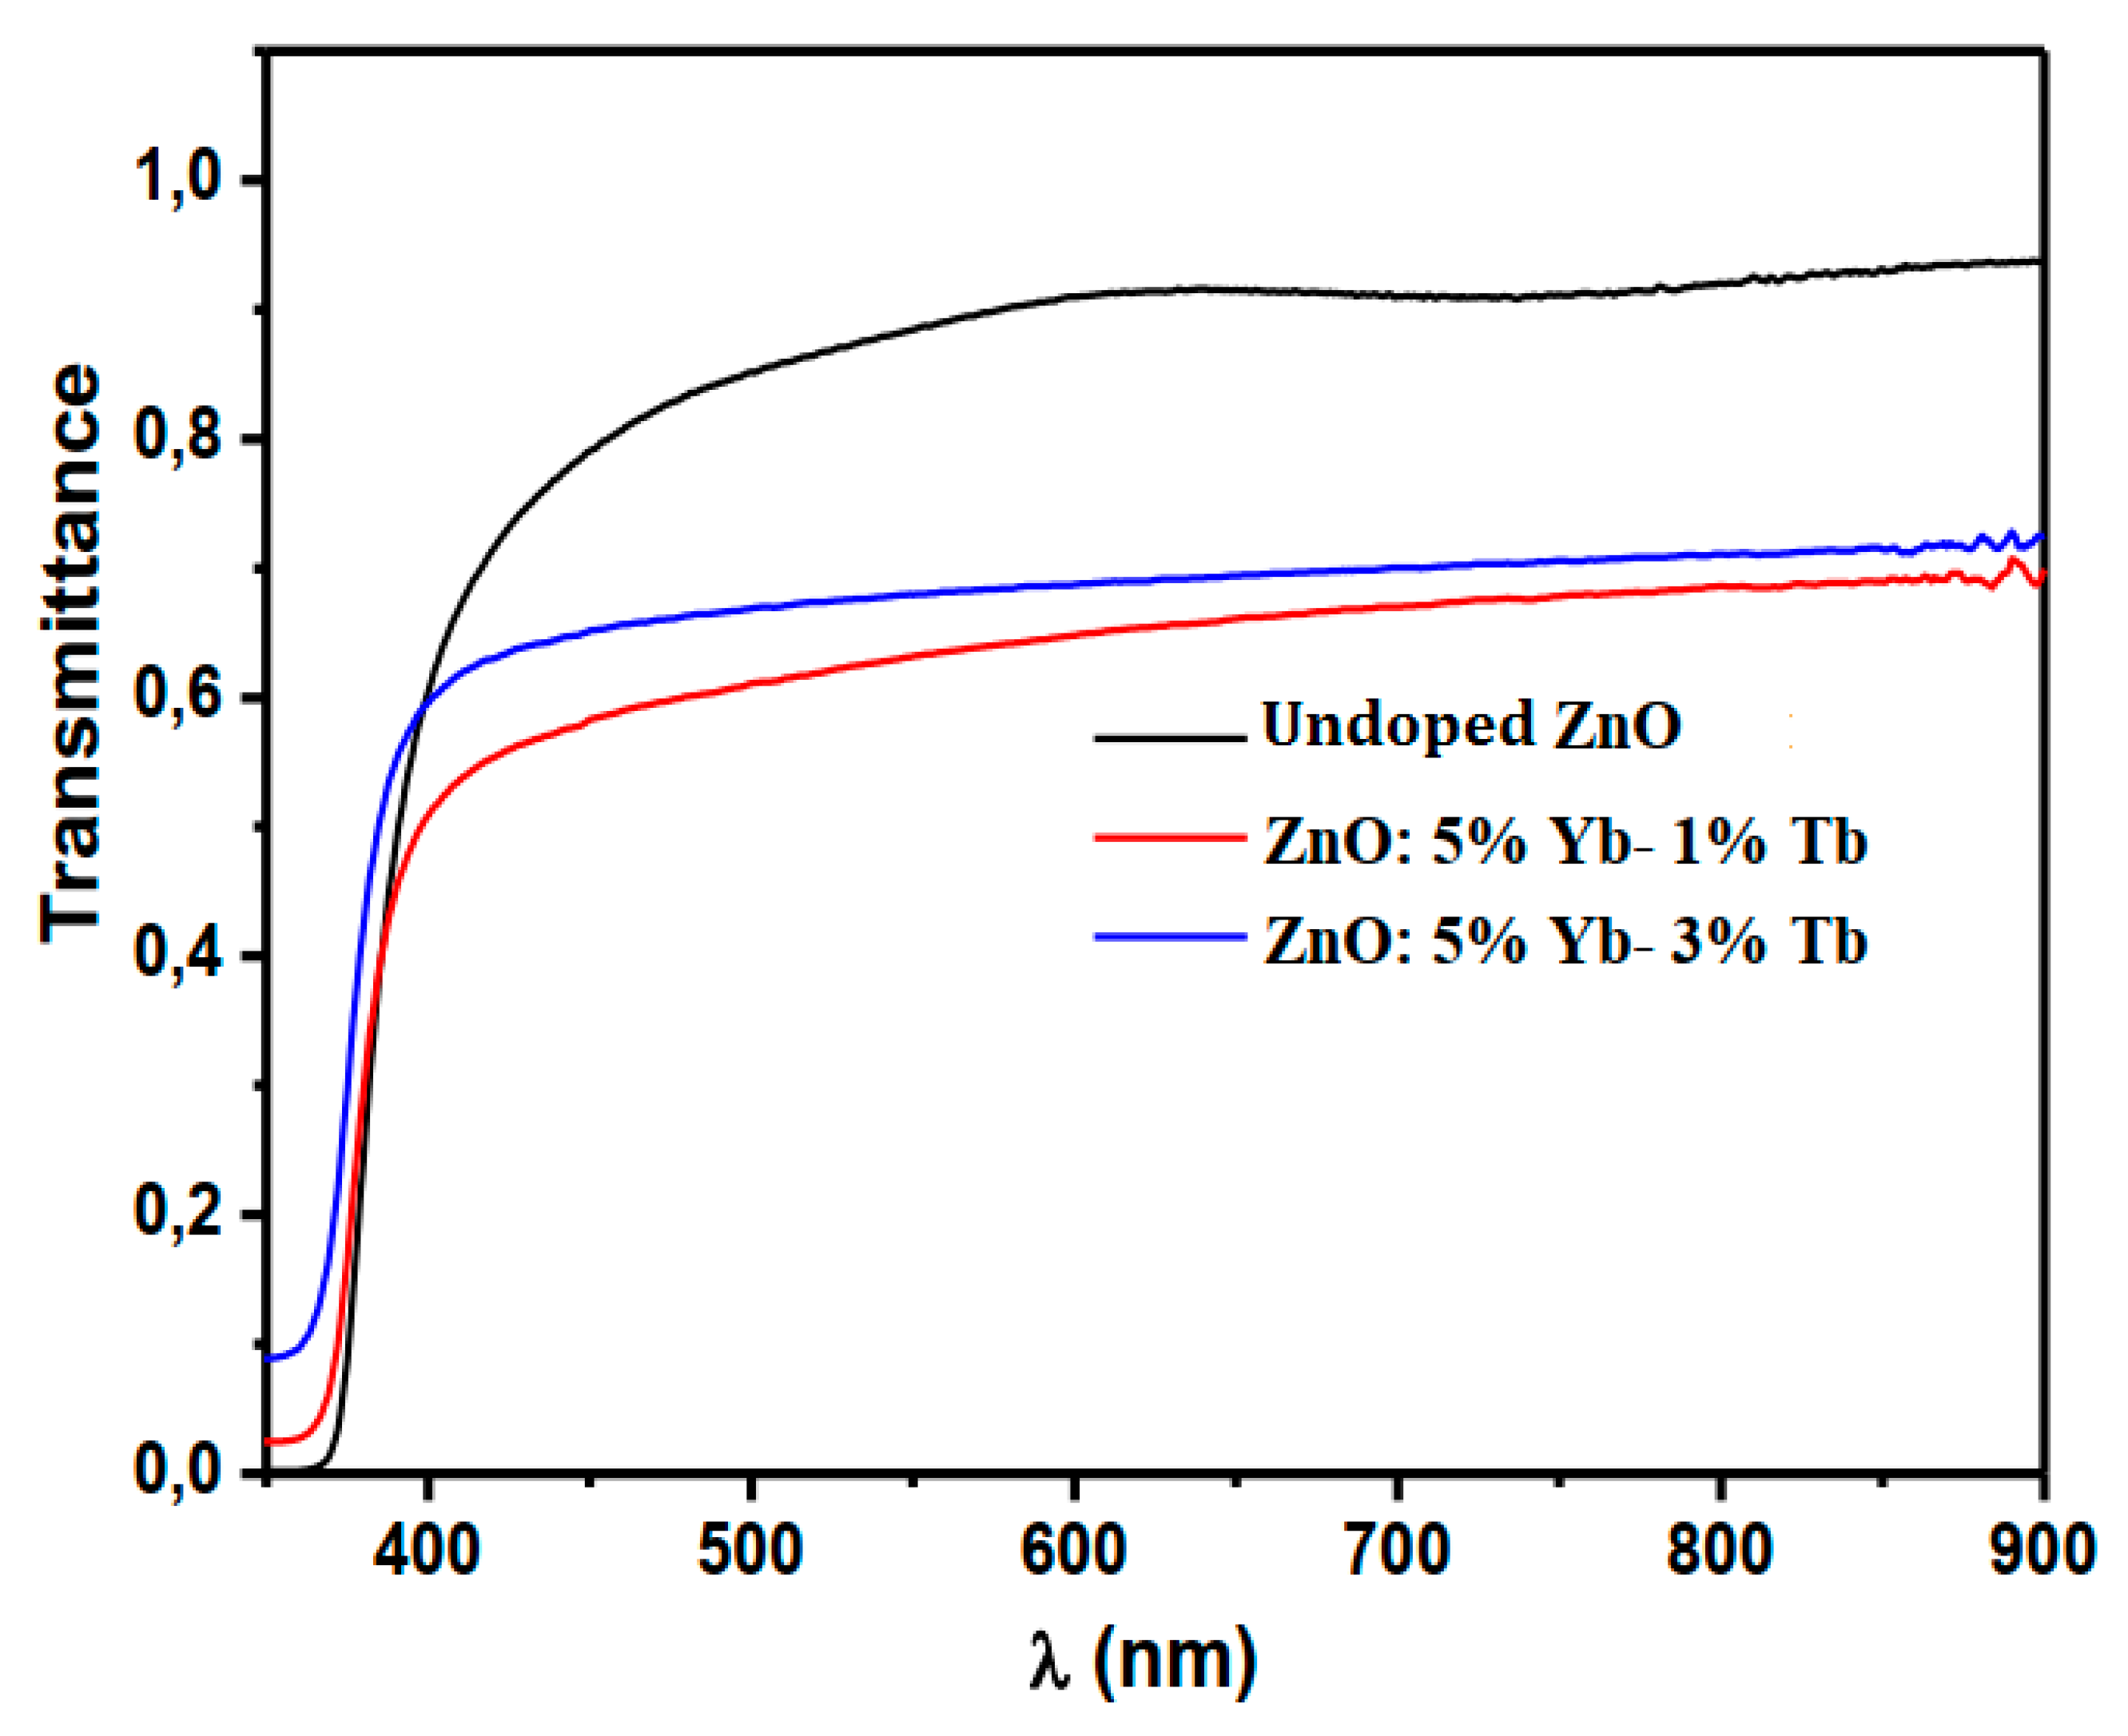
The spectra of the T-transmission as a function of the wavelength in the 350–800 nm range are shown in Figure 4. We find that the transmission decreases during the co-doping to reach values less than 70%. The decrease of the transmission is a little more marked in the 400–500 nm region. This may be due to the absorption of oxygen deficiencies, whose defect levels are located slightly below the conduction band. This absorption has the effect of reducing the value of the forbidden band. The absence of the interference fringes is due to the diffusion of light. The latter is caused by the small size of the grains, which disperse light rather than transmit it.
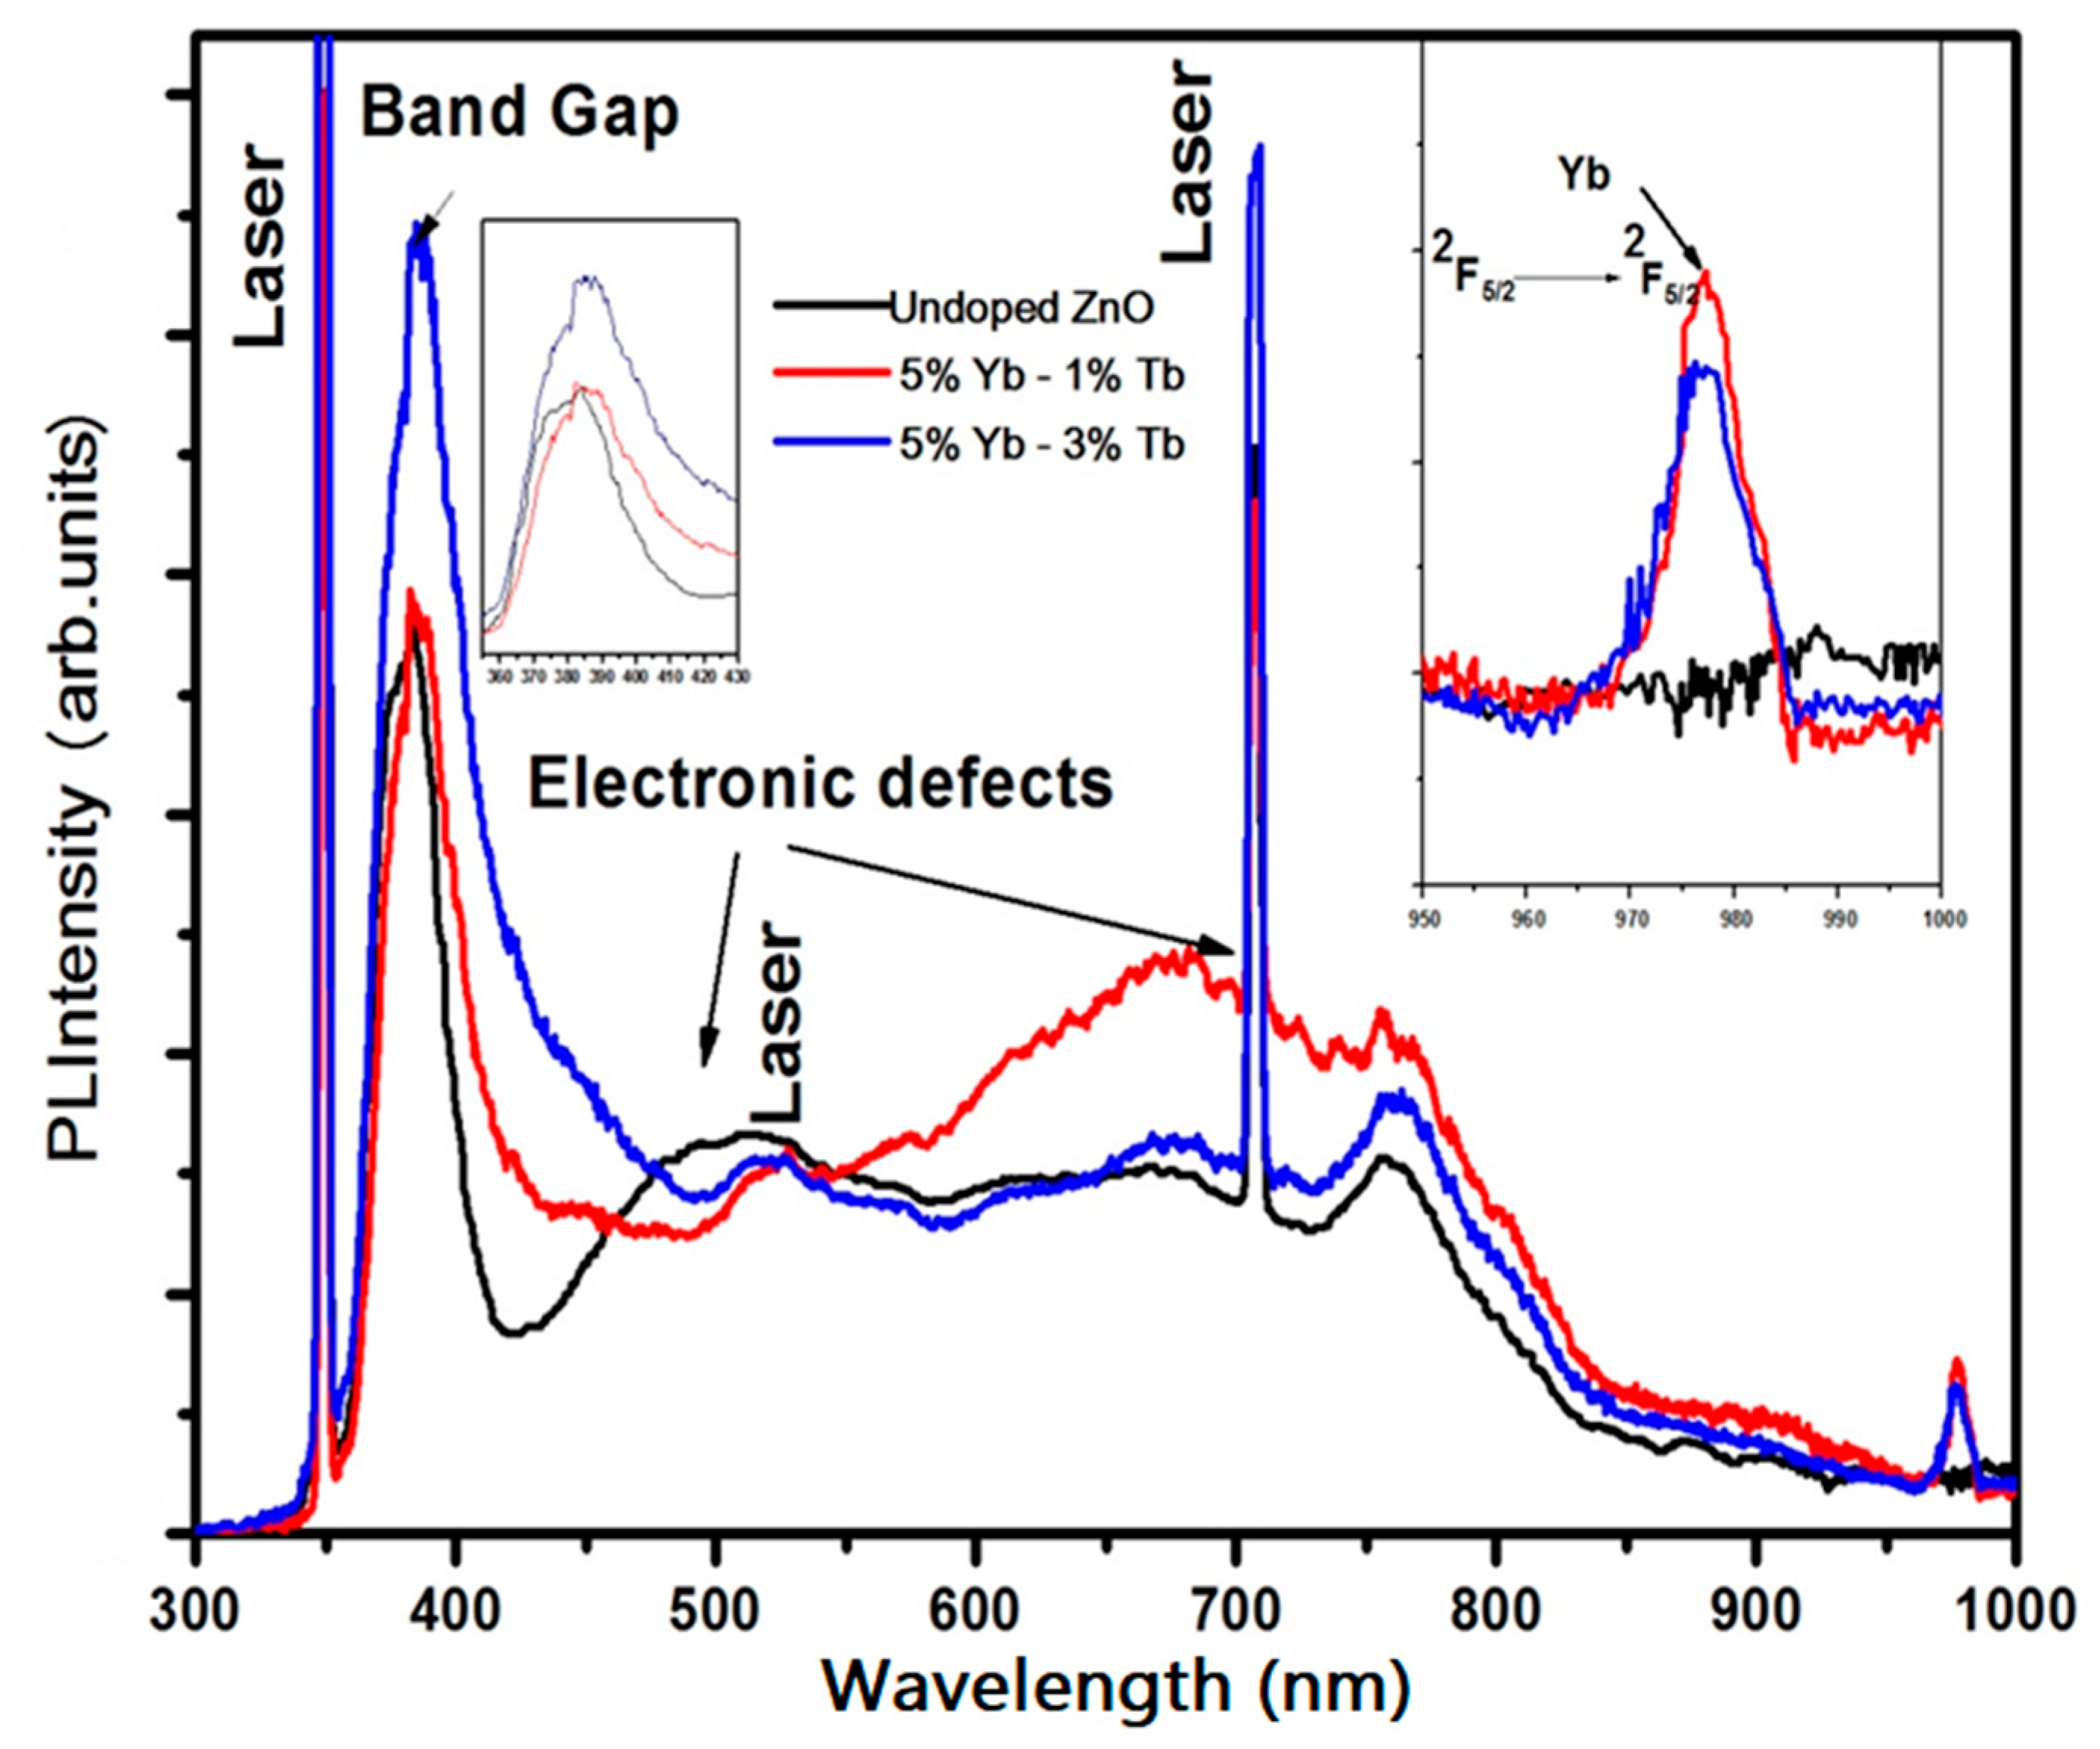
Photoluminescence (PL) is a powerful method for studying the effects of doping on the optical properties of semiconductors. PL spectra are shown in Figure 5. The peak at 710 nm corresponds to the second-order diffraction peak of the 355 nm laser line. The strong luminescence band at 379 nm corresponds to the excitonic emission. The second order of this PL band is visible at 760 nm. The wide PL band between 510 and 680 nm characterize the deep levels of oxygen vacancies in the ZnO and zinc or oxygen atoms in interstitial positions [30]. The relative intensity of this band compared to the undoped and Yb-doped ZnO [27] increased with Tb co-doping level. This behavior can be attributed to the increase of both optically active defects and non-radiative transition centers created by the incorporation of Tb and Yb in ZnO matrix. Around 980 nm, one can see a peak that is characteristic of the 2F5/22F7/2 transition of Yb3+ ions. This peak indicates an existing transfer energy between ZnO matrix and the Yb3+ ion and agrees with previous works [27,31]. Yb3+ ions are known to have only two spin orbit manifolds levels, 2F5/2 and 2F7/2. No clear emission from Tb3+ ions has been detected in the 400–1000 nm wavelength range, which means that there is either no transfer to Tb3+ or the transfer efficiency is very low. The optical band gap energies Eg of the films were estimated from the photoluminescence spectra. Eg values are 3.27 eV, 3.23 eV and 3.21 eV for undoped ZnO, ZnO:5%Yb-1%Tb and ZnO:5%Yb-3%Tb, respectively. This decrease is probably due to the increase of RE defects in the ZnO upon doping as it has been reported by Zheng et al. [32]. The RE 4f electrons introduce new states close to the conduction band of ZnO and a new LUMO is thus formed, which leads to a reduction in the band gap.

3.3. Electrical Properties

Hall-effect measurements were performed to investigate the electrical properties of the ZnO thin films. The data of electrical resistivity (ρ), Hall mobility (µH) and carrier concentration (ne) at room temperature are listed in Table 2. We noticed that the electrical parameters are dependent on the co-doping concentration. The origin of carriers in our films comes from both intrinsic donors such as lattice defects (oxygen vacancies and metal atoms in interstitial positions) and extrinsic doping due to the substitution of RE3+ for Zn2+ in ZnO matrix. A free hole will be produced for each substitution of Zn by Yb or Tb, which will contribute to the electrical conduction as free carriers. Using Hall Effect measurements, the films were found to be n-type semiconductor. These results are surprising since the RE ion doping must lead to a p-type doping. One can suppose that the insertion of the RE atoms in a substitutional position in the ZnO is not sufficient to induce p-type conduction. This can be explained by the fact that the conduction is primarily dominated by defects in ZnO and that most of RE atoms are probably lodged in interstitial positions, which indicates in this case that Tb and Yb act as a donor-type impurity. These results are in agreement with those reported in Yb-doped ZnO thin films [27]. The low mobility values observed are mainly attributed to the deterioration of the film crystallinity, grain boundaries, and/or to ionized impurity scattering, as already suggested by Thangaraju et al. [33]. Furthermore, Swapna et al. [34] reported that in the films prepared by the spray pyrolysis method, oxygen is one of the most important background impurities that diffuse readily into the crystal lattice when depositing samples in the air at elevated temperatures. Therefore, the oxygen impurity can alter the microstructure and grain size of the thin films during the deposition process and serves as a trap. Therefore, the mobility decreases. The combination of these two effects results in a decrease in the electrical resistivity. A minimum value of 6.0 × 10⁻³ Ω.cm has been obtained for the ZnO films doped with 5% Yb and 3% Tb.
To follow up this work, appropriate heat treatments under controlled atmospheres are needed to improve the physical properties of these films, and further analysis such as infrared photoluminescence measurements are expected.

4. Conclusions

In this work, we conducted a study focused on the terbium rare earth effect on Yb-doped ZnO thin films that were prepared on glass substrates by the spray pyrolysis technique, with the objective to investigated the structural, optical and electrical properties. The x-ray diffraction (XRD) analysis showed that the films exhibit the hexagonal wurtzite structure and a preferential orientation in the (002) direction. The co-doped films reveal that co-doping has a notable impact on the values of optical transmission, reaching values of less than 70%. Photoluminescence measurements show an emission band around 980 nm corresponding to the intrashell transitions of 2F5/22F7/2 from Yb3+ ion, which can be interpreted as an energy transfer between ZnO matrix and the doping Yb3+ centers. No emission from Tb rare earth was observed. All samples were n-type, and the electrical resistivity decreases down to 6.0 × 10⁻³ Ω.cm. The above-mentioned characteristics render these co-doped ZnO films potential candidates for the photons’ down-conversion layers in photovoltaic cells, with the advantage that they are prepared by a simple and economical technique.

Author Contributions

Conceptualization, M.A.-L., A.B., and A.M.; methodology, I.C. and A.E.h.; formal analysis, R.E., A.S., and G.S.; investigation, A.E.h. and I.C.; writing—original draft preparation, A.E.h. and R.E.; writing—review and editing, M.R., I.C. and A.E.h.; visualization, Z.S., A.D. and A.E.h.; supervision, A.M., and M.A.-L. All authors have read and agreed to the published version of the manuscript.

Funding

This research received no external funding.

Conflicts of Interest

The authors declare no conflict of interest.

References

  1. Lu, Y.M.; Li, X.P.; Cao, P.J.; Su, S.C.; Jia, F.; Han, S.; Liu, W.J.; Zhu, D.L.; Ma, X.C. Study of ultraviolet emission spectra in ZnO thin films. J. Spectrosc. 2013, 2013, 797232. [Google Scholar] [CrossRef]
  2. Caglara, M.; Ilican, S.; Caglar, Y.; Yakuphanoglu, F. Boron doped nanostructure ZnO films onto ITO substrate. J. Alloys Compd. 2011, 509, 3177–3182. [Google Scholar] [CrossRef]
  3. Robles-Águila, M.J.; Luna-López, J.A.; de la Luz, Á.D.H.; Martínez-Juárez, J.; Rabanal, M.E. Synthesis and characterization of nanocrystalline ZnO doped with Al3+ and Ni2+ by a sol–gel method coupled with ultrasound irradiation. Crystals 2018, 8, 406. [Google Scholar] [CrossRef] [Green Version]
  4. Ahn, K.J.; Lee, S.; Kim, W.J.; Yeom, G.Y.; Lee, W. Characteristics of Ga-doped ZnO films deposited by pulsed DC magnetron sputtering at low temperature. Mater. Sci. Semicond. Process. 2013, 16, 1957–1963. [Google Scholar] [CrossRef]
  5. Douayar, A.; Diaz, R.; Prieto, P.; Abd-Lefdil, M. Structural, optical and electrical properties of ZnO sprayed thin films doped with fluorine. Adv. Mater. Res. 2011, 324, 253–256. [Google Scholar] [CrossRef]
  6. Liu, J.P.; Qu, S.C.; Zeng, X.B.; Xu, Y.; Gou, X.F.; Wang, Z.J.; Zhou, H.Y.; Wang, Z.G. Fabrication of ZnO and its enhancement of charge injection and transport in hybrid organic/inorganic light emitting devices. Appl. Surf. Sci. 2007, 253, 7506–7509. [Google Scholar] [CrossRef]
  7. Chirakkara, S.; Krupanidhi, S.B. Pulsed laser deposited ZnO/ZnO: Li multilayer for blue light emitting diodes. J. Lumin. 2011, 131, 1649–1654. [Google Scholar] [CrossRef]
  8. Wang, W.; Zhang, G.; Yu, L.; Bai, X.; Zhang, Z.; Zhao, X. Field emission properties of zinc oxide nanowires fabricated by thermal evaporation. Physica E 2007, 36, 86–91. [Google Scholar] [CrossRef]
  9. Lingling, W.; Maiphi, H.; Gennady, N.P.; Taewon, K.; Fu, D.J. Enhanced field emission from self-assembled ZnO nanorods on graphene/Ni/Si substrates. Mater. Lett. 2013, 112, 183–186. [Google Scholar]
  10. Breivik, T.H.; Diplas, S.; Ulyashin, A.G.; Gunnæs, A.E.; Olaisen, B.R.; Wright, D.N.; Holt, A.; Olsen, A. Nano-structural properties of ZnO films for Si based heterojunction solar cells. Thin Solid Films 2007, 515, 8479–8483. [Google Scholar] [CrossRef]
  11. Giannouli, M.; Spiliopoulou, F. Effects of the morphology of nanostructured ZnO films on the efficiency of dye-sensitized solar cells. Renew. Energy 2012, 41, 115–122. [Google Scholar] [CrossRef]
  12. Lupan, O.; Chai, G.; Chow, L. Fabrication of ZnO nanorod-based hydrogen gas nanosensor. Microelectron. J. 2007, 38, 1211–1216. [Google Scholar] [CrossRef] [Green Version]
  13. Rambu, A.P.; Ursu, L.; Iftimie, N.; Nica, V.; Dobromir, M.; Iacomi, F. Study on Ni-doped ZnO films as gas sensors. Appl. Surf. Sci. 2013, 280, 598–604. [Google Scholar] [CrossRef]
  14. Vettumperumal, R.; Kalyanaraman, S.; Thangavel, R. Optical constants and near infrared emission of Er doped ZnO sol–gel thin films. J. Lumin. 2015, 158, 493–500. [Google Scholar] [CrossRef]
  15. Sahu, D.R.; Lin, S.Y.; Huang, J.L. Improved properties of Al-doped ZnO film by electron beam evaporation technique. Microelectron. J. 2007, 38, 245–250. [Google Scholar] [CrossRef]
  16. Chaki, I.; Belayachi, A.; el Bahraoui, T.; Regragui, M.; Abd-Lefdil, M. Semiconducting properties of Tm doped Yb-ZnO films by spray pyrolysis. Eur. Phys. J. Appl. Phys. 2014, 68, 30301. [Google Scholar] [CrossRef]
  17. Chen, Y.Y.; Yang, J.R.; Cheng, S.L.; Shiojiri, M. Structural investigation of ZnO: Al films deposited on the Si substrates by radio frequency magnetron sputtering. Thin Solid Films 2013, 545, 183–187. [Google Scholar] [CrossRef]
  18. Kaur, G.; Dwivedi, Y.; Rai, S.B. Gd3+ Sensitized Enhanced Green Luminescence in Gd:Tb(Sal)3 Phen Complex in PVA. J. Fluoresc. 2011, 21, 423–432. [Google Scholar] [CrossRef]
  19. Salley, G.M.; Valiente, R.; Gudel, H.U. Luminescence upconversion mechanisms in Yb3+–Tb3+ systems. J. Lumin. 2001, 94–95, 305–309. [Google Scholar] [CrossRef]
  20. John, R.; Rajakumari, R. Synthesis and characterization of rare earth ion doped nano ZnO. Nano-Micro Lett. 2012, 4, 65–72. [Google Scholar] [CrossRef] [Green Version]
  21. Douayar, A.; Prieto, P.; Schmerber, G.; Nouneh, K.; Diaz, R.; Chaki, I.; Colis, S.; el Fakir, A.; Hassanain, N.; Belayachi, A.; et al. Investigation of the structural, optical and electrical properties of Nd-doped ZnO thin films deposited by spray pyrolysis. Eur. Phys. J. Appl. Phys. 2013, 61, 10304–10306. [Google Scholar] [CrossRef] [Green Version]
  22. Yang, Y.H.; Zhu, H.G.; Dong, H.M.; Yang, G.W. Growth and luminescence of Tb-doped ZnO nanocones. Mater. Lett. 2014, 124, 32–35. [Google Scholar] [CrossRef]
  23. Lv, Z.J.; Liu, Y.; Yu, H.; Dong, X.T.; Yang, H. Hollow tubular Tb3+ and Yb3+ co-doped ordered mesoporous ZnO composite materials and its luminescent properties. Opt. Mater. 2019, 89, 528–535. [Google Scholar] [CrossRef]
  24. Florêncio, L.D.A.; Gómez-Malagón, L.A.; Lima, B.C.; Gomes, A.S.; Garcia, J.A.M.; Kassab, L.R. Efficiency enhancement in solar cells using photon down-conversion in Tb/Yb-doped tellurite glass. Sol. Energy Mater. Sol. Cells 2016, 157, 468–475. [Google Scholar] [CrossRef] [Green Version]
  25. Shinde, S.S.; Shinde, P.S.; Pawar, S.M.; Moholkar, A.V.; Bhosale, C.H.; Rajpure, K.Y. Physical properties of transparent and conducting sprayed fluorine doped zinc oxide thin films. Solid State Sci. 2008, 10, 1209–1214. [Google Scholar] [CrossRef]
  26. Elfakir, A.; Douayar, A.; Diaz, R.; Chaki, I.; Prieto, P.; Loghmarti, M.; Belayachi, A.; Abd-lefdil, M. Elaboration and characterization of sprayed Tb-doped ZnO thin films. Thin Film. Sens. Transducers 2014, 27, 161–164. [Google Scholar]
  27. Soumahoro, I.; Schmerber, G.; Douayar, A.; Colis, S.; Abd-Lefdil, M.; Hassanain, N.; Berrada, A.; Muller, D.; Slaoui, A.; Rinnert, H.; et al. Structural, optical, and electrical properties of Yb-doped ZnO thin films prepared by spray pyrolysis method. J. Appl. Phys. 2011, 109, 033708. [Google Scholar] [CrossRef] [Green Version]
  28. Scherrer, P. Prinzipalle mechanismen in Physics. Göttinger Nachrichten Math. Phys. 1918, 2, 98–100. [Google Scholar]
  29. Yogamalar, N.R.; Sadhanandham, K.; Bose, A.C.; Jayavel, R. Band alignment and depletion zone at ZnO/CdS and ZnO/CdSe hetero-structures for temperature independent ammonia vapor sensing. Phys. Chem. Chem. Phys. 2016, 18, 32057–32071. [Google Scholar] [CrossRef]
  30. Petersen, J.; Brimont, C.; Gallart, M.; Crégut, O.; Schmerber, G.; Gilliot, P.; Hönerlage, B.; Ulhaq-Bouillet, C.; Rehspringer, J.L.; Leuvrey, C.; et al. Optical properties of ZnO thin films prepared by sol–gel process. Microelectron. J. 2009, 40, 239–241. [Google Scholar] [CrossRef]
  31. Balestrieri, M.; Ferblantier, G.; Colis, S.; Schmerber, G.; Ulhaq-Bouillet, C.; Muller, D.; Slaoui, A.; Dinia, A. Structural and optical properties of Yb-doped ZnO films deposited by magnetron reactive sputtering for photon conversion. Sol. Energy Mater. Sol. Cells 2013, 117, 363–371. [Google Scholar] [CrossRef]
  32. Zheng, J.H.; Song, J.L.; Zhao, Z.; Jiang, Q.; Lian, J.S. Optical and magnetic properties of Nd-doped ZnO nanoparticles. Cryst. Res. Technol. 2012, 47, 713–718. [Google Scholar] [CrossRef]
  33. Thangaraju, B. Structural and electrical studies on highly conducting spray deposited fluorine and antimony doped SnO2 thin films from SnCl2 precursor. Thin Solid Films 2002, 402, 71–78. [Google Scholar] [CrossRef] [Green Version]
  34. Swapna, R.; Ashok, M.; Muralidharan, G.; SanthoshKumar, M.C. Microstructural, electrical and optical properties of ZnO: Mo thin films with various thickness by spray pyrolysis. J. Anal. Appl. Pyrolysis 2013, 102, 68–75. [Google Scholar] [CrossRef]
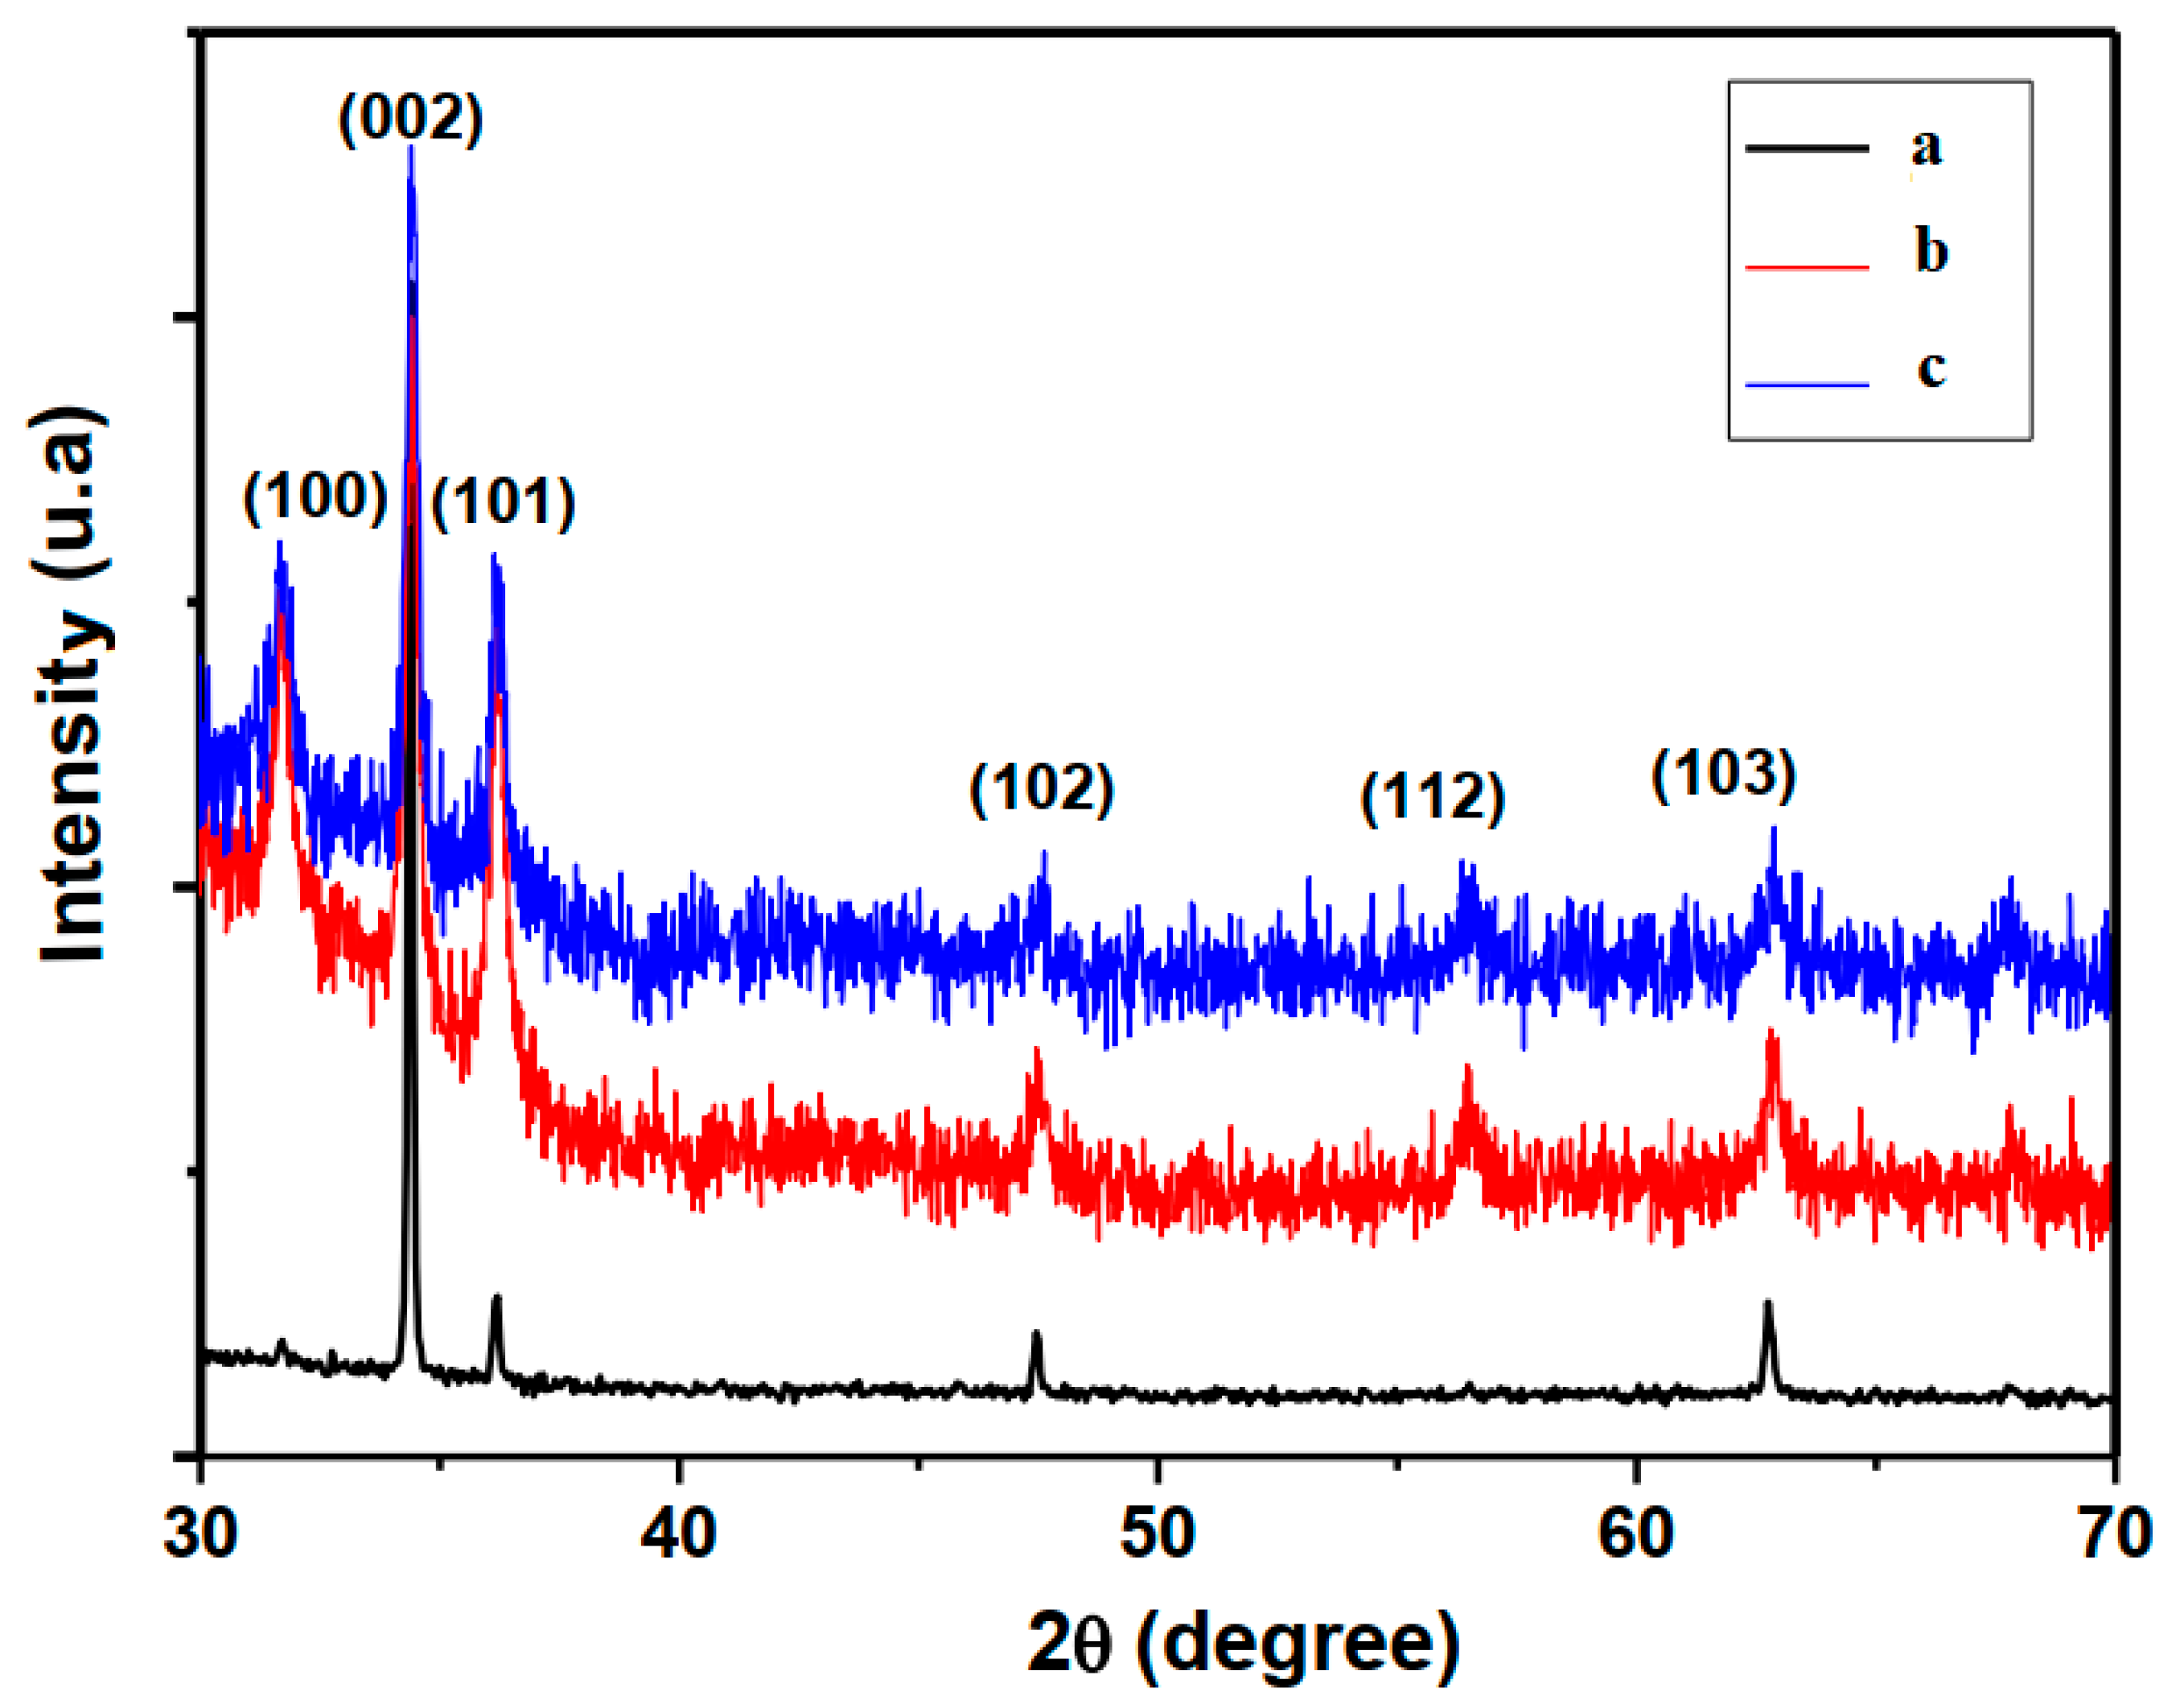
Figure 1. XRD diffraction spectra of (a) undoped ZnO, (b) ZnO: 5% Yb3+-1% Tb3+ and (c) ZnO: 5% Yb3+-3% Tb3+ films.
Crystals 10 00169 g001
Figure 2. Typical EDX spectra of Yb3+/Tb3+ co-doped ZnO thin films with the following Tb doping contents: (a) 1% Tb, (b) 3% Tb.
Crystals 10 00169 g002
Figure 3. AFM images of Yb3+/Tb3+ co-doped ZnO thin films: (a) ZnO: 5% Yb3+-1% Tb3+, (b) ZnO:5% Yb3+-3% Tb3+.
Crystals 10 00169 g003
Figure 4. Optical transmittance as a function of wavelength for the same co-doped samples.
Crystals 10 00169 g004
Figure 5. Photoluminescence at room temperature for undoped ZnO, ZnO: 5%Yb3+-1% Tb3+ and 5%Yb3+-3%Tb3+ films. The inset shows the lines transition of Yb3+ between the levels 2F5/2 and 2F7/2.
Crystals 10 00169 g005
Table 1. Structural parameters of undoped and co-doped ZnO thin films.
x NominalThickness
(nm)
Grain Size D (nm)Tc (002)RMS Roughness (nm)Reference
Undoped ZnO430763.030.0 This work
1% Tb3+__2.936[26]
5% Yb3+455833.5_[27]
5% Yb3+-1% Tb3+450301.610.6This work
3% Tb3+__2.777[26]
5%Yb3+-3%Tb3+462231.68.8This work
Table 2. Electrical parameters of undoped and co-doped ZnO thin films.
x Nominalne (1020 cm−3)ρ (10−2 Ω.cm)μH (10−1 cm2/V.s)Ref
Undoped ZnO0.13657.3 This work
1% Tb3+1.36.08.4[26]
5% Yb3+-8.05.2[27]
5% Yb3+-1% Tb3+5.5 5.42.1This work
3% Tb3+0.827.410.3[34]
5% Yb3+-3% Tb3+23 0.64.7This work