Article

Investigation of the Structural Changes and Catalytic Properties of FeNi Nanostructures as a Result of Exposure to Gamma Radiation

by
Daryn B. Borgekov
1,2,
Maxim V. Zdorovets
1,2,3,
Dmitriy I. Shlimas
1,2 and
Artem L. Kozlovskiy
2,4,*
1
Engineering Profile Laboratory, L.N. Gumilyov Eurasian National University, Astana 010008, Kazakhstan
2
Laboratory of Solid State Physics, The Institute of Nuclear Physics, Almaty 050032, Kazakhstan
3
Department of Intelligent Information Technologies, Ural Federal University, 620075 Yekaterinburg, Russia
4
Laboratory of Additive Technologies, Kazakh-Russian International University, Aktobe 030006, Kazakhstan
*
Author to whom correspondence should be addressed.
Crystals 2020, 10(4), 254; https://doi.org/10.3390/cryst10040254
Submission received: 10 February 2020 / Revised: 24 March 2020 / Accepted: 26 March 2020 / Published: 27 March 2020
(This article belongs to the Section Crystalline Materials)

Abstract

:
The paper presents the results of changes in the structural characteristics, and the degree of texturing of FeNi nanostructures close in composition to permalloy compounds as a result of directed modification by gamma radiation with an energy of 1.35 MeV and doses from 100 to 500 kGy. The choices of energy and radiation doses were due to the need to modify the structural properties, which consisted of annealing the point defects that occurred during the synthesis along the entire length of the nanotubes. The initial FeNi nanostructures were polycrystalline nanotubes of anisotropic crystallite orientation, obtained by electrochemical deposition. The study found that exposure to gamma rays led to fewer defects in the structure, and reorientation of crystallites, and at doses above 300 kGy, the presence of one selected texture direction (111) in the structure. During tests of the corrosion resistance of synthesized and modified nanostructures in a PBS solution at various temperatures, it was found that exposure to gamma rays led to a significant decrease in the rate of degradation of nanotubes and an increase in the potential life of up to 20 days. It was established that at the first stage of testing, the degradation of nanostructures is accompanied by the formation of oxide inclusions, which subsequently lead to the formation of pitting corrosion and subsequent partial or complete destruction of the nanostructures. It is shown that gamma radiation is promising not only for targeted modification of nanostructures and increasing resistance to degradation, but also for increasing the rate of catalytic reactions of the PNA-PPD type.

1. Introduction

As is known, there is not much data on the stability and resistance to external influences of nanostructured materials, and most of what exists is from scattered studies related to studying the effects of external factors on certain properties of nanomaterials [1,2,3]. Moreover, almost all nanostructured materials obtained by various methods are, to one degree or another, nonequilibrium structures with nonequilibrium phases; strong distortions and deformations of the structure; and high porosity or degree of disorder [4,5]. The nonequilibrium structure of a nanomaterial sometimes leads to significant limitations on its applicability in view of the low resistance to external influences. One way to increase the stability of a nanostructure is via directed modification in order to reduce the density of point defects in the structure, and the relaxation of nonequilibrium phases. The most common methods of directional modification are thermal annealing of defects in various media, and the use of irradiation of nanostructures with various types of ionizing radiation [5,6,7,8,9,10]. In this case, in the case of thermal annealing, the processes of annihilation of defects as a result of changes in the thermal vibrations of atoms and the subsequent recrystallization of nanostructures, as a rule, at high annealing temperatures lead not only to annealing of defects, but also to processes of phase transformations, which lead not only to a change in the structure, but also in the conductive and magnetic properties of nanomaterials [11,12,13]. In turn, a change in the phase composition for iron-containing nanostructures can be accompanied by oxidation and the formation of oxide phases, which in most cases plays a dual role and leads to enlargement or an increase in the size of a nanostructure. In contrast to thermal annealing, regarding exposure to various types of radiation, in particular, electrons or gamma-quanta, which are small in size, all structural changes are associated with the impacts on the electronic structures of nanomaterials and point defects that arise during production [14,15]. Moreover, high energies of electrons or gamma rays (more than 1–5 MeV) lead to the formation of electronic cascades in the structure, which can lead to a significant change in the electron density of nanostructures, which leads to ordering of the structure and a change in the orientation of texture planes. At the same time, when irradiated with electronic and gamma radiation, the probability of an increase in the geometric dimensions of nanostructures is extremely small, which indicates the great promise of these types of radiation for directional modification and reduction of the disequilibrium of structural parameters in nanomaterials [16,17,18,19,20]. The absence of oxidation processes as a result of phase transformations upon irradiation with electrons or gamma rays opens up wide possibilities for using these types of radiation for the directed modification of iron-nickel or iron-containing nanostructures, for which oxidation processes are accompanied by phase transformations and changes in properties [21,22,23,24,25]. Permalloy compounds, which have high magnetic permeability, low coercivity and magnetostriction, which classifies them as soft magnetic materials, are some of the most promising materials among iron-containing nanostructures [26,27,28,29,30]. Nanostructures based on permalloy compounds have established themselves as the most promising materials not only in microelectronics, catalysis and data storage devices, but also in biological areas related to targeted delivery of drugs, etc. [31,32,33,34]. At the same time, a decrease in the defectiveness of the crystal structure, and a change in the degree of texturing of permalloy nanostructures, open up even greater possibilities for their practical applications, efficiency and working capacity.
In that vein, systematic studies on the applicability of ionizing radiation for the directed modification of structural characteristics, and increasing the resistance to degradation and productivity of nanostructures are not only fundamental, but also play an important role in the applied and practical field of the application of nanostructures [35,36,37]. New data on the possibility of using ionizing radiation for directed modification in the future will make it possible to make a significant contribution to the theory of radiation stability of nanomaterials and significantly expand the scope of their application.

2. Experimental Part

Nanostructures were obtained using the method of electrochemical reduction of metal ions from an electrolyte solution under the influence of an electric current. As the electrolyte solution, we used iron and nickel salts—FeSO4 · 7H2O and NiSO4 · 7H2O in a molar ratio of 1:10. Using this ratio of dissolved components and the applied potential difference of 1.5 V makes it possible to obtain two-component nanostructures close in composition to permalloy compounds. The use of boric (H3BO3) and ascorbic (C6H8O6) acids was to achieve the required pH of the solution equal to 3 and to accelerate the nucleation process along the walls of the matrix tracks [38,39]. This method allows one to obtain nanostructures of a given geometry, which is controlled by dielectric template matrices based on polymers or alumina, and a multicomponent composition by using electrolyte solutions with various metal salts dissolved. The use of polymer dielectric matrices of a given geometry, and the standard procedure for sputtering a conductive layer on one side of a matrix with a thickness of 20–30 nm, leads to the formation of a conductive layer at the edges of the tracks in the matrix, which later serve as centers for activation of the nucleation processes of nanostructures, and high the potential difference leads to the accelerated formation of nanostructures along the walls of the matrix track, followed by the growth of nanostructures in the form of cylindrical nanotubes with a wall thickness not exceeding 100 nm, a total diameter of 400 nm and a height of 12 μm (See Figure 1a). The geometric dimensions of 12 μm in length and 400 nm in diameter correspond to the geometry of the tracks of template matrices based on polyethylene terephthalate obtained by the ion-track technology [40,41,42].
The morphological features and the elemental composition of the synthesized nanostructures were studied using the scanning electron microscopy method performed using the “Hitachi TM3030” scanning electron microscope (Hitachi Ltd., Chiyoda, Tokyo, Japan). Shooting mode—LEI, current—20 μA, accelerating voltage—2 kV, WD = 8 mm. The study of the elemental composition, and the mapping of the structures under study in order to determine the equiprobable distribution of elements in the structure, was carried out using the energy dispersive analysis method performed using the EDA Bruker Flash MAN SVE installation (Bruker, Karlsruhe, Germany), at an accelerating voltage of 15 kV.
The influence of the ratio of the components of the electrolyte solution and the difference in the applied potentials on the elemental composition and isotropy of the distribution of the components in the structure of the nanotubes was determined using the energy dispersive analysis method by taking 10 spectra from different sections of the synthesized nanostructures, and mapping the elements along the entire length. After taking 10 spectra from different sections of the nanostructures, we calculated the average values of both components, and determined the magnitude of the error, which was no more than 2 at. %. The results are presented in Figure 1b,c.
As can be seen from the data presented, the elemental ratio of the components of iron and nickel in the structure is close to that of permalloy compounds, which are characterized by the ratio of the components Fe:Ni = 20:80. A slight deviation of this ratio for the synthesized nanostructures may be due to nucleation processes that occur during the preparation of nanostructures. According to the mapping data, the distribution of iron in nickel is equally probable over the entire length of the nanostructures, which indicates the isotropy of the growth rate of nanostructures and the same rate of reduction of metal ions from electrolyte solutions during synthesis.
The crystallographic characteristics of nanostructures before and after directed modification were studied using a D8 Advance Eco powder X-ray diffractometer (Bruker, Karlsruhe, Germany). Conditions for recording diffractograms: 2θ = 35–80°, step 0.01°, Bragg–Brentano geometry, spectrum acquisition time 3 s, sample table rotation speed 20 rpm, X-ray radiation Cu-Kα, λ = 1.54 Å. For X-ray diffraction, all samples before and after modification were in a polymer matrix, which was mounted on the sample holder perpendicular to the X-ray beam. The rotation of the sample table was carried out to minimize the effect of the differences in texture at different shooting angles. An analysis of the structural characteristics and the phase composition was carried out using TOPAS v.5.0 software based on the Rietveld method.
The degree of crystallinity or structural ordering was determined by approximating the diffraction lines by the required number of pseudo-Voigt symmetric functions, and also by measuring the widths of the recorded lines at half their height (FWHM). The pseudo-Voigt functions were used to approximate the X-ray peak profile in the Diffractogram (1) [43,44]:
P V x , x 0 , η , b L , b G , A = A 1 η G x , x 0 , b G + η L x , x 0 , b L , G x , x 0 , b G = exp ( x x 0 ) 2 2 b G 2 , L x , x 0 , b L = 1 1 + x x 0 b L 2
where x is the variable corresponding to the angle of reflection 2θ; x0 sets the position of the maximum of the function; η is the specific fraction of the Lorentz function; A is the normalizing factor; bG and bL are the parameters of the Gauss functions G(x, x0, bG) and Lorentz L(x, x0, bL).
An analysis of the angular dependence of physical broadening allows one to evaluate the influences of factors, such as the size effect associated with crushing or recrystallization of crystallites as a result of external influences, and a distorting factor depending on the degree of deformation of the crystal structure and its change as a result of external influences. To assess an impact, the Williamson–Hall method was used, which is based on Equation (2) [45]:
β 2 = W s i z e 2 + W s t r a i n 2 , W s i z e 2 = λ D · cos ( θ ) 2 , W s t r a i n 2 = 4 · ε · tan ( θ ) 2
where β is physical broadening of the diffraction maximum, λ is the X-ray wavelength (1.54 Å), D is the crystallite size, θ is the Bragg diffraction angle and ε is the magnitude of microstresses in the grating.
Macrostrain was estimated based on an analysis of the displacement of diffraction peaks calculated according to Equation (3):
m a c r o s t r a i n = d i r r d p r i s t i n e d p r i s t i n e
where dpristine and dirr are the interplanar distances before and after irradiation.
The densities of the studied nanostructures were calculated using the Equation (4):
p 1.6602 A Z V 0
where V0 is the volume of the crystal cell, Z is the number of atoms in the crystal cell and A is the atomic weight of atoms.
The degree of disorder of the crystal lattice or the so-called integral porosity of the samples under study was found according to Equation (5):
P d i l = 1 p p 0 100 %
where p0 is the density of the reference sample.
Using the X-ray diffraction method, it was found that the obtained nanotubes were polycrystalline structures with the face-centered FeNi3 phase characteristic of permalloy compounds; the broadening and the distortion of diffraction lines indicate the presence of point defects in the structures of the nanotubes that appeared during the synthesis [46,47].
To reduce the structural imperfections, and the reorientation of crystallites, gamma radiation with energy of 1.35 MeV was obtained using an ELV-4 linear accelerator. The radiation doses were 100–500 kGy in increments of 100 kGy. The radiation dose was controlled by using film detectors that were placed near the samples and behind the film samples of the nanotubes in order to determine the dose accumulated during the irradiation. Placing film detectors in two places made it possible to compare the accumulated doses of both the nanostructures themselves and the detector without them. The measurement error of the dose was not more than 2–3%. The use of gamma rays with such energy in interaction with the electromagnetic fields of target atoms can lead to the formation of electron–positron pairs with subsequent transformation of the energy of gamma rays into the kinetic energy of the resulting particles. The formation of electron–positron pairs can lead to partial annealing of point defects, a change in the orientation of crystallites and a decrease in the degree of disordering of the structure of a nanotube.
Investigation of the resistance to degradation as a result of external influences was carried out by constructing kinetic curves of degradation reactions, followed by determining the rate of degradation in a PBS solution containing sodium chloride and hydrogen phosphate, chloride and potassium dihydrogen phosphate (used in most experiments to simulate a medium comparable in level of acidity to the internal environments of biological organisms). Stability tests were carried out in order to determine the rates of degradation and changes in structural characteristics during the interactions of solutions over a long period of time: from 1 to 20 days and at different temperatures: 25, 36 and 40 °C. The choices of temperature conditions and test environment were made taking into account the potential use of these nanostructures as the basis for targeted delivery of drugs.
The applicability of targeted modification of nanostructures by irradiation with gamma radiation in order to increase the rate of catalytic activity was evaluated using the reaction of the para-nitroaniline (PNA) reducing agent to para-phenyldiamine (PPD). The reaction was carried out by dispersing nanostructures (0.1 mg) in an aqueous solution of a mixture of PNA (10−4 M) and NaBH4 (6 × 10⁻² M). Evaluation of the catalytic reduction ability was carried out on a UV spectrometer at room temperature in the time range of 3–30 min in increments of 3 min. Based on the obtained UV spectra, the reaction rate constant was calculated [48]. Obtaining UV spectra and assessing changes in the catalytic activities of the studied structures were carried out by the in situ method. Samples in a volume of 10 μL were taken after 3 min of measurements and placed in a spectrometer to record UV spectra, based on which the reaction rate constant was calculated.

3. Results and Discussion

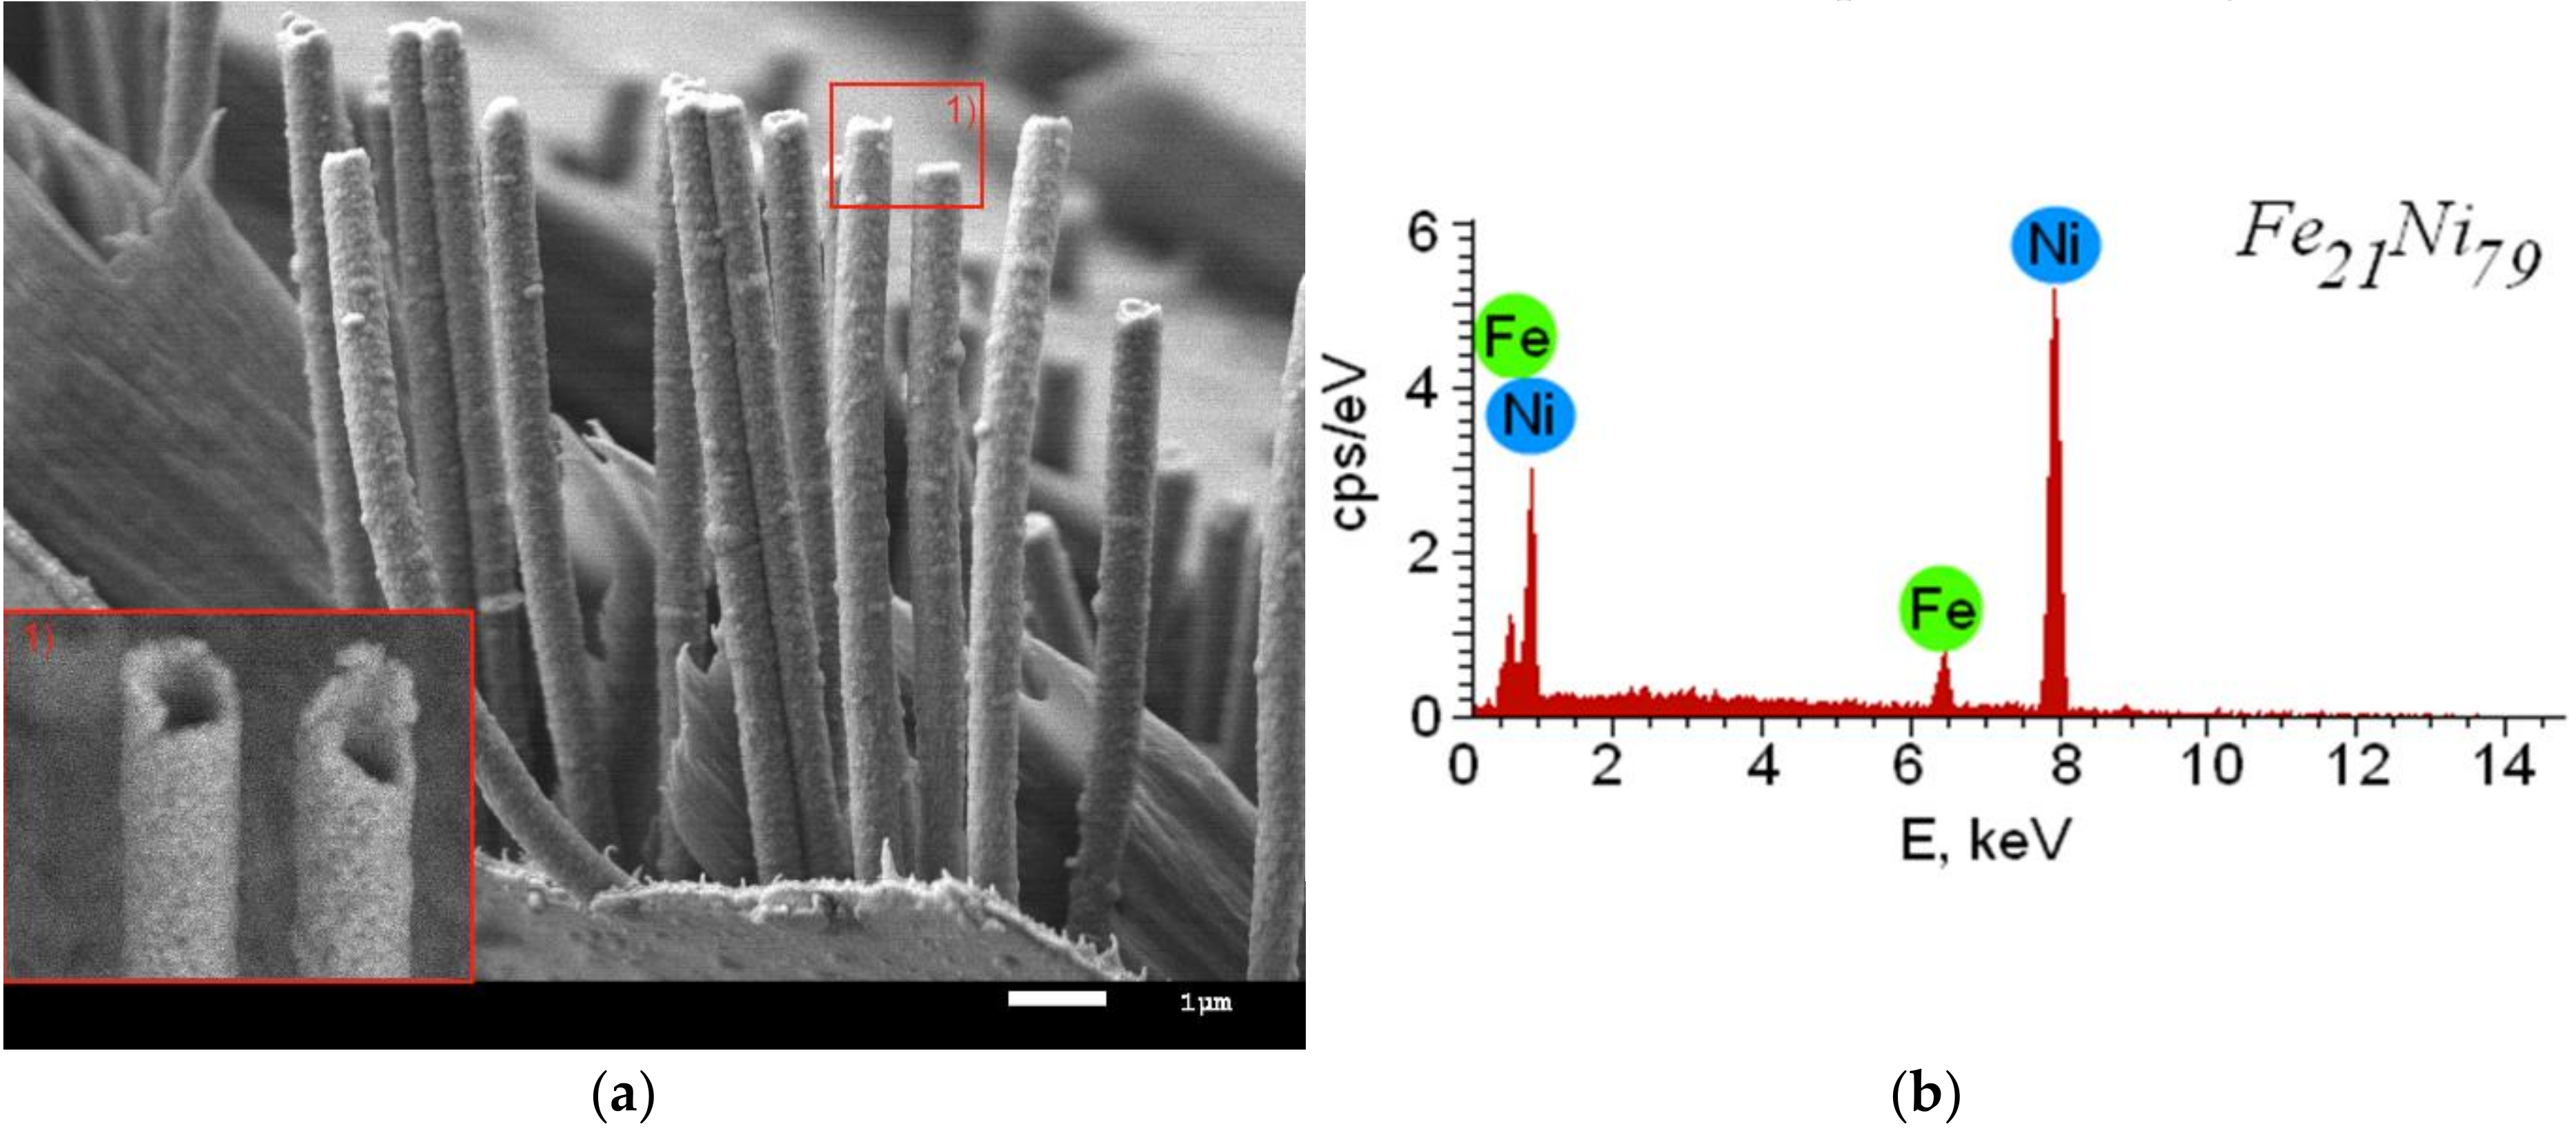
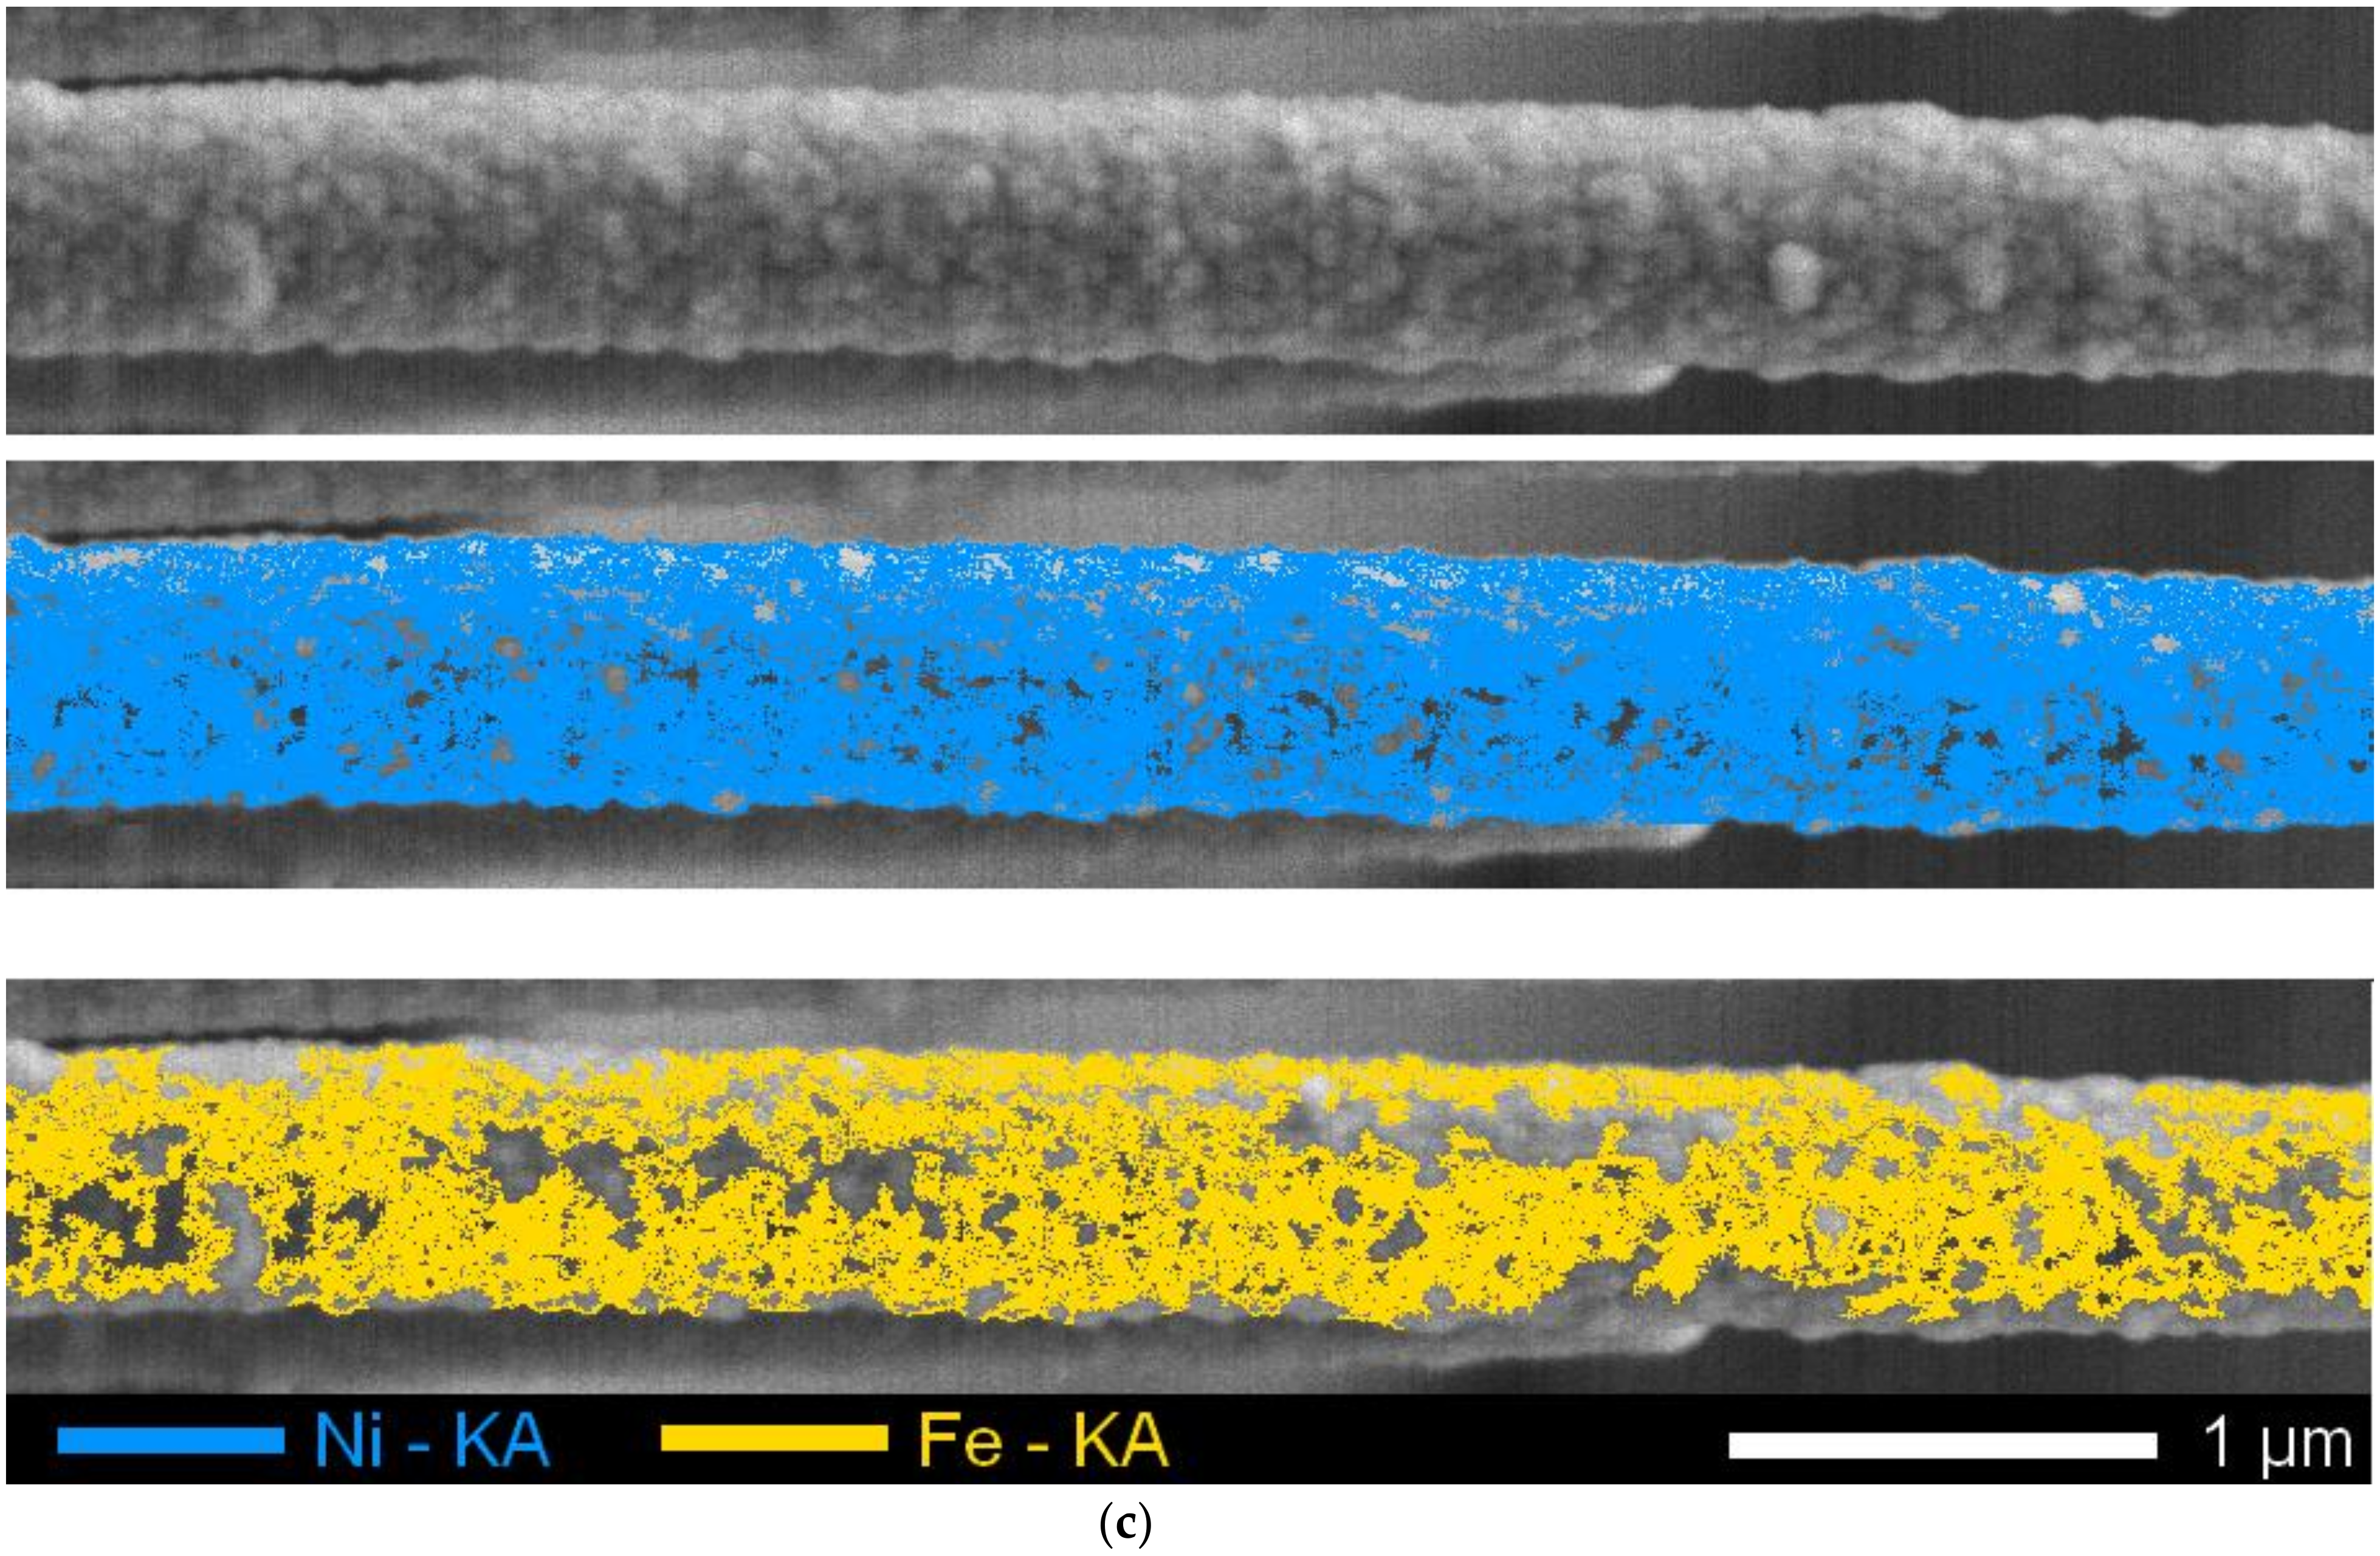
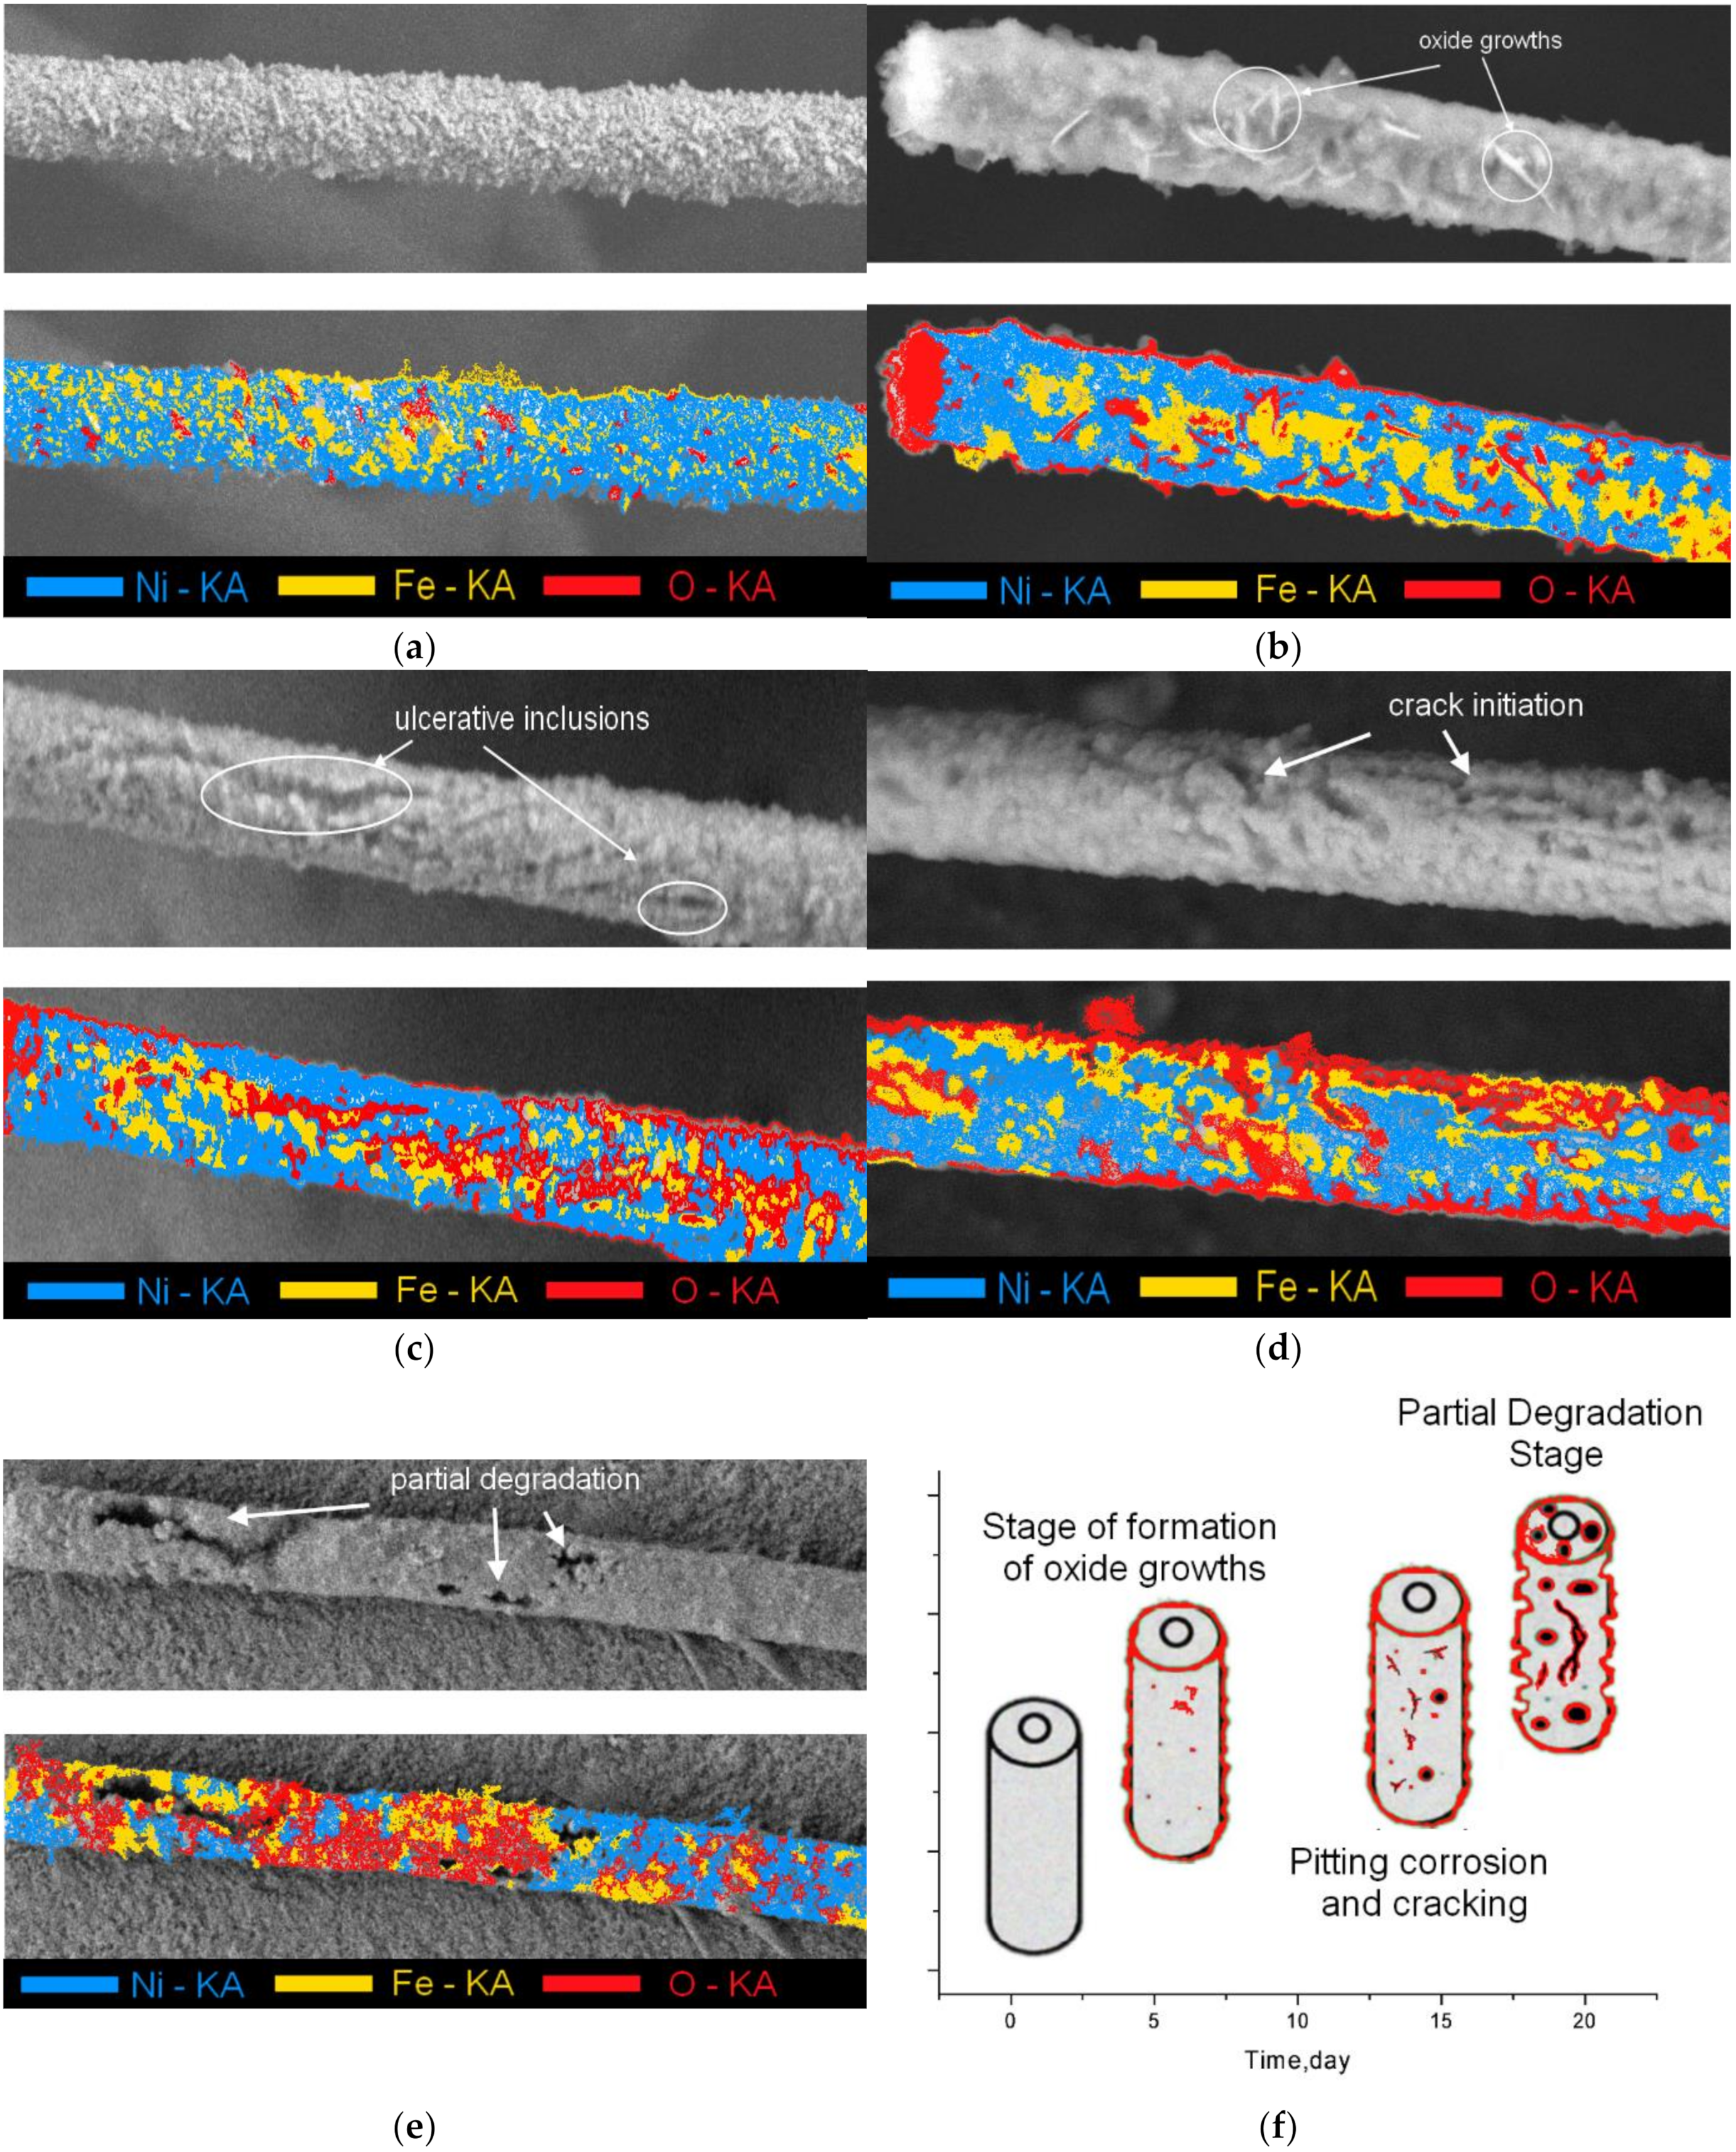
3.1. Study of Structural Changes Due to Irradiation

Figure 2 presents X-ray diffraction patterns of nanotubes before and after irradiation. It should be noted that X-ray diffraction of nanostructures was carried out in polymer matrices, in which the orientation of the nanostructures is preserved. As can be seen from the data presented for the initial nanostructures, broadening of diffraction peaks was observed, and two low-intensity peaks with Miller indices (200) and (220) are present, which indicates the presence of crystallites oriented in these directions in the structure. The asymmetric broadened shape of diffraction peaks for the initial nanotubes indicates the influence of both the size factor and the deformation factor on the change in structural properties [49,50].
For irradiated samples, a change in the intensities of diffraction maxima was observed with a complete dominance of the (111) diffraction maximum at an irradiation doses of 300 kGy and higher, while the intensity of diffraction maxima (200) and (220) for irradiated samples with a dose above 300 kGy is comparable with the background intensity radiation. Changes in the intensities of the diffraction peaks indicate a reorientation of the texture, and a change in the orientation of the crystallites. In this case, the absence of new diffraction maxima for the irradiated samples indicates the absence of processes associated with phase transformations or transitions under the action of irradiation. In contrast to electron exposure at high energies, which can lead to phase rearrangements of the crystal structure, gamma radiation affects the crystal structure only by completely absorbing energy with the formation of electron–positron pairs, the further migration of which leads to partial annihilation of point defects, which leads to ordering of the structure [51]. A decrease in the deformation of the crystal structure as a result of annealing of defects is evidenced by a change in the shape of diffraction maxima, and changes in the size and deformation contribute to a change in the shape of diffraction maxima. Figure 3a shows the dynamics of changes in the size of crystallites and micro-distortions depending on the radiation dose, according to which it is seen that, as a result of irradiation, the increase in crystallite sizes associated with reorientation and partial crystallization occurs only two times, while the change in the magnitude of micro-distortions associated with deformation of interplanar spacings and crystal lattice with an increase in fluence up to 500 kGy decreases by more than four times. This change indicates that upon the irradiation of nanostructures with gamma radiation, structural ordering occurs, associated with partial relaxation of distortions and strains of the crystal lattice. The structural ordering is also evidenced by an increase in the density of nanostructures and a decrease in the concentration of defects, the change of which is shown in Figure 3b.
It can be seen that an increase in the radiation dose from 100 to 400 kGy leads to a monotonic ordering of the structure and an increase in density, while an increase in the radiation dose to 500 kGy leads to a sharp increase in density by 1.2% and a decrease in the defect concentration by more than three times. A sharp decrease in the concentration of defects is due to an increase in the annihilation of point defects at high radiation doses. Table 1 presents the data on the changes in the main crystallographic parameters, the dynamics of which indicate the structural ordering and the positive effect of gamma radiation on the change in structural characteristics.
The change in the orientation of crystallites was evaluated by assessing the change in the intensity for diffraction reflections, and determining the texture coefficients, the values of which show a distinguished direction of orientation. In this case, the use of the rotation of the sample in measuring the diffraction pattern allows us to remove questions about the azimuthal variation of the intensity with respect to the position of the angle φ. In this shooting mode, the intensities of the diffraction peaks are isotropic relative to the position of the angle φ, but their ratio allows us to estimate the contribution to the preferred orientation of the crystallites.
Moreover, for irradiated samples, a decrease in the intensity of (200) and (220) diffraction reflections is observed while maintaining isotropy with respect to φ, which leads to a change in the values of texture coefficients, the values of which are presented in Table 2, reflecting the preferred orientation of crystallites in the structure of nanotubes. Texture coefficients were calculated using the Harris Formula (6):
T C h k l = I h k l I 0 h k l 1 n I h k l I 0 h k l
where I(hkl) is the experimentally obtained relative intensity; I0(hkl) is relative intensity corresponding to a given plane according to the PDF-2 database; n—the number of planes.

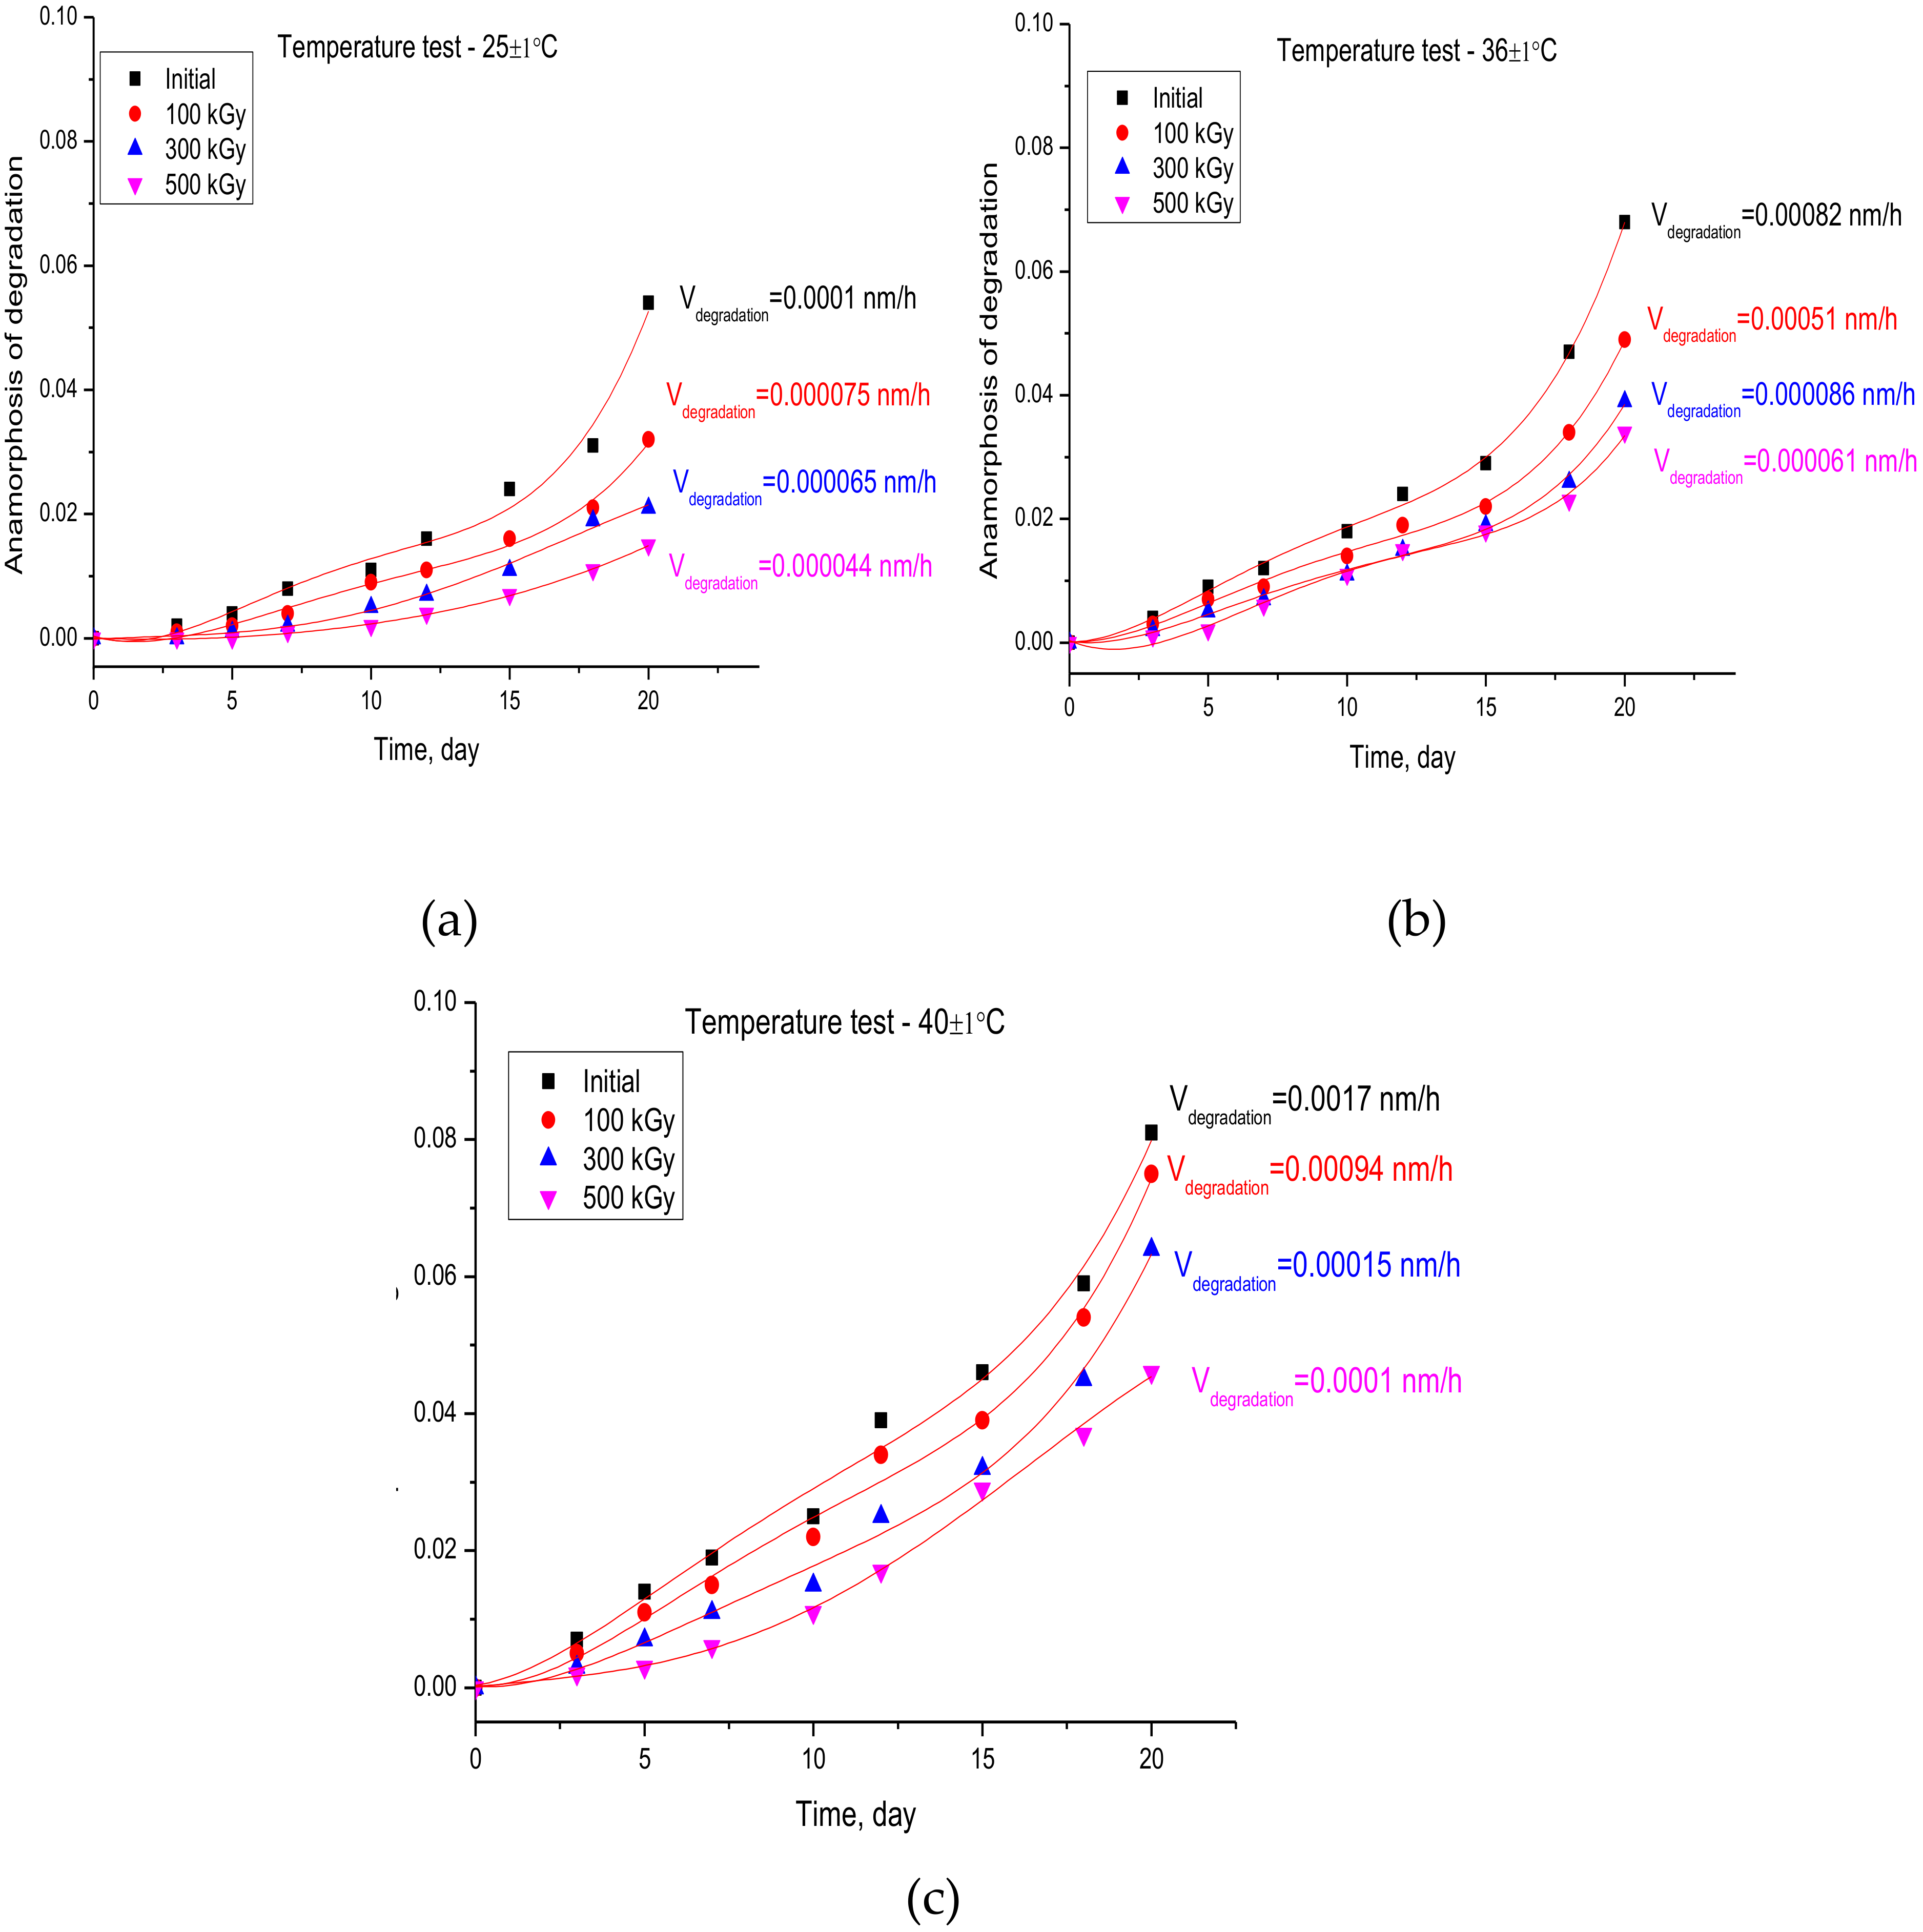
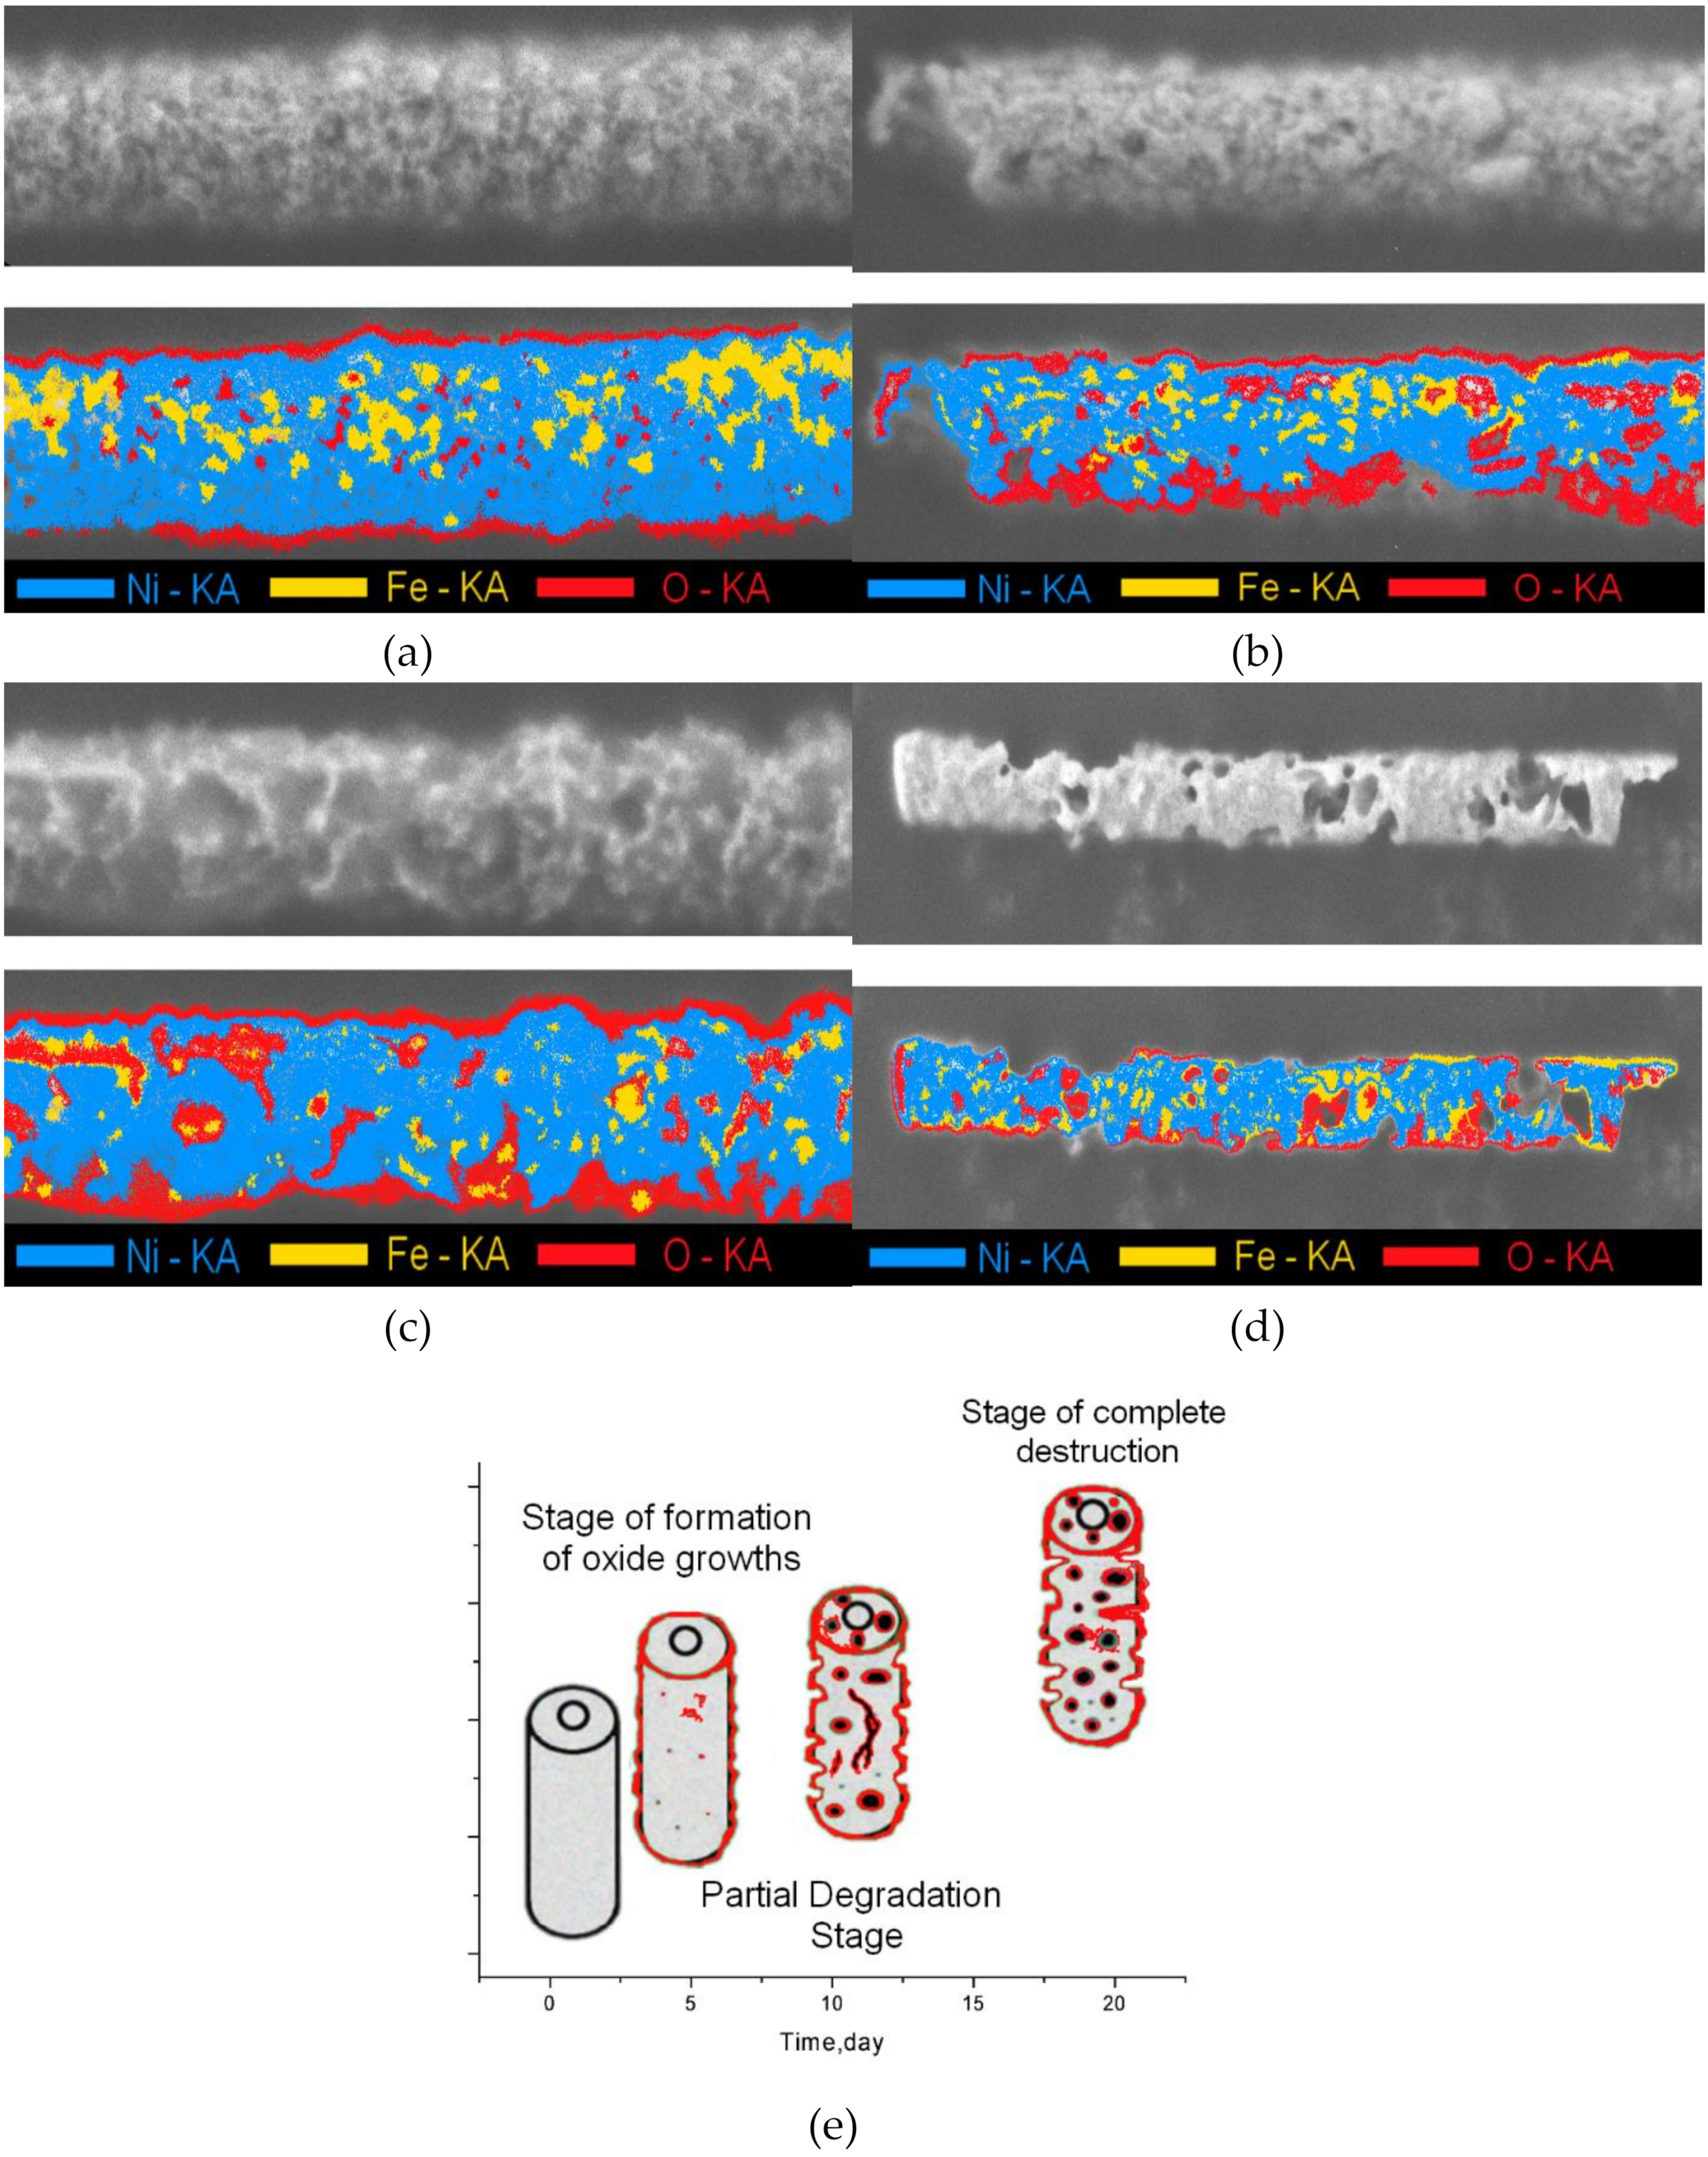
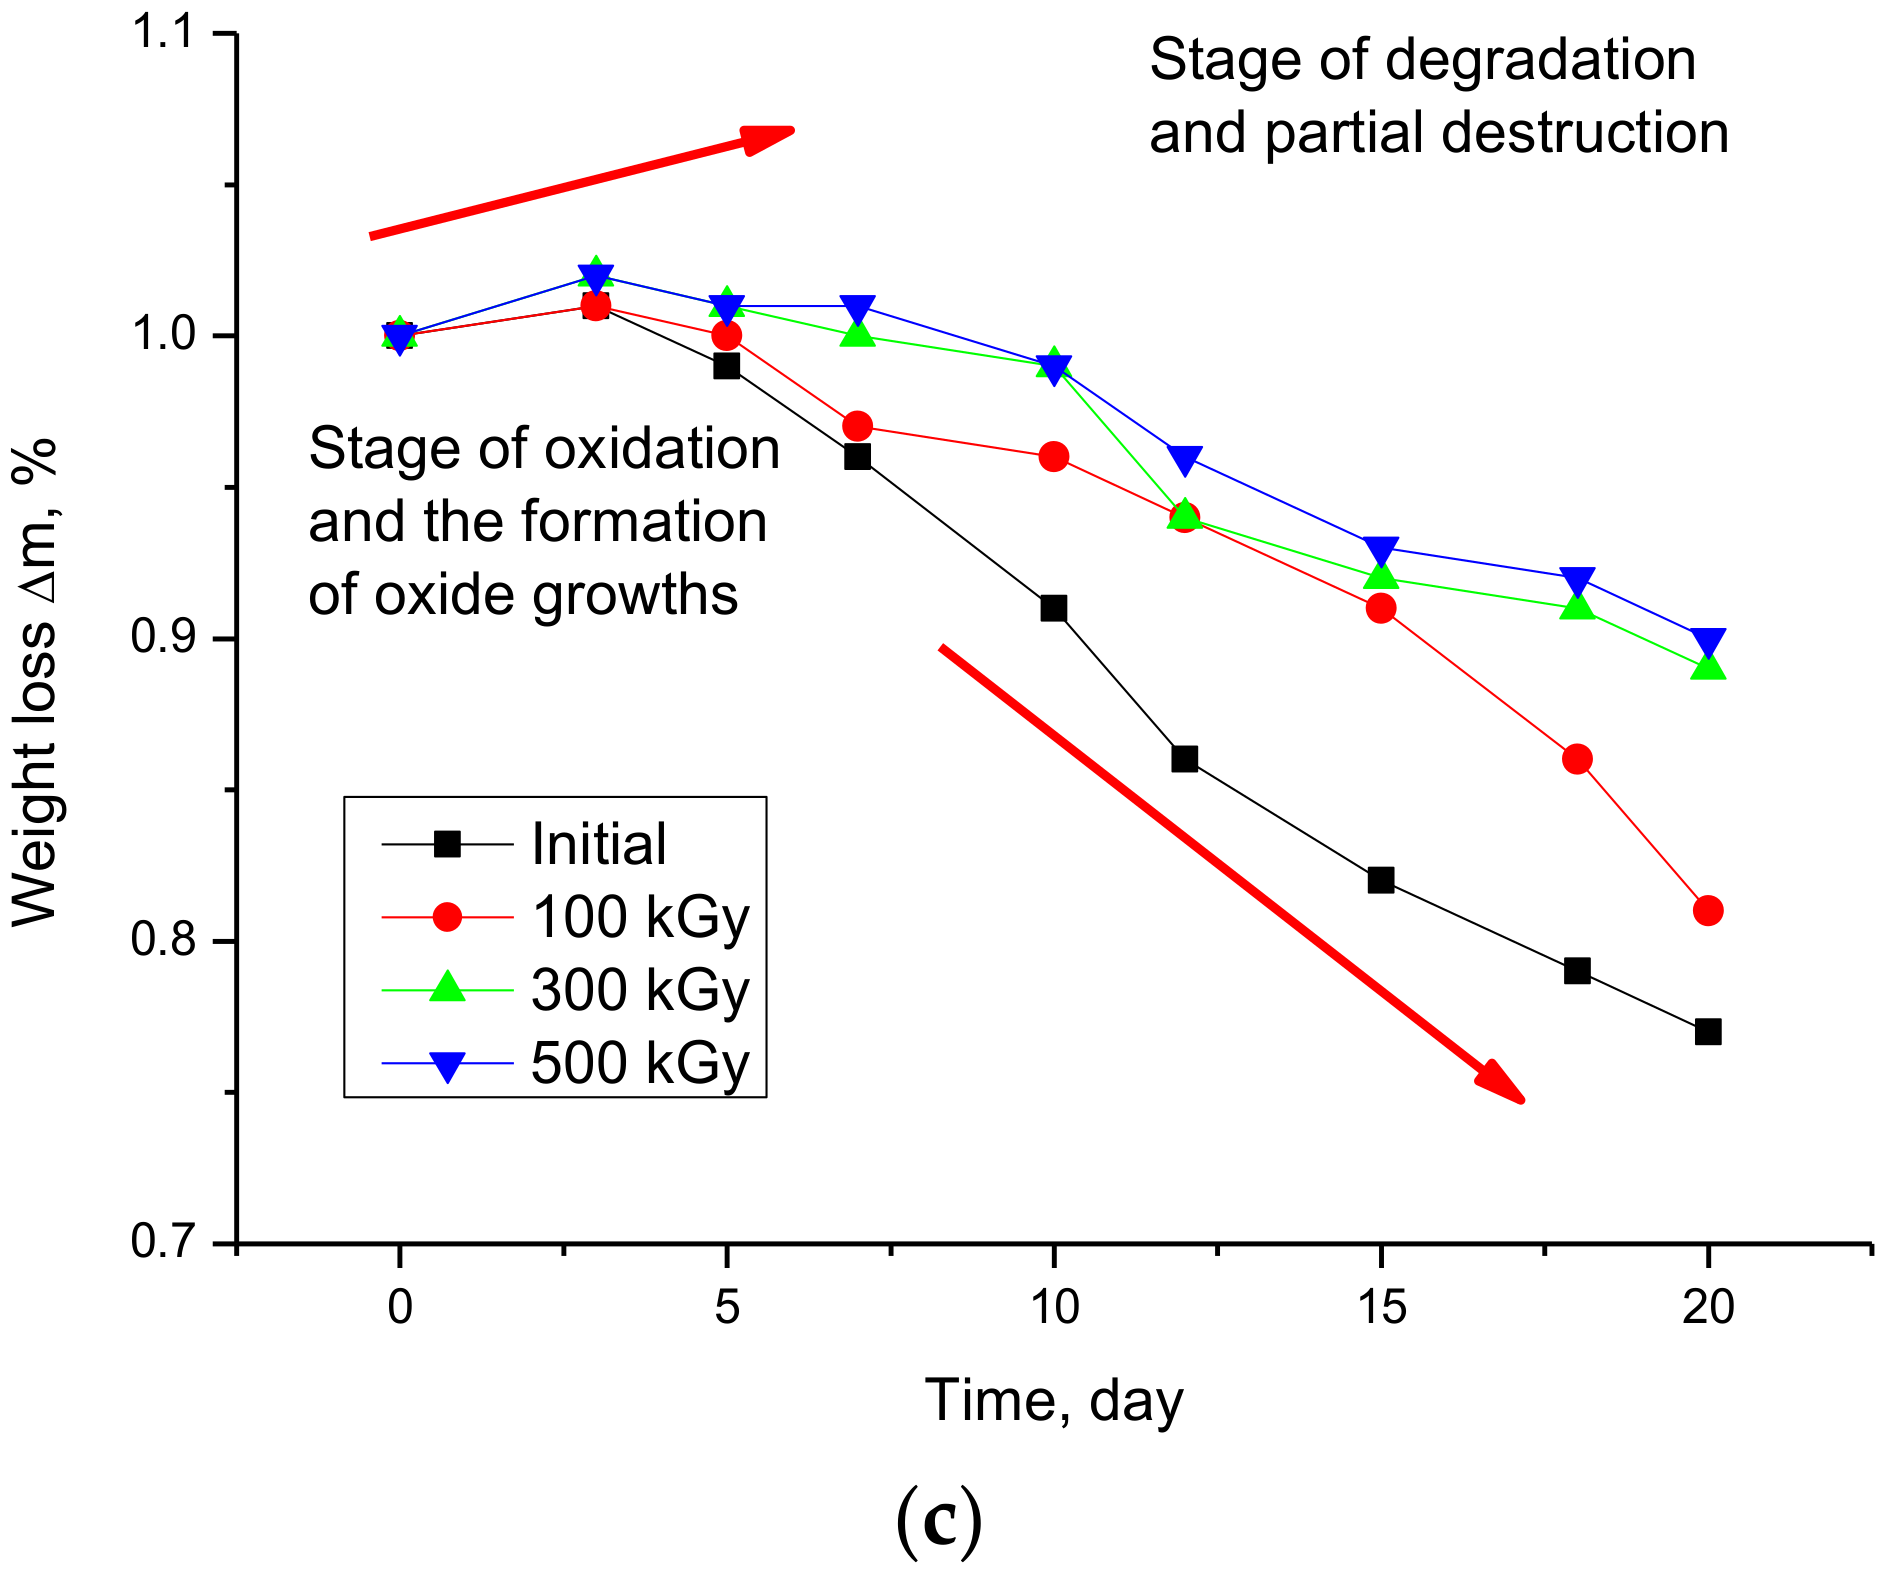
3.2. Studies of the Rate of Degradation of Nanostructures

One of the applications of directional modification is to increase the resistance of nanostructures to external influences, such as aggressive media, various acid or alkaline solutions and biological media with which nanostructures can come into contact during operation. Moreover, the rate of degradation and corrosion mechanisms can significantly reduce the life of a nanostructure in various industries. The most common promising application of iron-containing or permalloy nanostructures is targeted drug delivery [52,53]. This application idea is based on the use of nanostructures as a container for binding a drug on the surface of nanostructures and its further transportation in the body by varying the external magnetic field to control the trajectory of the nanostructures and collecting the drug by magnetostriction. Along those lines, permalloy structures with the most suitable structural and magnetic properties, along with oxide forms of iron, are considered as the most promising candidates for this industry [54,55]. At the same time, one of the most significant limitations on the applicability of nanostructures for this area is their resistance to the biological environment of the body in which they will be located during the delivery of drugs. In this connection, obtaining new data on the corrosion resistance of nanostructures in various media is very important for determining the time interval of applicability, and evaluating the decay products as a result of degradation. As a model medium that allows one to simulate with high accuracy the internal environment of a biological organism, as a rule, a PBS solution containing sodium chloride and sodium hydrogen phosphate, chloride and potassium dihydrogen phosphate and used in most experiments related to biological media is used [56,57]. Figure 4 shows the kinetic curves—degradation anamorphoses characterizing the corrosion rate of nanostructures in the medium. Kinetic curves are a collection of data on changes in the elemental composition and mass of samples during oxidation and degradation, obtained using methods of energy dispersive analysis, X-ray phase analysis and by weighing samples before and after corrosion tests. Stability tests were conducted to determine the rate of degradation over a long period of time from 1 to 20 days and at various temperatures of 25, 36 and 40 °C.
As can be seen from the data presented, an increase in the irradiation fluence leads to a decrease in the rate of degradation of nanostructures under various conditions of temperature tests. However, in the case of an increase in the temperature of the medium, an increase in the rate of degradation of nanostructures is observed, which is associated with an increase in the mobility of ions and cations of the medium and their large interaction with the outer surface of nanotubes. Moreover, an increase in test time leads to an uneven change in the anamorphosis curve of degradation, which indicates an increase in the degradation of nanostructures and a change in the nature of corrosion. Figure 5 and Figure 6 show SEM images of the initial and modified nanostructures after corrosion tests.
As can be seen in the presented SEM images, the degradation of nanostructures occurs in several stages. The first stage consists of the partial or complete oxidation of the surface layer of a nanostructure due to the introduction of oxygen ions at the grain boundaries. Moreover, for irradiated samples, which are characterized by a decrease in the concentration of defects and grain boundaries, the introduction of oxygen occurs pointwise, with the formation of a low concentration of regions containing oxygen. Typically, surface layer oxidation occurs on day 3–5 of testing. Moreover, for the irradiated samples, the further introduction of oxygen leads not only to passivation of the surface, butthe formation of oxide growths, which serve as a protective film and reduce the rate of degradation. The second stage of degradation is associated with the formation of large oxide inclusions containing a sufficiently large amount of embedded oxygen that can lead not only to the breaking of chemical and crystalline bonds, but also to the formation of oxide phases. The appearance of oxide phases, which are unstable compounds, leads to the formation of pitting corrosion and the appearance of ulcerative inclusions and microcracks in the structures of nanotubes. The further development of degradation for the initial and modified nanostructures is somewhat different and has different time frames.
For the initial nanostructures, the appearance of microcracks and ulcerative inclusions leads to a sharp deterioration in structural characteristics, and the formation of a large number of unstable oxide inclusions, which lead to partial or complete destruction of the crystal structure of nanotubes and their degradation by days 17–20. The presence of oxide growths, and a smaller number of grain boundaries, which are not only sinks of defects, but also centers through which oxygen ions penetrate into the structure of nanotubes, leads to a decrease in the rate of degradation and less damage to the structures of nanotubes. Moreover, according to the data obtained, for irradiated nanostructures on days 17–20, the degradation processes are limited to the onset of nucleation of amorphous inclusions and partial degradation of the surface layer, while for the initial nanostructures in this time period, complete destruction of the structure due to the formation of a large number of ulcerative inclusions and defective areas is observed.
Figure 7 shows the results of changes in mass loss during degradation. According to the data obtained, the change in mass occurs in two stages. The first stage is described by a positive weight gain, which is due to the formation of an oxide film on the surface of the nanotubes. In this case, an increase in the radiation dose, and consequently, a change in the structural characteristics of nanotubes leads to an increase in the number of days at which a positive change in mass is observed, which indicates that the formed oxide film reduces the rate of degradation of nanotubes. The second stage of the change is characteristic of a negative weight gain, which is caused by the processes of degradation and partial destruction of the structure of nanotubes with the dissolution of oxide inclusions and the formation of ulcerative pores. It should be noted that an increase in the test temperature leads to a sharper drop in the mass loss coefficient, which indicates an increase in the corrosion rate of nanotubes.
According to the data of X-ray phase analysis, the degradation processes are associated with the formation of oxide and hydroxide phases in the structures of nanotubes, the presence of which leads not only to a deterioration in structural characteristics, but also with an increase in the test time to partial amorphization and degradation of nanotubes. Figure 8 presents data on changes in the concentration of impurity oxide inclusions in the structure of nanotubes.
As is known, the degradation of iron-containing nanostructures occurs by the following mechanisms:
Fe(s) +1/2 O2(g) → FeO(s)
Fe(s) + 2H2O + O2 → 2Fe(OH)2(s)
Fe(s)+2H+ → Fe2+(I)+H2(g)
Degradation by nickel oxidation occurs as a result of the loss of electrons in the interaction with the medium and the transition to nickel (II) oxide:
Ni0 − 2e = Ni2+.
The nickel (II) oxide formed refers to bertollides with oxygen stoichiometry. With a large amount of oxygen in the structure, it transforms into nickel (III) oxide Ni2O3·H2O or NiOOH. In this case, nickel ions are completely oxidized:
Ni2+ − 1e = Ni3+.
But since the oxidation state of +3 is not characteristic of nickel, compounds with this valence are unstable; therefore, hydrated forms of nickel (II) oxide fall apart with the elimination of oxygen, which leads to the destruction of crystalline and chemical bonds.
Thus, in the course of corrosion tests, the prospects of using gamma radiation to reduce the rate of degradation of nanostructures in biological media at different ambient temperatures were established.

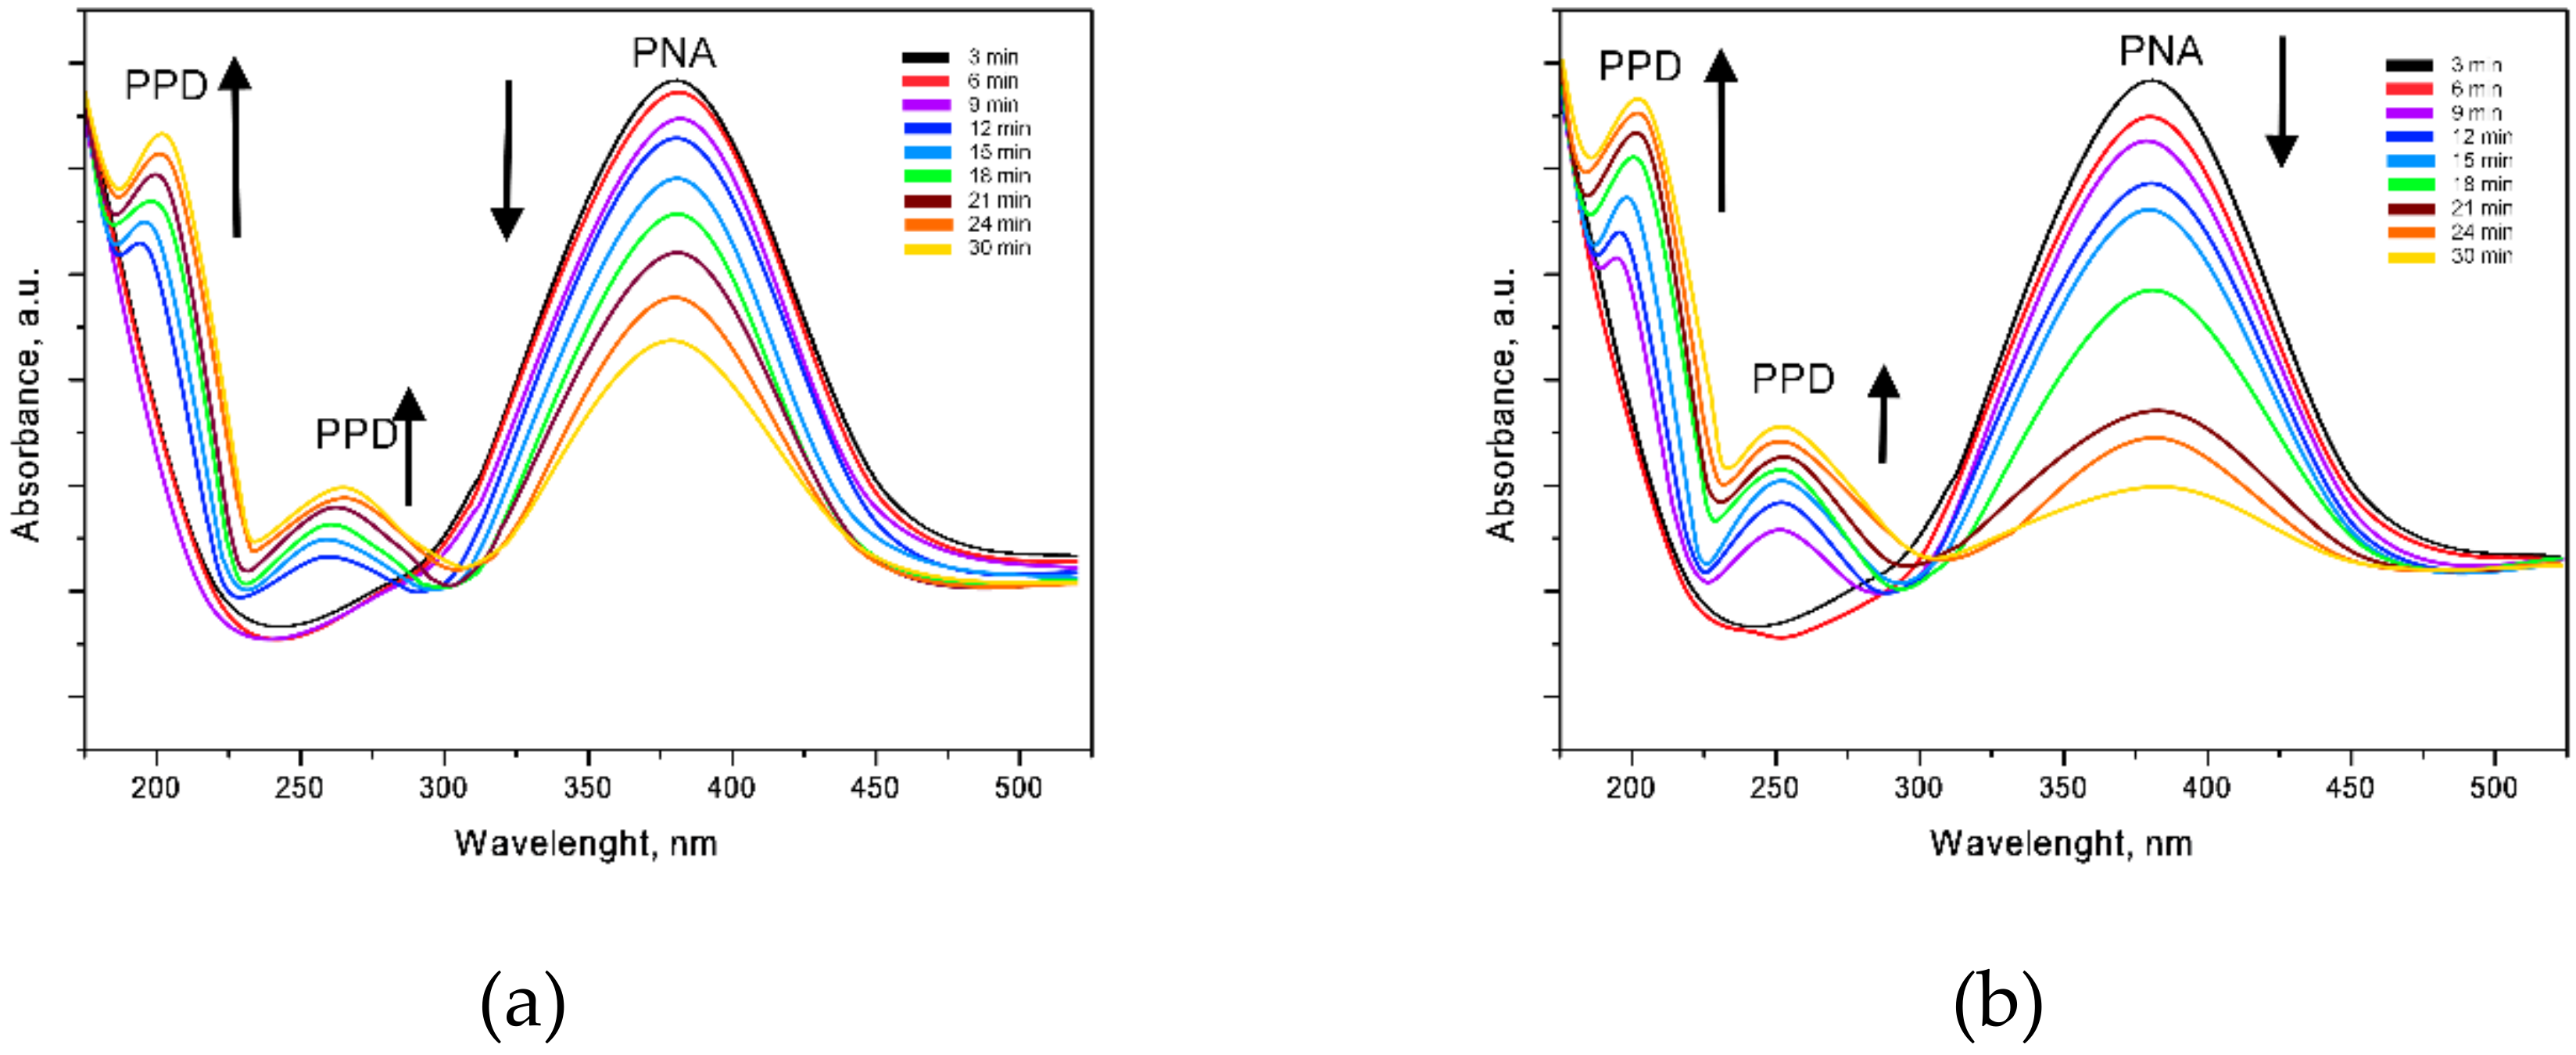
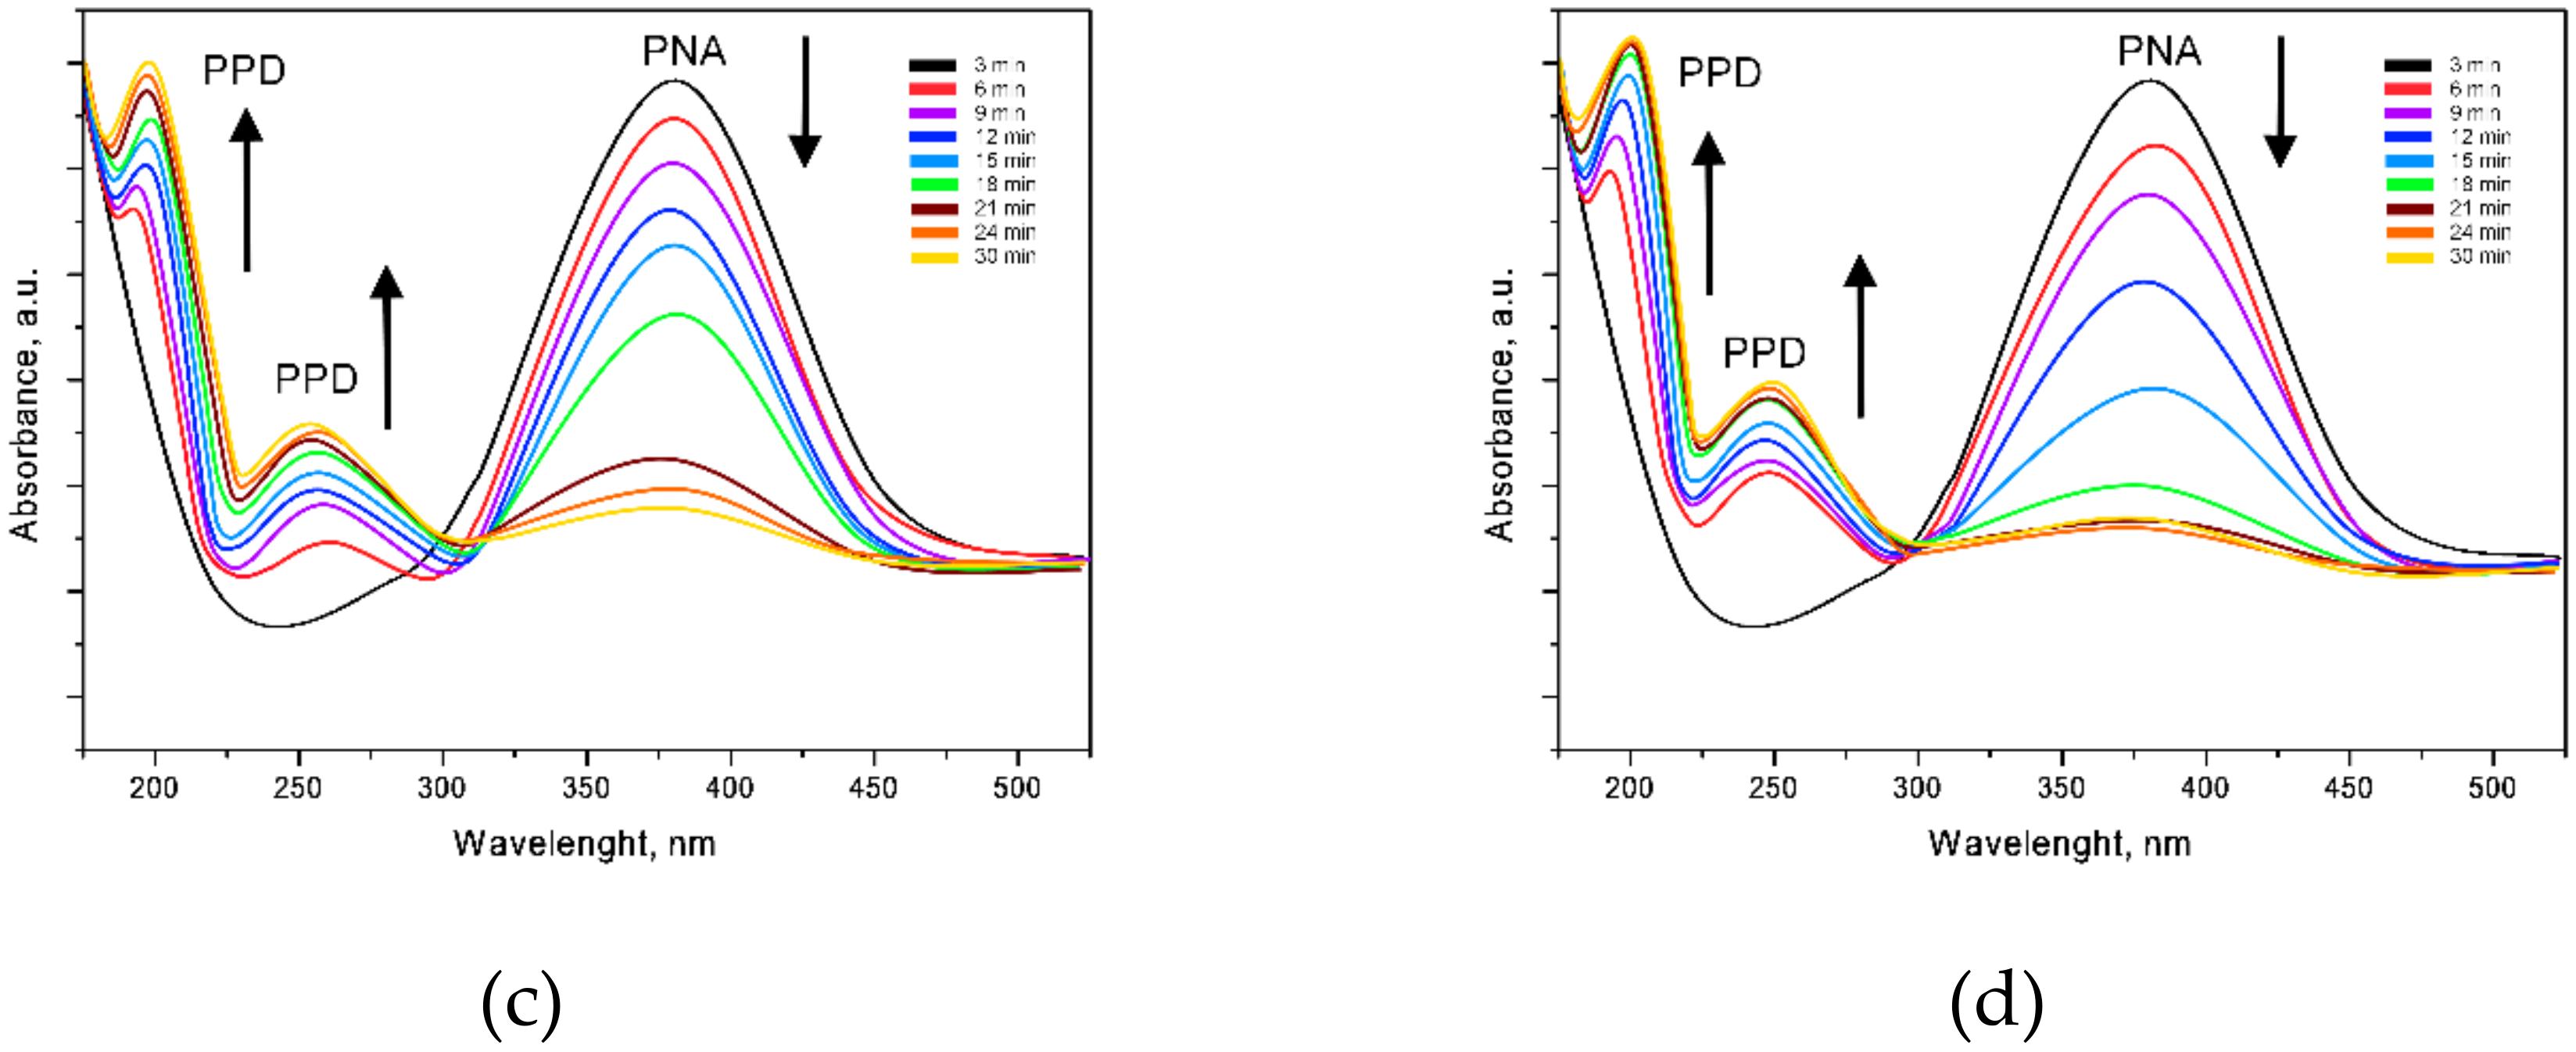
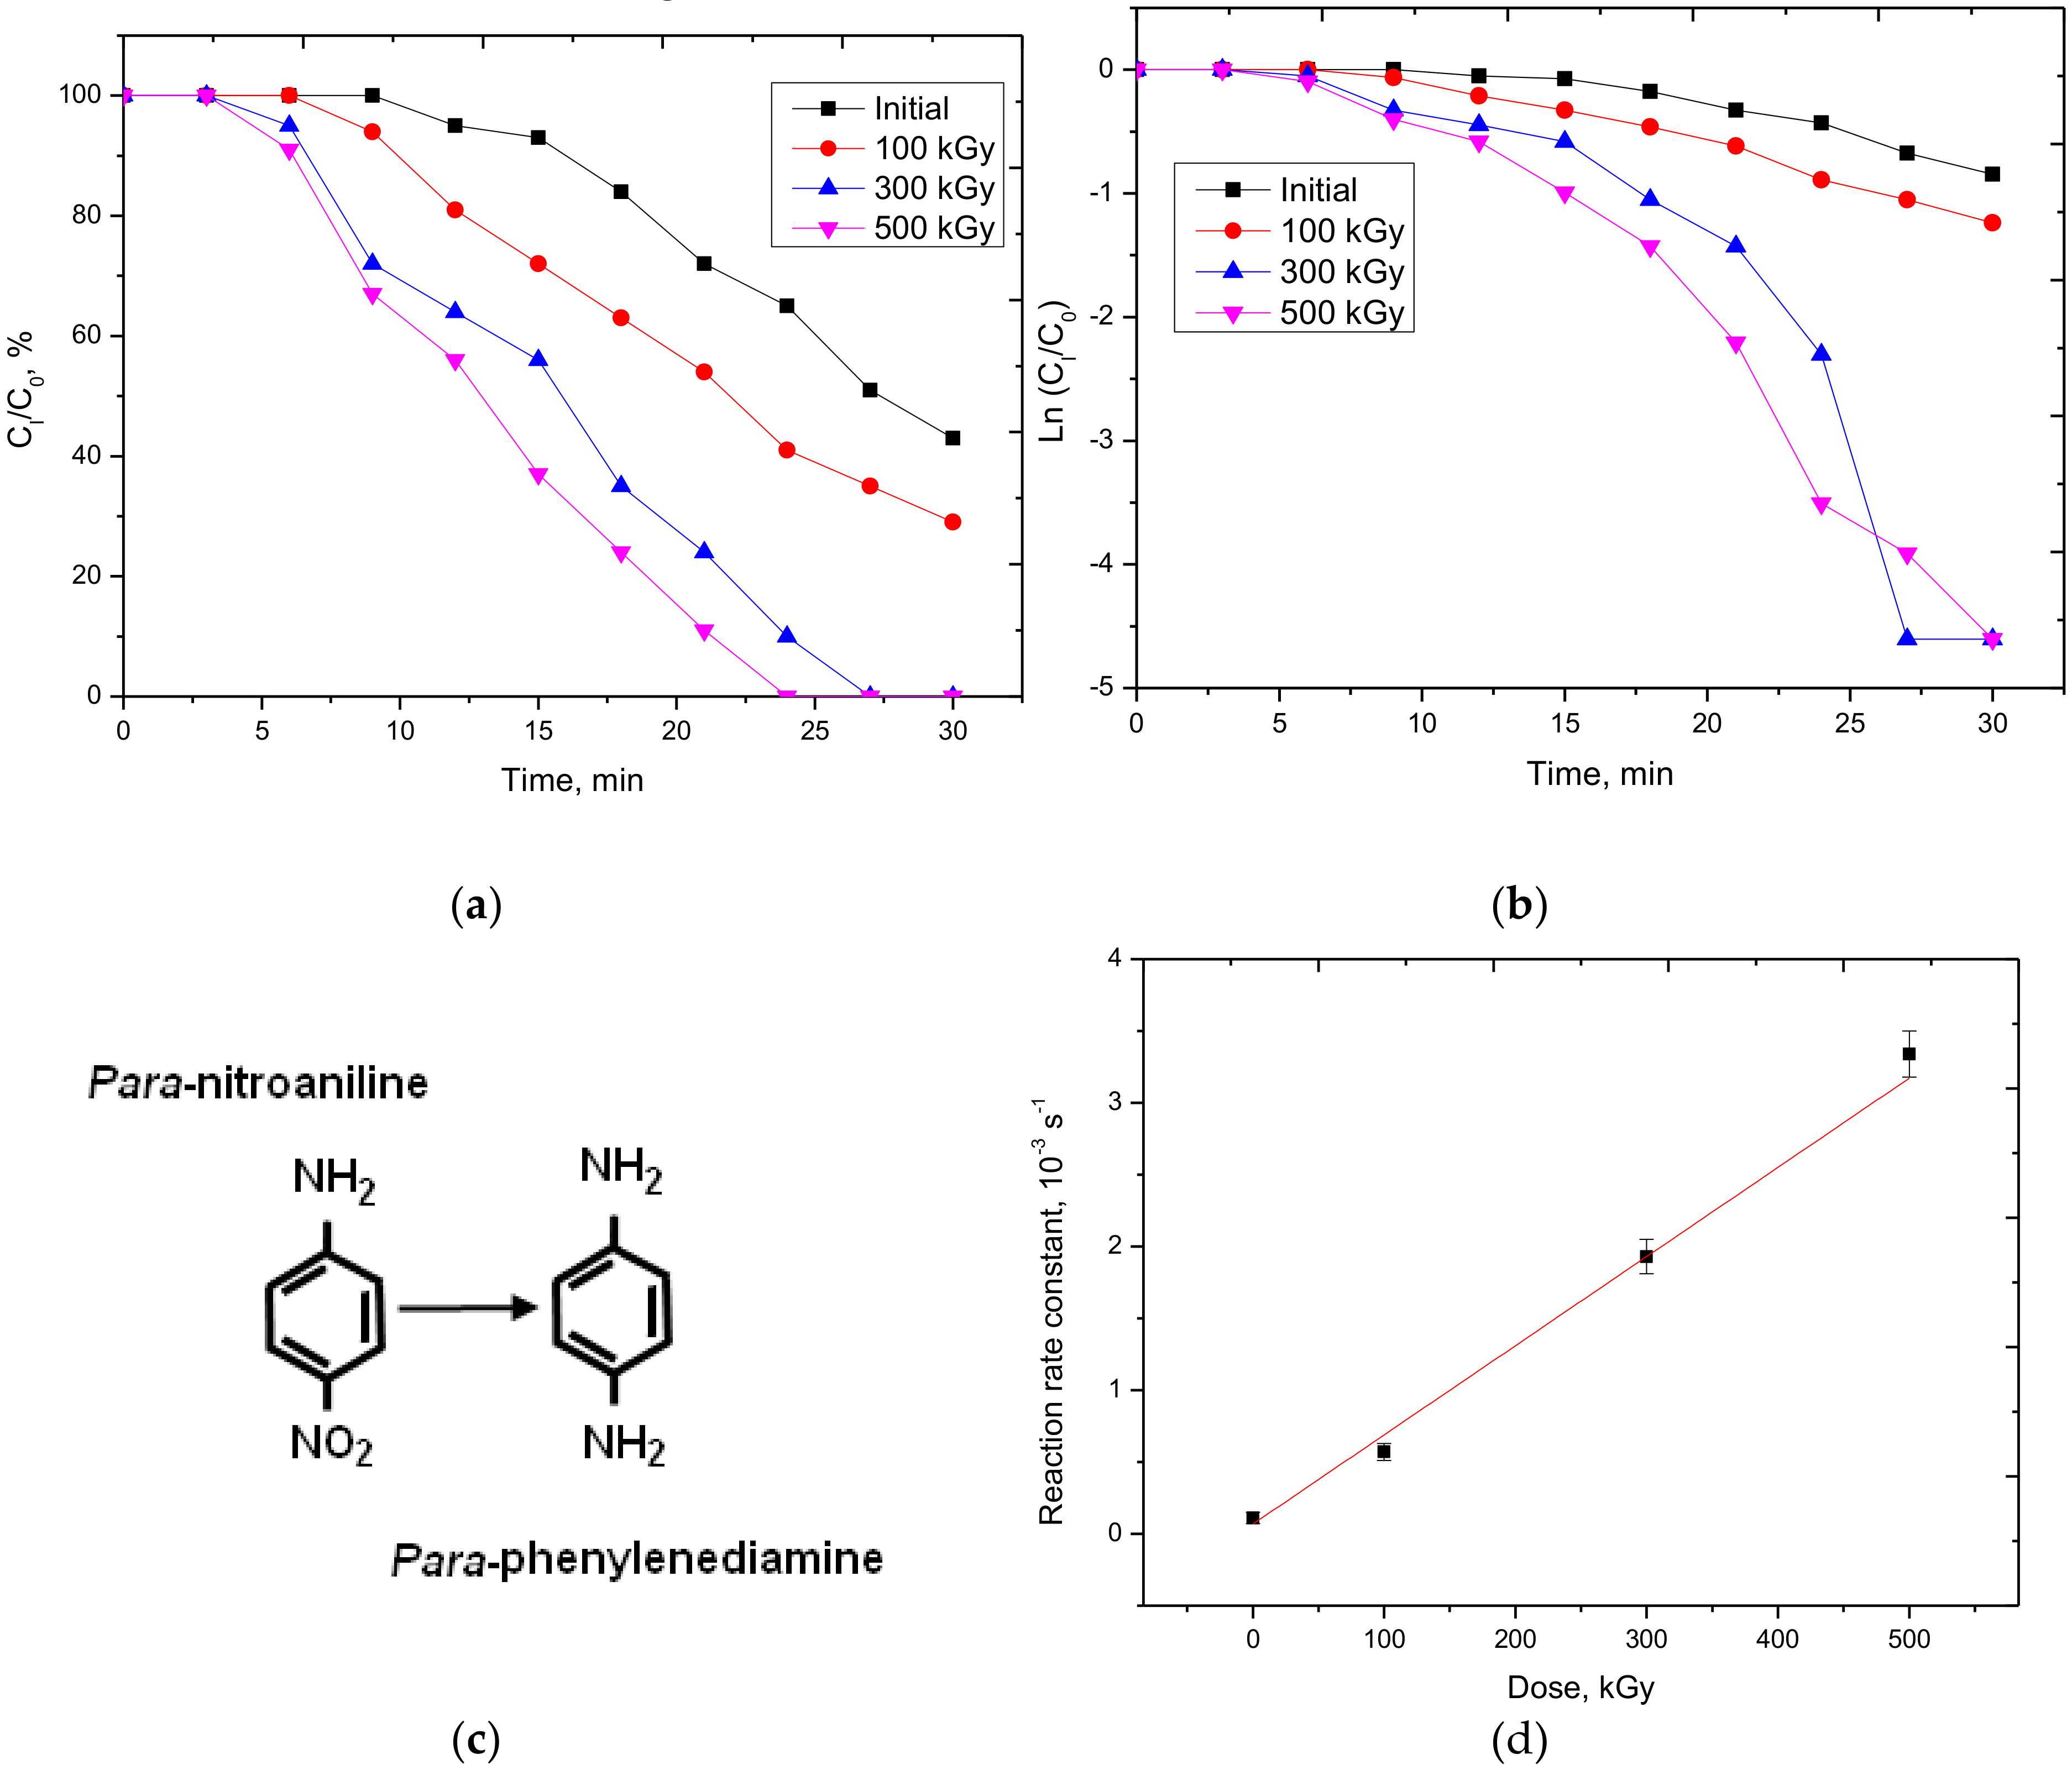
3.3. Study of the Catalytic Activity of Nanostructures

The most promising field of application for permalloy nanostructures is their use as various catalysts and reducing agents. Moreover, the small size and the large area of the active surface, significantly increase the rate of reduction reactions and reduce the energy consumption for the preparation and use of catalysts. In recent decades, one of the important problems in catalysis has been the processing of nitro aromatic compounds, which is associated with their reduction to simple amines with subsequent disposal. One of the most common processing methods is the reduction reaction of para-nitroaniline to para-phenylenediamine (PNA–PPD), which allows a sufficiently large number of simple amines to be obtained for subsequent disposal. Figure 9 shows the UV absorption spectra of the PNA–PPD reduction reaction for nanostructures before and after modification. Initial nanostructures and those irradiated with respective doses of 100, 300 or 500 kGy, which were characterized by the most pronounced structural changes, were taken as test samples.
According to published data, PNA and PPD compounds in aqueous solutions can exist in the form of nitro groups, with absorption maxima of 380 nm for PNA and 270–300 nm and 220–240 nm for PPD. Figure 10a,b show the dynamics of changes in the intensity of spectral maxima characteristic of PNA and PPD compounds. As can be seen from the data presented, complete recovery is observed only for modified samples with doses of 300 and 500 kGy, while for unirradiated samples and those irradiated with a dose of 100 kGy, the recovery reaction does not end in the time allotted for testing.
As can be seen from the data presented, for the initial nanostructures, a partial restoration of the PNA–PPD reaction is observed over the entire cycle time (see the diagram in Figure 10c), which indicates a low rate of catalytic activity. In contrast to the initial nanostructures, the modified nanostructures show a complete recovery of the PNA–PPD reaction, as evidenced by an increase in the reduction rate (see the data in Figure 10d). The value of the reaction rate constant was calculated on the basis of data on the changes in the concentration of PNA and PPD compounds, which were estimated from the intensity values of the corresponding peaks in the spectra. As a result of the studies, it was found that an increase in the degree of ordering of the crystal structure, and a decrease in defective inclusions, leads to a sharp increase in the productivity of nanostructures for the PNA–PPD reduction reaction, which indicates the promise of using gamma radiation to not only increase corrosion resistance, but also the catalytic activities of nanostructures.

4. Conclusions

The paper presents the results of changes in the structural characteristics, and the degree of texturing of FeNi nanostructures close in composition to permalloy compounds as a result of directed modification by gamma radiation with an energy of 1.35 MeV and doses from 100 to 500 kGy. The choices of energy and radiation doses were due to the need to modify the structural properties of the point defects that are annealed during the synthesis along the entire length of the nanotubes. The initial FeNi nanostructures were polycrystalline nanotubes of anisotropic crystallite orientation, obtained by electrochemical deposition. The study found that exposure to gamma rays leads to fewer defects in the structure and reorientation of crystallites, and at doses above 300 kGy, the presence of one selected texture direction (111) in the structure. In the course of corrosion tests, the prospects of using gamma radiation to reduce the rate of degradation of nanostructures in biological media at various ambient temperatures were established. It was found that the degradation of nanostructures was accompanied at the first stage of testing by the formation of oxide inclusions, which subsequently led to the formation of pitting corrosion and the subsequent partial or complete destruction of the nanostructures. The prospects of using gamma radiation not only for directed modification of nanostructures and increasing the resistance to degradation, but also increasing the rate of catalytic reactions of the PNA-PPD type, are shown.

Author Contributions

Conceptualization, M.V.Z., D.B.B. and A.L.K.; methodology, D.I.S. and A.L.K.; formal analysis, M.V.Z.; investigation, A.L.K. and M.V.Z.; resources, M.V.Z.; writing—original draft preparation, review and editing, M.V.Z., D.I.S., D.B.B. and A.L.K.; visualization, M.V.Z.; supervision, M.V.Z. All authors have read and agree to the published version of the manuscript.

Funding

This study was funded by the Ministry of Education and Science of the Republic of Kazakhstan (grant AP05133578).

Conflicts of Interest

The authors declare no conflict of interest.

References

  1. Grozdanov, A.; Paunovic, P.; Vasilevska-Nikodinovska, V.; Dimitrov, A.; Yukhymchuk, V.; Stojkovski, I.; Arsova, Z. Structural analysis of X-ray irradiated carbon nanostructures. Mater. Sci. Eng. 2019, 3, 141–145. [Google Scholar] [CrossRef] [Green Version]
  2. Miller, K.J.; Sofman, M.; McNerny, K.; McHenry, M.E. Metastable γ-FeNi nanostructures with tunable Curie temperature. J. Appl. Phys. 2010, 107, 09A305. [Google Scholar] [CrossRef] [Green Version]
  3. Shumskaya, A.; Bundyukova, V.; Kozlovskiy, A.; Zdorovets, M.; Kadyrzhanov, K.; Kalkabay, G.; Kaniukov, E. Evolution of morphology, structure, and magnetic parameters of Ni nanotubes with growth in pores of a PET template. J. Magn. Magn. Mater. 2020, 497, 165913. [Google Scholar] [CrossRef]
  4. El-Said, A.; Wilhelm, R.; Heller, R.; Facsko, S. Creation of surface nanostructures in lanthanum fluoride single crystals by irradiation with slow highly charged ions. Nucl. Instrum. Methods Phys. Res. Sect. B Beam Interact. Mater. Atoms 2019, 460, 137–140. [Google Scholar] [CrossRef]
  5. Gong, M.; Ren, S. Phase transformation-driven surface reconstruction of FeNi nanostructures. Chem. Mater. 2015, 27, 7795–7800. [Google Scholar] [CrossRef]
  6. Volchkov, S.; Fernandez, E.; Arribas, A.G.; Barandiaran, J.M.; Lepalovskij, V.N.; Kurlyandskaya, G.V. Magnetic properties and giant magnetoimpedance of FeNi-based nanostructured multilayers with variable thickness of the central Cu lead. IEEE Trans. Magn. 2011, 47, 3328–3331. [Google Scholar] [CrossRef]
  7. Kholmanov, I.N.; Barborini, E.; Vinati, S.; Piseri, P.; Podesta’, A.; Ducati, C.; Lenardi, C.; Milani, P. The influence of the precursor clusters on the structural and morphological evolution of nanostructured TiO2 under thermal annealing. Nanotechnology 2003, 14, 1168. [Google Scholar] [CrossRef]
  8. Kozlovskiy, A.; Shlimas, D.; Kenzhina, I.; Zdorovets, M. The influence of thermal annealing on structural properties of Ni nanotubes. Vacuum 2018, 153, 254–261. [Google Scholar] [CrossRef]
  9. Zdorovets, M.; Kozlovskiy, A. Study of phase transformations in Co/CoCo2O4 nanowires. J. Alloy. Compd. 2020, 815, 152450. [Google Scholar] [CrossRef]
  10. Kang, M.; Goldman, R.S. Ion irradiation of III–V semiconductor surfaces: From self-assembled nanostructures to plasmonic crystals. Appl. Phys. Rev. 2019, 6, 041307. [Google Scholar] [CrossRef]
  11. Ramírez-Bon, R.; Espinoza-Beltrán, F.J.; Arizpe-Chávez, H.; Zelaya-Angel, O.; Sánchez-Sinencio, F. CdTe nanostructures prepared by thermal annealing. J. Appl. Phys. 1995, 77, 5461–5463. [Google Scholar]
  12. Zdorovets, M.V.; Kozlovskiy, A. Investigation of phase transformations and corrosion resistance in Co/CoCo2O4 nanowires and their potential use as a basis for lithium-ion batteries. Sci. Rep. 2019, 9, 16646. [Google Scholar] [CrossRef] [PubMed] [Green Version]
  13. Narayanasamy, A.; Sivakumar, N. Influence of mechanical milling and thermal annealing on electrical and magnetic properties of nanostructured Ni-Zn and cobalt ferrites. Bull. Mater. Sci. 2008, 31, 373–380. [Google Scholar] [CrossRef]
  14. Sarychev, V.; Nevskii, S.; Konovalov, S.; Granovskii, A.; Gromov, V. Thermocapillary model of formation of nanostructures on the surface irradiated by low-energy high-current electron beams. Mater. Res. Express 2019, 6, 076551. [Google Scholar] [CrossRef]
  15. El-Ghandour, A.; Awed, A.; Maksoud, M.I.A.A.; Nasher, M. 1, 2-Dihydroxyanthraquinone: Synthesis, and induced changes in the structural and optical properties of the nanostructured thin films due to γ-irradiation. Spectrochim. Acta Part A Mol. Biomol. Spectrosc. 2019, 206, 466–473. [Google Scholar] [CrossRef] [PubMed]
  16. Lemos, P.S.; Silva, G.S.; Roca, R.A.; Assis, M.; Torres-Mendieta, R.O.; Beltran-Mir, H.; Minguez-Vega, G.; Cordoncillo, E.; Andres, J.; Longo, E. Laser and electron beam-induced formation of Ag/Cr structures on Ag2CrO4. Phys. Chem. Chem. Phys. 2019, 21, 6101–6111. [Google Scholar]
  17. Antony, A.; Poornesh, P.; Kityk, I.; Myronchuk, G.; Sanjeev, G.; Petwal, V.C.; Verma, V.P.; Dwivedi, J. A study of 8 MeV e-beam on localized defect states in ZnO nanostructures and its role on photoluminescence and third harmonic generation. J. Lumin. 2019, 207, 321–332. [Google Scholar] [CrossRef]
  18. Kadyrzhanov, D.B.; Zdorovets, M.; Kozlovskiy, A.; E Kenzhina, I.; Petrov, A.V. Modification of structural and conductive properties of Zn nanotubes by irradiation with electrons with an energy of 5 MeV. Mater. Res. Express 2017, 4, 125023. [Google Scholar] [CrossRef]
  19. Ghorab, F.; Es’Haghi, Z.; Sheikh, N.; Akhavan, A. Gamma Irradiation Surface Modified Polypropylene-Based Hollow Fiber with Silver Nanoparticles and Its Impact on the Properties of Treated Membrane. Plasmonics 2019, 14, 1253–1260. [Google Scholar] [CrossRef]
  20. Sen, S.K.; Noor, M.; Al Mamun, M.A.; Manir, M.S.; Matin, M.A.; Hakim, M.A.; Nur, S.; Dutta, S. An investigation of 60Co gamma radiation-induced effects on the properties of nanostructured α-MoO3 for the application in optoelectronic and photonic devices. Opt. Quantum Electron. 2019, 51, 82. [Google Scholar] [CrossRef]
  21. Shumskaya, A.; Kaniukov, E.; Kutuzau, M.; Bundyukova, V.; Tulebayeva, D.; Kozlovskiy, A.; Borgekov, D.; Kenzhina, I.; Zdorovets, M. Influence of media with different acidity on structure of FeNi nanotubes. EPJ Web of Conferences. In EPJ Web of Conferences; EDP Sciences: Les Ulis, France, 2018; Volume 177, p. 01003. [Google Scholar]
  22. Kozlovskiy, A.; Kenzhina, I.; Zdorovets, M. Synthesis, phase composition and magnetic properties of double perovskites of A (FeM)O4‒x type (A = Ce; M = Ti). Ceram. Int. 2019, 45, 8669–8676. [Google Scholar] [CrossRef]
  23. Aziz, I.; Lee, J.G.; Duran, H.; Kirchhoff, K.; Baker, R.T.; Irvine, J.T.S.; Arshad, S.N. Nanostructured carbons containing FeNi/NiFe2O4 supported over N-doped carbon nanofibers for oxygen reduction and evolution reactions. RSC Adv. 2019, 9, 36586–36599. [Google Scholar] [CrossRef]
  24. Borgekov, D.; Zdorovets, M.; Shlimas, D.; Kozlovskiy, A.; Kadyrzhanov, K. The Study of the Applicability of Electron Irradiation for FeNi Microtubes Modification. Nanomaterials 2020, 10, 47. [Google Scholar] [CrossRef] [PubMed] [Green Version]
  25. Kaniukov, E.; Shumskaya, A.; Yakimchuk, D.; Kozlovskiy, A.; Korolkov, I.; Ibragimova, M.; Zdorovets, M.; Kadyrzhanov, K.; Rusakov, V.; Fadeev, M.; et al. FeNi nanotubes: Perspective tool for targeted delivery. Appl. Nanosci. 2019, 9, 835–844. [Google Scholar] [CrossRef]
  26. Shumskaya, A.; Kozlovskiy, A.; Zdorovets, M.; Evstigneeva, S.; Trukhanov, A.; Trukhanov, S.; Vinnik, D.; Kaniukov, E.; Panina, L. Correlation between structural and magnetic properties of FeNi nanotubes with different lengths. J. Alloy. Compd. 2019, 810, 151874. [Google Scholar] [CrossRef]
  27. Wu, H.; Zeng, M.; Li, Z.; Zhu, X.; Tian, C.; Xia, C.; He, L.; Dai, S. Coupling FeNi alloys and hollow nitrogen-enriched carbon frameworks leads to high-performance oxygen electrocatalysts for rechargeable zinc–air batteries. Sustain. Energy Fuels 2019, 3, 136–141. [Google Scholar] [CrossRef]
  28. Kadyrzhanov, K.; Rusakov, V.; Fadeev, M.S.; Kiseleva, T.Y.; Kozlovskiy, A.; Kenzhina, I.; Zdorovets, M. Study of magnetic properties of Fe100‒xNix nanostructures using the mössbauer spectroscopy method. Nanomaterials 2019, 9, 757. [Google Scholar] [CrossRef] [Green Version]
  29. Liu, L.; Yan, F.; Li, K.; Zhu, C.; Xie, Y.; Zhang, X.; Chen, Y. Ultrasmall FeNi3N particles with an exposed active (110) surface anchored on nitrogen-doped graphene for multifunctional electrocatalysts. J. Mater. Chem. A 2019, 7, 1083–1091. [Google Scholar] [CrossRef]
  30. Cui, X. Self-thermoregulating Ferromagnetic FeNi filled Carbon Nanotubes for Magnetic Hyperthermia Cancer Therapy. In IOP Conference Series: Earth and Environmental Science; IOP Publishing: Bristol, UK, 2019; Volume 310. [Google Scholar]
  31. Kurlyandskaya, G.V.; Shcherbinin, S.V.; Buznikov, N.A.; Chlenova, A.A.; Svalov, A.V. Magnetic Materials for Thin Film Based Magnetoimpedance Biosensing. Phys. Met. Metallogr. 2019, 120, 1243–1251. [Google Scholar] [CrossRef]
  32. Rusakov, V.; Kadyzhanov, K.; Kozlovskiy, A.; Fadeev, M.; Zdorovets, M. Phase transformations as a result of thermal annealing of nanocomposite Fe–Ni/Fe–Ni–O particles. Ceram. Int. 2020, 46, 1586–1595. [Google Scholar] [CrossRef]
  33. Rostami-Vartooni, A.; Moradi-Saadatmand, A. Green synthesis of magnetically recoverable Fe3O4/HZSM-5 and its Ag nanocomposite using Juglans regia L. leaf extract and their evaluation as catalysts for reduction of organic pollutants. IET Nanobiotechnol. 2019, 13, 407–415. [Google Scholar] [CrossRef] [PubMed]
  34. Zubar, T.; Fedosyuk, V.M.; Trukhanov, A.V.; Kovaleva, N.N.; Astapovich, K.A.; Vinnik, D.; Trukhanova, E.L.; Kozlovskiy, A.L.; Zdorovets, M.V.; Solobai, A.A.; et al. Control of growth mechanism of electrodeposited nanocrystalline NiFe films. J. Electrochem. Soc. 2019, 166, D173–D180. [Google Scholar] [CrossRef]
  35. Zdorovets, M.; Kozlovskiy, A. Argon ion irradiation effect on Zn nanotubes. J. Mater. Sci. Mater. Electron. 2018, 29, 3621–3630. [Google Scholar] [CrossRef]
  36. Salati, A.; Ramazani, A.; Kashi, M.A. Tuning hyperthermia properties of FeNiCo ternary alloy nanoparticles by morphological and magnetic characteristics. J. Magn. Magn. Mater. 2020, 498, 166172. [Google Scholar] [CrossRef]
  37. Amin, P.; Patel, M. Magnetic nanoparticles-a promising tool for targeted drug delivery system. Asian J. Nanosci. Mater. 2020, 3, 24–37. [Google Scholar]
  38. Kaniukov, E.; Shumskaya, A.; Kutuzau, M.; Bundyukova, V.; Yakimchuk, D.; Borgekov, D.; Ibragimova, M.; Korolkov, I.; Giniyatova, S.; Kozlovskiy, A.; et al. Degradation mechanism and way of surface protection of nickel nanostructures. Mater. Chem. Phys. 2019, 223, 88–97. [Google Scholar] [CrossRef]
  39. Korolkov, I.; Kozlovskiy, A.; Gorin, Y.G.; Kazantsev, A.V.; Shlimas, D.I.; Zdorovets, M.V.; Ualieva, N.K.; Rusakov, V. Immobilization of carborane derivatives on Ni/Fe nanotubes for BNCT. J. Nanopart. Res. 2018, 20, 240. [Google Scholar] [CrossRef]
  40. Kozlovskiy, A.; Zhanbotin, A.; Zdorovets, M.; Manakova, I.; Ozernoy, A.; Kadyrzhanov, K.; Rusakov, V. Study of Ni/Fe nanotube properties. Nucl. Instrum. Methods Phys. Res. Sect. B Beam Interact. Mater. Atoms 2015, 365, 663–667. [Google Scholar] [CrossRef]
  41. Siwy, Z.S. Ion-current rectification in nanopores and nanotubes with broken symmetry. Adv. Funct. Mater. 2006, 16, 735–746. [Google Scholar] [CrossRef]
  42. Kaniukov, E.; Shumskaya, E.E.; Yakimchuk, D.; Kozlovskiy, A.; Ibragimova, M.A.; Zdorovets, M. Evolution of the polyethylene terephthalate track membranes parameters at the etching process. J. Contemp. Phys. Armen. Acad. Sci. 2017, 52, 155–160. [Google Scholar] [CrossRef]
  43. Puerta, J.; Martin, P. Three and four generalized Lorentzian approximations for the Voigt line shape. Appl. Opt. 1981, 20, 3923–3928. [Google Scholar] [CrossRef] [PubMed]
  44. Kozlovskiy, A.; Dukenbayev, K.; Ivanov, I.; Kozin, S.; Aleksandrenko, V.; Kurakhmedov, A.; Sambaev, E.; Kenzhina, I.; Tosi, D.; Loginov, V.; et al. Investigation of the influence of irradiation with Fe+7 ions on structural properties of AlN ceramics. Mater. Res. Express 2018, 5, 065502. [Google Scholar] [CrossRef]
  45. Mote, V.; Purushotham, Y.; Dole, B. Williamson-Hall analysis in estimation of lattice strain in nanometer-sized ZnO particles. J. Theor. Appl. Phys. 2012, 6, 6. [Google Scholar] [CrossRef] [Green Version]
  46. Shumskaya, A.E.; Kaniukov, E.Y.; Kozlovskiy, A.L.; Shlimas, D.I.; Zdorovets, M.V.; Ibragimova, M.A.; Rusakov, V.S.; Kadyrzhanov, K.K. Template synthesis and magnetic characterization of FeNi nanotubes. Prog. Electromagn. Res. 2017, 75, 23–30. [Google Scholar] [CrossRef] [Green Version]
  47. Zhou, N.; Cai, L.-H.; Wen, F.-S.; Li, F.-S. Template synthesis and magnetic behavior of FeNi alloy nanotube arrays. Chin. J. Chem. Phys. 2007, 20, 821. [Google Scholar] [CrossRef]
  48. Kozlovskiy, A.L.; Kenzhina, I.E.; Zdorovets, M.V. FeCo–Fe2CoO4/Co3O4 nanocomposites: Phase transformations as a result of thermal annealing and practical application in catalysis. Ceram. Int. 2020. [Google Scholar] [CrossRef]
  49. Kozlovskiy, A.; Shlimas, D.; Zdorovets, M. Investigation of the effect of ionizing radiation on the structural and conductive characteristics of Ni nanostructures. Vacuum 2019, 163, 103–109. [Google Scholar] [CrossRef]
  50. Kozlovskiy, A.; Ermekova, A.; Korolkov, I.; Chudoba, D.; Jazdzewska, M.; Łudzik, K.; Nazarova, A.; Marciniak, B.; Kontek, R.; Shumskaya, A.; et al. Study of phase transformations, structural, corrosion properties and cytotoxicity of magnetite-based nanoparticles. Vacuum 2019, 163, 236–247. [Google Scholar] [CrossRef]
  51. Salah, N.; Habib, S.S.; Khan, Z.H.; Al-Hamedi, S.; Djouider, F. Functionalization of gold and carbon nanostructured materials using gamma-ray irradiation. Radiat. Phys. Chem. 2009, 78, 910–913. [Google Scholar] [CrossRef]
  52. Kozlovskiy, A.; Korolkov, I.; Ibragimova, M.A.; Zdorovets, M.V.; Kutuzau, M.; Nikolaevich, L.N.; Shumskaya, E.E.; Kaniukov, E. Magnetic nanostructured system for biomedical applications based on FeNi nanotubes. Nanotechnol. Russ. 2018, 13, 331–336. [Google Scholar] [CrossRef]
  53. Tartaj, P.; Morales, M.D.P.; Veintemillas-Verdaguer, S.; González-Carreño, T.; Serna, C. The preparation of magnetic nanoparticles for applications in biomedicine. J. Phys. D Appl. Phys. 2003, 36, R182–R197. [Google Scholar] [CrossRef]
  54. Lu, X.; Wu, J.; Huo, G.; Sun, Q.; Huang, Y.; Han, Z.; Liang, G. Protein-passivated FeNi3 particles with low toxicity and high inductive heating efficiency for thermal therapy. Colloids Surf. A Physicochem. Eng. Asp. 2012, 414, 168–173. [Google Scholar] [CrossRef]
  55. Slaton, R.D.; Bae, I.-T.; Lutz, P.S.; Pathade, L.; Maye, M.M. The transformation of α-Fe nanoparticles into multi-domain FeNi–M3O4 (M = Fe, Ni) heterostructures by galvanic exchange. J. Mater. Chem. C 2015, 3, 6367–6375. [Google Scholar] [CrossRef]
  56. Pan, J.; Thierry, D.; Leygraf, C. Hydrogen peroxide toward enhanced oxide growth on titanium in PBS solution: Blue coloration and clinical relevance. J. Biomed. Mater. Res. Off. J. Soc. Biomater. Jpn. Soc. Biomater. 1996, 30, 393–402. [Google Scholar] [CrossRef]
  57. Wuang, S.C.; Neoh, K.G.; Kang, E.-T.; Pack, D.W.; Leckband, D.E. Synthesis and functionalization of polypyrrole-Fe3O4 nanoparticles for applications in biomedicine. J. Mater. Chem. 2007, 17, 3354–3362. [Google Scholar] [CrossRef]
Figure 1. (a) SEM—image of arrays of nanostructures; (b) EDA spectrum of the studied nanostructures; (c) mapping results; results of changes in the morphology and elemental composition of nanostructures.
Crystals 10 00254 g001aCrystals 10 00254 g001b
Figure 2. X-ray diffraction patterns of the studied samples before and after irradiation.
Crystals 10 00254 g002
Figure 3. (a) The dynamics of changes in the size of crystallites and micro-distortions depending on the dose of radiation (the refinement of sizes and microstresses was carried out using the Williamson–Hall method); (b) graph of changes in the density and porosity of the studied nanostructures before and after irradiation.
Crystals 10 00254 g003
Figure 4. Dynamics of changes in the rate of degradation of nanostructures in a PBS solution (dots indicate experimental data, red lines indicate approximations of the results obtained, necessary to determine the rate of degradation reaction): (a) at a test temperature of 25 °C; (b) at a test temperature of 36 °C; (c) at a test temperature of 40 °C.
Crystals 10 00254 g004
Figure 5. SEM images of the stages of degradation of the initial nanostructures: (a) 3 days of testing; (b) 5 days of testing; (c) 10 days of testing; (d) 20 days of testing. (e) Diagram of degradation of nanostructures.
Crystals 10 00254 g005
Figure 6. SEM images of the stages of degradation of nanostructures irradiated with a dose of 500 kGy: (a) 3 days of testing; (b) 5 days of testing; (c) 10 days of testing; (d) 15 days of testing; (e) 20 days of testing. (f) Diagram of degradation of irradiated nanostructures.
Crystals 10 00254 g006
Figure 7. Dynamics of mass loss due to corrosion: (a) at a test temperature of 25 °C; (b) at a test temperature of 36 °C; (c) at a test temperature of 40 °C.
Crystals 10 00254 g007aCrystals 10 00254 g007b
Figure 8. Graph of the change in the concentration of oxide phases in the structure of nanotubes: (a) at a test temperature of 25 °C; (b) at a test temperature of 36 °C; (c) at a test temperature of 40 °C.
Crystals 10 00254 g008
Figure 9. UV–Vis absorption spectra for the reduction of PNA–PPD: (a) initial sample; (b) irradiated with a dose of 100 kGy; (c) irradiated with a dose of 300 kGy; (d) irradiated with a dose of 500 kGy.
Crystals 10 00254 g009aCrystals 10 00254 g009b
Figure 10. Graphs of the dependence of the changes in CI/C0 (a) and LnCI/C0 (b) reflecting the catalytic activity of the studied nanostructures. (c) PNA-PPD reaction scheme. (d) The graph of the change in the rate of reaction constant (dots indicate experimental data; red lines indicate approximations of the results).
Crystals 10 00254 g010
Table 1. Data on changes in crystallographic characteristics.
SampleLattice Parameter, ÅInterplanar DistanceDegree of Structural OrderingFull Width at Half Maximum of Peak (111) (FWHM)The Ratio of the 111 to the 200 Peak
(Intensity (111)/Intensity (200))
Initial3.5492 ± 0.00132.0478186.41.4946.11
100 kGy3.5415 ± 0.00162.0431887.31.2466.15
200 kGy3.5381 ± 0.00212.0408791.10.9176.21
300 kGy3.5367 ± 0.00152.0408593.50.82010.56
400 kGy3.5353 ± 0.00112.0407194.10.81216.32
500 kGy3.5221 ± 0.00172.0363294.50.74521.74
Table 2. Texture coefficient data.
TChkl111200220
Initial1.875 *0.6430.482
100 kGy1.9420.7430.315
200 kGy1.9640.6640.372
300 kGy2.3530.3640.283
400 kGy2.5530.2310.216
500 kGy2.7340.1530.113
* Coefficients greater than one are shown in italics

