1. Introduction
Mg-Transition metal (TM: Zn, Ni, Cu, Co and Al)-Rare Earth (RE: Y, Gd, Dy, Ho, Er, etc.) alloys with a Long-Period Stacking Ordered (LPSO) crystal structure have attracted great attention due to their high mechanical strength (around 600 MPa), which is maintained up to 300 °C. The LPSO phases are typically Mg-TM-RE compounds whose structure show a long range stacking of basal, hexagonal planes with periodic enrichment of TM and RE atoms in basal planes [
1,
2,
3,
4,
5,
6,
7,
8,
9,
10,
11,
12,
13,
14]. LPSO crystal structures can be represented by L1
2 type ordered TM
6RE
8 clusters embedded in local fcc stacking layers [
15,
16,
17,
18].
The mechanical properties of the LPSO phase have been widely studied in the Mg-Zn-Y system. The LPSO phase with 18R or 14H structure shows a strong elastic and plastic anisotropy. In the elastic regime, the LPSO phase exhibits a higher Young’s modulus and shear modulus compared to Mg [
19,
20,
21,
22] and depending on the LPSO crystal orientation. On the other hand, its plastic behavior is controlled by the activation of the basal slip system with a CRSS of around 10 MPa [
23,
24]. During extrusion, the LPSO phase is oriented with their basal plane parallel to the extrusion direction. The activation of the basal slip system is forbidden when the material is tested along the extrusion direction, and the LPSO phase exhibits differences in the mechanical behavior depending on the stress sign and the orientation of the stress [
25,
26,
27]. Under compression along the extrusion direction, the material exhibits the highest yield stress (500–550 MPa). Moreover, the activation of kinking [
23,
24,
25,
26,
27] and non-basal slip systems [
28] induces a high plastic deformation capacity. Under tension along the extrusion direction, the LPSO phase is extremely brittle.
Itoi et al. [
29] have reported that rolled-Mg-Y-Ni alloy with almost fully LPSO phase exhibited a high tensile mechanical strength (460 MPa) at room temperature with a ductility of 8%. This alloy with these high mechanical strength values can substitute aluminum or steels for some structural applications. However, the mechanical behavior under different stress configuration has not been explored to analyze their plastic anisotropy. The present study examines the orientation dependence of strength of an extruded Mg
90Y
6.5Ni
3.5 alloy with an almost fully LPSO phase and its temperature dependences. The deformation mechanisms occurring during plastic deformation have been analyzed using in-situ synchrotron radiation diffraction experiments at room and high temperatures during compression tests in a direction parallel and perpendicular to the extrusion axis.
2. Materials and Methods
The alloy with a nominal composition of 90%Mg-6.5%Y-3.5%Ni (atomic percent) was prepared by melting in an electric resistance furnace using high purity Mg and Ni elements and a Mg-22%Y master alloy. Ingots were cast by pouring the liquid metal into a cylindrical steel mold of diameter 42 mm. The alloy was homogenized at 350 °C for 24 h and then extruded at 450 °C using an extrusion ratio of 18:1 (a rectangular die of section 7 mm by 12 mm) and an extrusion rate of 0.5 mm/s.
Microstructure was examined by scanning (SEM) (JEOL JSM 6500F, JEOL, Tokyo, Japan) and transmission (TEM) (JEOL JEM 2010, JEOL, Tokyo, Japan) electron microscopy. Samples for SEM were prepared by mechanical polishing and finishing with an etching solution of 5 mL acetic acid, 20 mL water and 25 mL picric acid in methanol. Specimens for TEM were prepared by ion milling at liquid nitrogen temperature.
For mechanical testing, samples with different shape and size were prepared from the extruded bar and machined for loading along the extrusion direction (ED) and the longest transversal direction (TD). For compression tests at different temperatures, prismatic samples of 5 × 5 × 10 mm3 were prepared. For tensile tests along ED direction, cylindrical samples with a diameter of 3 mm and length 10 mm were used. Tensile and compressive tests were carried out in air at temperatures between room temperature and 400 °C, using a strain rate of 4 × 10⁻⁴ s−1. In compression, tests were stopped at about 10% of strain if the sample was not broken before.
Synchrotron radiation diffraction (SRD) was carried out at the P07–HEMS beamline of PETRA III, at the Deutsches Elektronen-Synchrotron (DESY, Hamburg, Germany) during in-situ compression tests to identify the deformation mechanisms of the Mg90Y6.5Ni3.5 alloy. The diffraction patterns were recorded in a fast mode using an exposure time of around 0.5 s by a Perkin-Elmer XRD 1621 flat-panel detector with an array of 2048 × 2048 pixels2, with an effective pixel size of 200 × 200 µm2. The beam energy and, therefore, the wavelength were 100 keV and 0.0124 nm, respectively. As a reference, LaB6 was used to calibrate the system. The detector-to-sample distance was 1789 mm. The in-situ compressive test at a strain rate of 10−3 s−1 where carried out in a DIL 805A/D (TA Instruments, New Castle, DE, USA) dilatometer at room temperature and 300 °C. Cylindrical samples of 5 mm of diameter and 10 mm of length where machined from the extruded bar along the extrusion and the longest transversal direction. The thermocouple was welded at the surface of the compressive sample to control the test temperature. The beam was positioned at the centre of the sample with the gauge volume defined approximately by the primary slits (1 × 1 mm2) and the cylinder diameter, which allows a good grain statistic.
2θ diffraction profiles were calculated by azimuthal integration of a 10° section (±5°) of the Debye-Scherrer rings in the axial and radial direction, i.e., parallel and perpendicular to the compression direction. The fitting of each individual diffraction peak was carried out using the FIT2D software (European Synchrotron Radiation Facility (ESRF), Grenoble, France) [
30] and a Gaussian function. The elastic strain for each diffraction peak is calculated by the relative shift in the position of the diffraction peak:
where d
hkl and d
0,hkl are the interplanar distance of the hkl plane in the stressed and stress-free crystal. d
0,hkl is selected as the interplanar distance before the compression test. The diffraction angle θ and the lattice planar spacing are linked through the Bragg’s law.
where λ is the wavelength of the radiation.
3. Results
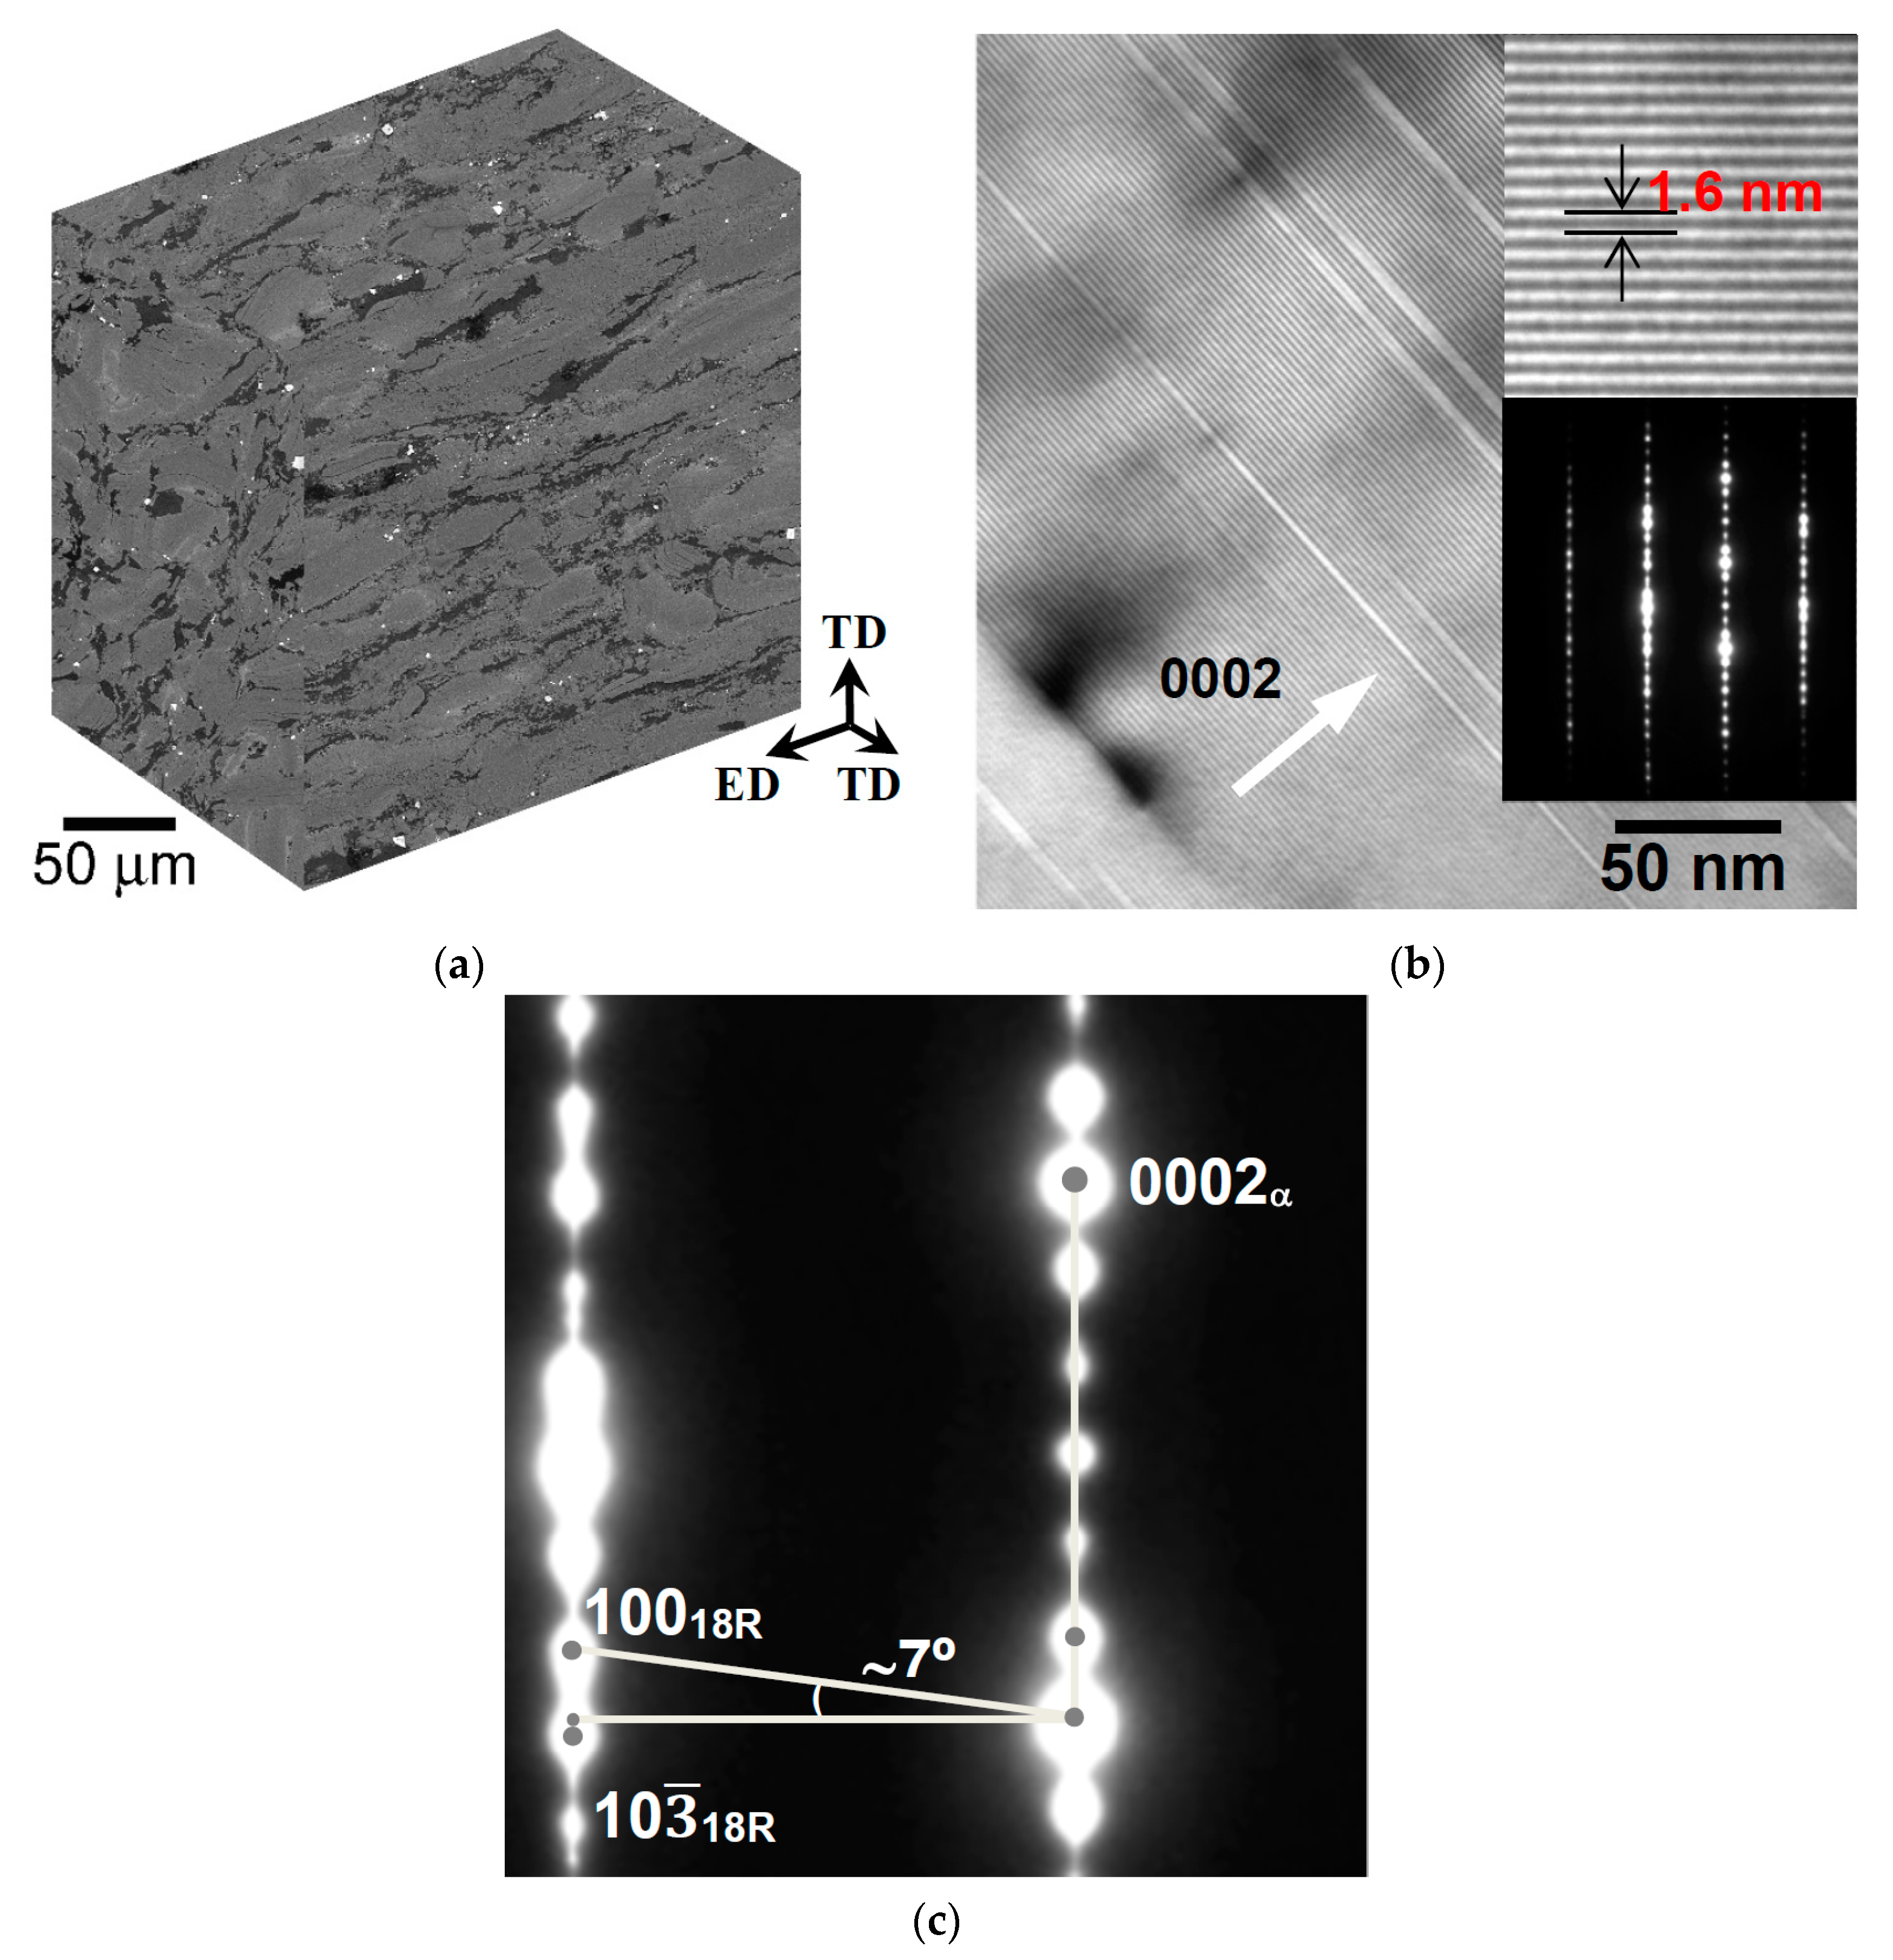
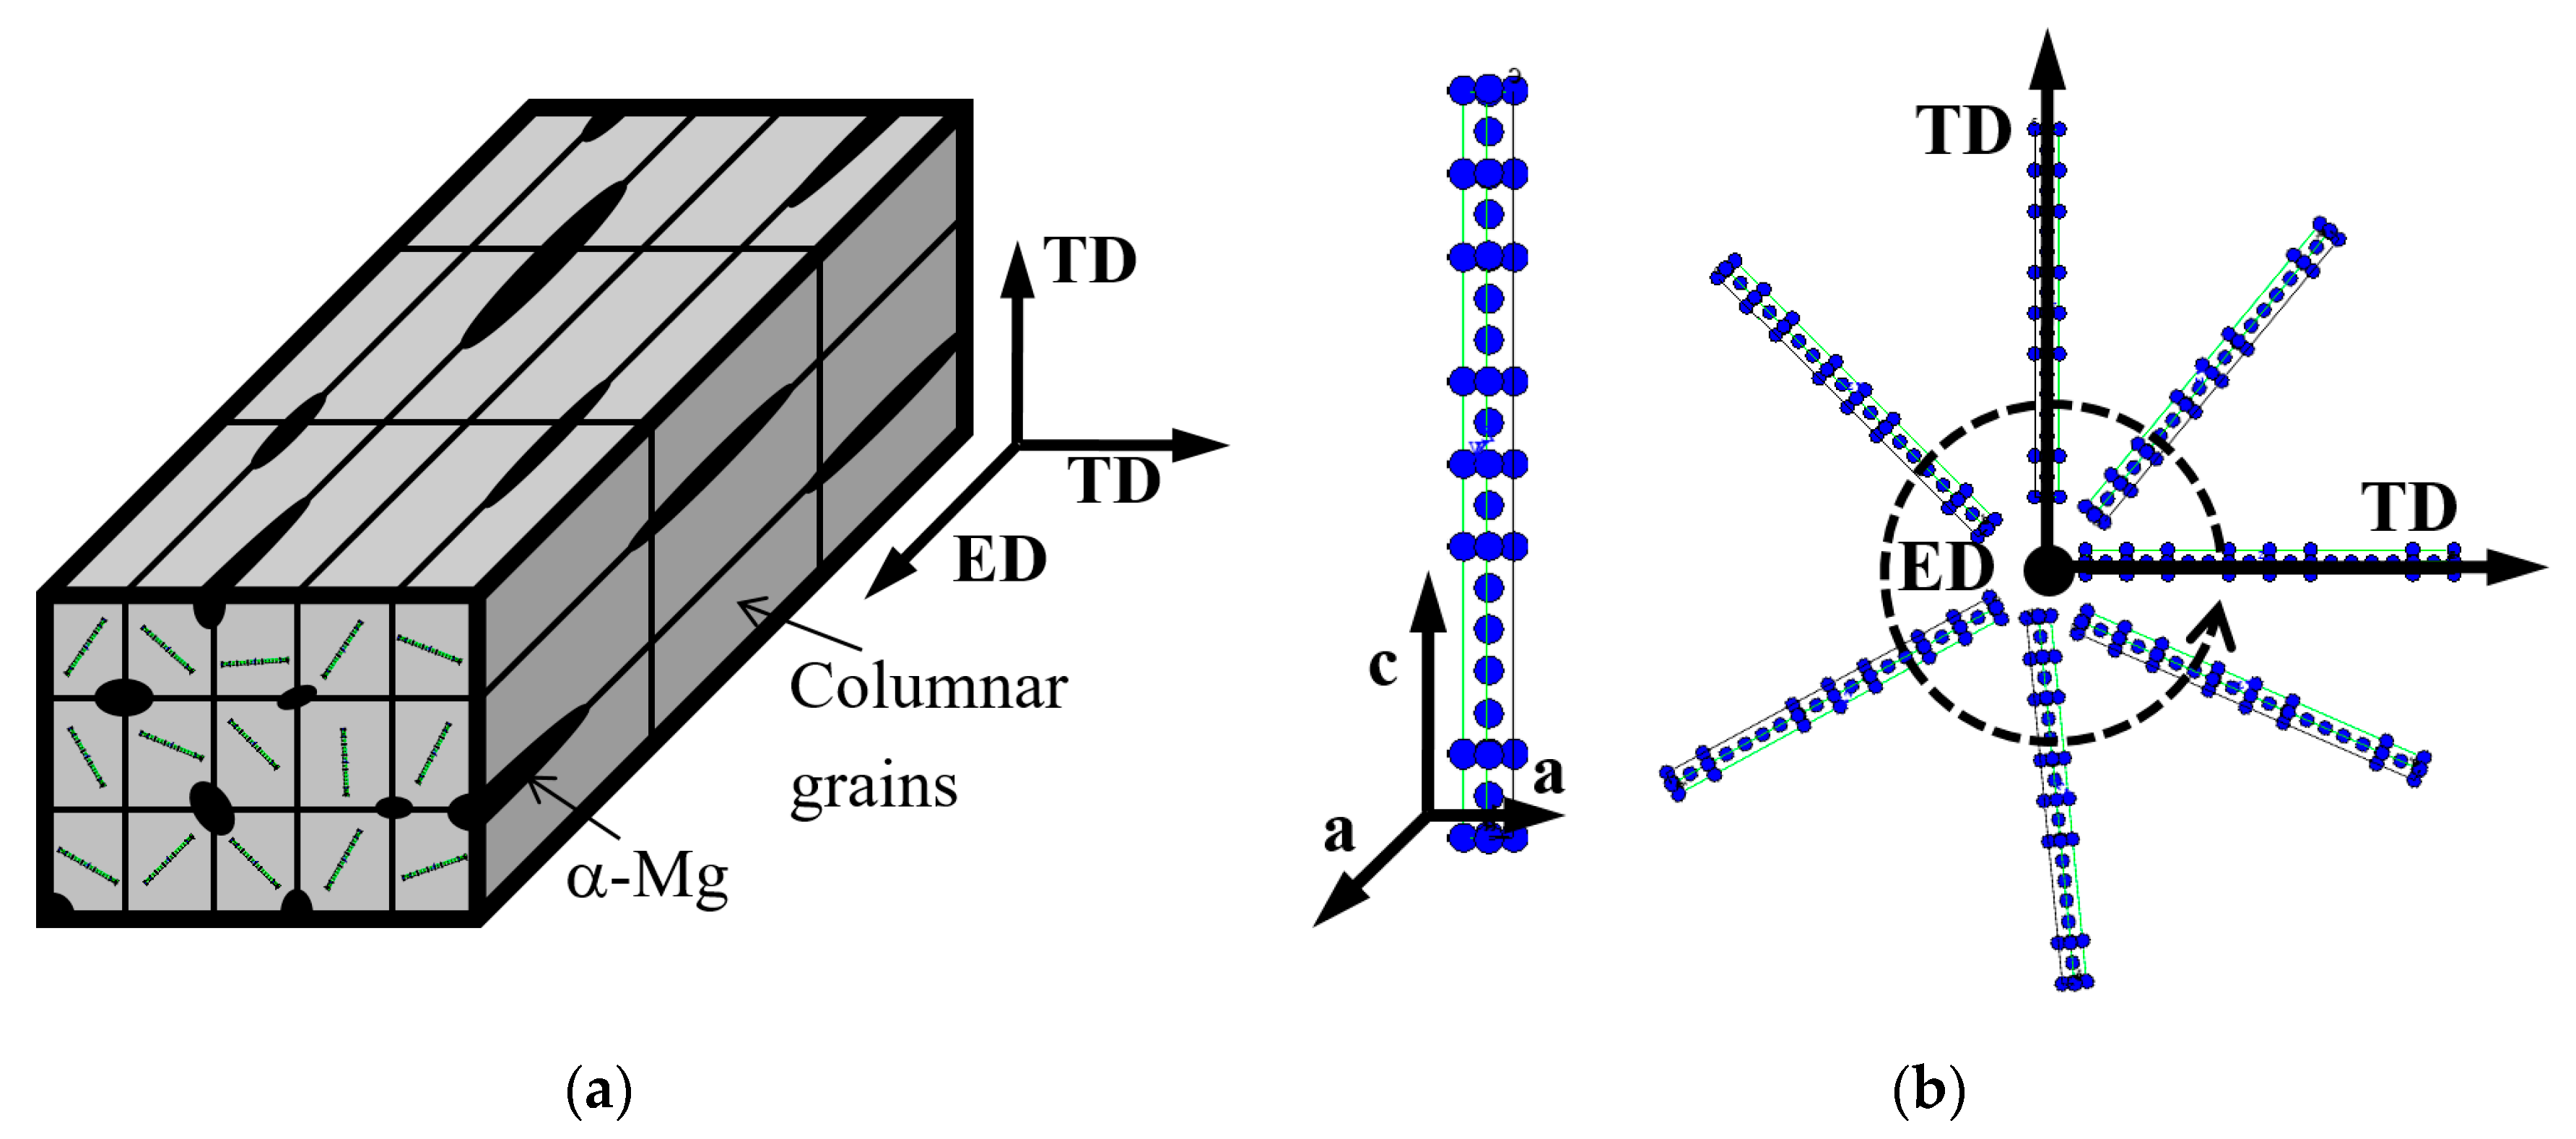
The 3D microstructure of the extruded material, shown in
Figure 1a, was characterized by the presence of two phases, which are elongated along the extrusion direction. The preponderance phase (light gray phase) corresponds to the LPSO while the dark phase corresponds to alfa magnesium with some yttrium and nickel in solid solution. The volume fraction of the darker Mg phase, calculated using image analysis in the as-cast condition, covered about 13.4% ± 0.8% and was located at the grain boundaries of LPSO grains. TEM and SRD studies were carried out to determine the crystallographic structure of the LPSO phase and its crystallographic texture.
Figure 1b,c shows the bright-field image for the LPSO phase using g = 0002 diffraction vector as well as the selected area electron diffraction (SAED) pattern in the [11
0] zone axis. Fringes, perpendicular to the [0002] direction, were observed. The fringe spacing was 1.6 nm. The SAED pattern of the LPSO in the [11
0] zone axis presents six diffracted spots along the [0002] directions between the transmitted spot and the (0002) diffracted spot of the magnesium structure. Both observations confirmed the 18R (rhombohedral) crystal structure of the LPSO phase after extrusion.
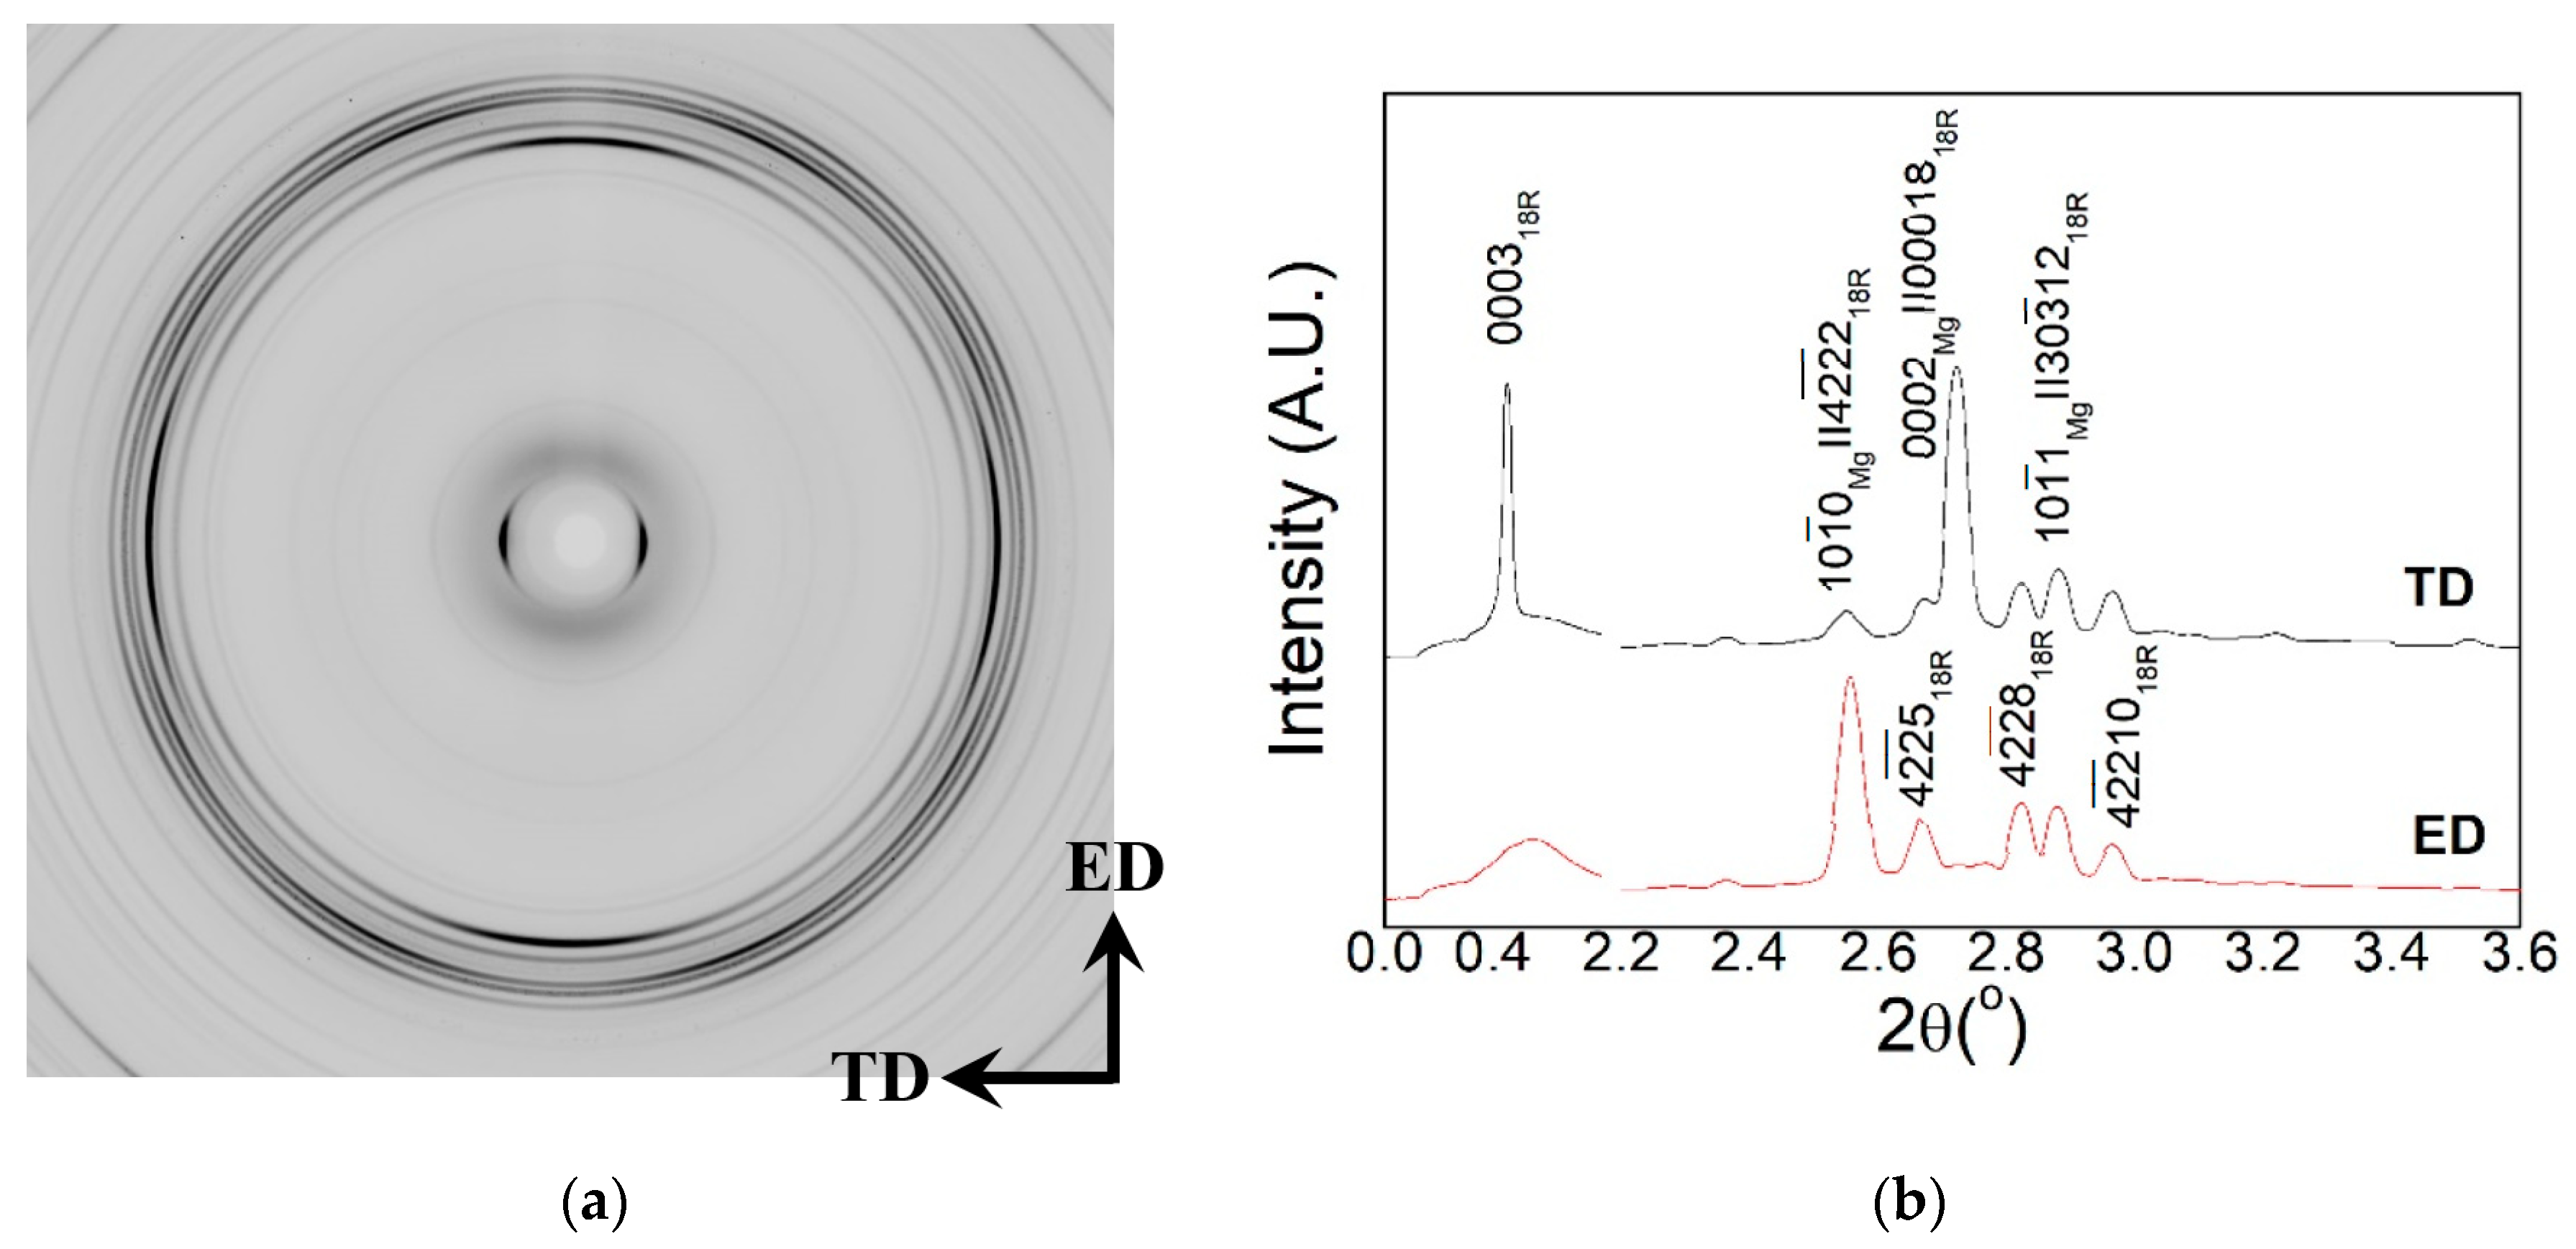
Figure 2a shows the Debye–Scherrer rings obtained in the extruded Mg
90Y
6.5Ni
3.5 alloy extruded at 450 °C. After integration along the extrusion and transversal directions, diffraction patterns as a function of 2θ are obtained (
Figure 2b). The crystal structure of the LPSO phase corresponds to the 18R structure (P3
212 space group) with parameters a = 1.11 nm and c = 4.69 nm. The diffraction peaks with highest intensities in the transversal direction correspond to (0003)
18R and (00018)
18R, which are not observed in the diffraction pattern obtained along the extrusion direction. During the extrusion process, the LPSO phase reorients its basal plane parallel to the extrusion direction. Therefore, the alloy exhibited a strong fiber texture with the basal plane parallel to the extrusion direction and it is expected that mechanical properties of the extruded Mg
90Y
6.5Ni
3.5 alloy show differences when tested along the extrusion or transversal directions.
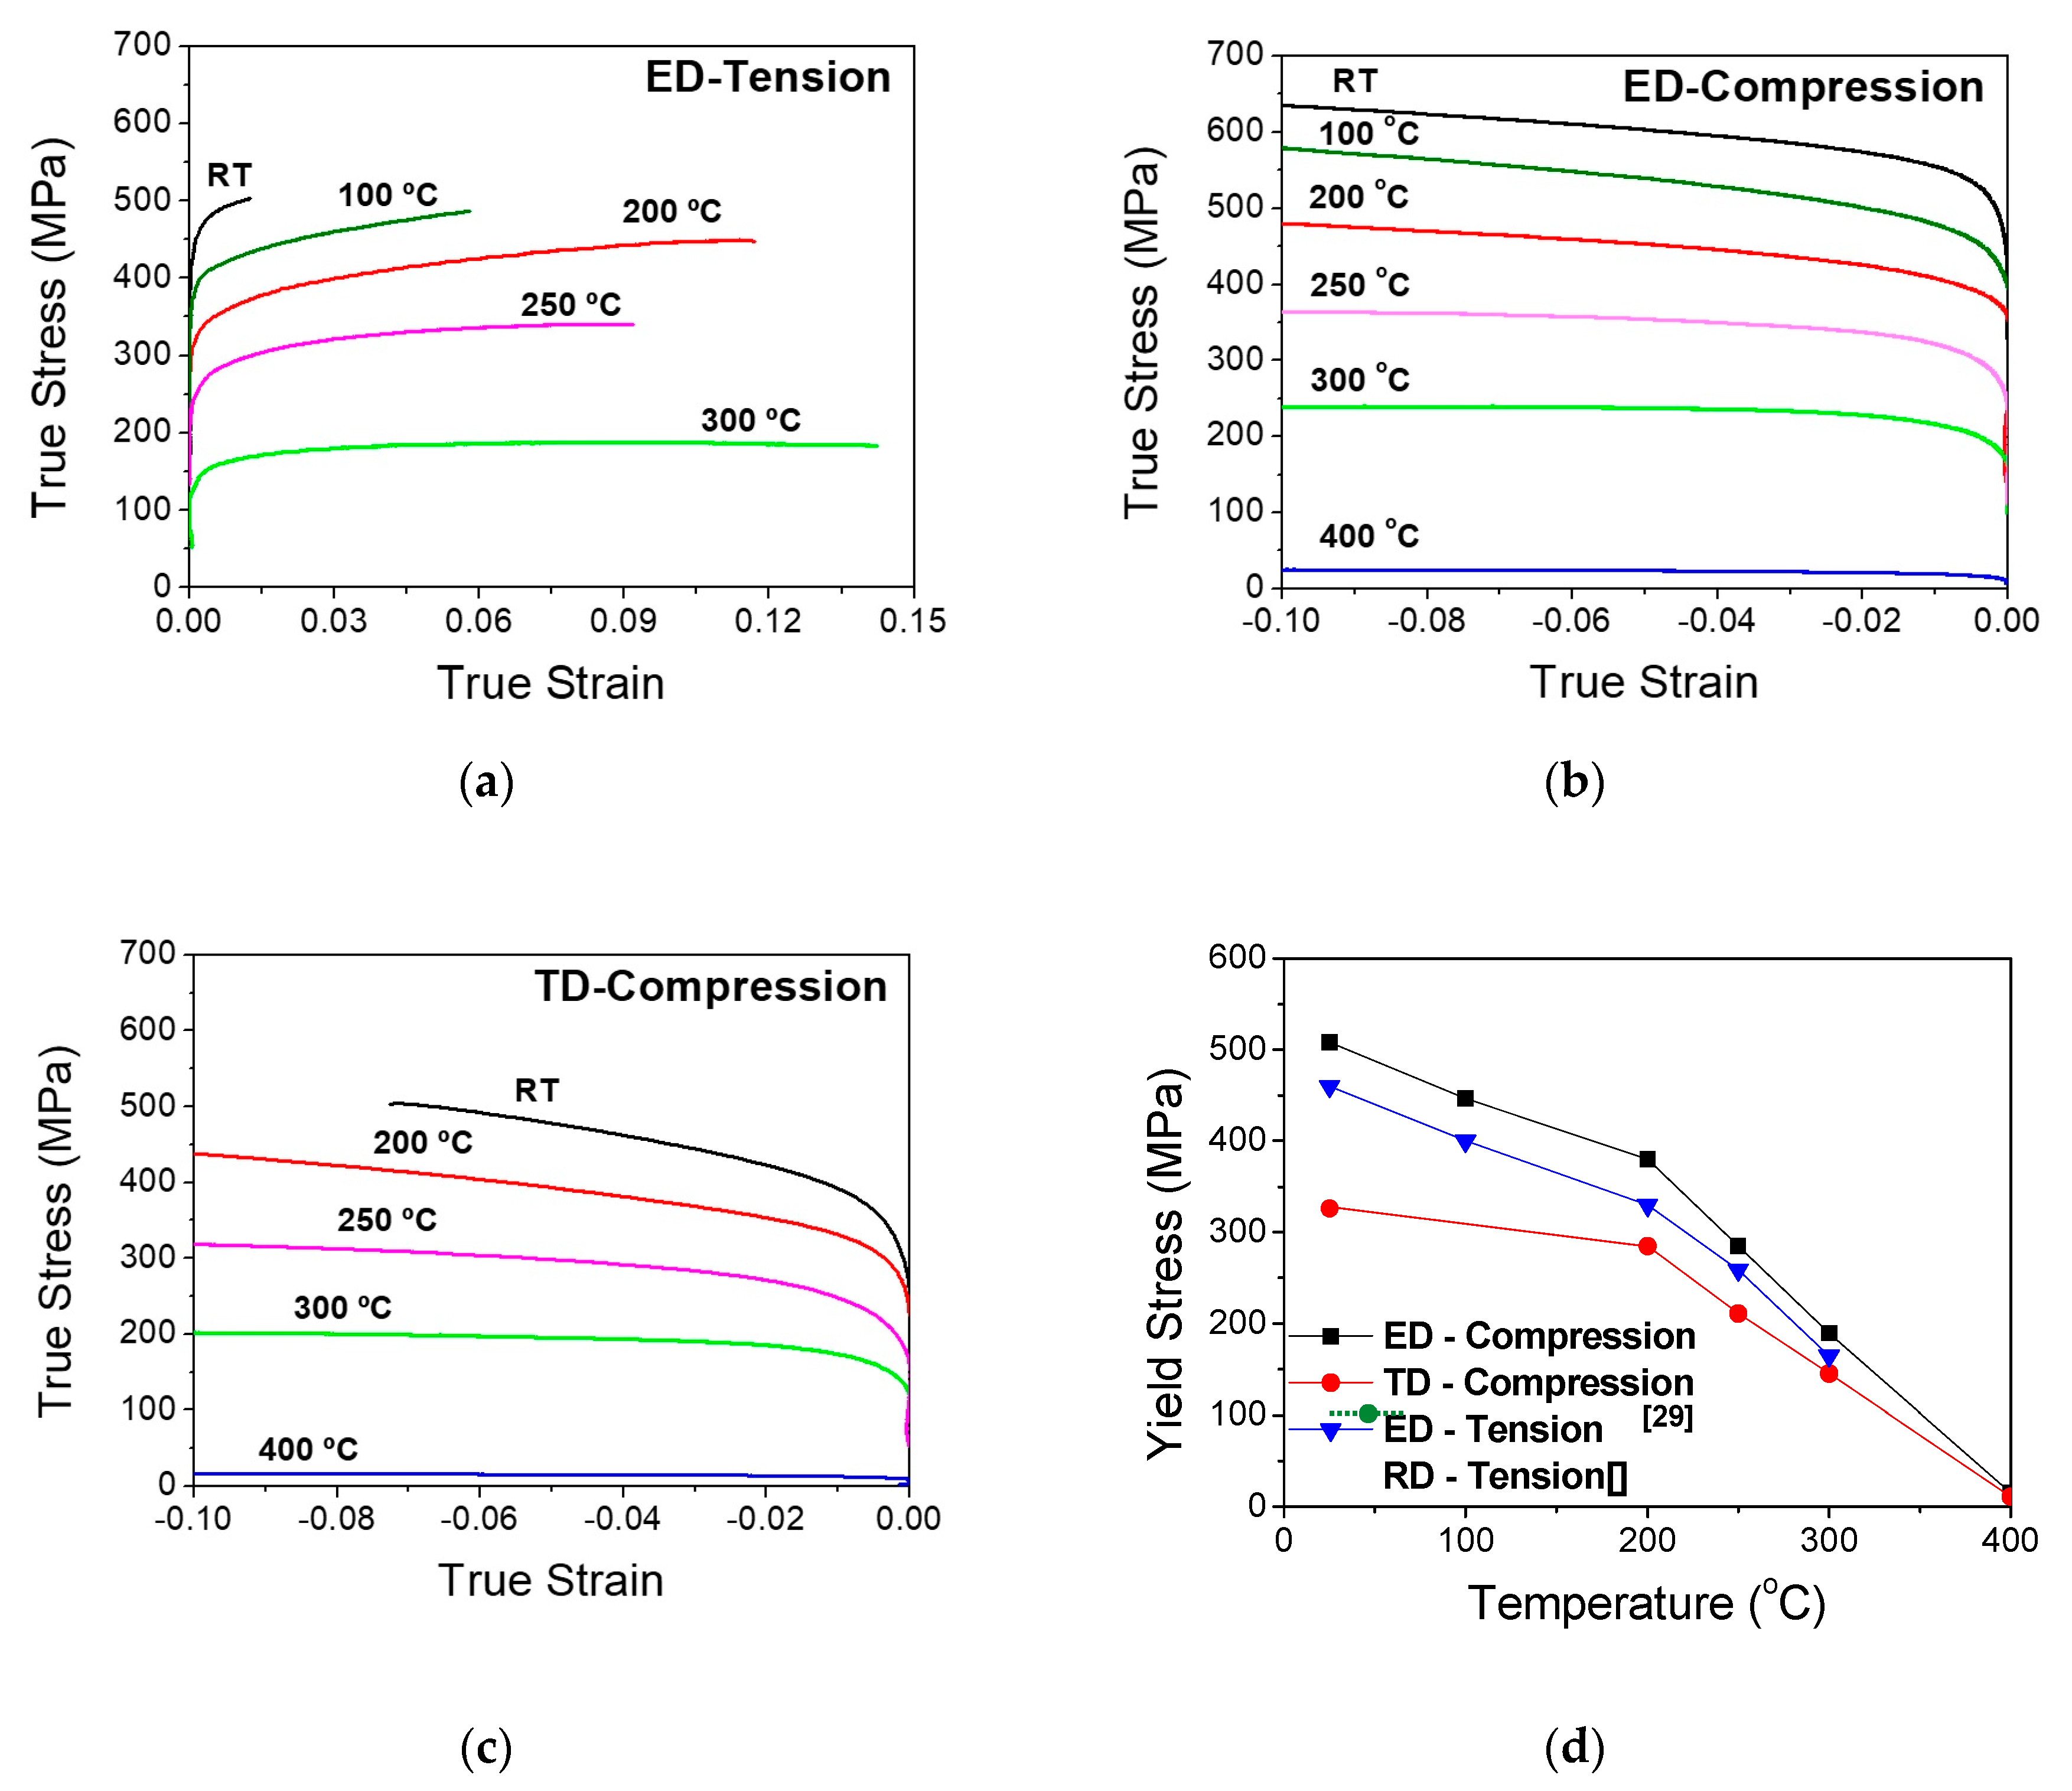
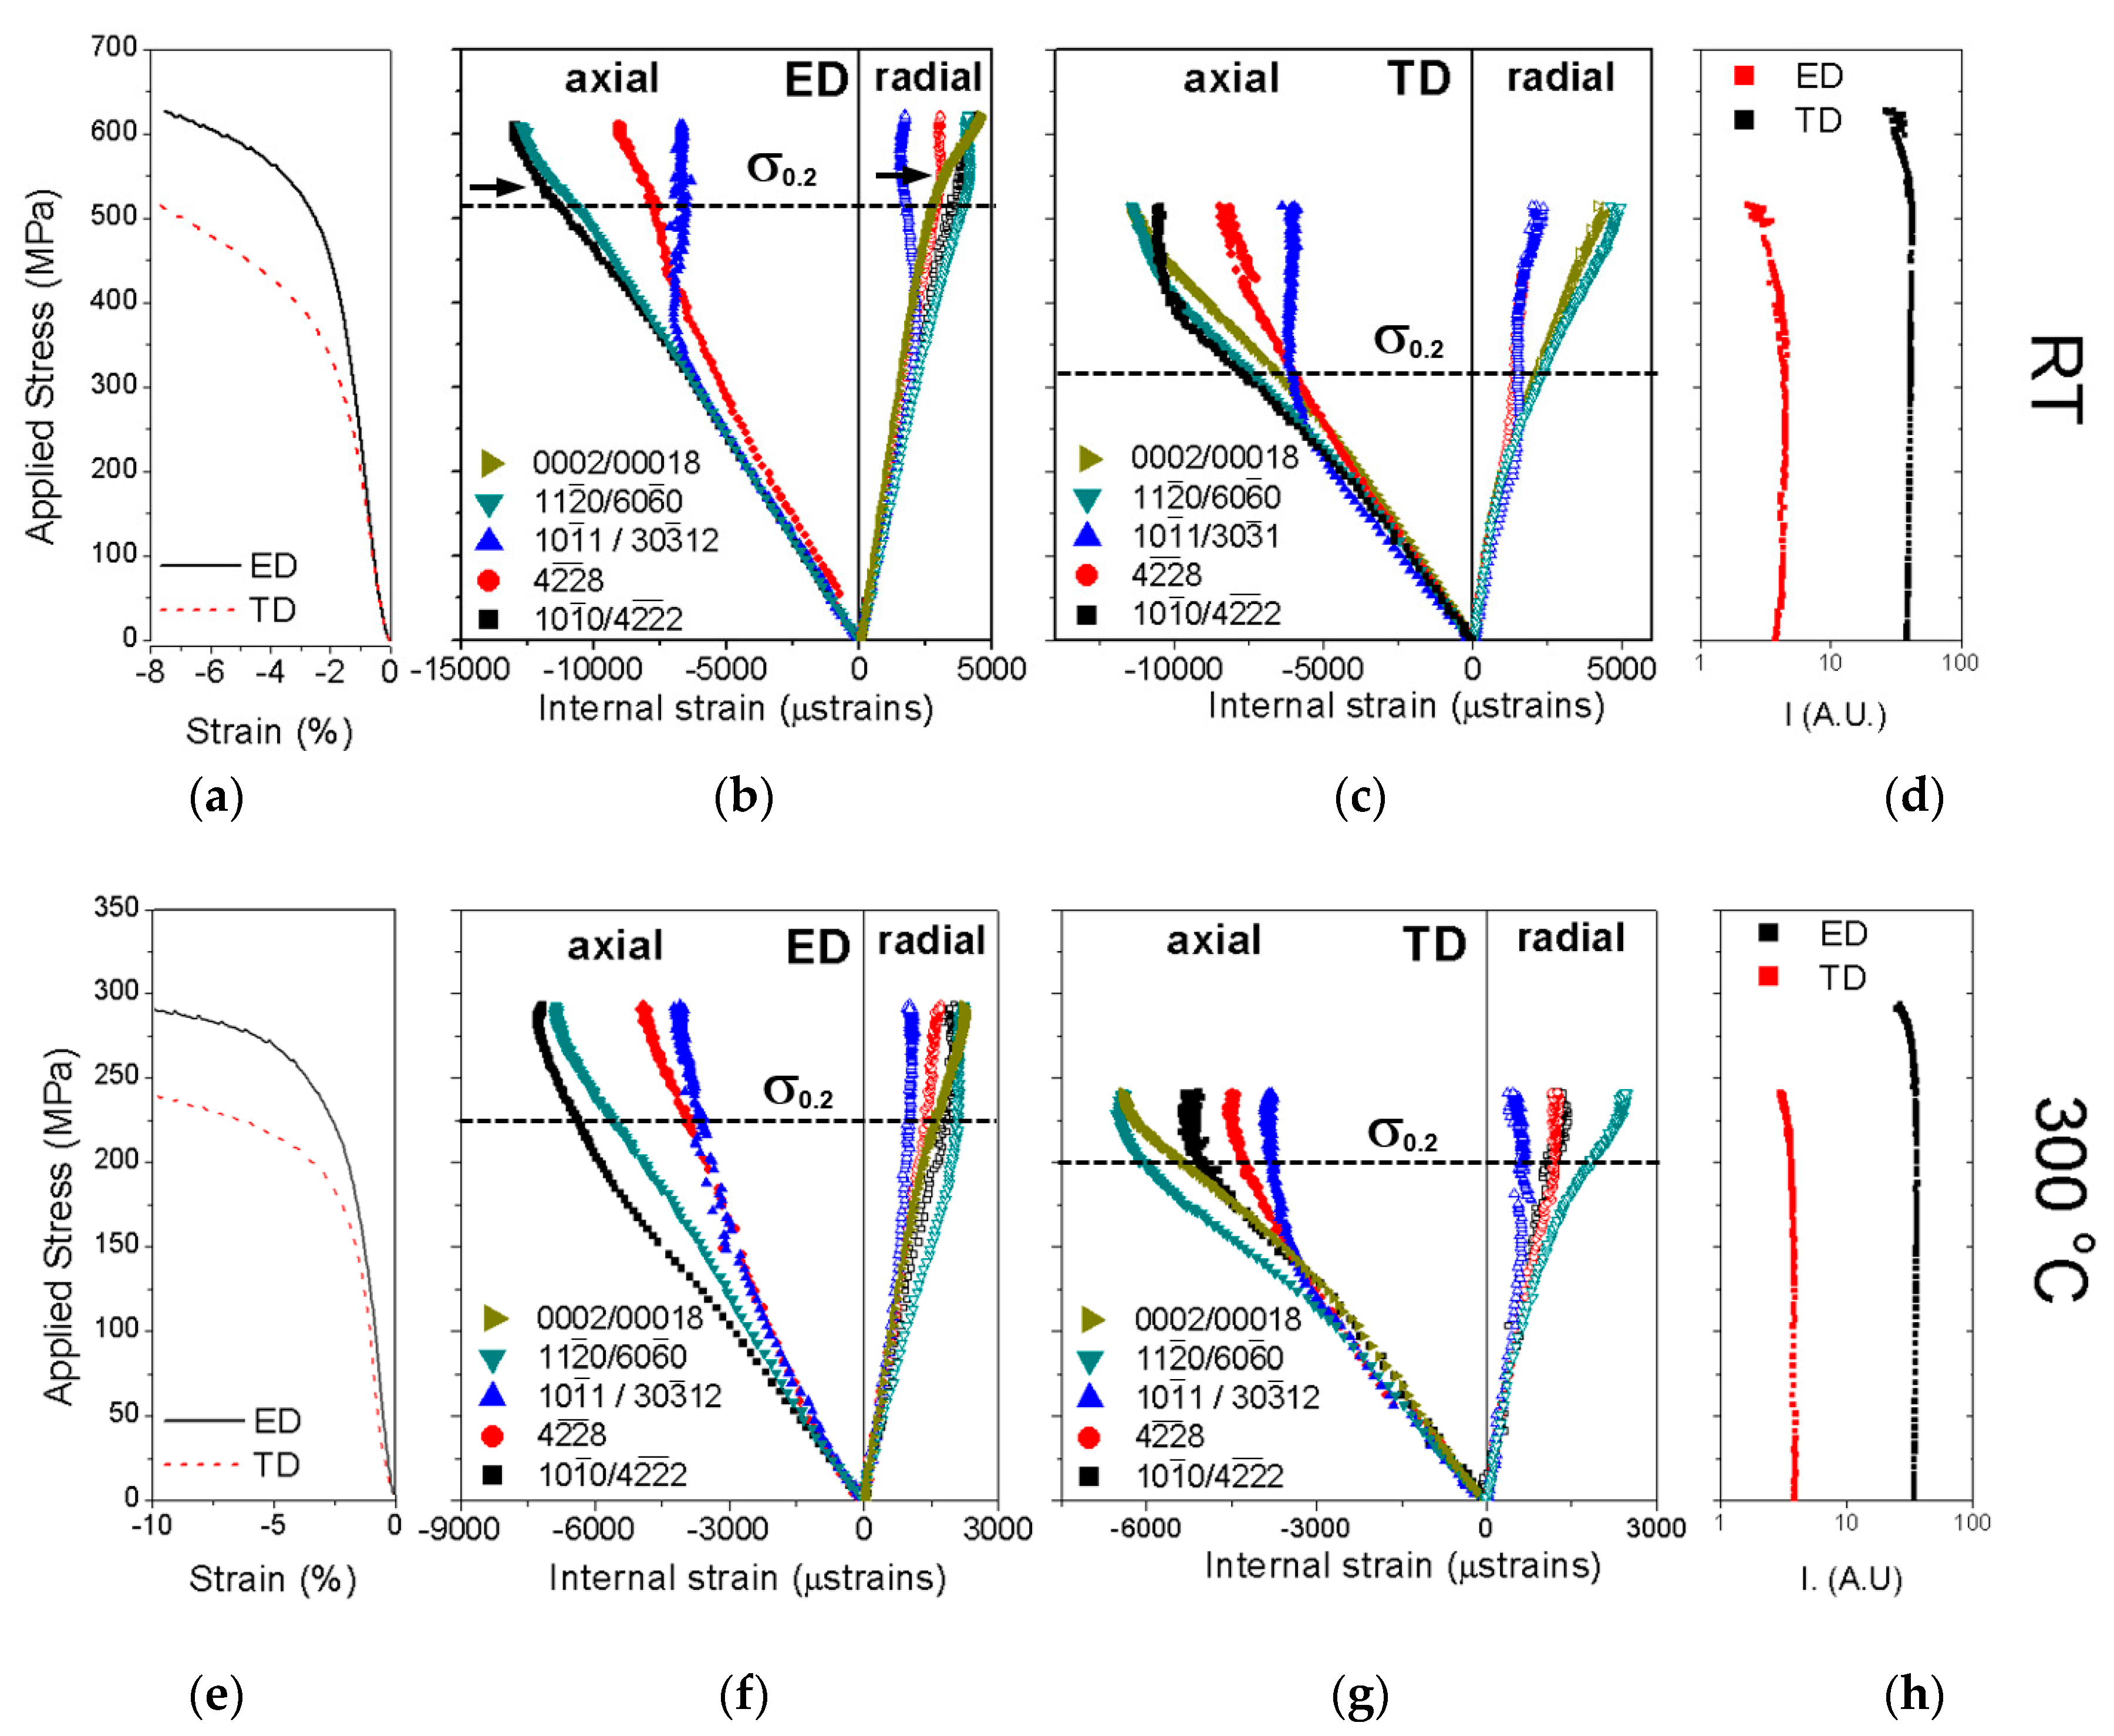
True stress–true strain curves of the extruded Mg
90Y
6.5Ni
3.5 alloy tested in tension and in compression from room temperature (RT) to 400 °C are shown in
Figure 3a–c. The shape of the curves was essentially the same at a given temperature for each sample orientation independently of tension and compression. The work hardening was high in the beginning of the tensile or compressive curve (about 1–2% strain), but then decreased to low values. Failure in tension occurred at low strain at low temperature (1% at room temperature). Tensile ductility improved considerably above 100 °C.
Figure 3d shows yield stresses (flow stress at 0.2% plastic strain) determined from the stress–strain curves of
Figure 3a–c. In general terms, all materials show high strength at low temperatures and fall to very low stresses above 200 °C.
Yield stresses of samples tested in the extrusion direction were the highest, being some 180 MPa and 130 MPa (compression and tension tests, respectively) higher than samples compressed in the transversal direction at room temperature. This behavior was maintained up to 400 °C. However, the stress difference between different deformation modes decreased with the increase in the test temperature. For the orientation ED tested in tension, the strength was 50 MPa lower than in compression at room temperature. The stress difference between tensile and compressive test along the extrusion direction also decreased with the increase in the test temperature.
The tension–compression asymmetry of yield stress in the extruded Mg
90Y
6.5Ni
3.5, with strength in compression shown to be significantly greater than strength in tension, has been previously reported in the Mg-Y-Zn alloys [
26] and it is opposite to that observed in extruded magnesium alloys. SRD experiments during compressive tests at room temperature and 300 °C have been carried out to study in detail the influence of the test temperature on the mechanical anisotropic behavior.
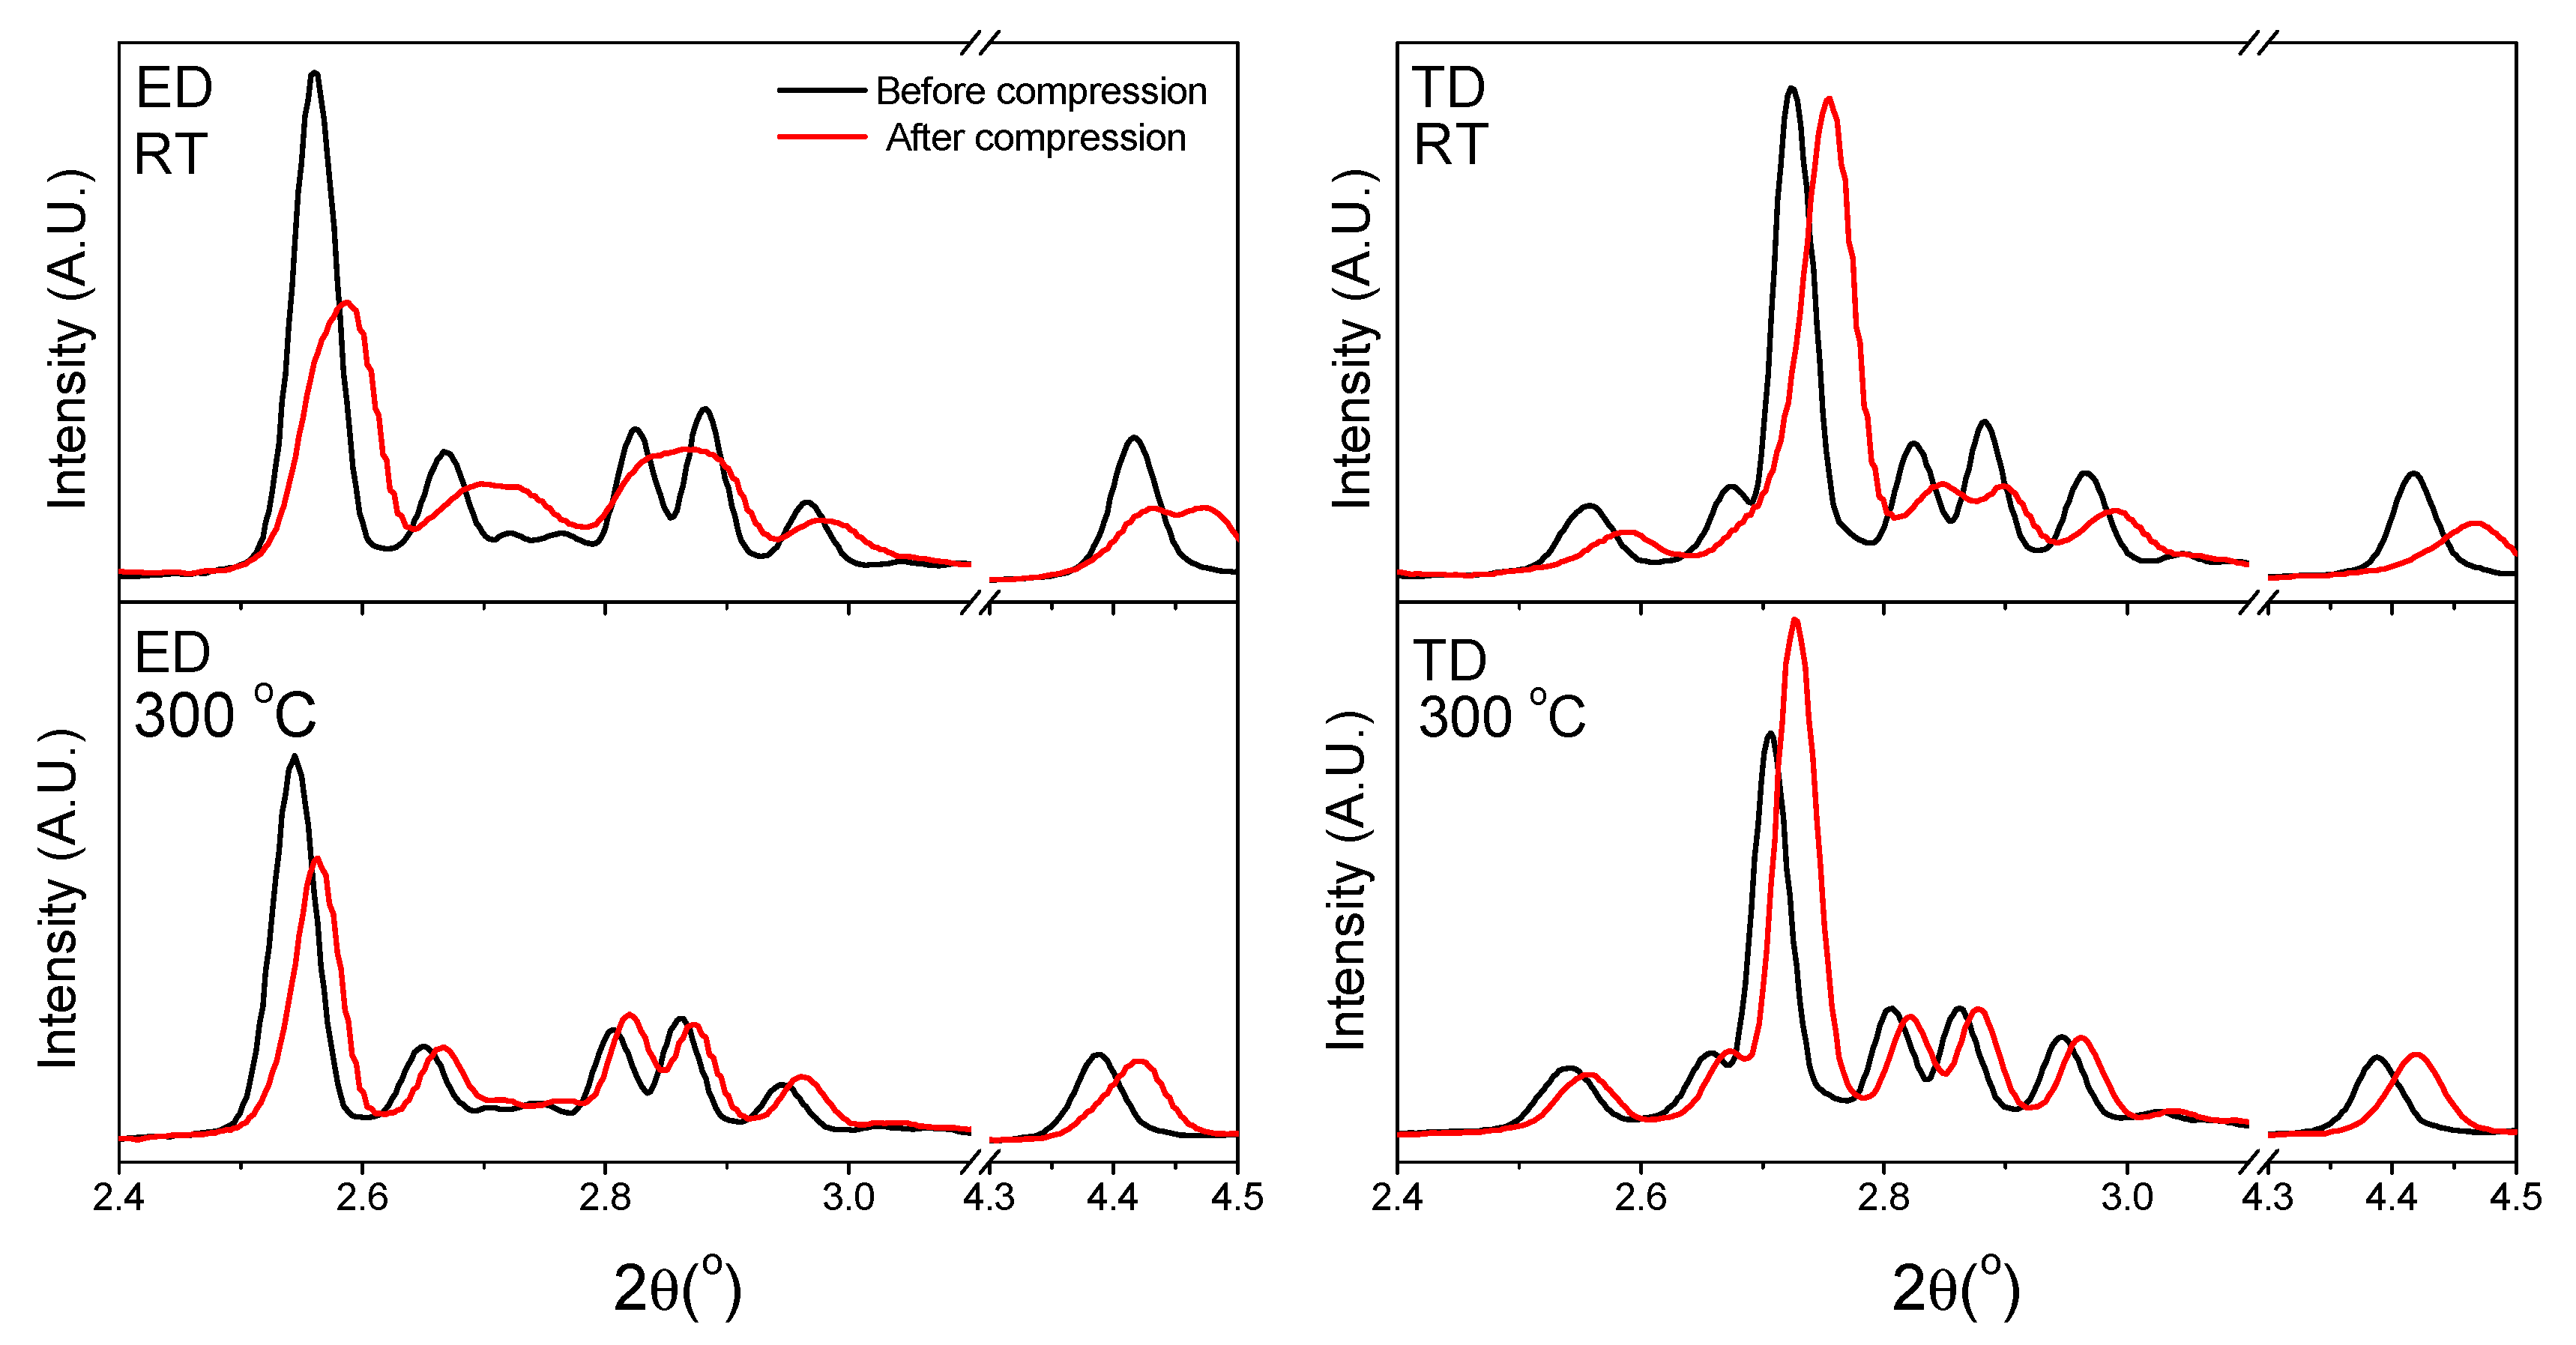
Figure 4 shows the integrated synchrotron diffraction patterns in axial direction, (obtained from images similar to
Figure 2a), before (σ = 0 MPa) and after the compression tests (ε around 8–10%) for both loading orientations (ED and TD) at RT and 300 °C, respectively. In ED, the diffraction peak with the highest intensity, due to the strong fiber texture described in the above sections, corresponds to {4
2}
18R planes ({10
0}
Mg planes in the magnesium hexagonal crystal structure) perpendicular to the axial direction. After compression (red line), diffraction peaks were shifted to higher values of 2θ (lower d values). Moreover, the intensity of diffraction peaks slightly decreased and the peak width highly increased. On the other hand, in TD, the diffraction peak with the highest intensity in the axial direction corresponded to {00018}
18R planes perpendicular to the axial direction. Similar to ED, diffraction peaks were shifted to higher 2θ values and they were broader compared to initial diffraction peaks before the compression test. The intensity of diffraction peaks did not change significantly. Diffraction patterns obtained at 300 °C follow the same behavior as room temperature. However, the peak shift and peak width for a similar plastic strain were lower than at room temperature.
Figure 5b,c,f,g shows the evolution of the elastic strains in the axial and radial direction, obtained from Equation (1), as a function of the applied stress for the {4
2}
18R({10
0}
Mg), {00018}
18R ((0002
Mg), {4
8}
18R, {30
12}
18R ({10
1}
Mg) and {60
0}
18R ({11
0}
Mg) diffraction peaks of the 18R structure at room temperature and 300 °C. The compressive curves for both cases were also plotted for comparison purposes (
Figure 5a,e). At room temperature, the macroscopic yield stress was 510 and 320 MPa in ED and TD, respectively. The stress difference between both directions was in agreement with compressive yield stress data shown in
Figure 3. In ED at room temperature, diffraction peaks show a linear elastic behavior in the elastic regime except for the {30
12}
18R diffraction peak that lost its linearity at 350 MPa. This diffraction peak in the rhombohedral 18R crystal structure was equivalent to the {10
1}
Mg diffraction peak in the hexagonal structure of the magnesium phase. Although, the extruded alloy exhibited a strong fiber texture with the basal plane parallel to the extrusion direction, there were also grains with other orientations, which were favorable oriented to the activate the basal slip system. However, since their volume fraction is small, they had no influence in the macroscopic mechanical behavior. At yield stress, the elastic strain corresponding to the {4
2}
18R diffraction peak in the axial direction begin to lose its linearity (marked with and arrow in
Figure 5b). This effect was accompanied with the rapid increase in the elastic strain, higher than in the elastic slope, of the {00018}
18R diffraction peak in the radial direction (around 2000 µstrains) while the internal strain of all other diffraction peaks remained constant.
At higher temperature,
Figure 5f, the analysis was more complex since the elastic strains of almost all diffraction peaks lost their linearity at different applied stresses due to the activation of different deformation systems. In ED at 300 °C, the yield stress was around 225 MPa, which was connected with the progressive loss of linearity of the {4
2}
18R diffraction peak, similar to the compression test at room temperature.
The evolution of the elastic strains as a function of the applied stress in the sample tested along TD at room temperature was similar to the ED condition, but changes in the internal strain of each family of grains took place at lower applied stress values. The elastic strains of all diffraction peaks (axial and radial directions) show a linear elastic behavior below the macroscopic yield stress except for the {30
12}
18R that lost its linearity at 250 MPa. The elastic strain corresponding to the {4
2}
18R diffraction peak in the axial direction lost its linearity at higher stress than the macroscopic yield stress. Therefore, the macroscopic yield stress was nearest to the loss of linearity of {30
12}
18R that corresponds to the slip of <a> dislocations in the basal plane. It is important to point out that in TD, the {00018}
18R diffraction peak exhibited the highest integrated intensity in the axial direction and, therefore, the evolution of the elastic strain could be calculated. The elastic strain remained elastic up to 450 MPa. At 300 °C, the behavior was again similar to room temperature (
Figure 5g) and only internal strain changes occurred at lower applied stress values.
Magnesium alloys developed a strong fiber texture during the extrusion process with the basal plane parallel to the extrusion direction, similar to that observed in the Mg
90Y
6.5Ni
3.5 alloy. Under compression along the extrusion direction, extension twinning should be activated. Extension twinning induced a rotation of the basal plane, which was oriented almost perpendicular to the compression axis after plastic deformation. This crystal rotation results in a strong decrease in the intensity of the {10
0}
Mg diffraction peak.
Figure 5d and h show the evolution of the integrated intensity in logarithmic scale of the {4
2}
18R({10
0}
Mg) as a function of the applied stress in the axial direction. The intensity was almost constant or slightly decreased when the internal strain of the {4
2}
18R diffraction peak lost its linearity. Therefore, extension twinning seemed not to occur during compression along the extrusion and transversal directions.
4. Discussion
The microstructure of the Mg
90Y
6.5Ni
3.5 was characterized by 18R-LPSO coarse grains elongated along the extrusion direction and oriented with their basal plane parallel to the extrusion direction. This microstructure was in agreement with previous studies in a similar alloy after hot rolling [
29]. In both cases, islands of magnesium elongated along the extrusion direction are observed at LPSO boundaries. Magnesium islands are solidified previous to the solidification of the LPSO phase in the as-cast condition due to their higher melting point compared to the LPSO phase [
31].
Several crystal structures have been reported for the LPSO phases in the Mg-Ni-Y system. Depending on the Ni and Y content and thermal treatment of the alloy 10H, 12R, 14H, 18R and 24R were reported [
29,
32,
33,
34,
35,
36,
37,
38]. Wang et al. [
34] studied the Mg-Ni-Y equilibrium diagram using a thermodynamic calculation. They proposed that the 18R structure was stable during the cast and transforms to 14H at around 535 °C. Moreover, the 18R structure could also transform to 10H trough a solid-state reaction at around 450 °C. On the other hand, Jiang et al. [
35] have reported that the 14H structure is thermodynamically stable in the Mg-Ni-Y system. In the MgY
2Zn
1 alloy, the 18R crystal structure transformed to 14H (hexagonal) after a thermal treatment at temperatures higher than 300 °C. The synchrotron diffraction pattern allowed distinguishing univocally between the different crystal structures at low diffraction angles. The (0003) diffracted peak of the 18R structure (P3
212, a = 1.11 nm and 4.69 nm [
15]) appeared at 0.45°, the (0002) diffracted peak of the 14H structure (P63/mcm, a = 1.11 nm and c = 3.62 nm [
15]) appeared at 0.39°and the (0002) diffracted peak of the 10H structure (P63/mcm, a = 1.11 nm and c = 2.60 nm [
39]) at 0.55°.
Figure 2b clearly showed that only 18R structure was present after the extrusion at 450 °C. Therefore, the extrusion process was not sufficient to transform the 18R structure. The 18R lattice parameter values correspond very closely to those obtained for the 18R structure of the cast Mg-Y-Zn [
31].
The alloy composition and the microstructure of the extruded bar examined here was essentially similar to that reported earlier by Itoi et al. [
29] on hot rolled alloy. Even, the mechanical yield stress in the rolling direction was similar to the tensile behavior in ED (
Figure 3d). Although, the hot rolled alloy exhibited higher elongation than the extruded alloy at room temperature.
The main deformation mechanism reported in the 18R structure in the Mg-Y-Zn system was the slip of <a> dislocations in the basal plane. The critical resolved shear stress is around 10 MPa [
23].
Figure 6 shows a scheme of the microstructure of the extruded bar and the texture of the elongated LPSO grains with the basal plane parallel to the extrusion direction. In the Mg
90Y
6.5Ni
3.5 alloy, elongated grains were oriented with their basal planes parallel to the extrusion direction. Therefore, the slip of <a> dislocations in the basal plane was inhibited under the load along the extrusion direction. This fact would result in a loss of ductility of the extruded Mg
90Y
6.5Ni
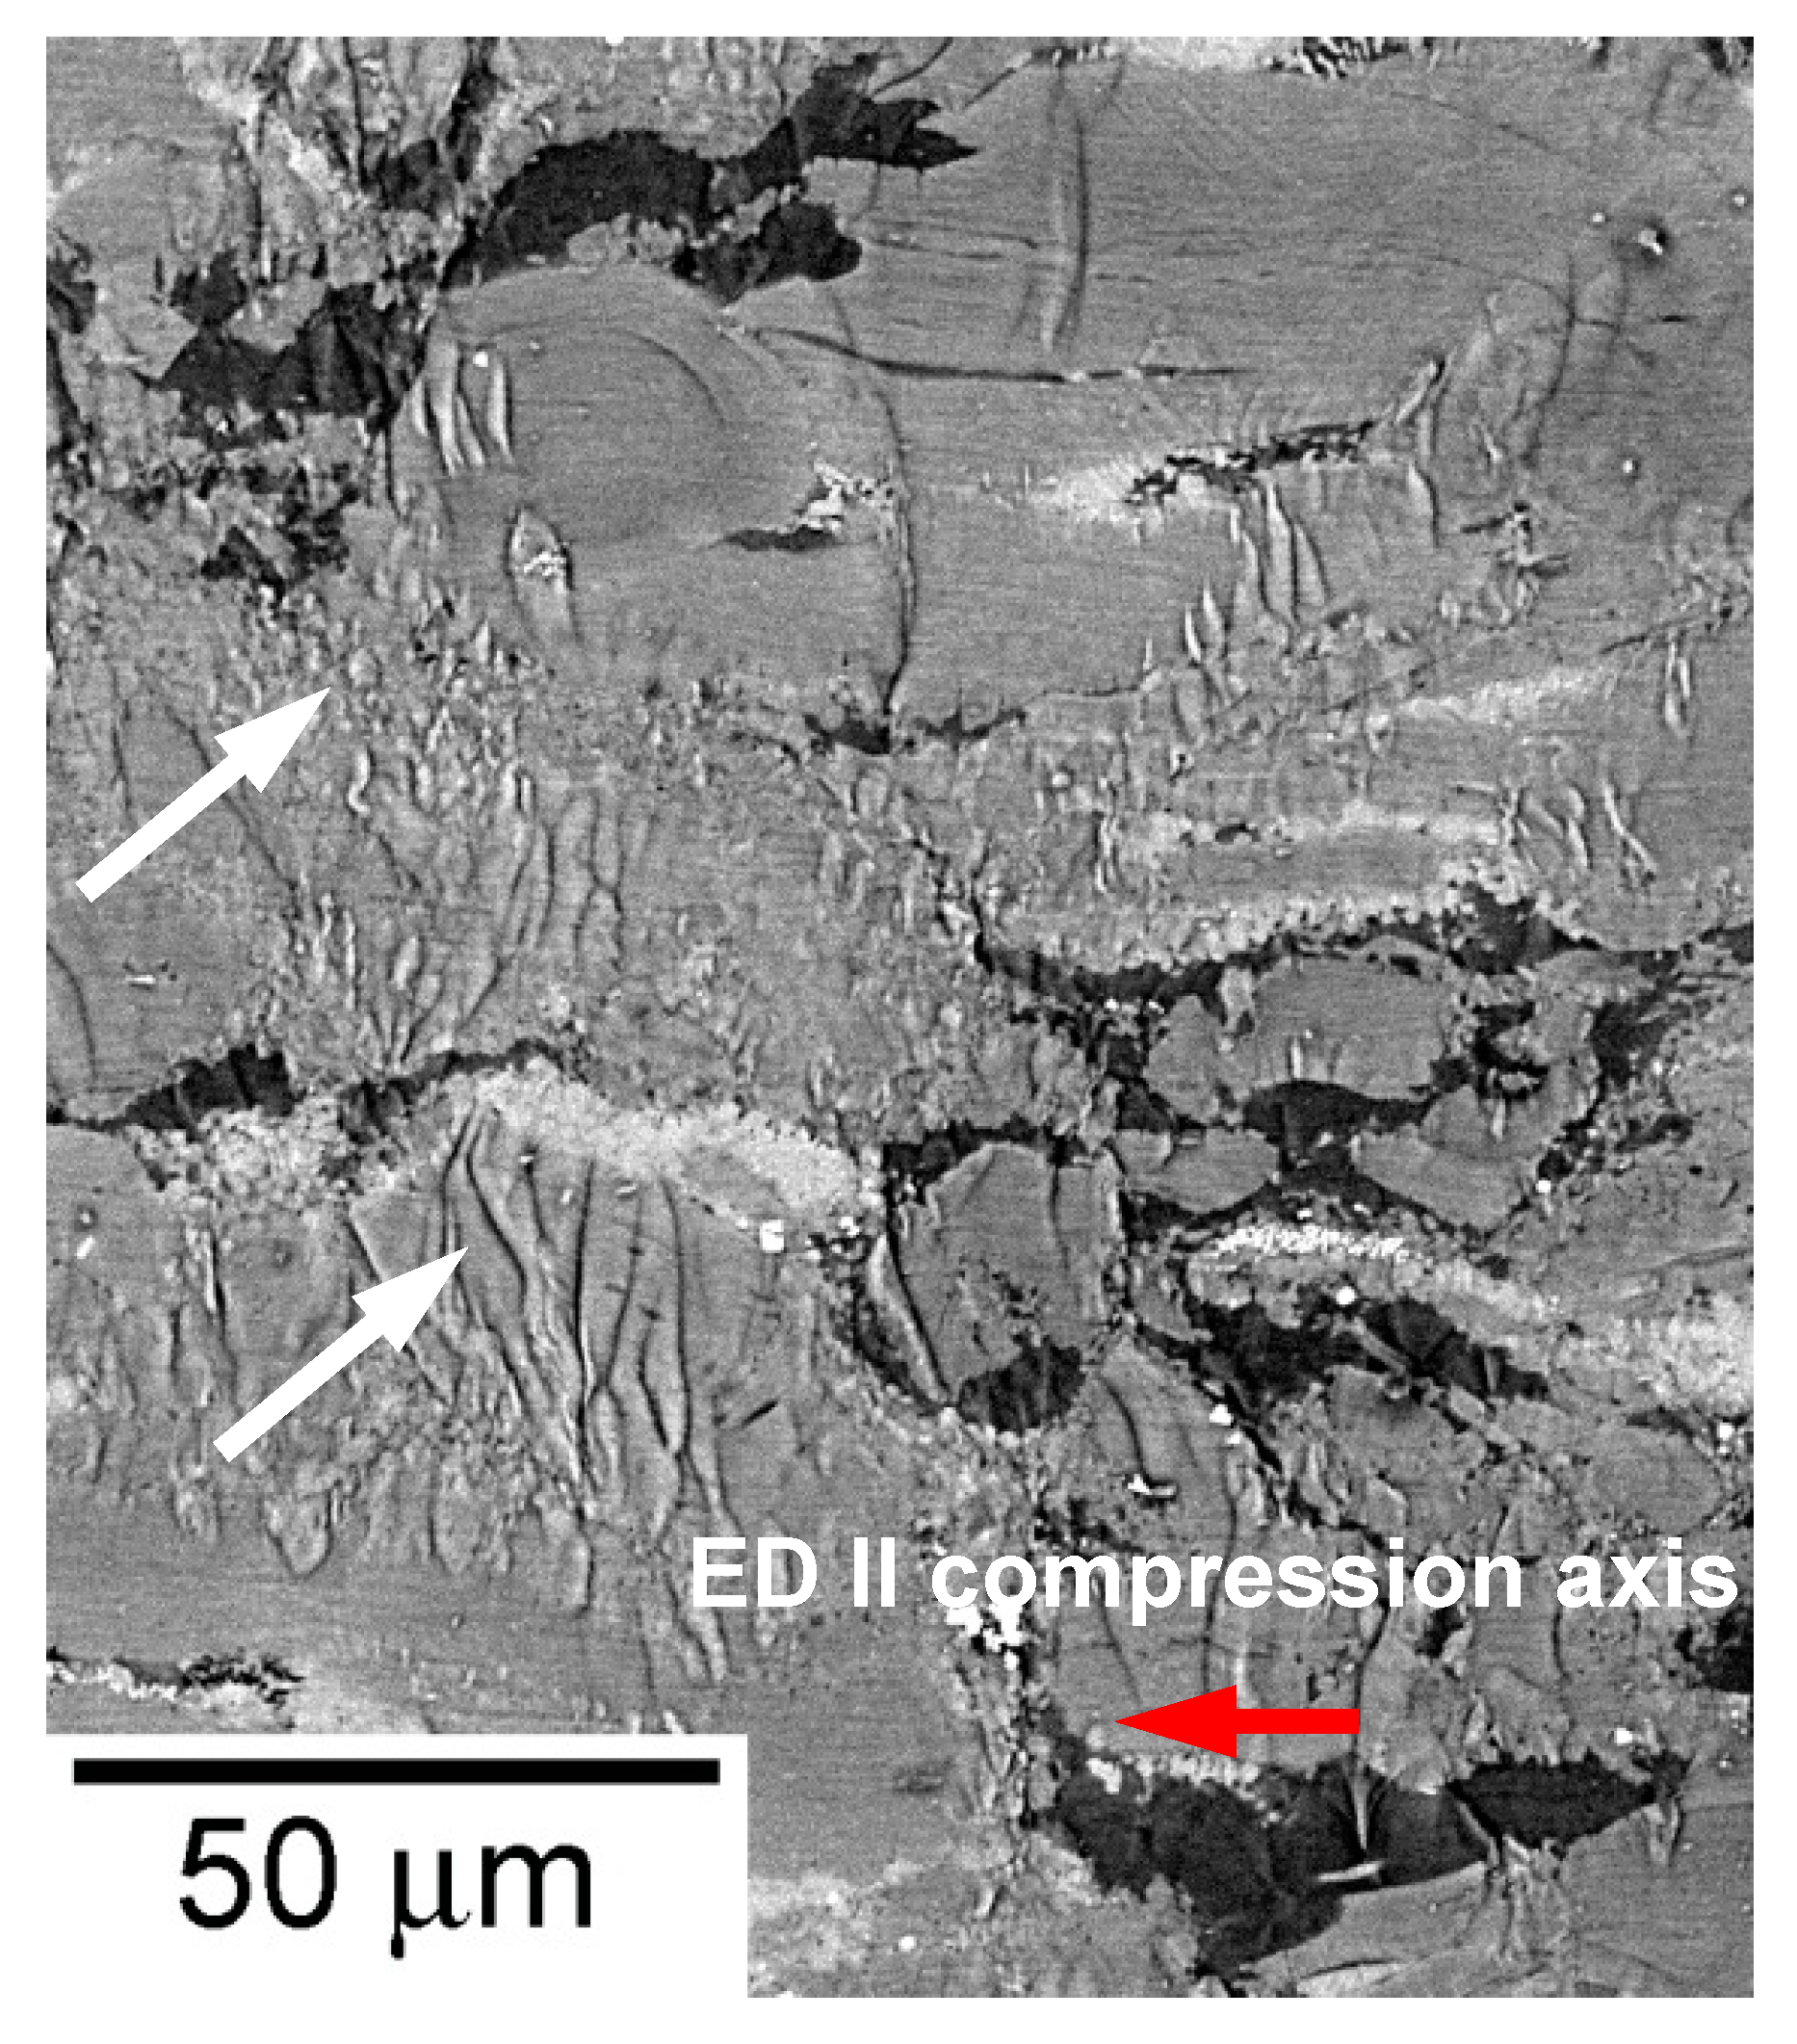
3.5 alloy not only in tension but also in compression. However, the compression test along the extrusion direction was stopped at a plastic strain of 0.1 without sample failure. The microstructural characterization of the polished surface of the compressive sample after deformation exhibited a high volume fraction of kinks (
Figure 7). The formation of kink bands is connected with the presence of basal dislocations [
23]. Mayama et al. [
40] has demonstrated using crystal plasticity simulation that small fluctuation (around 3°) from the perfect orientation between the [0002] and compression axis results in a strong decrease in the onset of plasticity due to the activation of kinking. The loss of linearity of the {4
2}
18R diffraction peak was, therefore, related with the activation of kinking. The formation of a kink band induced an elastic strain along the radial direction in the basal plane of the LPSO phase. At 300 °C, the plasticity was still controlled by the activation of kinking. However, the stress decreased almost by 275 MPa.
On the other hand, in the TD condition, there was a volume fraction of grains that were well-oriented for the activation of the basal slip and, therefore, yield stress highly decreased. However, there were still grains oriented with the basal plane parallel or perpendicular to the compression axis where the slip of <a> dislocations in the basal plane was forbidden and, therefore, kinking was activated. At 300 °C, the applied stress for the activation of kinking was the same as in the ED mode. Therefore, the decrease of the yield stress in TD was caused by the higher decrease in the CRSS of the basal slip system at 300 °C.
The evolution of internal strains and intensities of diffraction peaks shown in
Figure 5 seemed to reveal that tensile twinning did not occur during deformation of the extruded Mg
90Y
6.5Ni
3.5 alloy. The activation of the tensile twinning in magnesium alloys presented two main characteristics. On one hand, tensile twinning induced a rotation of 86° of the basal plane within the twin area. Therefore, the intensity of the (0002)
Mg diffraction peak increased during the compression test at the expense of the {10
0}
Mg diffraction peak due to the formation of twins. On the other hand, the internal strain as a function of the applied stress of twins oriented with the (0002)
Mg planes perpendicular to the compression axis highly increased faster than in the elastic regime. The appearance of the diffraction peak corresponding to the basal plane, {00018} in the 18R crystal structure, was not observed in the axial direction during the complete compression test, as it was observed in
Figure 5. In contract, the diffraction peaks were broader compared to the initial width due to kinking. Kinking induced the local rotation (±10°) of the basal planes between kink bands and initial grains.


