A Comparative Study on Blast-Resistant Performance of Steel and PVA Fiber-Reinforced Concrete: Experimental and Numerical Analyses

 ,
, 
Abstract
:1. Introduction
2. Experimental Program
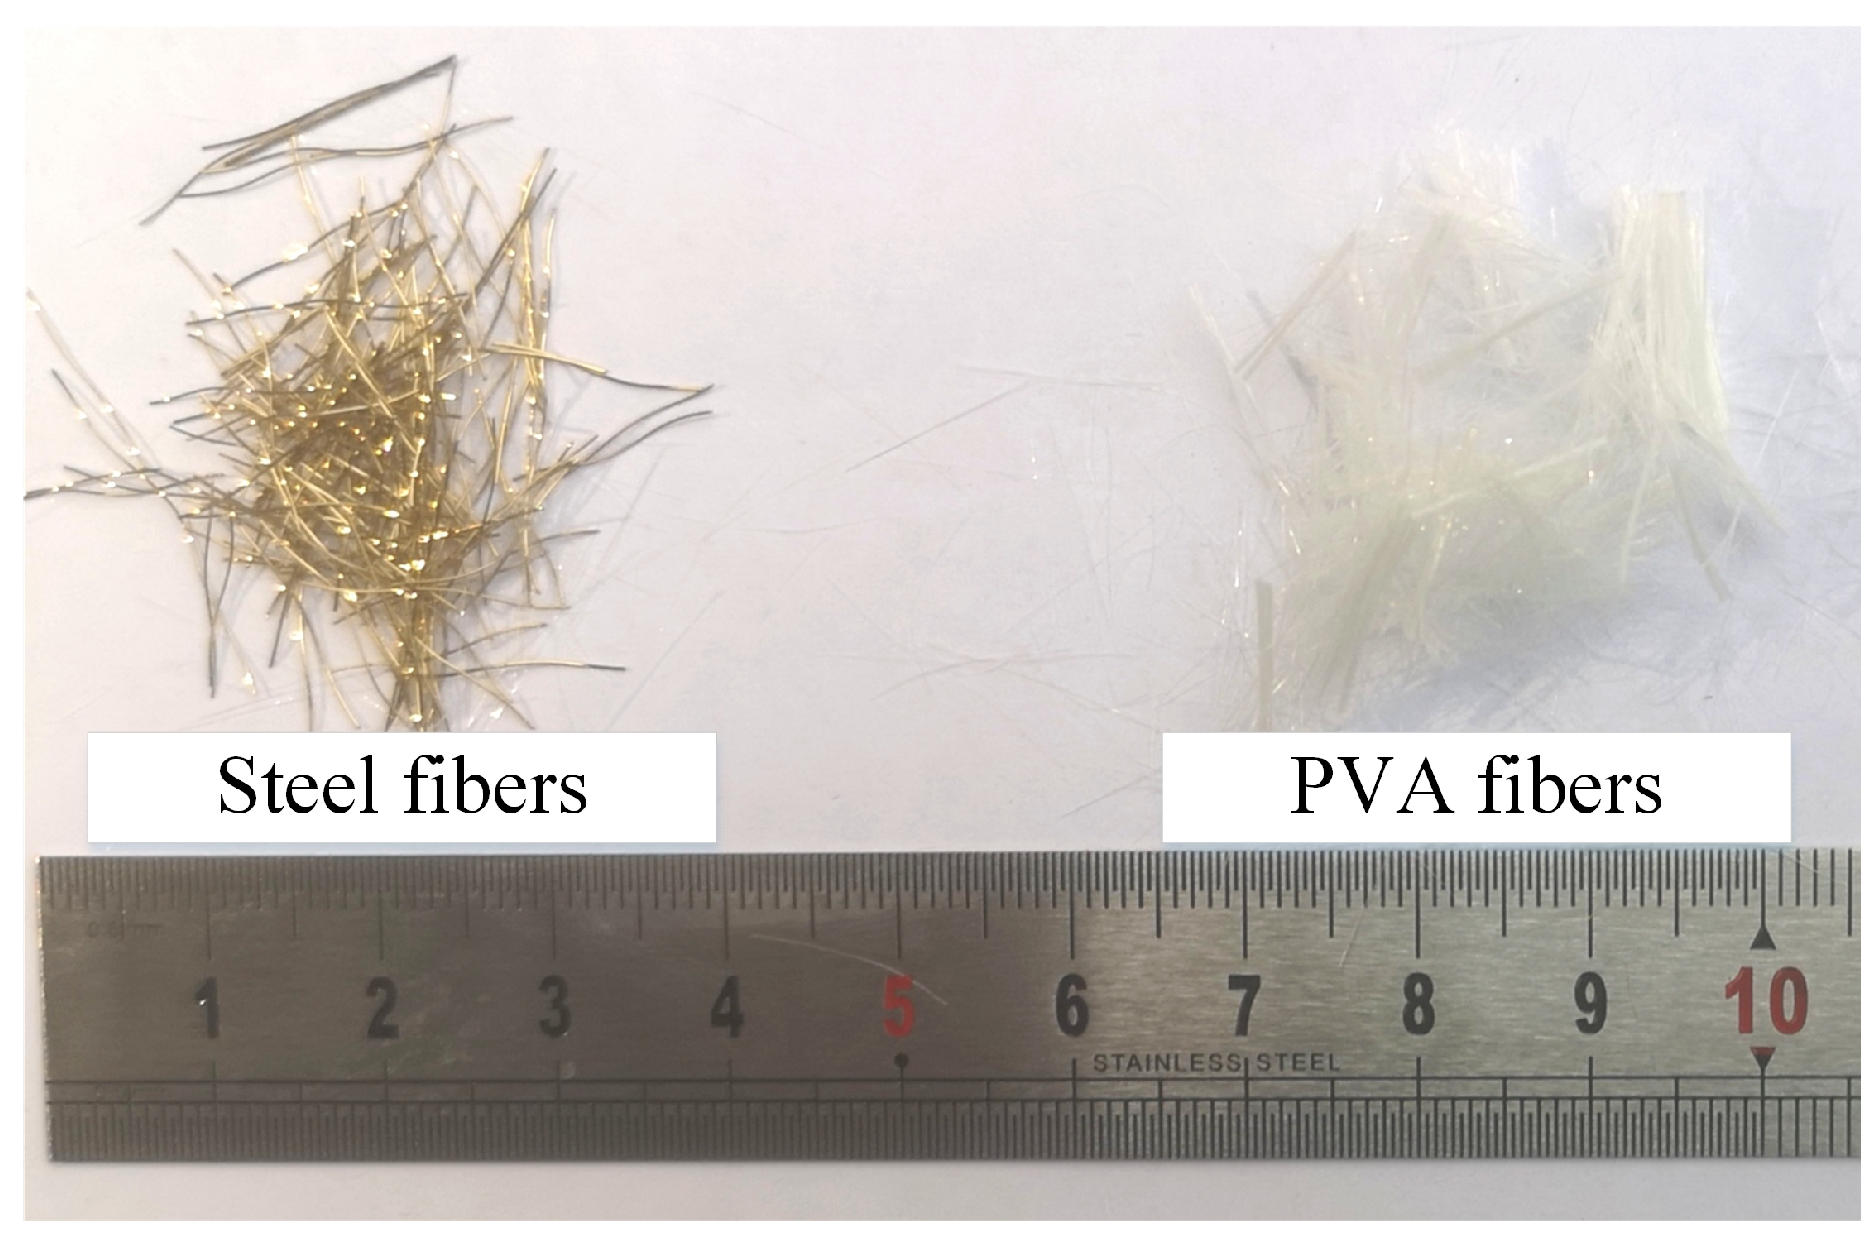
2.1. FRC Preparation
2.2. Compression and Bending Tests
2.3. Blast Test
3. Review of LDPM-F
3.1. LDPM Model Construction
3.2. LDPM Kinematics
3.3. LDPM Constitutive Equations
3.4. Formulation of LDPM-F
4. Numerical Modeling of FRC Contact Detonation
4.1. LDPM-F Parameter Calibration
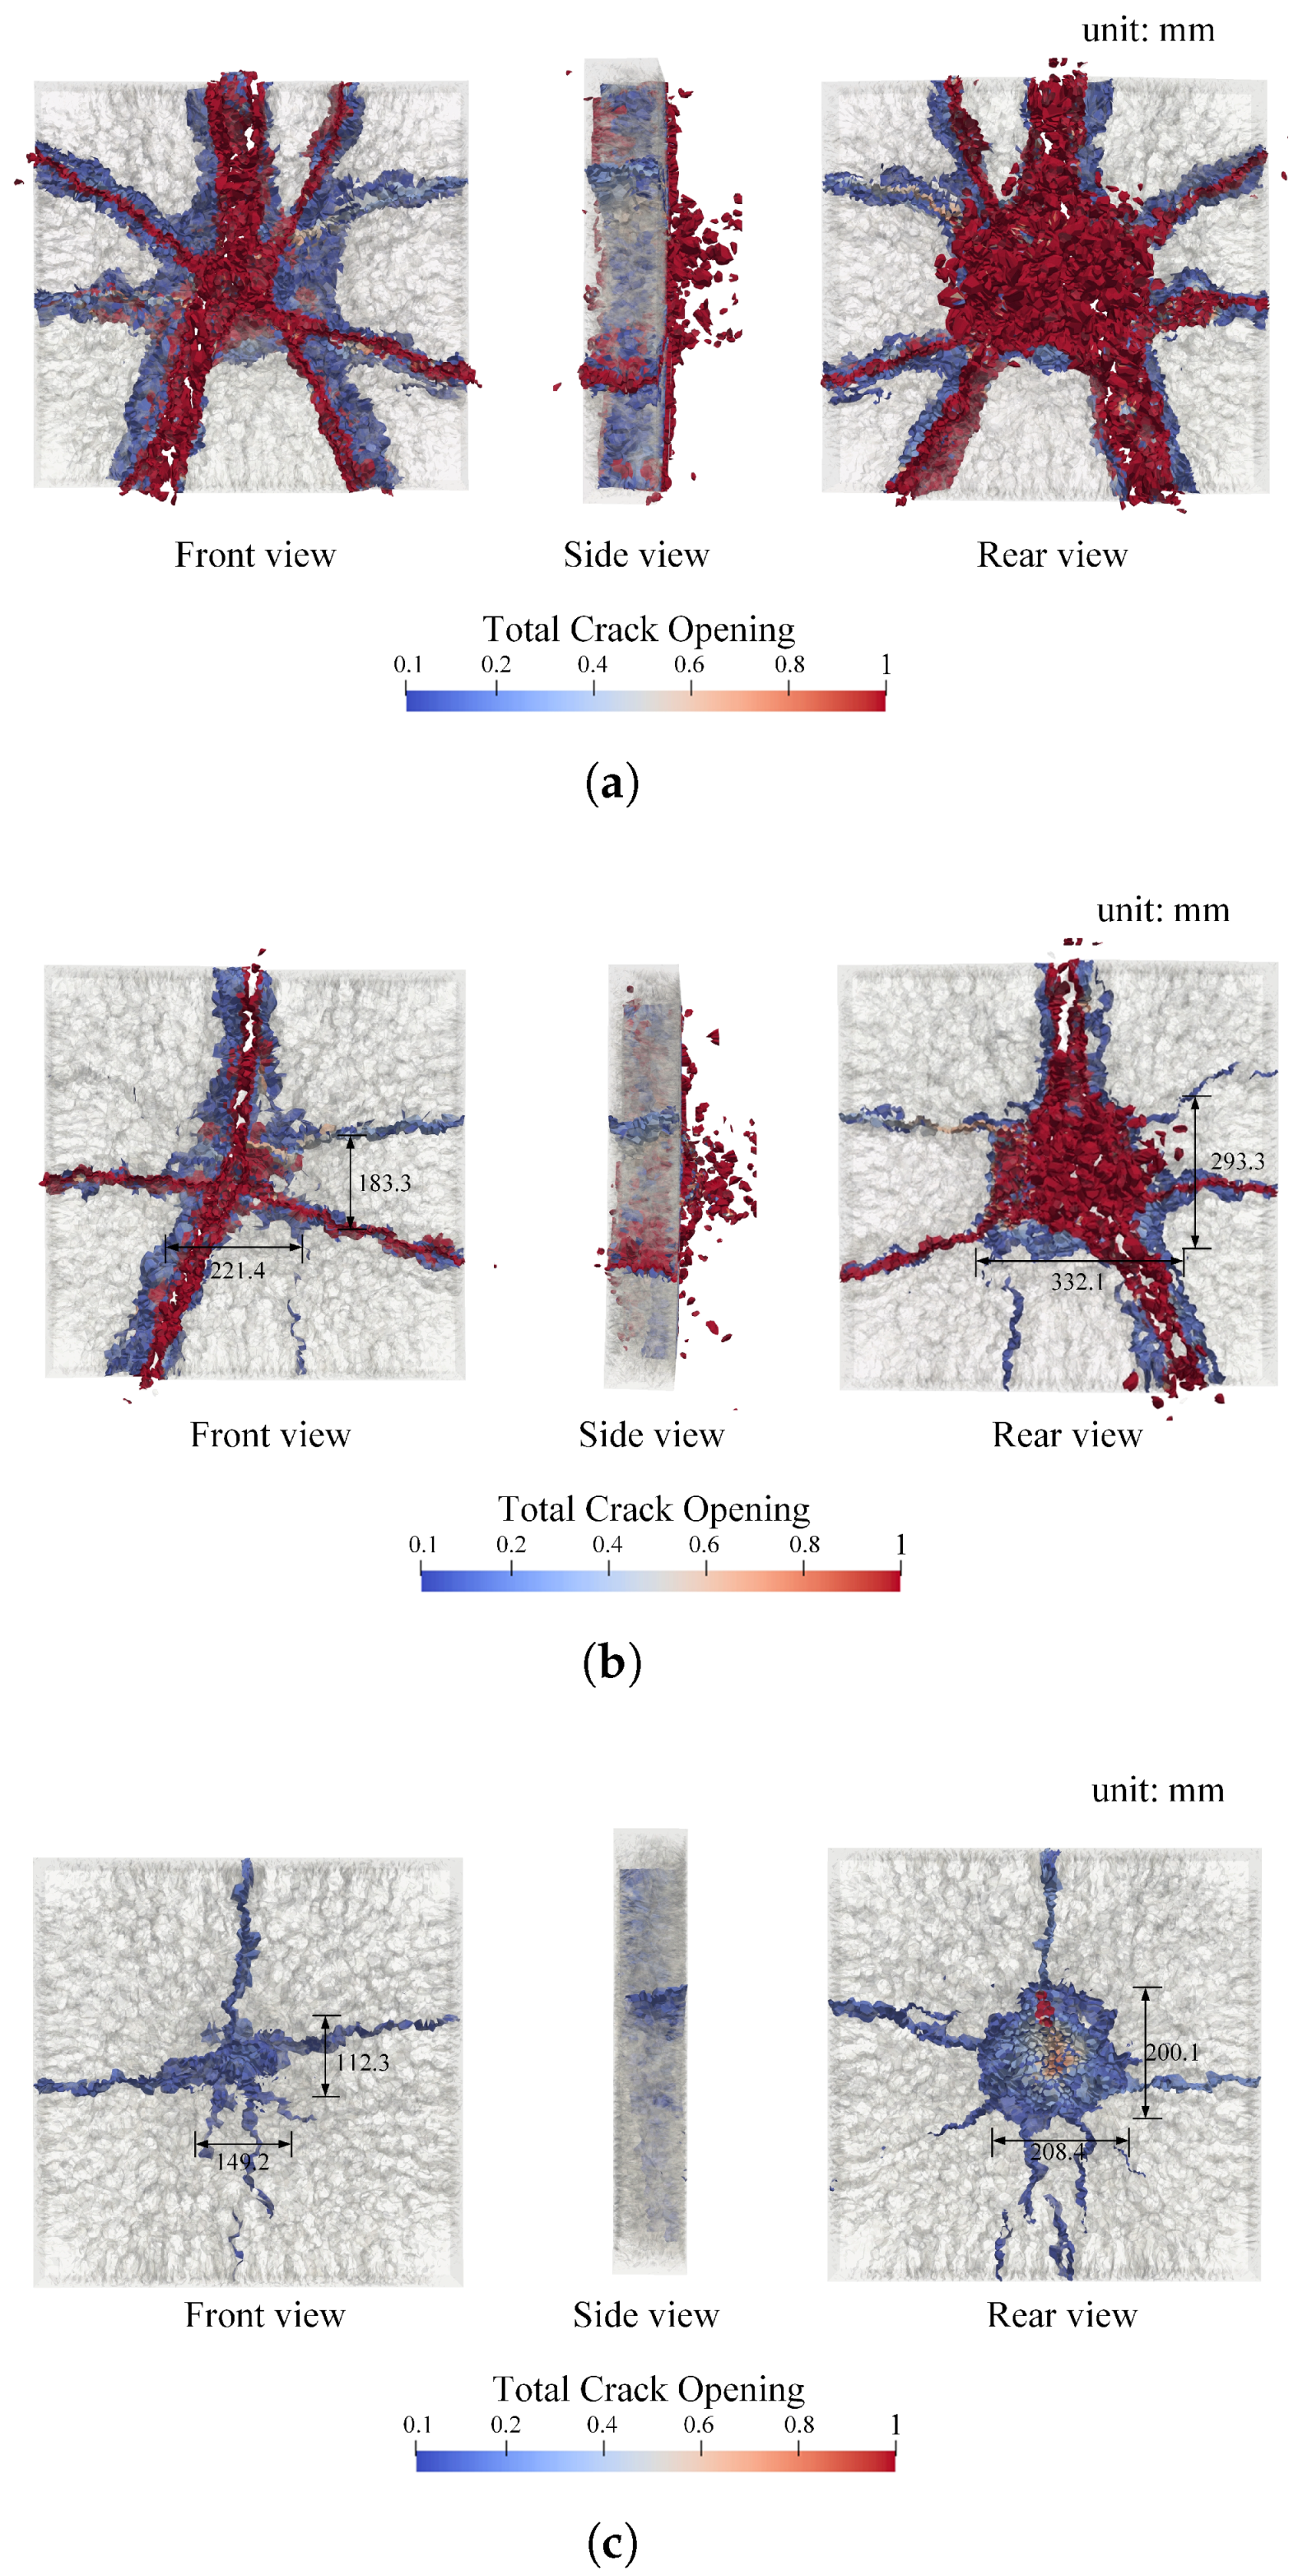
4.2. FRC Blast Simulation
4.3. Fiber Content Effect
5. Conclusions
Author Contributions
Funding
Acknowledgments
Conflicts of Interest
References
- Yoo, D.; Banthia, N. Mechanical and structural behaviors of ultra-high-performance fiber-reinforced concrete subjected to impact and blast. Constr. Build. Mater. 2017, 149, 416–431. [Google Scholar] [CrossRef]
- Feng, J.; Sun, W.; Wang, L.; Chen, L.; Xue, S.; Li, W. Terminal ballistic and static impactive loading on thick concrete target. Constr. Build. Mater. 2020, 251, 118899. [Google Scholar] [CrossRef]
- Wang, Z.L.; Shi, Z.M.; Wang, J. On the strength and toughness properties of sfrc under static-dynamic compression. Compos. Part B Eng. 2011, 42, 1285–1290. [Google Scholar] [CrossRef]
- Liu, J.; Han, F.; Cui, G.; Zhang, Q.; Lv, J.; Zhang, L.; Yang, Z. Combined effect of coarse aggregate and fiber on tensile behavior of ultra-high performance concrete. Constr. Build. Mater. 2016, 121, 310–318. [Google Scholar] [CrossRef]
- Simoes, T.; Octavio, C.; Valenca, J.; Costa, H.; Diasdacosta, D.; Julio, E. Influence of concrete strength and steel fibre geometry on the fibre/matrix interface. Compos. Part B Eng. 2017, 122, 156–164. [Google Scholar] [CrossRef] [Green Version]
- Li, P.P.; Brouwers, J.; Yu, Q.Q. Influence of key design parameters of ultra-high performance fibre reinforced concrete on in-service bullet resistance. Int. J. Impact Eng. 2020, 136, 103434. [Google Scholar] [CrossRef]
- Zhang, W.; Chen, S.; Zhang, N.; Zhou, Y. Low-velocity flexural impact response of steel fiber reinforced concrete subjected to freeze–thaw cycles in nacl solution. Constr. Build. Mater. 2015, 101, 522–526. [Google Scholar] [CrossRef]
- Hong, K.; Lee, S.; Han, S.; Yeon, Y. Evaluation of fe-based shape memory alloy (fe-sma) as strengthening material for reinforced concrete structures. Appl. Sci. 2018, 8, 730. [Google Scholar] [CrossRef] [Green Version]
- Picazo, A.; Alberti, M.G.; Galvez, J.C.; Enfedaque, A.; Vega, A.C. The size effect on flexural fracture of polyolefin fibre reinforced concrete. Appl. Sci. 2019, 9, 1762. [Google Scholar] [CrossRef] [Green Version]
- Feldman, D. Fibre reinforced cementitious composites. Can. J. Civ. Eng. 1993, 20, 341. [Google Scholar] [CrossRef]
- Soe, K.; Zhang, Y.X.; Zhang, L. Material properties of a new hybrid fibre-reinforced engineered cementitious composite. Constr. Build. Mater. 2013, 43, 399–407. [Google Scholar] [CrossRef]
- Halvaei, M.; Jamshidi, M.; Latifi, M. Investigation on pullout behavior of different polymeric fibers from fine aggregates concrete. J. Ind. Text. 2016, 45, 995–1008. [Google Scholar] [CrossRef]
- Halvaei, M.; Jamshidi, M.; Pakravan, H.R.; Latifi, M. Interfacial bonding of fine aggregate concrete to low modulus fibers. Constr. Build. Mater. 2015, 95, 117–123. [Google Scholar] [CrossRef]
- Sim, J.; Park, C.; Moon, D.Y. Characteristics of basalt fiber as a strengthening material for concrete structures. Compos. Part B Eng. 2005, 36, 504–512. [Google Scholar] [CrossRef]
- Martinezperez, I.; Valivonis, J.; Salna, R.; Coboescamilla, A. Experimental study of flexural behaviour of layered steel fibre reinforced concrete beams. J. Civ. Eng. Manag. 2017, 23, 806–813. [Google Scholar] [CrossRef] [Green Version]
- Jin, C.; Buratti, N.; Stacchini, M.; Savoia, M.; Cusatis, G. Lattice discrete particle modeling of fiber reinforced concrete: Experiments and simulations. Eur. J. Mech. A Solids 2016, 57, 85–107. [Google Scholar] [CrossRef] [Green Version]
- Hassan, A.M.T.; Jones, S.W.; Mahmud, G.H. Experimental test methods to determine the uniaxial tensile and compressive behaviour of ultra high performance fibre reinforced concrete (uhpfrc). Constr. Build. Mater. 2012, 37, 874–882. [Google Scholar] [CrossRef]
- Pan, Z.; Wu, C.; Liu, J.; Wang, W.; Liu, J. Study on mechanical properties of cost-effective polyvinyl alcohol engineered cementitious composites (pva-ecc). Constr. Build. Mater. 2015, 78, 397–404. [Google Scholar] [CrossRef]
- Feng, J.; Sun, W.; Zhai, H.; Wang, L.; Dong, H.; Wu, Q. Experimental study on hybrid effect evaluation of fiber reinforced concrete subjected to drop weight impacts. Materials 2018, 11, 2563. [Google Scholar] [CrossRef] [Green Version]
- Olivito, R.S.; Zuccarello, F.A. An experimental study on the tensile strength of steel fiber reinforced concrete. Compos. Part B Eng. 2010, 41, 246–255. [Google Scholar] [CrossRef]
- Habel, K.; Gauvreau, P. Response of ultra-high performance fiber reinforced concrete (uhpfrc) to impact and static loading. Cem. Concr. Compos. 2008, 30, 938–946. [Google Scholar] [CrossRef]
- Nili, M.; Afroughsabet, V. Combined effect of silica fume and steel fibers on the impact resistance and mechanical properties of concrete. Int. J. Impact Eng. 2010, 37, 879–886. [Google Scholar] [CrossRef] [Green Version]
- Nia, A.A.; Hedayatian, M.; Nili, M.; Sabet, V.A. An experimental and numerical study on how steel and polypropylene fibers affect the impact resistance in fiber-reinforced concrete. Int. J. Impact Eng. 2012, 46, 62–73. [Google Scholar]
- Naaman, A.E.; Najm, H. Bond-slip mechanisms of steel fibers in concrete. Materials 1991, 88, 135–145. [Google Scholar]
- Lee, Y.; Kang, S.; Kim, J. Pullout behavior of inclined steel fiber in an ultra-high strength cementitious matrix. Constr. Build. Mater. 2010, 24, 2030–2041. [Google Scholar] [CrossRef]
- Abdallah, S.; Fan, M.; Rees, D.W.A. Bonding mechanisms and strength of steel fiber–reinforced cementitious composites: Overview. J. Mater. Civ. Eng. 2018, 30, 04018001. [Google Scholar] [CrossRef]
- Marcalikova, Z.; Cajka, R.; Bilek, V.; Bujdos, D.; Sucharda, O. Determination of mechanical characteristics for fiber-reinforced concrete with straight and hooked fibers. Crystals 2020, 10, 545. [Google Scholar] [CrossRef]
- Ma, H.; Cai, J.; Lin, Z.; Qian, S.; Li, V.C. CaCO3 whisker modified engineered cementitious composite with local ingredients. Constr. Build. Mater. 2017, 151, 1–8. [Google Scholar] [CrossRef]
- Yao, W.; Sun, W.; Shi, Z.; Chen, B.; Chen, L.; Feng, J. Blast-resistant performance of hybrid fiber-reinforced concrete (hfrc) panels subjected to contact detonation. Appl. Sci. 2019, 10, 241. [Google Scholar] [CrossRef] [Green Version]
- Yusof, M.A.; Nor, N.M.; Ismail, A.; Peng, N.C.; Sohaimi, R.M.; Yahya, M.A. Performance of hybrid steel fibers reinforced concrete subjected to air blast loading. Adv. Mater. Sci. Eng. 2013, 2013, 420136. [Google Scholar] [CrossRef] [Green Version]
- Feng, J.; Gao, X.; Li, J.; Dong, H.; He, Q.; Liang, J.; Sun, W. Penetration resistance of hybrid-fiber-reinforced high-strength concrete under projectile multi-impact. Constr. Build. Mater. 2019, 202, 341–352. [Google Scholar] [CrossRef]
- Huang, S.; Yuan, Z.; Fish, J. Computational framework for short-steel fiber-reinforced ultra-high performance concrete (cor-tuf). Int. J. Multiscale Comput. Eng. 2019, 17, 551–562. [Google Scholar] [CrossRef]
- Yang, F.; Xie, W.; Meng, S. Impact and blast performance enhancement in bio-inspired helicoidal structures: A numerical study. J. Mech. Phys. Solids 2020, 142, 104025. [Google Scholar] [CrossRef]
- Cusatis, G.; Pelessone, D.; Mencarelli, A. Lattice discrete particle model (ldpm) for failure behavior of concrete. I: Theory. Cem. Concr. Compos. 2011, 33, 881–890. [Google Scholar] [CrossRef]
- Schauffert, E.A.; Cusatis, G. Lattice discrete particle model for fiber-reinforced concrete. I: Theory. J. Eng. Mech. 2011, 138, 826–833. [Google Scholar] [CrossRef]
- Feng, J.; Yao, W.; Li, W.; Li, W. Lattice discrete particle modeling of plain concrete perforation responses. Int. J. Impact Eng. 2017, 109, 39–51. [Google Scholar] [CrossRef]
- Yang, S.; Millard, S.; Soutsos, M.; Barnett, S.; Le, T.T. Influence of aggregate and curing regime on the mechanical properties of ultra-high performance fibre reinforced concrete (uhpfrc). Constr. Build. Mater. 2009, 23, 2291–2298. [Google Scholar] [CrossRef]
- Cao, M.; Zhang, C.; Li, Y.; Wei, J. Using calcium carbonate whisker in hybrid fiber-reinforced cementitious composites. J. Mater. Civ. Eng. 2015, 27, 04014139. [Google Scholar] [CrossRef]
- Cao, M.; Zhang, C.; Wei, J. Microscopic reinforcement for cement based composite materials. Constr. Build. Mater. 2013, 40, 14–25. [Google Scholar] [CrossRef]
- Kanda, T.; Li, V.C. Practical design criteria for saturated pseudo strain hardening behavior in ecc. J. Adv. Concr. Technol. 2006, 4, 59–72. [Google Scholar] [CrossRef] [Green Version]
- Feng, J.; Song, M.; Sun, W.; Wang, L.; Li, W.; Li, W. Thick plain concrete targets subjected to high speed penetration of 30crmnsini2a steel projectiles: Tests and analyses. Int. J. Impact Eng. 2018, 122, 305–317. [Google Scholar] [CrossRef]
- Shen, L.; Li, W.; Zhou, X.; Feng, J.; Di Luzio, G.; Ren, Q.; Cusatis, G. Multiphysics lattice discrete particle model for the simulation of concrete thermal spalling. Cem. Concr. Compos. 2020, 106, 103457. [Google Scholar] [CrossRef] [Green Version]
- Stroeven, P. A stereological approach to roughness of fracture surfaces and tortuosity of transport paths in concrete. Cem. Concr. Compos. 2000, 22, 331–341. [Google Scholar] [CrossRef]
- Cusatis, G.; Rezakhani, R.; Schauffert, E.A. Discontinuous cell method (dcm) for the simulation of cohesive fracture and fragmentation of continuous media. Eng. Fract. Mech. 2017, 170, 1–22. [Google Scholar] [CrossRef] [Green Version]
- Rezakhani, R.; Cusatis, G. Asymptotic expansion homogenization of discrete fine-scale models with rotational degrees of freedom for the simulation of quasi-brittle materials. J. Mech. Phys. Solids 2016, 88, 320–345. [Google Scholar] [CrossRef] [Green Version]
- Yang, E.-H.; Yang, Y.; Li, V.C. Use of high volumes of fly ash to improve ecc mechanical properties and material greenness. ACI Mater. J. 2007, 104, 620. [Google Scholar]
- Lin, Z.; Kanda, T.; Li, V.C. On interface property characterization and performance of fiber reinforced cementitious composites. J. Concr. Sci. Eng. 1999, 1, 173–184. [Google Scholar]
- Feng, J.; Sun, W.; Liu, Z.; Cui, C.; Wang, X. An armour-piercing projectile penetration in a double-layered target of ultra-high-performance fiber reinforced concrete and armour steel: Experimental and numerical analyses. Mater. Des. 2016, 102, 131–141. [Google Scholar] [CrossRef]
- Leung, C.K.; Ybanez, N. Pullout of inclined flexible fiber in cementitious composite. J. Eng. Mech. 1997, 123, 239–246. [Google Scholar] [CrossRef]
- Leung, C.K.; Chi, J. Crack-bridging force in random ductile fiber brittle matrix composites. J. Eng. Mech. 1995, 121, 1315–1324. [Google Scholar] [CrossRef]
- Yang, E.-H.; Wang, S.; Yang, Y.; Li, V.C. Fiber-bridging constitutive law of engineered cementitious composites. J. Adv. Concr. Technol. 2008, 6, 181–193. [Google Scholar] [CrossRef] [Green Version]
- Feng, J.; Song, M.; He, Q.; Sun, W.; Wang, L.; Luo, K. Numerical study on the hard projectile perforation on rc panels with ldpm. Constr. Build. Mater. 2018, 183, 58–74. [Google Scholar] [CrossRef]


| Cement | Fly Ash | Water | Quartz Sand | Superplasticizer |
|---|---|---|---|---|
| 1.00 | 0.125 | 0.25 | 0.45 | 0.02 |
| Fiber Type | Diameter (m) | Length (mm) | Density (g/cm) | Tensile Strength (MPa) | Elastic Modulus (GPa) |
|---|---|---|---|---|---|
| PVA | 30 | 12–15 | 1.30 | 1000 | 8 |
| Steel | 220 | 12–15 | 7.85 | 1200 | 200 |
| Test Data | PC | PVA-FRC | SFRC |
|---|---|---|---|
| Flexural strength (MPa) | 8.67 | 12.34 | 26.95 |
| Compressive strength (MPa) | 70.57 | 84.81 | 109.66 |
| No. | Quantity | PVA Fiber Volume Ratio (%) | Steel Fiber Volume Ratio (%) |
|---|---|---|---|
| S1 | 2 | - | - |
| S2 | 2 | 2.00 | - |
| S3 | 2 | - | 2.00 |
| No. | Front Crater Size (mm) | Front Crater Depth (mm) | Rear Crater Size (mm) |
|---|---|---|---|
| S1-1 | - | - | - |
| S1-2 | - | - | - |
| S2-1 | 245 × 320 | - | 336 × 390 |
| S2-2 | 234 × 289 | - | 207 × 273 |
| S3-1 | 139 × 156 | 20 | 230 × 290 |
| S3-2 | 152 × 204 | 33 | 241 × 280 |
| [MPa] | [-] | [MPa] | [MPa] | [-] | [mm] | [-] | [-] | [MPa] | [-] |
|---|---|---|---|---|---|---|---|---|---|
| 80,610 | 0.25 | 4.55 | 150 | 5.55 | 200 | 0.1 | 0.4 | 600 | 4 |
| Fiber Type | [MPa] | [-] | [MPa] | [-] | [-] | [MPa] | [N/m] | [-] | [-] |
|---|---|---|---|---|---|---|---|---|---|
| Steel fiber | 210,000 | 500 | 2800 | 0.2 | 0.2 | 6.0 | 0.0 | 0.0 | 0.6 |
| PVA fiber | 30,000 | 300 | 1000 | 0.0 | 0.2 | 2.5 | 3 | 0.05 | 1.0 |
| No. | Front Surface (mm) | Rear Surface (mm) |
|---|---|---|
| S2-1 | 245 × 320 | 336 × 390 |
| S2-2 | 234 × 289 | 207 × 273 |
| Simulation prediction | 183 × 221 | 293 × 332 |
| No. | Front Surface (mm) | Rear Surface (mm) |
|---|---|---|
| S3-1 | 139 × 156 | 230 × 290 |
| S3-2 | 152 × 204 | 241 × 280 |
| Simulation prediction | 112 × 149 | 200 × 208 |
| Fiber Content | Front Surface (mm) | Rear Surface (mm) |
|---|---|---|
| 0.5% | 139 × 210 | 280 × 299 |
| 1.0% | 120 × 161 | 272 × 281 |
| 1.5% | 200 × 144 | 265 × 241 |
| 2.0% | 112 × 149 | 200 × 208 |
© 2020 by the authors. Licensee MDPI, Basel, Switzerland. This article is an open access article distributed under the terms and conditions of the Creative Commons Attribution (CC BY) license (http://creativecommons.org/licenses/by/4.0/).
Share and Cite
Chen, L.; Sun, W.; Chen, B.; Xu, S.; Liang, J.; Ding, C.; Feng, J. A Comparative Study on Blast-Resistant Performance of Steel and PVA Fiber-Reinforced Concrete: Experimental and Numerical Analyses. Crystals 2020, 10, 707. https://doi.org/10.3390/cryst10080707
Chen L, Sun W, Chen B, Xu S, Liang J, Ding C, Feng J. A Comparative Study on Blast-Resistant Performance of Steel and PVA Fiber-Reinforced Concrete: Experimental and Numerical Analyses. Crystals. 2020; 10(8):707. https://doi.org/10.3390/cryst10080707
Chicago/Turabian StyleChen, Le, Weiwei Sun, Bingcheng Chen, Sen Xu, Jianguo Liang, Chufan Ding, and Jun Feng. 2020. "A Comparative Study on Blast-Resistant Performance of Steel and PVA Fiber-Reinforced Concrete: Experimental and Numerical Analyses" Crystals 10, no. 8: 707. https://doi.org/10.3390/cryst10080707
APA StyleChen, L., Sun, W., Chen, B., Xu, S., Liang, J., Ding, C., & Feng, J. (2020). A Comparative Study on Blast-Resistant Performance of Steel and PVA Fiber-Reinforced Concrete: Experimental and Numerical Analyses. Crystals, 10(8), 707. https://doi.org/10.3390/cryst10080707