Article

Relationship among Initial Texture, Deformation Mechanism, Mechanical Properties, and Texture Evolution during Uniaxial Compression of AZ31 Magnesium Alloy

1
Engineering Research Center Heavy Machinery Ministry of Education, Taiyuan University of Science and Technology, Taiyuan 030024, China
2
School of Mechanics and Architectural Engineering, Jinan University, Guangzhou 510632, China
*
Author to whom correspondence should be addressed.
Crystals 2020, 10(9), 738; https://doi.org/10.3390/cryst10090738
Submission received: 27 July 2020 / Revised: 14 August 2020 / Accepted: 18 August 2020 / Published: 21 August 2020
(This article belongs to the Special Issue Processing and Characterization of Magnesium-Based Materials)

Abstract

:
Cuboid samples with significant initial texture differences were cut from extruded AZ31 Mg alloy samples, whose long axis and bar extrusion direction ED were 0° (sample E0), 45° (sample E45), and 90° (sample E90). The relationship among the initial texture, deformation mechanism, mechanical properties, and texture evolution of the AZ31 Mg alloy was investigated systematically using a compression test, microstructure characterization, and the Viscoplastic Self-Consistent (VPSC) model. Results revealed a close relationship among them. By influencing the activation of the deformation mechanism, the deformation under different initial textures resulted in obvious mechanical anisotropy. Compared with E0 and E90, the initial texture of E45 was more conducive to the improvement of reforming ability after pre-compression. Meanwhile, the initial texture significantly affected the microstructure characteristics of the material, especially the number and morphology of the {10–12} tensile twins. Texture results showed that the priority of deformation mechanism depended on the initial texture and led to the difference in texture evolution.

Graphical Abstract

1. Introduction

Mg alloy has high specific stiffness, high specific strength, low density, and good damping performance [1], hence an important choice for material application in the fields of communication, military industry, and automobile [2,3,4]. AZ31 is one of the most widely applied variants among Mg alloys. Experimental studies showed that the initial texture in the forming process of Mg alloy has a remarkable effect on its material properties [5,6,7,8,9,10].
The rolling direction (RD) and transverse direction (TD) samples with distinct differences in initial texture were subsequently subjected to the bending process that has been reported by Wang [11] et al., and the results revealed that the conspicuous asymmetry in the bending behavior is ascribed to the initial texture and weaker basal texture is favorable to improving the bending properties. Singh [12] investigated and compared the micromechanical deformation behavior of E-form fine grain (EFG), E-form coarse grain (ECG), and AZ31 Mg alloys by using a mini V-bending test. The EFG and ECG Mg alloys with weaker texture have better bendability than the AZ31 alloys with stronger texture. Xiong [13] investigated the asymmetrical planar mechanical behavior of an extruded AZ31 sheet possessing bimodal texture distribution. The results indicated that the plastic deformation mechanism activated in the c-axis//TD textured grains during rolling is sensitive to the rolling paths. Therefore, initial texture plays an important role in the plastic deformation of Mg alloys. Wang [11] pointed out that the selection of a dominant mechanism is highly dependent on the initial texture of Mg alloys, including the activation of {10–12} tension twins upon compression perpendicular or tension parallel to the c-axis. Consequently, the difference in initial texture affects the twin deformation [14,15,16,17], and the deflection of crystal orientation caused by twinning makes the texture evolution more complicated [18,19,20,21]. Therefore, the relationship among initial texture, deformation mechanism, mechanical properties, and texture evolution during plastic deformation of Mg alloy must be studied.
The most commonly used technical methods for analyzing and studying material texture at present are X-ray diffraction (XRD) and electron backscattering diffraction (EBSD) [22]. However, the shortcomings of these two experimental methods are their high cost of testing, the difficulty of sample preparation, and the long experimental period. On the basis of the common optical reflection method, Gaskey [23] realized the grain orientation characterization of metal Ni and semiconductor Si wafers under the directional reflection microscope (DRM). However, the disadvantage of this experimental method is its inability to quantitatively study the effects of slip and twinning on texture evolution. The proposed Viscoplastic Self-Consistent (VPSC) model [24,25] solves the problem of studying metal plastic deformation from the perspective of microscopic deformation mechanism. Su [26] et al. used the VPSC model with different deformation mechanisms to investigate the influence of a secondary deformation mechanism (prismatic <a> slip, pyramidal <c+a> slip, and { 10   1 ¯ 1 } compression twin) on mechanical response and texture evolution, and a VPSC model was established to simulate the plastic deformation of magnesium alloy.
Chapuis [27] used VPSC to simulate the plastic deformation and deformed texture of Mg-3Al-1Zn plate and compared them with the experimental observations. The results demonstrated that the {10–12} extension twins are responsible for the main texture variations. Zhang [28] used VPSC to investigate the in-plane anisotropy of a Mg alloy AZ31B-O sheet. The hexagonal close-packed crystallographic structure, deformation twinning, and initial basal texture are responsible for the characteristic behavior of Mg alloys. Alireza [29] also used VPSC to investigate the effect of alloying elements on Mg’s tensile behavior, specifically the relative activity of different slip and twinning modes. The VPSC model has been successfully applied to predict the mechanical behavior and deformation texture of Mg alloys under different plastic deformations [30].
In this paper, E0, E45, and E90 cuboid samples along the long axis and extrusion direction of 0°, 45°, and 90° were cut from the extruded AZ31 Mg alloy bar for a uniaxial compression experiment at room temperature. The VPSC model and Predominant Twin Reorientation (PTR) scheme [31] were used to simulate the mechanical behavior and texture evolution of the different initial texture samples under uniaxial compression, and the anisotropic behavior and texture evolution differences in Mg alloy samples were analyzed from the perspective of a microscopic deformation mechanism. The microstructure and deformed texture were characterized by EBSD and compared with the simulation results. The relationship among initial texture, deformation mechanism, mechanical properties, and texture evolution were studied.

2. Materials and Methods

2.1. Sample Preparation

The extrusion direction of magnesium alloy is expressed by ED, and the transverse and normal directions perpendicular to the extrusion direction are expressed by TD and ND, respectively. In addition, 8 mm × 8 mm × 12 mm cuboids with different orientations were cut from extruded AZ31 Mg alloy samples, as shown in Figure 1b, whose long axis and bar extrusion ED were 0° (sample E0), 45° (sample E45), and 90° (sample E90), as shown in Figure 1a. Compression tests at a strain rate of 10−3 s−1 and loading direction along the long axis were carried out on the electronic universal testing machine (model: WDW-E100D) provided by Changchun new testing machine Co., Ltd in Jilin Province of China at room temperature.
The original and compressed samples were cut to 10 × 7 × 6 mm in length, width, and height to avoid damaging the electron microscope lens. After plastic deformation, EBSD was conducted on the JEOL JSM-7800F field emission scanning electron microscope provided by Oxford Instrument Technology (Shanghai) Co., Ltd in China to analyze the microscopic structure, crystal orientation, and structural characteristics of the sample. Mechanical grinding and electrochemical polishing were finished when preparing EBSD. In mechanical grinding, the sample was polished to 2000 # with sandpaper until there was no scratch on the surface. Then, electrolytic polishing was carried out. AC2 solution is used as a polishing solution, and the formula is shown in Table 1. The polishing parameters are as follows: voltage 20 V, temperature −30 °C, polishing time 120 s, polishing current 0.03–0.08 A. The sample was cleaned with alcohol after polishing. The voltage of the EBSD data collection is 20 kV, the inclination angle is 70°, the current is 15 mA, and the working distance is 15 mm. Channel 5 software is used to process the data collected.
The microstructure and grain size of the longitudinal section (ED–TD plane) of E0 sample were characterized by EBSD, as shown in Figure 1c. Most of the initial samples had an equiaxed crystal structure, and the average grain size was 25.5 μm, as shown in Figure 1d. According to the calculation formula of standard deviation (SD), the SD was 0.73. Besides, some elongated grains were revealed due to the grain stretching along the ED during extrusion.

2.2. VPSC-PTR Model

The VPSC model considers the interaction between grains in polycrystals and assumes that the grains are ellipsoid, and the model adopts the following rate-dependent continuous constitutive model equation [24]:
ε i j ( x ¯ ) = s m i j s γ s ( x ¯ ) = γ 0 s m i j s { m k l s σ k l ( x ¯ ) τ s } n = M i j k l σ k l ( x ¯ )
where τ s denotes the critical shear stress, m i j s = 1 2 ( n i s b j s + b j s n i s ) is the Schmid factor of the slip system/twin system(s), n s and b s represent the normal direction (ND) of the slip/twin plane and the slip/twin direction, respectively. ε i j ( x ¯ ) and σ k l ( x ¯ ) are the strain and stress partial tensors, respectively. γ s stands for the local shear rate acting on the slip system(s). γ 0 represents the normalized coefficient, and n is the rate sensitivity index. M i j k l stands for the viscoplastic convention and can relate the macroscopic strain rate to the macroscopic deviatoric stress.
The critical shear stress τ s is formed with the accumulation of shear amount in each grain. Therefore, the evolution rules can be described by the Voce hardening model:
τ s = τ 0 s + ( τ 1 s + θ 1 s Γ ) ( 1 exp ( θ 0 s Γ τ 1 s ) )
where Γ = s Δ γ s is the cumulative shear of the grain, τ 0 denotes the initial critical stress, θ 0 stands for the initial hardening rate, θ 1 refers to the saturation hardening rate, τ 0 s and τ 1 s are the initial and extrapolated critical shear stresses of mechanisms, respectively. Figure 2 depicts the specific definitions.
In this study, PTR [31] is used to analyze the effect of twins on texture evolution during plastic deformation. For grain g, γ t , g is the shear strain caused by each twin t, and the corresponding twin volume fraction is V t , g = γ t , g / S t , where S t is the intrinsic shear strain of twin system t.
The integral number of twins caused by all twin systems in all grains is called the cumulative twin integral number:
V a c c , m o d e = g t γ t , g / S t
Through superimposition of the twin fraction of each incremental step, the cumulative twin fraction is compared with the critical volume fraction caused by twins. Thus, the critical volume fraction is defined as:
V t h , m o d e = A t h 1 + A t h 2 V e f f , m o d e V a c c , m o d e
where V e f f , m o d e is the effective twin crystal integral number, A t h 1 and A t h 2 are material constants.

3. Results and Discussion

The input data on the crystallographic orientation required for VPSC modeling were extracted from the EBSD map measured in Figure 1 through the orientation distribution function used by the toolbox MTEX in MATLAB code, as described in the literature [32]. A total of 2000 discrete directions with the same volume fraction were used for VPSC modeling. The input data required for modeling were described in detail in the literature [26], hence not discussed here. The detailed procedure for the calculation in the VPSC model has been well documented by Li et al. [33].
Given the different dominant deformation mechanisms of Mg alloys under different loading modes, according to Figure 2, the hardening parameters of deformation mechanisms could be obtained by simulating the stress-strain curves of specific loading experiments. The specific fitting method is as follows: first, the hardening parameters of basal slip and prismatic slip were determined by fitting the compression results of E90. Then, the hardening parameters of pyramidal slip were determined by fitting the compression results of E45. Finally, the hardening parameters of tensile and compression twinnings were determined using the compression results of E0. The results of the fitting curve are shown in Figure 3. The differences in initial texture resulted in obvious mechanical anisotropy in the stress-strain curves of various samples. In the initial pole figure of E0, most of the c-axis of the grain was perpendicular to the ED; that is, the basal was parallel to the ED, resulting in a strong basal texture in the initial pole figure distribution of Mg alloy, as shown in Figure 3c. When the E45 sample was compressed, the initial texture was rotated along the ED direction by 45°, and the resulting texture is shown in Figure 3b. Similarly, the macroscopic strain rate and stress along the TD directions were the loading conditions of the E90 sample, as shown in Figure 3a. Analysis of the stress-strain curves of the different samples indicated that the stress-strain curves of E45 and E90 were similar to “S,” and the flow stress of E90 was higher than that of E45. The stress-strain curve of E0 had a certain s-shaped characteristic, but it was not significant, and its yield strength was slightly higher than that of E45 and E90. The stress-strain curves predicted by the VPSC model were in good agreement with the experimental results and accurately reflected the stress-strain characteristics of each stage in the axial tension and compression plastic deformation process.
The optimal hardening parameters of different deformation mechanisms were determined, as shown in Table 2. Results show that at room temperature, the critical resolved shear stress (CRSS) of basal <a> slip [18] (approximately 0.45–0.81 MPa) < the CRSS of the {10-12} tension twin [19] (approximately 2–2.8 MPa) < the CRSS of the prismatic <a> slip [34] (approximately 39.2 MPa) < the CRSS of the pyramidal <c+a> slip [35] (approximately 45–81 MPa) < the CRSS of the {10-11} compression twin [25] (approximately 76–153 MPa) of magnesium and its alloys. Table 2 presents that the CRSS of the overall size order is consistent with the research value. Optimal hardening parameters play an important guiding role for future researchers to study the macro- and micro-deformation mechanisms of magnesium alloys.
Figure 4 shows the prediction results of the relative activating amount of the deformation mechanism during the compression deformation of samples with different initial textures. At the initial stage of deformation, the deformation mechanism of E0 was dominated by tensile twin, supplemented by basal slip. The dominant deformation mode of E45 and E90 was basal slip, supplemented by tensile twin, while CRSS tensile twin > CRSS basal slip. As a result, the yield stress of E0 was slightly greater than that of E45 and E90. Figure 4a illustrates that when E0 was compressed, the activation of the tensile twin decreased as the compression amount continued to increase, and the activation of the basal, prismatic, and pyramidal slips increased. This finding was attributed to the twin growth and fusion behavior of the specimen in the later stage of deformation [19], resulting in a surface phenomenon, wherein the twin volume fraction decreases due to the disappearance of twin boundaries. Figure 4b,c show that E45 and E90 also had a small role in the activation of tensile twins at the initial deformation stage. During the compression process of E45 and E90 samples, the c-axis of the grain was in a state of tensile stress for the part of the grain nearly perpendicular to the direction of the application, which was conducive to the activation of tensile twins. With the increase in strain, the activity of the pyramidal slip of E90 was significantly greater than that of E45, while the pyramidal slip of CRSS was higher. This difference was reflected in the stress-strain curve, where the flow stress of E90 was higher than that of E45 [22].
Figure 5a–c shows the predicted and experimental texture with axial compression of E0, E45 and E90 samples to 8% by using the VPSC model. Through comparison, it can be seen that the simulation results with 2000 gains are in good agreement with the experimental results, which reasonably reflects the texture evolution during compression of the E0, E45 and E90 samples and verified the accuracy of the VPSC model in simulating the texture evolution of magnesium alloy in this study.
Figure 6 shows the prediction results of {0001} pole figure during uniaxial compression of the samples with different initial textures. As shown in Figure 6a, when E0 was compressed to ε = 0.02, a large peak value was rapidly formed in the TD direction of the {0001} grain, while the peak value near the ND direction was weakened due to the activation of {10–12} tensile twins (Figure 3a). This activation resulted in a mutation of ~90° in the grain c-axis, with {0001} basal deflected from parallel to compression direction to perpendicular to compression direction. With the increase in strain, the number of tensile twins increased, the peak value in the TD direction continued to increase, and the strength peak near the ND direction gradually disappeared. Besides, the orientation peak dispersion in the TD direction of {0001} surface increased slightly with the increase in strain, possibly due to the formation of new grains at the intersection of the twins brought by dynamic recrystallization similar to that in the original tensile twins but with slight deflection [36,37]. As shown in Figure 6b, when E45 was compressed to ε = 0.04, the peak value of the strength of {0001} plane turned to near the direction of force application (direction 2). The reason was because when it was compressed along direction 2, the deformation mechanism at the initial stage of deformation was dominated by basal slip (Figure 4b), which could not change the grain orientation, and the grain rotated slowly under the restrictions of loading direction, structural integrity, and deformation continuity. With the increase in stress, the shear stress of the tensile twin started to activate upon reaching the corresponding shear stress, making the texture gradually change from the original position of 45° from the compression direction to the ED direction. Figure 6c shows that the dominant deformation mechanism of E90 at the initial deformation stage was the basal slip (Figure 4c), most of the grains rotated continuously and gradually, and the normal of {0001} basal rotated parallel to the compression axis. With the increase in strain, the peak strength was always near the TD direction. The disappearance of the polar density in the center of the map was the result of the mutation of grain orientation caused by the effect of tensile twin.
In summary, for E0 and E90 after uniaxial compression plastic deformation, the {0001} surface of most grains either turned to the compression direction or remained perpendicular to the compression direction all the time. The {0001} surface of this part of the grain was always in hard orientation, which was not conducive to the activation of slip. Thus, the reforming ability after pre-compression could not be improved. In the uniaxial compression of the E45 sample, the initial deformation was dominated by basal slip, and the grain c-axis rotated slowly parallel to the direction of the application of force, which was beneficial for improving the reforming ability after pre-compression.
Figure 7a–c shows the grain boundary structure maps, typical grain EBSD maps, {0001} pole figure, and grain boundary misorientation maps of the different initial texture samples when they were uniaxially compressed to 0.08. In the grain boundary structure maps, the grain boundary satisfying the orientation relation of 86.3° ± 5° was defined as the stretched twin grain boundary, which was represented by the solid red line. Meanwhile, low-angle grain boundaries (LAGBs) and high-angle grain boundary (HAGBs) fractions could be confirmed by observing the misorientation boundary fraction from EBSD. In E0, the color of the EBSD maps of grain Ma showed that grain Ma underwent twin growth and fusion behavior. This finding also explained the illusion that the tensile twins decrease or even disappear in the later stage of compression deformation along the ED direction [38]. The pole figure of E45 and E90 showed that the basal plane of parent grain Mb and Mc tended to be parallel to ED direction and was located near the center of the polar diagram. In addition, the activation of tensile twins caused the grain c-axis to deflect ~90°, as shown in the twin Tb and Tc in the pole figure. Comparison of the experimental and simulation results of the different sample pole figures demonstrated that a small amount of polar density still remained in the center of the experimental pole figure of E45 and E90. The reason was because in the VPSC model, the PTR scheme assumes that when the cumulative twin fraction exceeds the critical volume fraction, the entire grain orientation changes, thereby ignoring the parent grain orientation. The disappearance of polar density in the center of E0 again proved the growth and fusion behavior of the stretched twins. When comparing the grain boundary misorientation maps of different samples, a slight decrease in LAGBs may be ascribed to the increased fraction of the {10–12} tension twin in E90. This finding indicated that the main deformation mechanism in E90 was the tension twin instead of the slip, whose activation could produce profuse LAGBs.

4. Conclusions

On the basis of the VPSC model and experimental methods, the relationship among initial texture, deformation mechanism, mechanical behavior, and texture evolution during the plastic deformation of Mg alloy was studied, and the following conclusions were drawn:
(1)
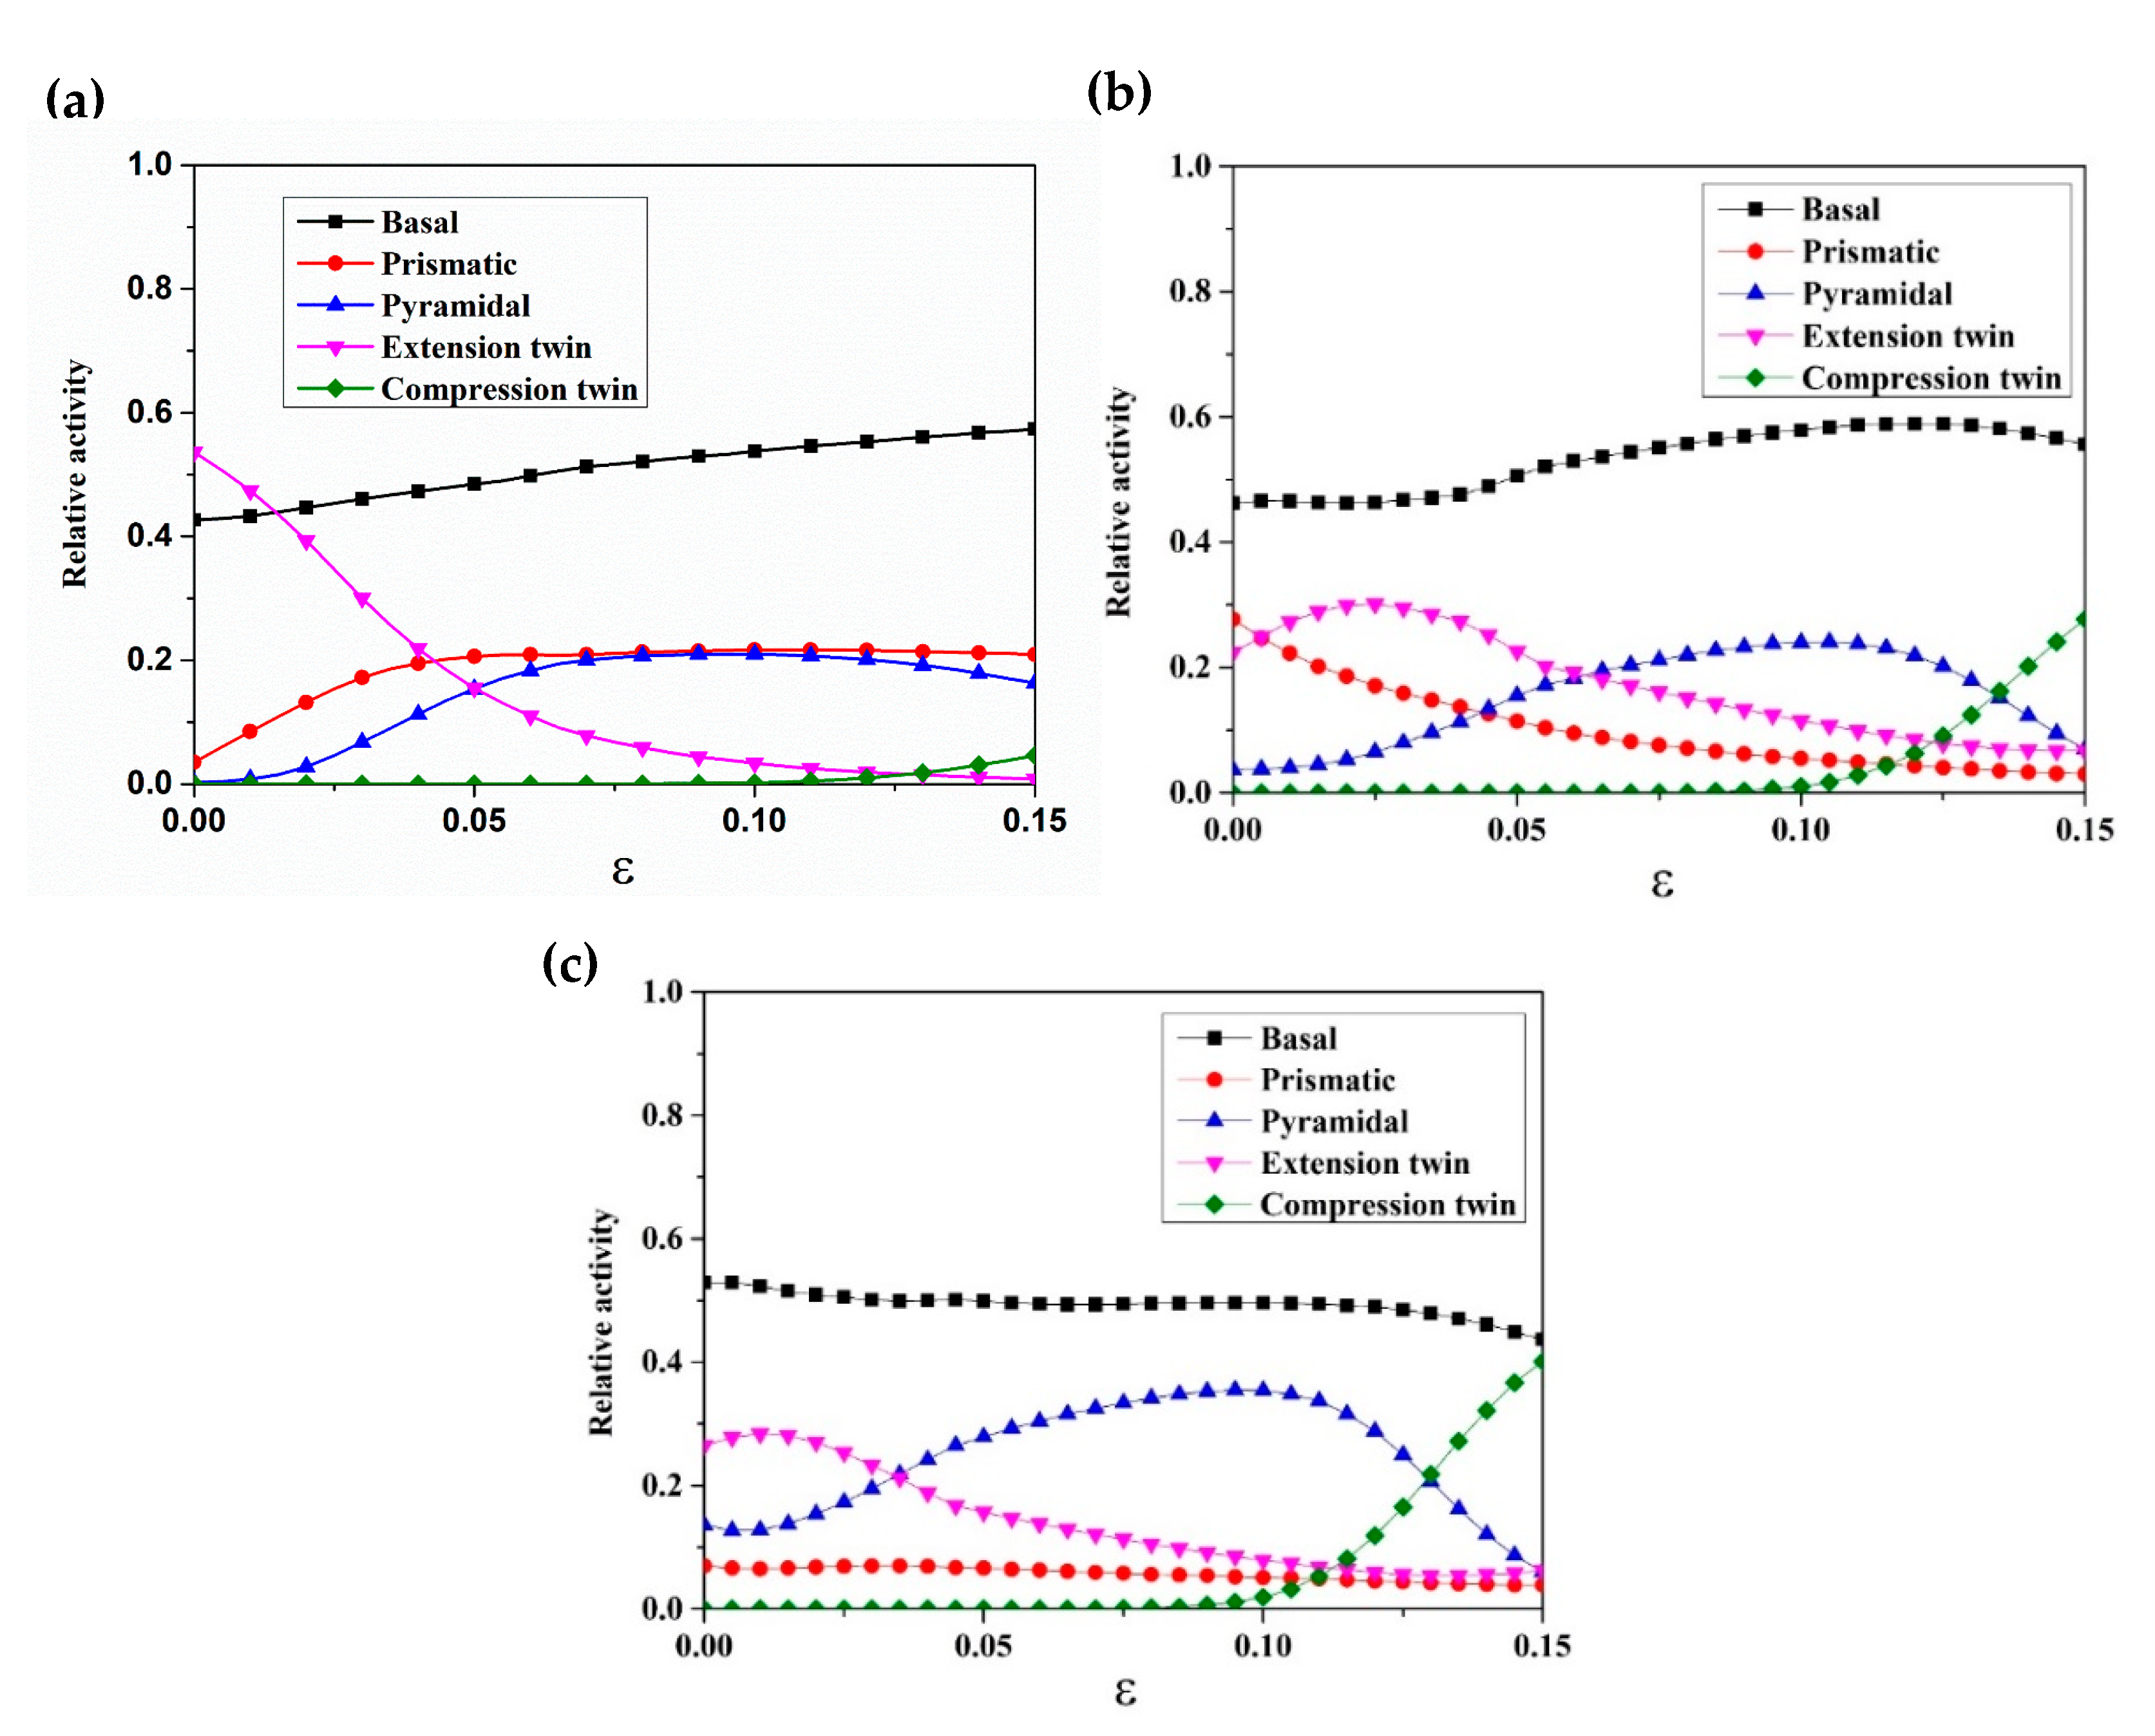
The obvious difference in initial texture led to obvious anisotropy of the compression behavior due to the influence in the activation of the deformation mechanism. At the initial stage of deformation, the compressive yield strength of E0, with tensile twins as the dominant deformation mechanism, was slightly higher than that of E45 and E90. The activity of the pyramidal slip was high in the compression process of E90, thereby leading to high flow stress.
(2)
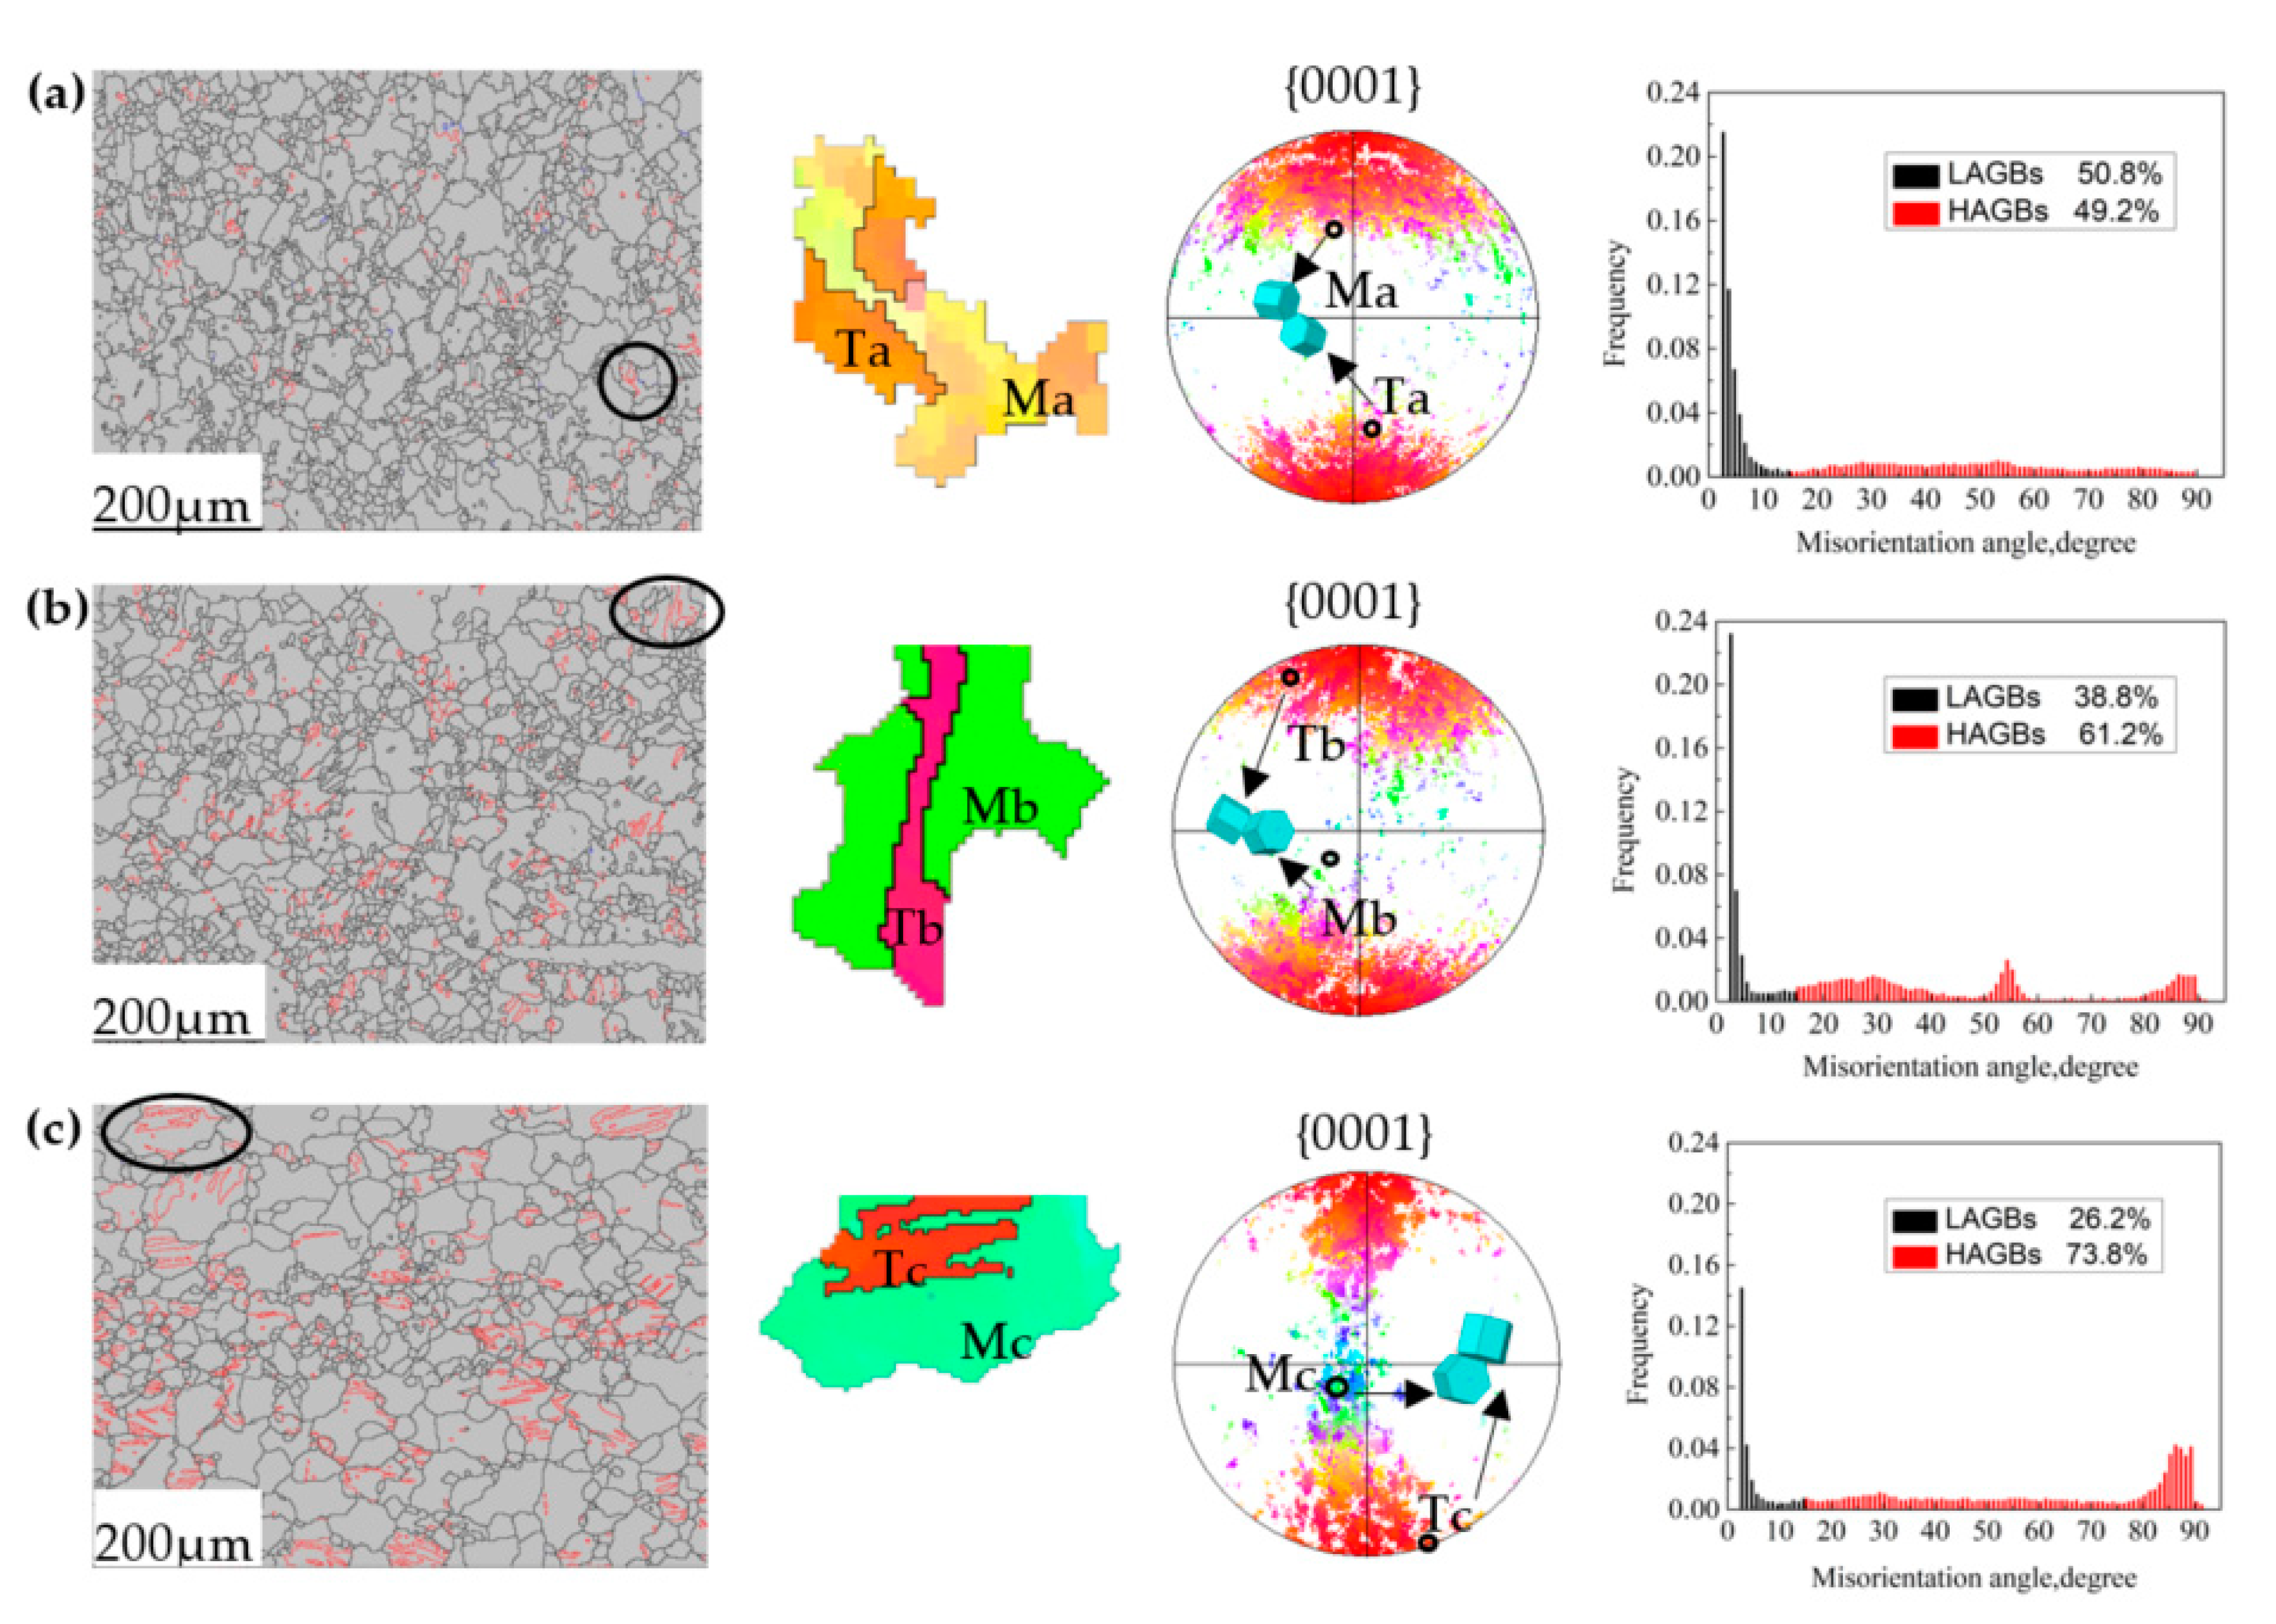
Initial texture played an important role in texture evolution during compression by influencing the priority of deformation mechanism. The large activation of the tensile twin in E0 made the {0001} basal plane deflects perpendicular to the compression direction. The activation of the basal slip of E45 and E90 caused the grain c-axis to rotate slowly parallel to the direction of application, and the initiation of the tensile twin caused the {0001} plane to slowly turn perpendicular to the ED direction. Compared with E0 and E90, E45 was more conducive to the improvement of reforming ability after pre-compression.
(3)
The difference in microstructure among the three samples was attributed to the number and morphology of the {10–12} tensile twins, which were mainly due to the obvious difference in initial texture.

Author Contributions

Writing—original draft preparation, H.S.; writing—review and editing, Z.C.; Helping the first author to build the VPSC model, C.X.; project administration, Y.L.; Helping the first author to conduct the experiment, L.M. All authors have read and agreed to the published version of the manuscript.

Funding

This research was funded by National Key Research and Development Program of China (No. 2018YFB1307902), National Science Fund Subsidized Project (No. U1710113), Shanxi Province Joint Student Training Base Talent Training Project (No. 2018JD33), Shanxi Excellent Youth Fund (No. 201901d211312), Transformation and cultivation project of scientific and technological achievements in Colleges and universities of Shanxi Province (No. 2019KJ028), Shanxi Graduate Education Innovation Project (No. 2019SY482).

Acknowledgments

The authors express their thanks to the people helping with this work, and acknowledge the valuable suggestions from the peer reviewers.

Conflicts of Interest

The authors declare no conflict of interest.

References

  1. Wan, D. Near spherical α-Mg dendrite morphology and high damping of low-temperature casting Mg–1wt.%Ca alloy. Mater. Charact. 2011, 62, 8–11. [Google Scholar]
  2. Pan, H.; Qin, G.; Huang, Y.; Ren, Y.; Sha, X.; Han, X.; Liu, Z.; Li, C.; Wu, X.; Chen, H.; et al. Development of low-alloyed and rare-earth-free magnesium alloys having ultra-high strength. Acta Mater. 2018, 149, 350–363. [Google Scholar] [CrossRef] [Green Version]
  3. Zeng, Z.; Stanford, N.; Davies, C.H.J.; Nie, J.-F.; Birbilis, N. Magnesium extrusion alloys: A review of developments and prospects. Int. Mater. Rev. 2018, 1–36. [Google Scholar] [CrossRef]
  4. Lu, X.; Zhao, G.Q.; Zhou, J.X.; Zhang, G.S.; Sun, L. Effect of extrusion speeds on the microstructure, texture and mechanical properties of high-speed extrudable Mg-ZnSn-Mn-Ca alloy. Vacuum 2018, 157, 180–191. [Google Scholar] [CrossRef]
  5. Wang, H.; Lu, C.; Tieu, A.K.; Deng, G. Coupled effects of initial orientation scatter and grain-interaction to texture evolution: A crystal plasticity FE study. Int. J. Mater. Form. 2019, 12, 161–171. [Google Scholar] [CrossRef] [Green Version]
  6. Rodrigues, D.G.; de Alcântara, M.C.; de Oliveira, T.R.; Gonzalez, B.M. The effect of grain size and initial texture on microstructure, texture, and formability of Nb stabilized ferritic stainless steel manufactured by two-step cold rolling. J. Mater. Res. Technol. 2019, 8, 4151–4162. [Google Scholar] [CrossRef]
  7. Wang, X.; Shi, T.; Jiang, Z.; Chen, W.; Guo, M.; Zhang, J.; Zhuang, L.; Wang, Y. Relationship among grain size, texture and mechanical properties of aluminums with different particle distributions. Mater. Sci. Eng. 2019, 753, 122–134. [Google Scholar] [CrossRef]
  8. He, J.; Mao, Y.; Gao, Y.; Xiong, K.; Jiang, B.; Pan, F. Effect of rolling paths and pass reductions on the microstructure and texture evolutions of AZ31 sheet with an initial asymmetrical texture distribution. J. Alloy. Compd. 2019, 786, 394–408. [Google Scholar] [CrossRef]
  9. Singh, J.; Kim, M.S.; Choi, S.H. The effect of initial texture on deformation behaviors of Mg alloys under erichsen test. Magnes. Technol. 2018, 223–229. [Google Scholar] [CrossRef]
  10. Ahmadian, P.; Abbasi, S.M.; Morakabati, M. Effect of initial texture and grain size on geometrically necessary dislocations density distribution during uniaxial compression of Ti-6Al-4V. Materialstoday 2018, 14, 263–272. [Google Scholar] [CrossRef]
  11. Wang, W.; Zhang, W.; Chen, W.; Cui, G.; Wang, E. Effect of initial texture on the bending behavior, microstructure and texture evolution of ZK60 magnesium alloy during the bending process. J. Alloy. Compd. 2018, 737, 505–514. [Google Scholar] [CrossRef]
  12. Singh, J.; Kim, M.S.; Choi, S.H. The effect of initial texture on micromechanical deformation behaviors in Mg alloys under a mini-V-bending test. Int. J. Plast. 2019, 117, 33–57. [Google Scholar] [CrossRef]
  13. Xiong, Y.; Gong, X.; Jiang, Y. Effect of initial texture on fatigue properties of extruded ZK60 magnesium alloy. Fatigue Fract. Eng. Mater. Struct. 2018, 41, 1504–1513. [Google Scholar] [CrossRef]
  14. Wang, H.; Wu, P.D.; Wang, J.; Tome, C.N. A physics-based crystal plasticity model for hexagonal close packed (HCP) crystals including both twinning and de-twinning mechanisms. Int. J. Plast. 2013, 49, 36–52. [Google Scholar] [CrossRef]
  15. Wu, P.D.; Guo, X.Q.; Qiao, H.; Agnew, S.R.; Lloyd, D.J.; Embury, J.D. On the rapid hardening and exhaustion of twinning in magnesium alloy. Acta Mater. 2017, 122, 369–377. [Google Scholar] [CrossRef] [Green Version]
  16. Balik, J.; Dobron, P.; Chmelik, F.; Kuzel, R.; Drozdenko, D.; Bohlen, J.; Letzig, D.; Lukac, P. Modeling of thework hardening in magnesium alloy sheets. Int. J. Plast. 2015, 76, 166–185. [Google Scholar] [CrossRef]
  17. Barnett, M.R.; Ghaderi, A.; da Fonseca, J.Q.; Robson, J.D. Influence of orientation on twin nucleation and growth at low strains in a magnesium alloy. Acta Mater. 2014, 80, 380–391. [Google Scholar] [CrossRef]
  18. Lou, X.Y.; Li, M.; Boger, R.K.; Agnew, S.R.; Wagoner, R.H. Hardening evolution of AZ31B Mg sheet. Int. J. Plast. 2007, 23, 44–86. [Google Scholar] [CrossRef]
  19. Koike, J. Enhanced deformation mechanisms by anisotropic plasticity in polycrystalline Mg alloys at room temperature. Metall. Mater. Trans. A 2005, 36, 1689–1696. [Google Scholar] [CrossRef]
  20. Lou, C.; Zhang, X.; Ren, Y. Non-Schmid-based 10–12 twinning behavior in polycrystalline magnesium alloy. Mater. Charact. 2015, 107, 249–254. [Google Scholar] [CrossRef]
  21. Huang, H.; Godfrey, A.; Zheng, J.; Liu, W. Influence of local strain on twinning behavior during compression of AZ31 magnesium alloy. Mater. Sci. Eng. A 2015, 640, 330–337. [Google Scholar] [CrossRef]
  22. Nicolas, B.; Hendrix, D.; Raynald, G. Imaging with a Commercial Electron Backscatter Diffraction (EBSD) camera in a scanning electron microscope: A review. J. Imaging 2018, 4, 88. [Google Scholar]
  23. Gaskey, B.; Hendl, L.; Xiaogang, W.; Seita, M. Full length article Optical characterization of grain orientation in crystalline materials. Acta Mater. 2020, 194, 558–564. [Google Scholar] [CrossRef]
  24. Wang, H.; Wu, P.D.; Tomé, C.N.; Huang, Y. A finite strain elastic-viscoplastic self-consistent model for polycrystalline materials. J. Mech. Phys. Solids 2010, 58, 594–612. [Google Scholar] [CrossRef]
  25. Lebensohn, R.; Gonzalez, M.; Tomé, C.; Pochettino, A. Measurement and prediction of texture development during a rolling sequence of zircaloy-4 tubes. J. Nucl. Mater. 1996, 229, 57–64. [Google Scholar] [CrossRef]
  26. Su, H.; Chu, Z.B.; Wang, H.Z.; Li, Y.G.; Ma, L.F.; Xue, C. Mechanism of secondary deformation of extruded AZ31 magnesium alloy by viscoplastic self-consistent model. Adv. Mater. Sci. Eng. 2020, 1–11. [Google Scholar] [CrossRef]
  27. Zhao, L.; Chapuis, A.; Xin, Y.; Liu, Q. VPSC-TDT modeling and texture characterization of the deformation of a Mg-3Al-1Zn plate. J. Alloy. Compd. Interdiscip. J. Mater. Sci. Solid State Chem. Phys. 2017, 710, 159–165. [Google Scholar] [CrossRef]
  28. Zhang, B.; Li, S.; Wang, H.; Tang, W.; Jiang, Y.; Wu, P. Investigation of the in-plane mechanical anisotropy of magnesium alloy AZ31B-O by VPSC–TDT crystal plasticity model. Materials 2019, 12, 1590. [Google Scholar] [CrossRef] [Green Version]
  29. Maldar, A.; Wang, L.; Zhu, G.; Zeng, X. Investigation of the alloying effect on deformation behavior in Mg by Visco-Plastic Self-Consistent modeling. J. Magnes. Alloy. 2020, 14, 13–42. [Google Scholar] [CrossRef]
  30. Chaudry, U.M.; Hamad, K.; Kim, J.-G. Ca-induced plasticity in magnesium alloy: EBSD measurements and VPSC calculations. Crystals 2020, 10, 67. [Google Scholar] [CrossRef] [Green Version]
  31. Agnew, S.R.; Brown, D.W.; Tomé, C.N. Validating a polycrystal model for the elastoplastic response of magnesium alloy AZ31 using in situ neutron diffraction. Acta Mater. 2006, 54, 4841–4852. [Google Scholar] [CrossRef]
  32. Hu, L.; Jiang, S.; Zhou, T.; Chen, Q. A coupled finite element and crystal plasticity study of friction effect on texture evolution in uniaxial compression of niti shape memory alloy. Materials 2018, 11, 2162. [Google Scholar] [CrossRef] [Green Version]
  33. Li, H.; Zhang, H.; Yang, H.; Fu, M.; Yang, H. Anisotropic and asymmetrical yielding and its evolution in plastic deformation: Titanium tubular materials. Int. J. Plast. 2017, 90, 177–211. [Google Scholar] [CrossRef]
  34. Reed-Hill, R.E.; Robertson, W.D. Additional modes of deformation twinning in magnesium. Acta Metall. 1957, 5, 717–727. [Google Scholar] [CrossRef]
  35. Agnew, S.R.; Yoo, M.H.; Tomé, C.N. Application of texture simulation to understanding mechanical behavior of Mg and solid solution alloys containing Li or Y. Acta Mater. 2001, 49, 4277–4289. [Google Scholar] [CrossRef]
  36. Al-Samman, T.; Gottstein, G. Dynamic recrystallization during high temperature deformation of magnesium. Mater. Sci. Eng. A 2008, 490, 411–420. [Google Scholar] [CrossRef]
  37. Li, X.; Yang, P.; Wang, L.-N.; Meng, L.; Cui, F. Orientational analysis of static recrystallization at compression twins in a magnesium alloy AZ31. Mater. Sci. Eng. A 2009, 517, 160–169. [Google Scholar] [CrossRef]
  38. Wu, W.X.; Jin, L.; Dong, J.; Ding, W.J. Deformation behavior and texture evolution in an extruded Mg-lGd alloy during uniaxial compression. Mater. Sci. Eng. A 2014, 593, 48–54. [Google Scholar] [CrossRef]
Figure 1. Sample shape and size: (a) schematic of samples; (b) compression samples; (c) inverse pole figure map; (d) grain size distribution.
Crystals 10 00738 g001
Figure 2. Physical meaning of hardening parameters for Viscoplastic Self-Consistent (VPSC) simulations.
Crystals 10 00738 g002
Figure 3. Experimental (symbol) and simulated (line) stress-strain curves under uniaxial compression and corresponding initial texture of (a) E0; (b) E45; (c) E90.
Crystals 10 00738 g003
Figure 4. Predicted relative activity of deformation modes under uniaxial compression of (a) E0; (b) E45; (c) E90.
Crystals 10 00738 g004
Figure 5. Experimental and Simulation pole figures under uniaxial compression to 8% of (a) E0 sample; (b) E45 sample; (c) E90 sample.
Crystals 10 00738 g005
Figure 6. Predicted texture evolution of {0001} pole figure under uniaxial compression to different strain levels of (a) E0; (b) E45; (c) E90.
Crystals 10 00738 g006
Figure 7. Boundary structure maps, electron backscattering diffraction (EBSD) maps of typical grain, {0001} pole figure, and grain boundary misorientation map under uniaxial compression to 8% of (a) E0; (b) E45; (c) E90. (LAGBs: low angle grain boundaries between 0°and 15°; HAGBs: high angle grain boundaries higher than 15°).
Crystals 10 00738 g007
Table 1. The prescription of AC2.
AC2 I800 mL ethanol, 100 mL propanol, 18.5 mL distilled water, 10 g hydroxyquimoline, 75 g citric acid
AC2 II41.5 g sodium thiocyanate
AC2 III15 mL perchloric acid
Table 2. Hardening parameters of each slip and twinning system in the simulation of Mg alloy under monotonic loading.
Deformation Mode τ 0 / MPa τ 1 / MPa θ 0 / MPa θ 1 / MPa
Basal <a>286018516
Prismatic <a>8510200250
Pyramidal <c+a>11015120400
Extension twin450150400
Compression twin210100345400

