Abstract
High purity titanium (Ti) thin strip was prepared by rolling with large deformation and was characterized by the means of Transmission Electron Microscopy (TEM), selected area diffraction (SAED) pattern, high-resolution (HRTEM) analysis, as well as Transmission Kikuchi Diffraction (TKD). It is found that there are face-centered cubic (FCC) Ti laths formed within the matrix of hexagonal close packing (HCP) Ti. This shows that the HCP-FCC phase transition occurred during the rolling, and a specific orientation relationship (OR) between HCP phase and FCC phase obeys ⟨0001⟩α//⟨001⟩FCC and {100}α//{110}FCC. The ORs of HCP-FCC phase transition are deeply studied by TKD pole figure and phase transformation matrix. It is found that the derived results via pole figure and transformation matrix are equivalent, and are consistent with TEM-SAED analysis results, which proves that these two methods can effectively characterize the ORs of HCP-FCC phase transition and predict possible FCC phase variants.
1. Introduction
Pure titanium (Ti) is a rare metal and widely used in aerospace, automobile, Micro-Electro-Mechanical System (MEMS) and other engineering fields. It is well known that pure Ti has HCP crystal structure and body-centered cubic (BCC) structure at ambient and high temperature conditions, respectively [1]. Pure Ti is easily oxidized during rolling process at high temperature, while room temperature is required to ensure its purity. However, the stable Ti phase at ambient conditions is HCP phase, which shows a poor ductility. In recent years, some new phase transitions of pure Ti have been discovered, such as an allotropic phase transformation from the HCP α-Ti to the hexagonal ω-Ti during high-pressure torsion (HPT) [2] and the HCP-Ti to FCC-Ti transition [3]. However, the latter is of great interest for the researchers. Hong et al. [3] refined pure titanium grains with equal-channel angular pressing (ECAP), and found the transition from HCP-Ti to FCC-Ti. The FCC-Ti is nucleated in the deformation cross-slip zone with the implementation of tensile deformation of pure titanium foil, which belongs to a stress-induced phase transformation. Other authors also have reported the HCP-Ti to FCC-Ti transformation during the deposition of pure Ti thin films [4], plastic deformation [1,5,6,7,8,9], and heat treatment process [1,10,11,12,13]. The stability of FCC-Ti in pure titanium has been proved by molecular dynamics theory [14] and first principles calculation [15,16]. The HCP-Ti to FCC-Ti transition also appears in titanium alloys [17,18] and in Nb-Ti-Si based alloys [19].
Niu et al. [20] found that the deformation mechanism was composed of dislocation slip, twins and HCP→FCC phase transition. The phase transition from HCP to FCC expands the volume of unit cell ~10.5%, and it is expected that the phase transition contributes about 3.6% to the applied strain. Bai et al. [21] considered that in the rolling process of high purity titanium, apart from twinning [22,23,24] and dislocation mechanism [25], the HCP-FCC phase transition has an important contribution to its elongation process. These show that the HCP-FCC phase transition can occur easily when pure titanium undergoes large plastic deformation at room temperature, which coordinates the deformation.
There will be a certain orientation relationship (OR) between the new phase and the matrix after phase transformation. Two kinds of ORs between HCP (α) and FCC have been discovered [6,9], known as B type: , and P type:, . Zheng [6] and Zu [26] found that the P type is accomplished by shuffle and shear shuffle mechanism, while B type depends on the mechanism of Shockley partial dislocation. Ren et al. [14] performed the molecular dynamics simulation of uniaxial tension of titanium single crystal nanocolumns along the plane, which revealed that the phase transition is mainly controlled by the local dislocation slip and stacking fault. In order to study the formation mechanism and characteristics of FCC new phase in matrix, the deep dicussion of OR between two phases is necessary.
Most researchers [3,6,20,26] study the phase transition and orientation relationship from HCP-Ti to FCC-Ti via TEM. In this paper, we utilize both TEM and TKD to observe the phase transition ORs. TKD clarified the ORs, which was consistent with that via TEM. Meanwhile, the pole figure and phase transition matrix of the ORs was obtained, based on the results of TEM and TKD analysis. When the phase transition between HCP and FCC obeys the specific OR, the parallel crystal directions and planes of the two phases can be accurately expressed by pole figures and phase transition matrix, and the variants meeting the OR can be predicted.
2. Experimental Material and Procedure
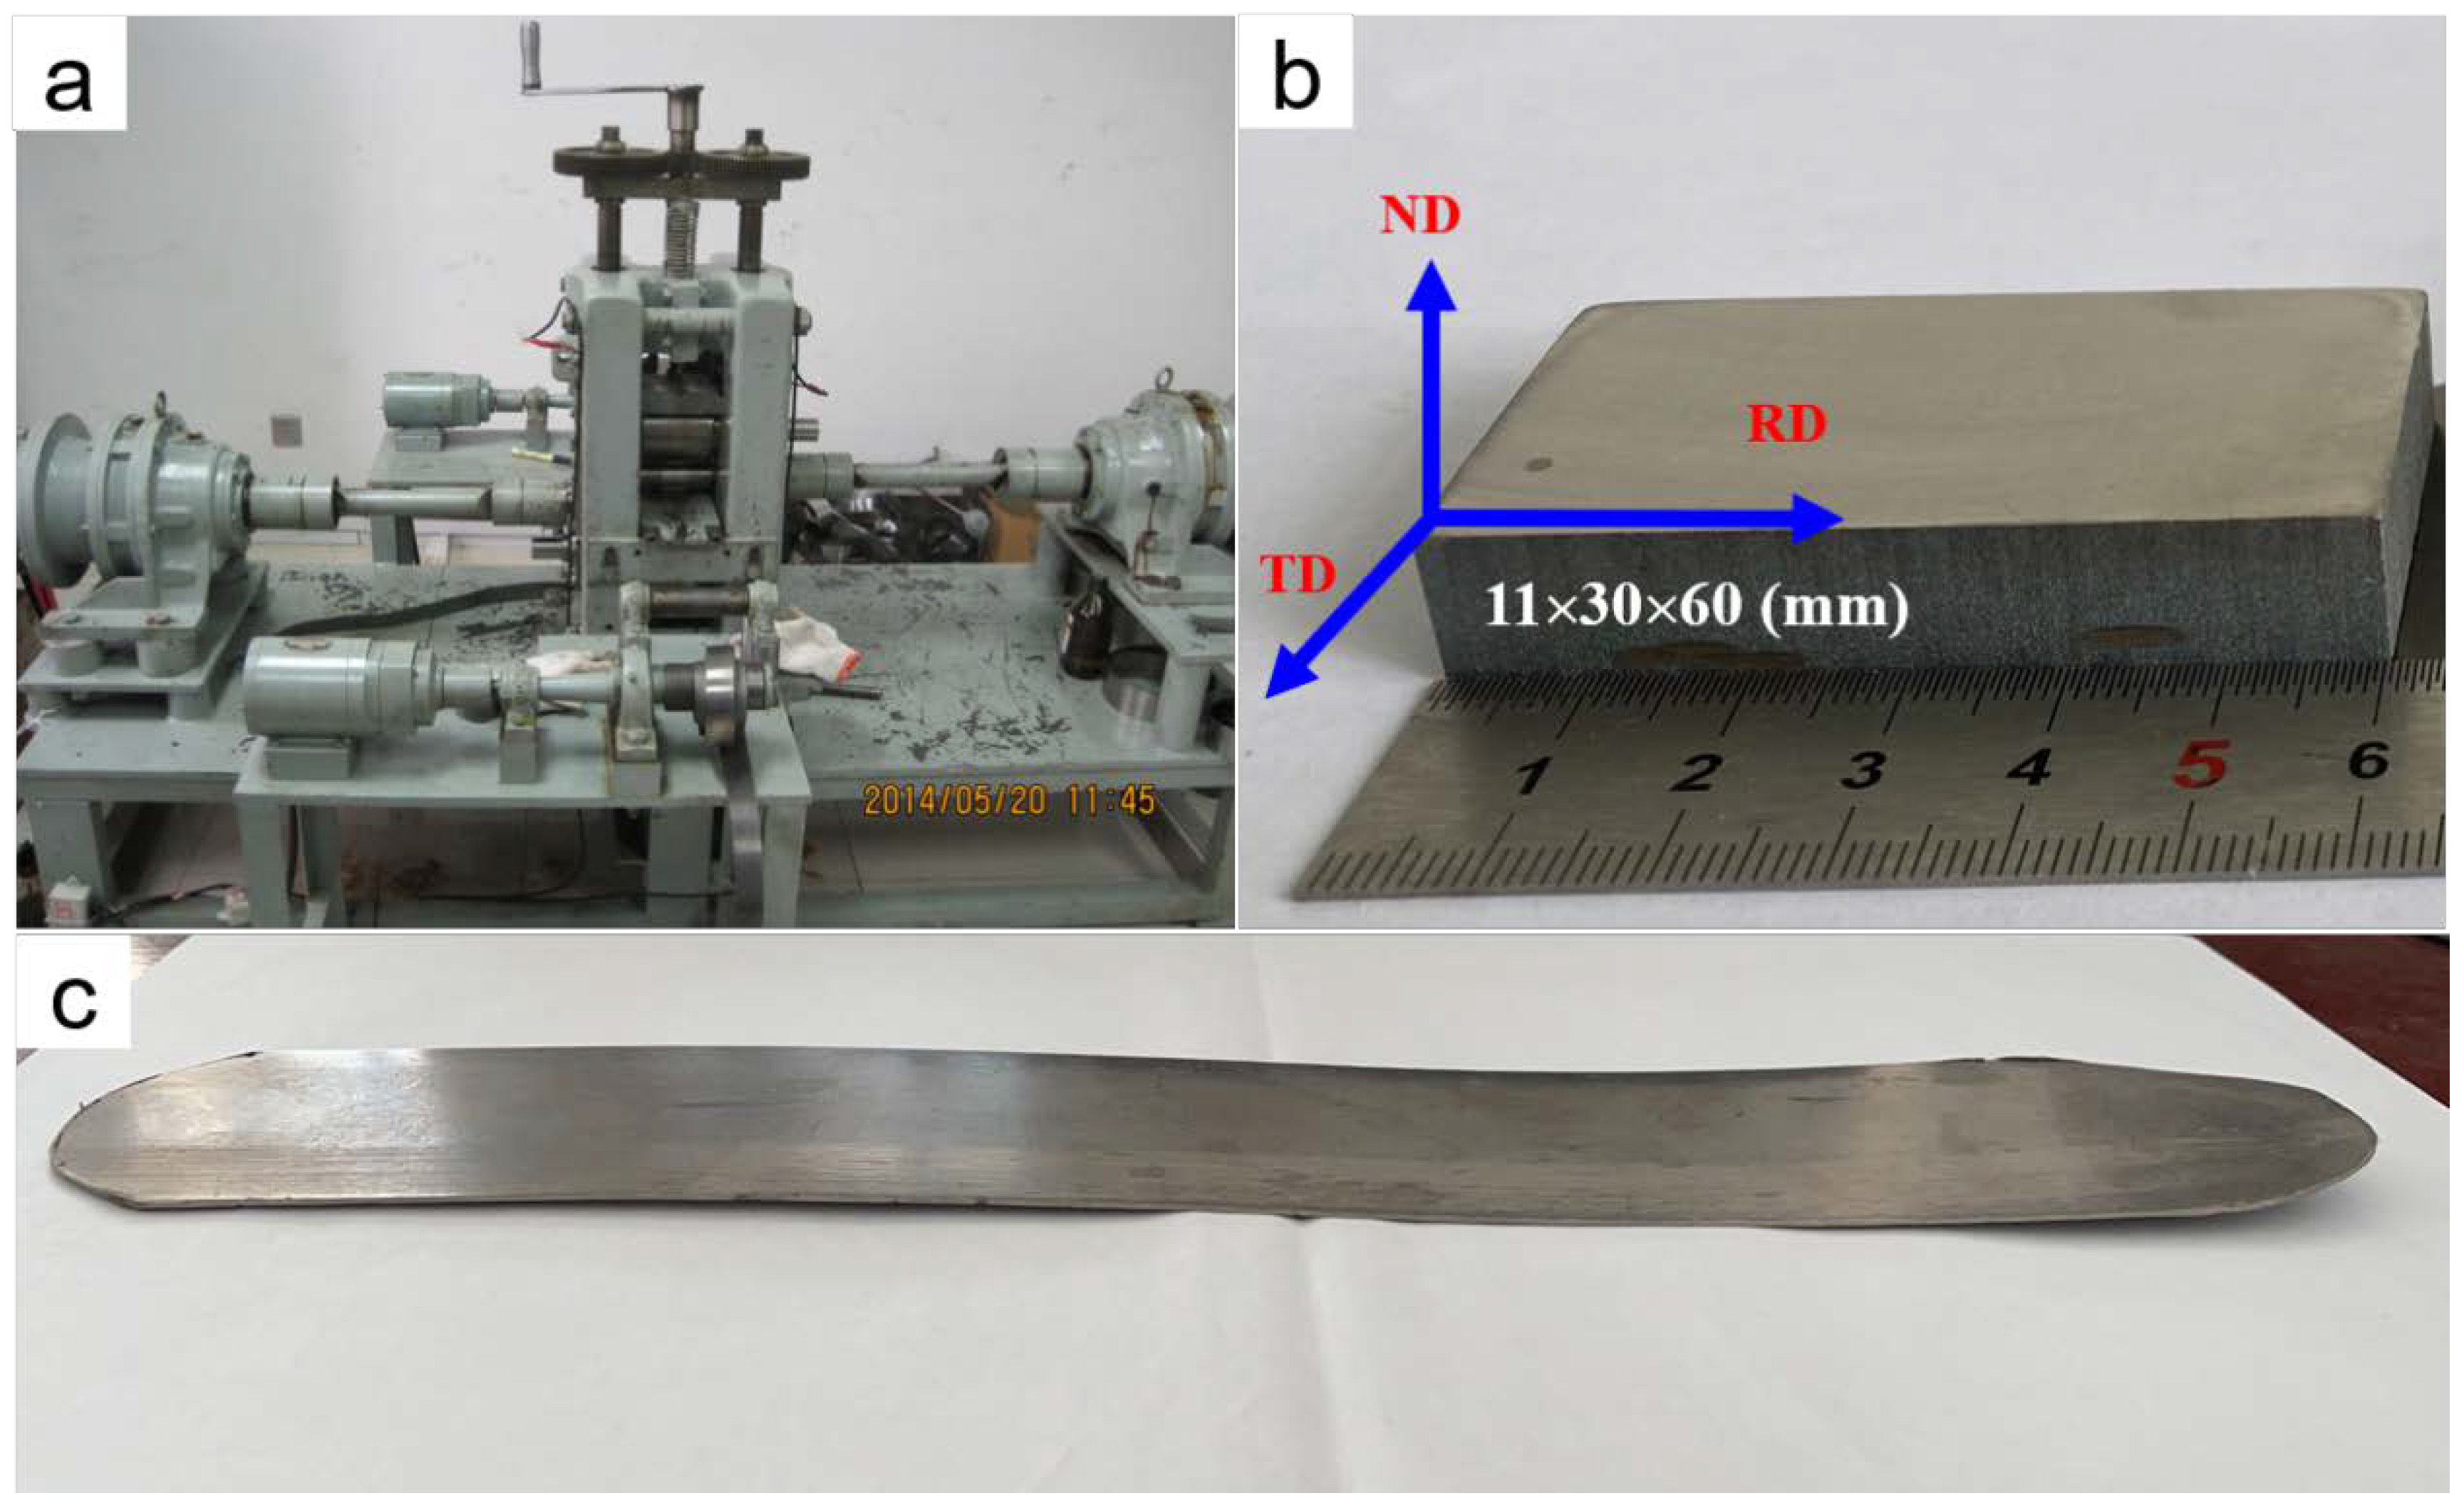
The raw material of high purity Ti (HP-Ti) was supplied by Ningbo Chuangrun New Materials CO., LTD, Ningbo, China. Sheet samples of 11 mm × 30 mm × 60 mm size were cut from the raw material, and multi-pass symmetrical rolling was performed to prepare a thin strip with a thickness of 0.86 mm with about 92% total reduction in thickness, as shown in Figure 1. Details of the equipment and processing for cold-rolling can be found in the previous literature reports [27,28]. Talos F200X TEM (Thermo Fisher, Waltham, MA, USA) examinations were used to investigate the FCC-Ti in HCP matrix. A 0.3 mm slice was cut from the sheets by wire cutting, then mechanically polished, and a sample with a diameter of 3 mm and a thickness of 50 μm was treated by ion milling in order to prepare the sample for TEM analysis.
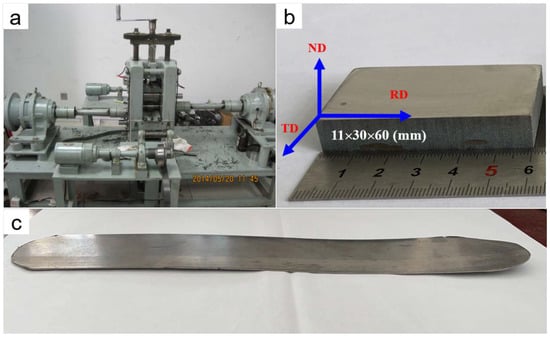
Figure 1.
Micro-rolling mill and thin strip samples. (a) Experimental setup; (b) raw material of high purity; (c) a thin strip with a thickness of 0.86 mm.
The FCC-Ti is nanoscale in size and TKD was used to characterize the ORs between HCP-Ti and FCC-Ti. For efficient TKD testing, the cold-rolled strips were annealed at 500 °C for 1 h under Argon protection. A Zeiss AURIGA FIB-SEM workstation equipped with TKD capability was carried out to characterize the TEM foils. TKD testing was performed at 30 kV and a step size of 50 nm.
3. Results and Discussion
3.1. TEM Observations
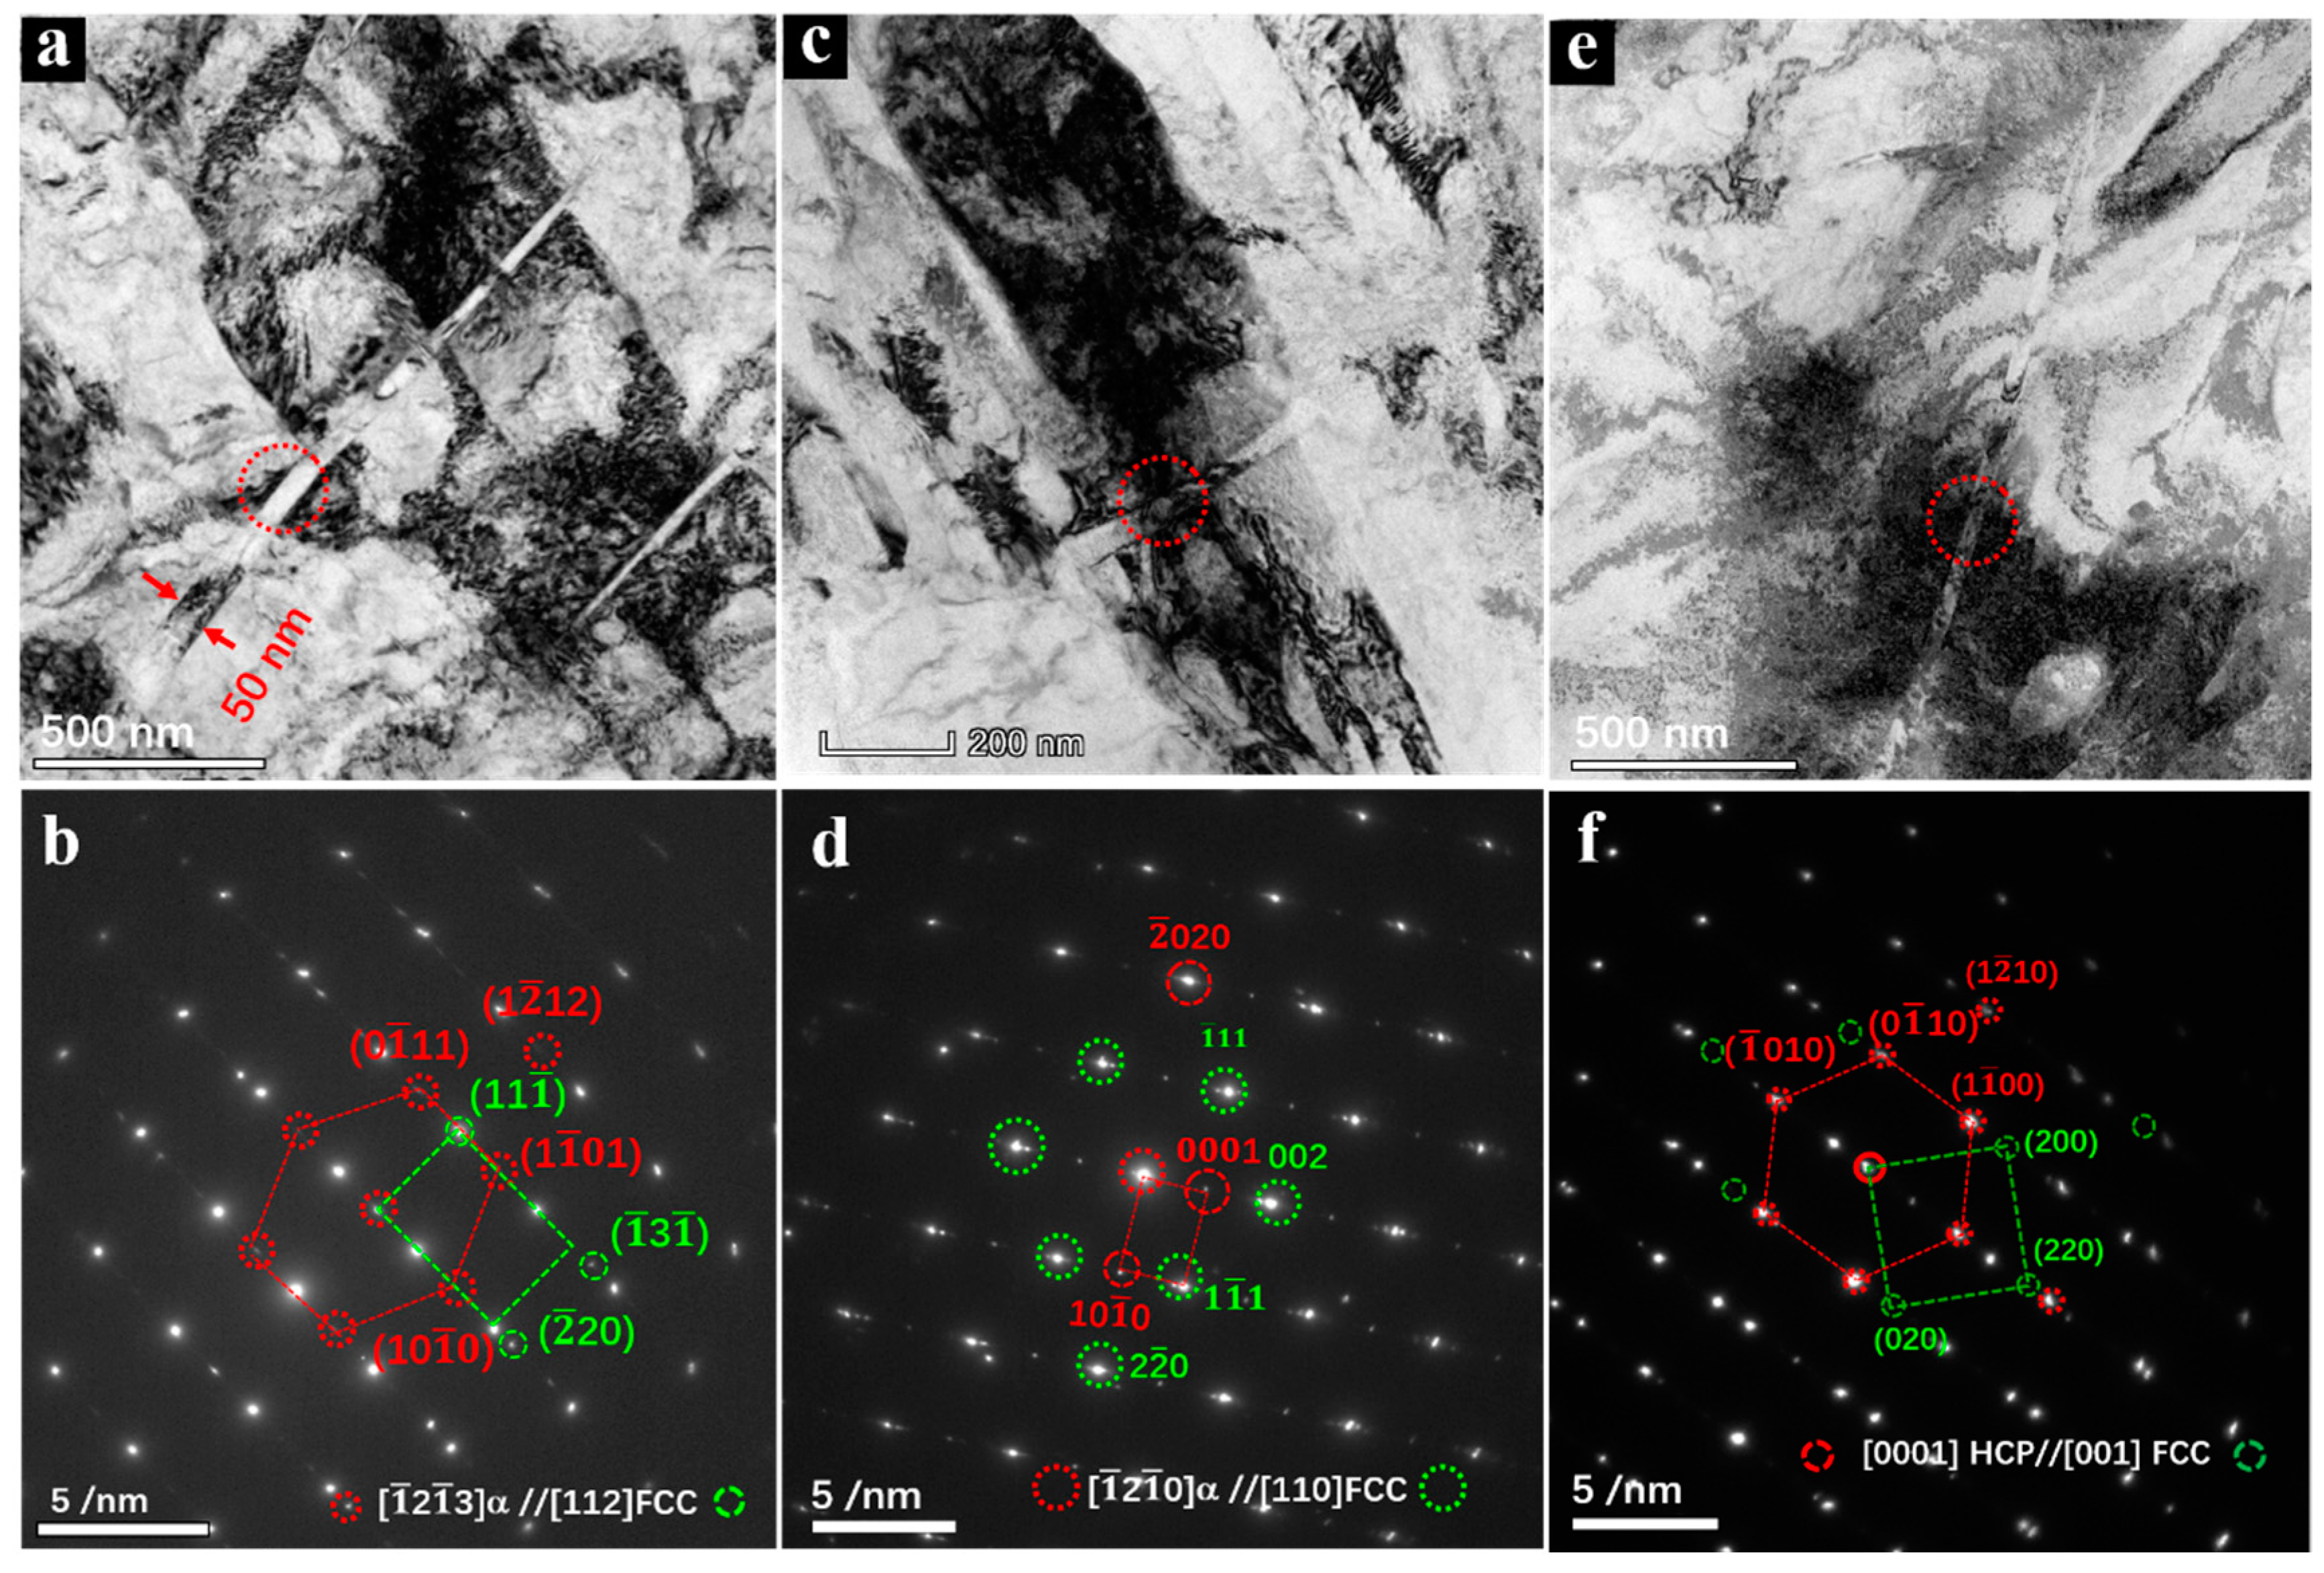
Figure 2 shows the TEM images of the samples after cold-rolling. Some deformation lath structure with the width ranging from 30 nm to 50 nm was found in Figure 2a. It observed that there is a deformation lath in a sub-grain with a size of about 1 μm, which divides the subgrain into two parts. The deformation zone almost runs through the whole grain and sub-grain, which plays a significant role for the grain refinement, and is similar to the twinning. Figure 1b shows the SAED pattern of deformation lath and its adjacent matrix. The analysis shows that the zone axis of hexagonal phase (α-HCP) is , while the deformation band has FCC crystal structure, and the zone axis is [112]FCC. The lattice parameters of HCP phase are calculated as a = 0.298 nm and c = 0.471 nm and the lattice parameter of FCC phase is aFCC = 0.425 nm. These lattice parameters are consistent with the other studies [3,29]. This shows that the deformation laths in Figure 1a are FCC phase structure, instead of deformed twins at this deformation range [9,30]. In recent years, many researchers have reported that the pure titanium changes from HCP phase to FCC phase under large deformation along with the formation of FCC phase deformation lath [3,7,20,31]. The OR of the two phases obtained from Figure 2b is as follow:
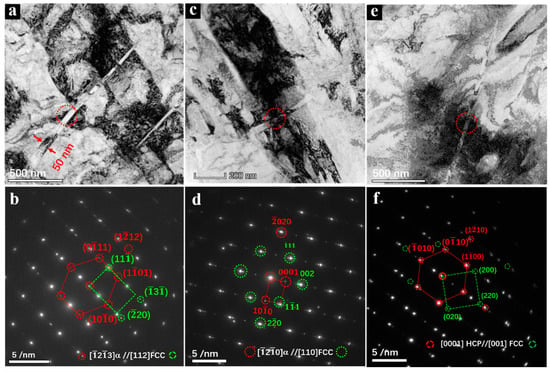
Figure 2.
(a,c,e) TEM pictures and (b,d,f) SAED patterns of the FCC-Ti lath structure and matrix, three determination positions of SAED were remarked by circles in TEM pictures, respectively.
Figure 2d shows the SAED pattern analysis in which the deformation lath is marked by a circle in Figure 1c is also FCC-Ti phase, and its lattice constant is a = 0.425 nm. The OR between the two phases in Figure 2c,d is calibrated as follows:
Figure 2e is another typical TEM picture of the FCC-Ti lath. The lattice parameters of HCP and FCC phases are consistent with the results in Figure 2b and Figure 1d. The OR between HCP-Ti and FCC-Ti is:
The β-Ti alloys mainly exhibit ω phase transformation, which is claimed to be caused of heterogeneous nucleation of the α phase [32]. Recently, the phase transformation from the HCP α-Ti to the hexagonal ω-Ti was appeared during the high-pressure torsion (HPT) [2]. In this work, hexagonal ω-Ti phase transition is not found by TEM analysis, which is examined by the difference of SAED patterns between hexagonal ω-Ti and HCP-Ti.
The previous literature reports show that the FCC phase in pure-Ti is Ti-H hydride, not FCC-Ti [33,34,35]. In our previous work [21], it is found that FCC phase has better plasticity than HCP-Ti, and FCC phase can reverse to HCP phase during deformation. If the FCC phase is Ti-H hydride, its plasticity will be poor. Meanwhile, the transition from FCC Ti-H to HCP phase will not exist during deformation. Therefore, it can be confirmed that the FCC phase in this work is FCC-Ti instead of FCC hydride.
Figure 3 shows the HRTEM images of the FCC phase lath. It can be seen in Figure 3a that the HCP/FCC interface is straight. Filter inverse fast Fourier transform (FFT) image of FCC and HCP phases are illustrated in Figure 3b,c. The FFT patterns in Figure 3e,f also proves the existence of two phases, and satisfies the OR in Expression (3). This result is consistent with other studies [1,3,4,11,12,14,18,31,36,37]. In Figure 3d, the inverse FFT analysis of HCP phase near to the FCC phase shows that the HCP matrix phase contains a quite few edge dislocations, and the extra half planes are parallel to the planes. This means that the mechanism of phase transition from HCP to FCC is related with the dislocation slipping.
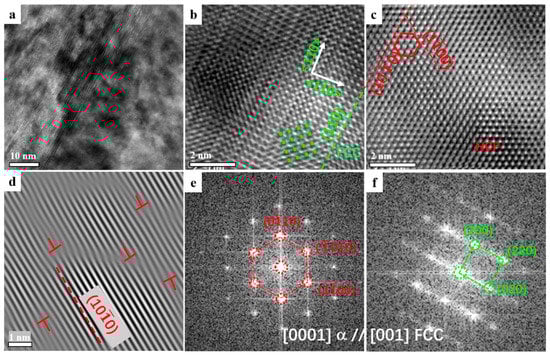
Figure 3.
HRTEM and FFT of FCC-Ti laths and HCP matrix. (a) HRTEM; (b,c) Filter inverse FFT image; (d) dislocation in HCP-Ti lath; (e,f) FFT patterns of two phases in (a).
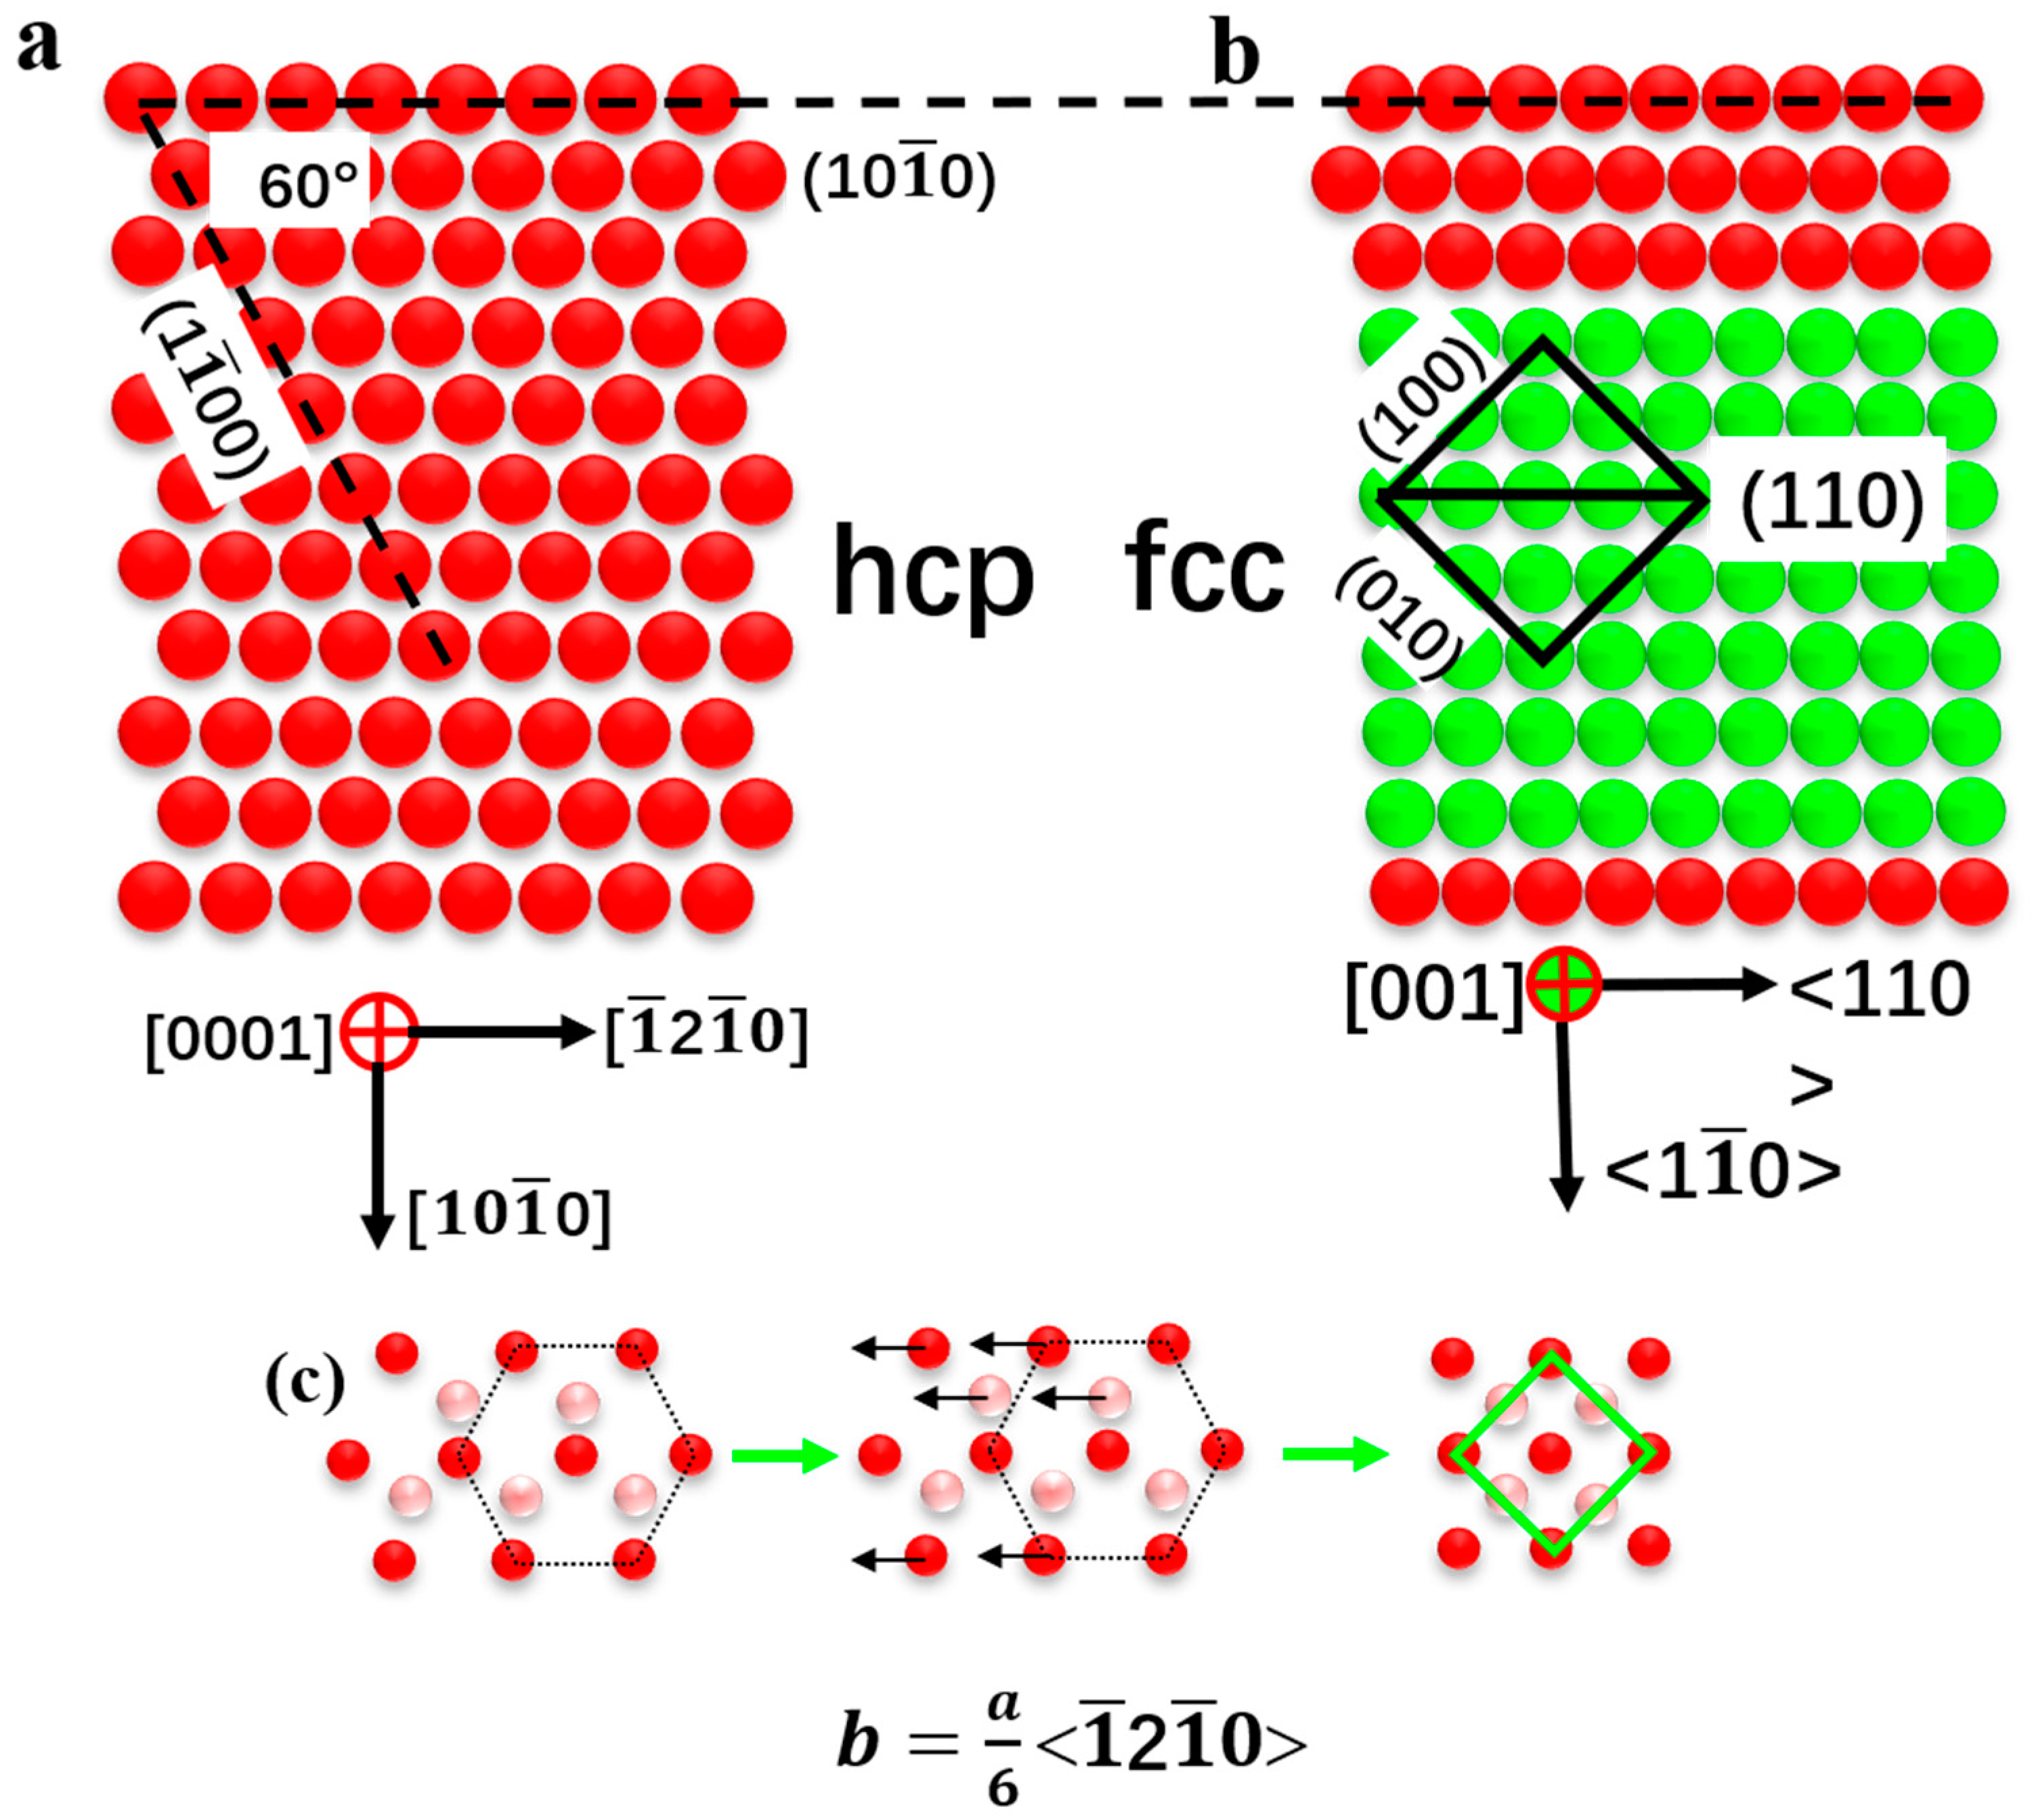
The microscopic mechanism of the phase transition from HCP to FCC is shown by the schematic diagram in Figure 4. The phase transition is caused by the Shockley partial dislocation sliding along the direction on the prism surface , which is consistent with the results of molecular dynamics theory calculation [14], first principles calculation and TEM analysis [3,8,15]. Therefore, the transition can improve the plastic deformation capability of HP-Ti.

Figure 4.
Schematic of HCPFCC phase transient. (a) HCP-Ti phase structure; (b) FCC-Ti phase structure; (c) HCP to FCC phase transient by Shockley partial dislocation.
The results of two-phase OR obtained by the SAED patterns analysis are counted in Table 1. There are three kinds of relationship formulas with different parallel orientation and planes in Figure 2, which are named as P1, P2, and P3, respectively.

Table 1.
The ORs deduced from the SAED patterns.
3.2. Pole Figures
It is well known that the conventional Electron backscattered diffraction (EBSD) can be used to determine the ORs between the matrix and the second phase with micron or even millimeter scale, for example, ferrite precipitates with its neighboring grain holding K-S OR via EBSD in medium carbon steel [38]. TEM results show that the formation of the FCC-Ti has been proposed to preferred the ORs with the HCP-Ti matrix. At the same time, the width of FCC-Ti laths was ranging from 30 nm to 50 nm. TKD has a significantly higher spatial resolution than the conventional EBSD [39]. TKD was widely applied in crystal ORs determination and phase mapping on a nanoscale in recent years [40,41,42].
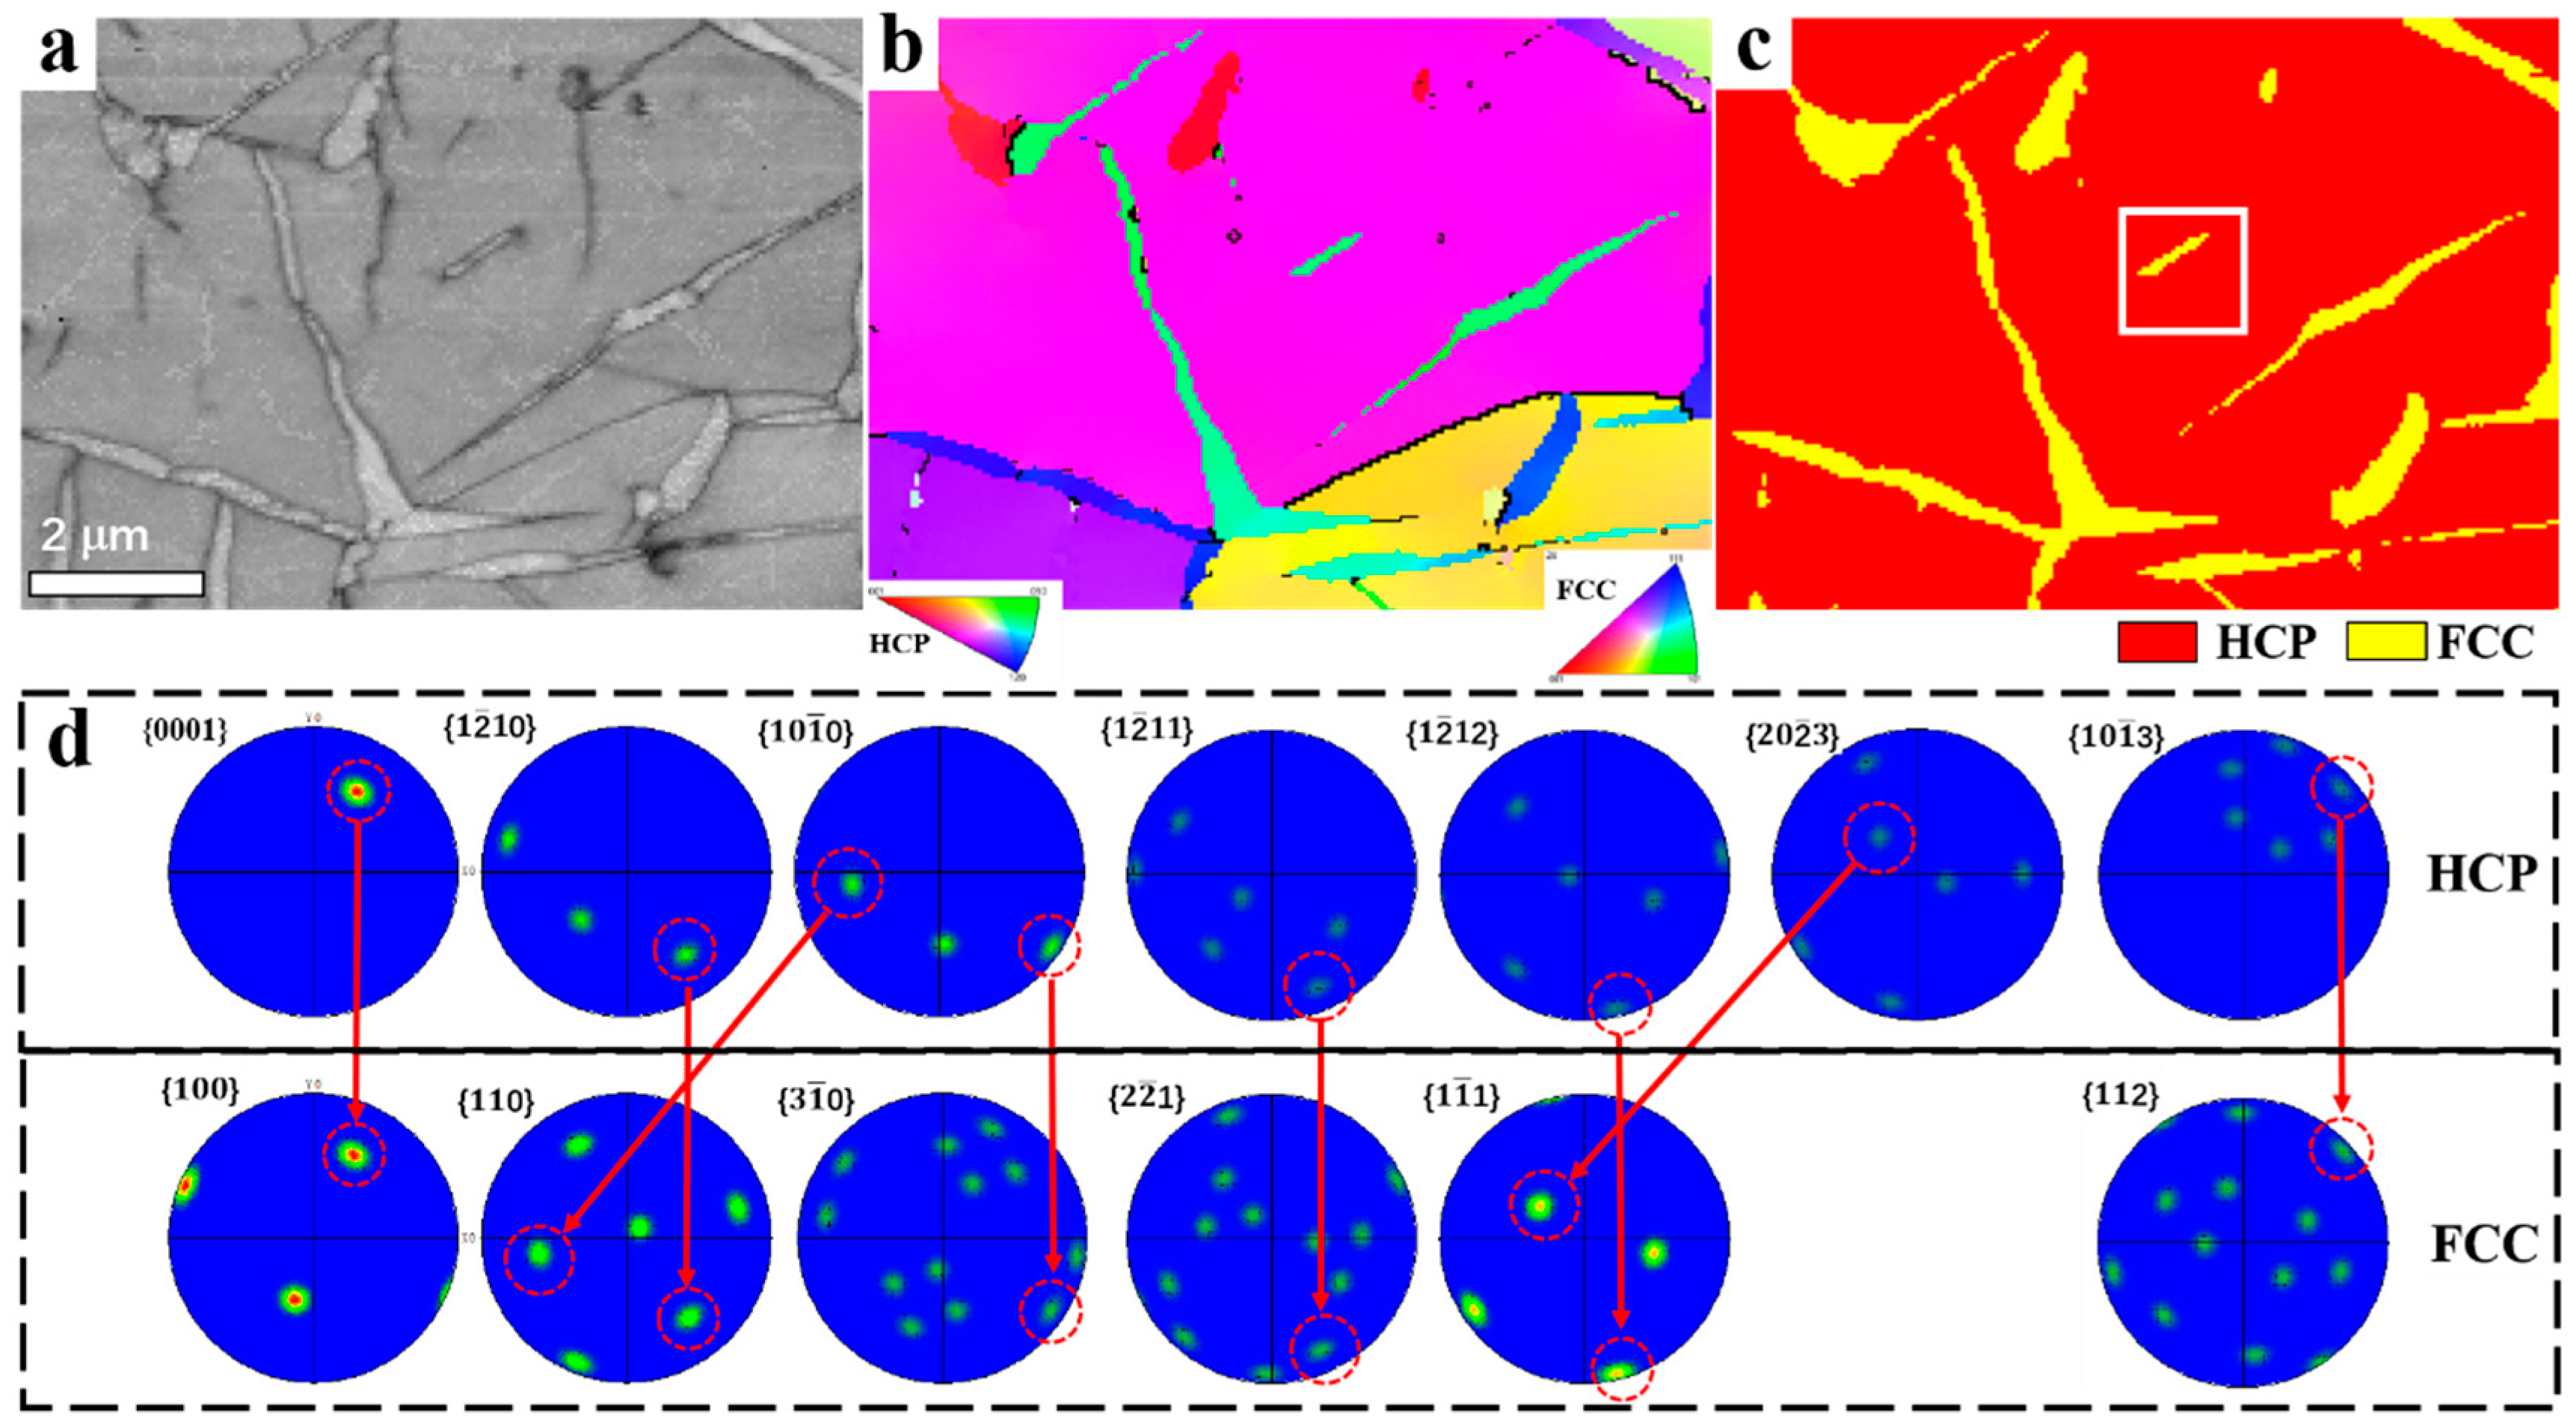
Therefore, it is quite feasible for identification of FCC-Ti phase. Figure 5 illustrates the FCC-Ti grains, characterized by the TKD testing. As shown in Figure 5a–c, the FCC-Ti laths were located both within the α grains and at the grain boundaries. The contoured , , , , , , poles of the HCP-Ti grain and , , , , , poles of the FCC-Ti grain from the marked regions in Figure 5c are plotted in Figure 5d. The parallel alignments of low-index directions and planes are marked by the red arrows, which are the same as those listed in Table 1. Pole figures (PFs) in Figure 5d obey the P-type OR between HCP-Ti and FCC-Ti phases: , , which was in agreement with SAED results in Table 1 and PFs result [10].
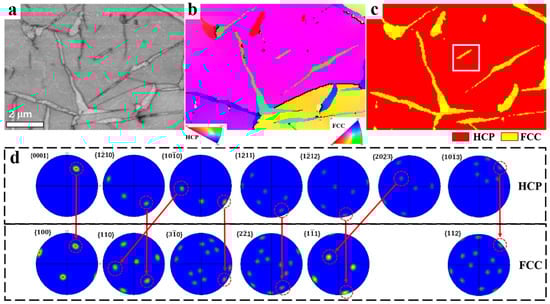
Figure 5.
TKD of the HCP-Ti and FCC-Ti phases. (a) Band contrast (BC); (b) inverse pole figure (IPF), (c) Phase mapping, the red part is HCP-Ti phase and the yellow part is the FCC-Ti phase; (d) PFs of the two phases.
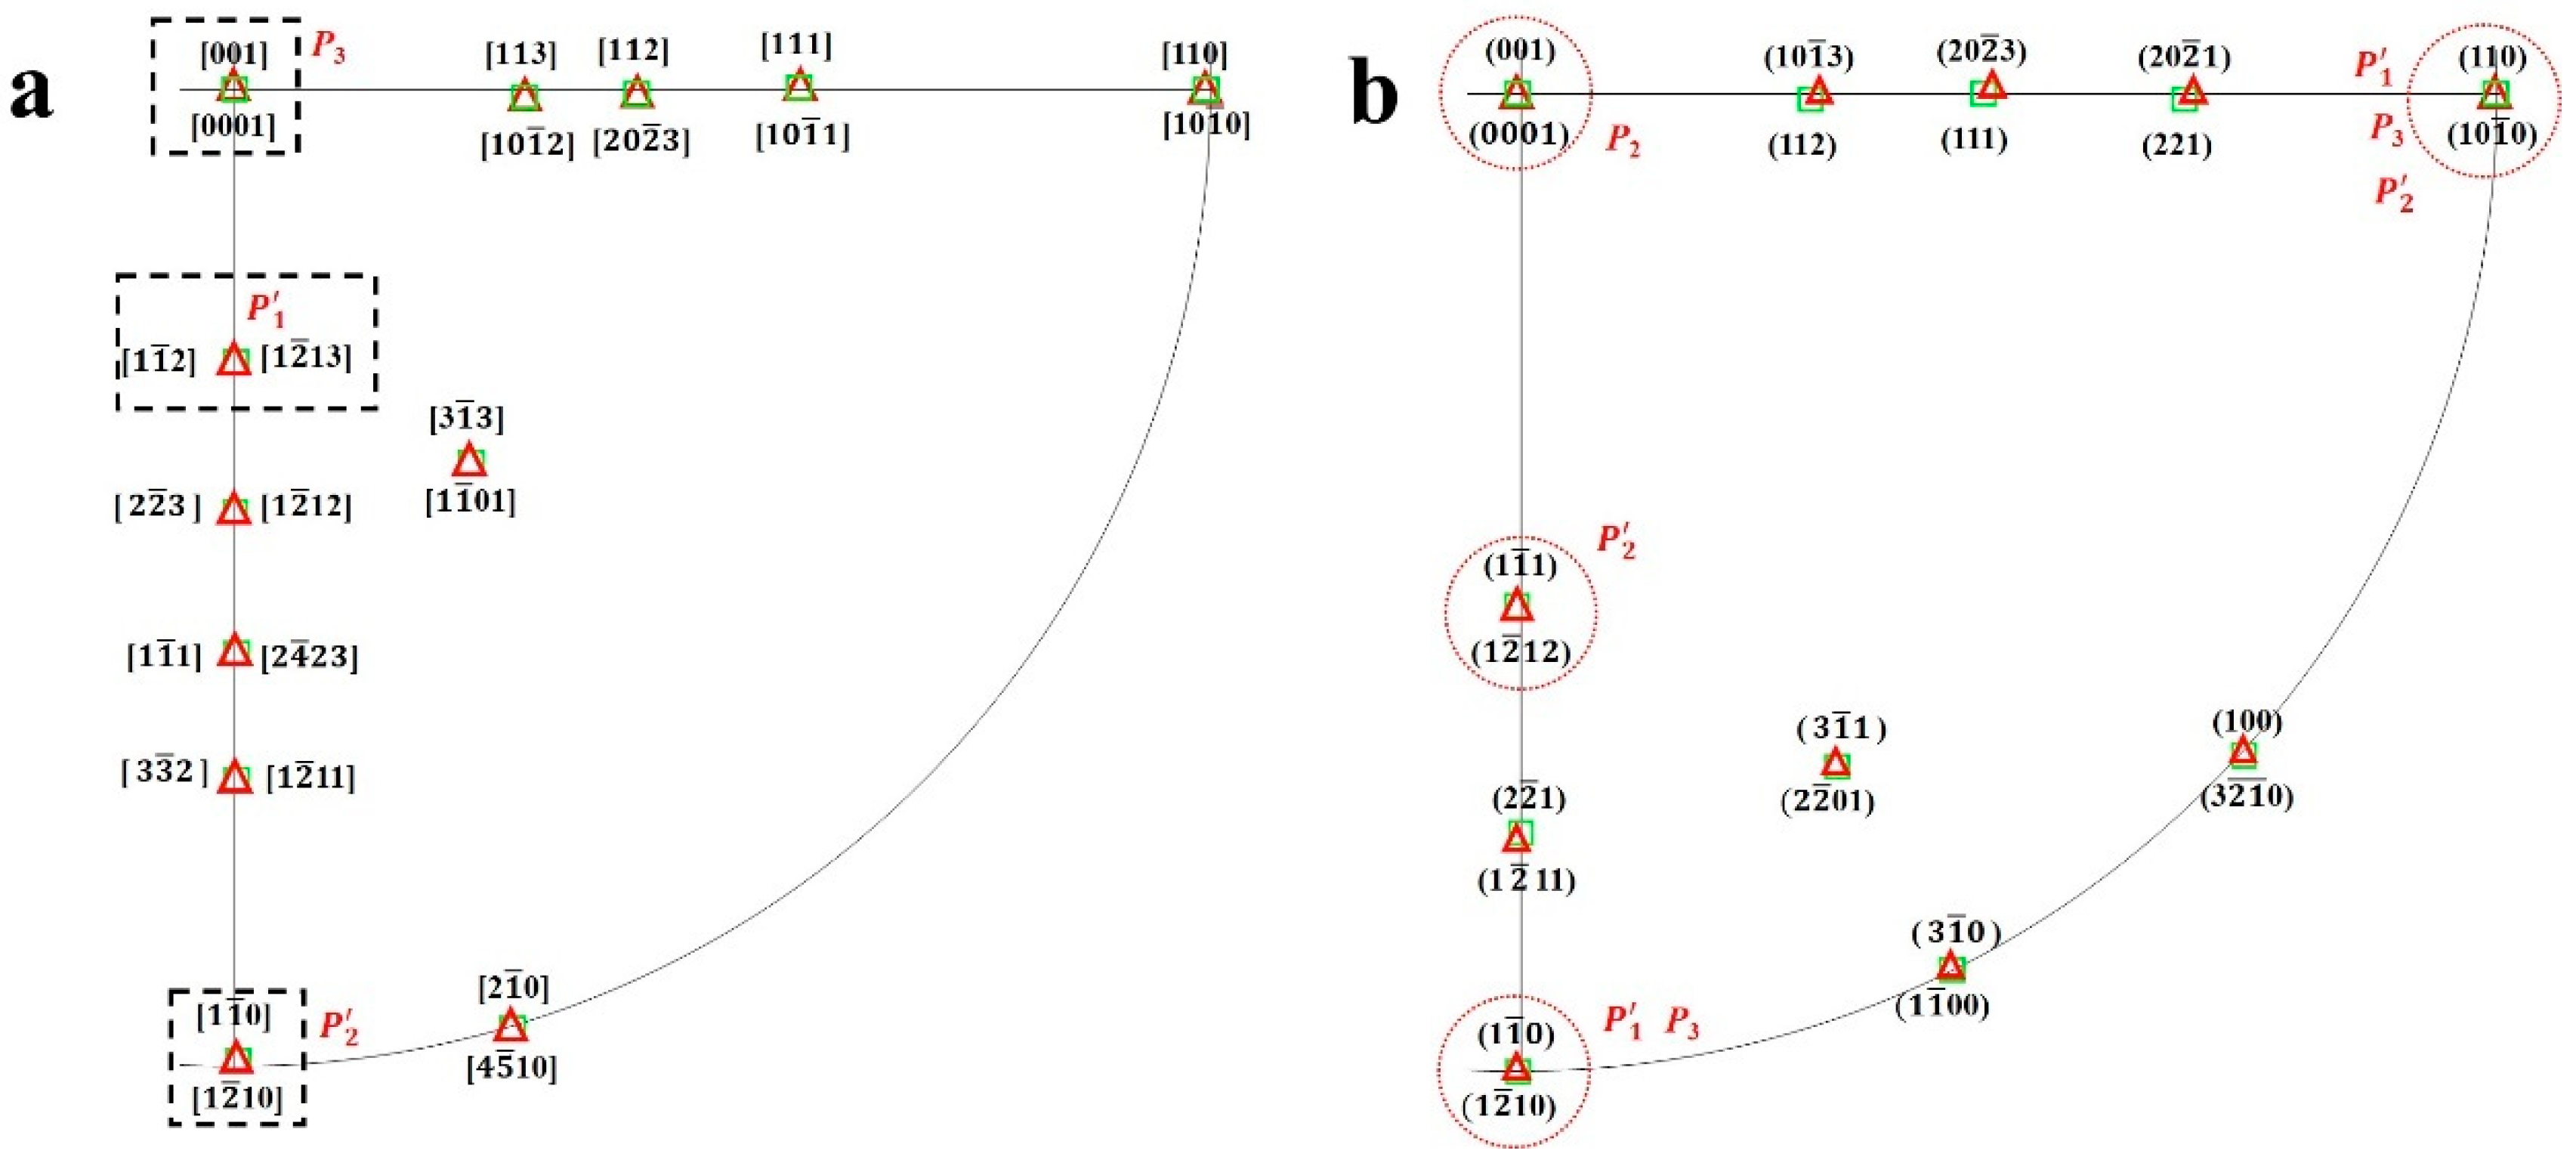
According to the TKD results in Figure 5, the composite PFs representation of HCP-Ti and FCC-Ti are satisfying the P-type OR is illustrated in Figure 6. Due to symmetry, only a quarter of the whole PF is shown, which is consistent with other study [9]. FCC-Ti phase may have several variants due to its high symmetry, for example, P1 () and () in Figure 6a, P2 (FCC) and (FCC) in Figure 6b are all equivalent. It can be concluded from the PF that P1, P2, and P3, the ORs induced from the SAED patterns in Figure 2 are equivalent, but the zone axis is different from each other during TEM analysis. Therefore, the PF is an important method to study the OR and variations of phase transition in HCP and FCC phases.
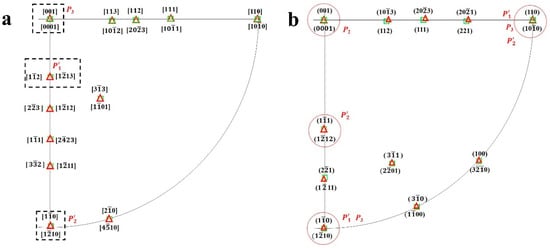
Figure 6.
Composite PFs representation of HCP and FCC satisfying the ORs. (a) Parallel crystal orientation indexes of two phase, (b) parallel plane indexes.
3.3. Matrix of Orientation Relationships
ORs mean that the second phase (S) and matrix (M) obey the conditions of parallel crystal orientation [uvw] and parallel crystal plane [hkl]. The transformation between crystal orientation and crystal plane, and the relationship between real space and reciprocal space of crystal can be characterized by the transformation matrix [29,43]. For the sake of simplicity, uppercase (HKL) and lowercase (hkl) represent the crystal plane index of M and S, respectively, and uppercase [UVW] and lowercase [uvw] represent the crystal orientation index of matrix and second phase, respectively.
It is known that the transformation matrix [B] of the parallel crystal orientation index of M and S is [44]:
In which, (HiKiLi) and (hikili) (i = 1,2,3) represent three groups of parallel crystal planes of M and S, respectively, is the interplanar spacing of the S phase (h1k1l1) crystal planes, is the plane spacing of M phase (HiKiLi) crystal planes.
The parallel crystal plane index [UVW] and [uvw] of M and S satisfying the special ORs is converted as follows:
It can be deduced that the transformation matrix of the parallel crystal plane indices of M and S phases is [R] = , and the transformation relationship between matrix and the parallel crystal plane of the second phase (HKL) and (hkl) is as follows [44]:
Formulas (5) and (6) show that if the M phase crystal plane (HKL) and crystal orientation [UVW] are known, the S phase crystal plane (hkl) and crystal orientation [uvw] can be obtained and vice versa.
As long as the matrix [B] is obtained, the crystal plane index or orientation index of M and S phases with specific ORs can be obtained. According to the ORs obtained by SEAD in Figure 1, three groups of parallel crystal planes (H1K1L1)//(h1k1l1), (H2K2L2)//(h2k2l2), (H3K3L3)//(h3k3l3) of α-HCP and the second FCC phase are, respectively, taken as , , .
The lattice parameters of HCP phase aα = 0.298 nm, c = 0.471 nm; The lattice parameter of FCC phase is aFCC = 0.425 nm. The above parameters are substituted into formula (4) to obtain matrix [B] and transpose matrix .
Table 2 and Table 3 show the possible parallel relationship between crystal plane and orientation predicted by [B] and [R] transformation matrix. Only some low orientation indexes and plane indexes are listed in the Table 2 and Table 3, which correspond to the points in the pole maps in Figure 5. It should be pointed out that the ORs obtained by transformation matrix is different from the result of edge-to-edge matching model prediction [45]. This model has been used to predict the OR between HCP Mg alloys and the FCC-precipitates via diffusion-controlled phase transformations.
Table 2.
Parallel crystal orientation indexes predicted by transformation matrix and PFs.
Table 3.
Parallel crystal plane indexes predicted by transformation matrix and PFs.
Even though [B] and [R] transformation matrix is obtained by P3 OR, the calculation results in Table 2 and Table 3 are consistent with P1 and P2 ORs. These results are also consistent with the P-type OR reported in literatures. The P-type OR has the same mechanism of phase transition as the Shockley partial dislocation sliding along the direction on the prism surface shown in Figure 3 and Figure 4.
Therefore, when the phase transition between HCP and FCC satisfies the specific crystallographic OR, the parallel crystal orientation and crystal plane indexes of the two phases can be accurately expressed by PFs and transformation matrix, and the second phase variants satisfying the OR can be predicted.
4. Conclusions
(1) A large number of FCC-Ti laths are found in the rolling structure of high purity titanium, and the OR between HCP and FCC phases is P type: , . The width of FCC-Ti laths is from 30 nm to 50 nm.
(2) According to the OR, the deformation mechanism of the phase transformation process is mainly realized by dislocation slip mechanism, and the phase transformation is caused by the Shockley partial dislocation sliding along the direction on the prism surface .
(3) Phase mapping and PF functions of TKD were quite feasible for the OR identification of a nanoscale FCC-Ti phase. When the phase transition between HCP and FCC obeys the specific crystallographic OR, the parallel crystal directions and planes of the two phases can be accurately expressed by pole figures and phase transition matrix, and the variants meeting the OR can be predicted.
Author Contributions
Conceptualization, F.B., L.Z. and H.Z.; data curation, F.B. and Q.Z.; writing—original draft preparation, F.B. and N.A.; writing—review and editing, N.A., L.Z. and H.Z.; formal analysis, F.B. and Q.Z.; supervision, L.Z.; funding acquisition, L.Z. and H.Z.; investigation, F.B. and J.S.; methodology, F.B. and Z.L.; project administration, L.Z., H.Z. and X.L.; resources, X.L. All authors have read and agreed to the published version of the manuscript.
Funding
This research was supported by the National Natural Science Foundation of China (No. 51874001), the Natural Science Foundation of Anhui Province (KJ2020A0252), and the Provincial college students’ innovative entrepreneurial training plan (Nos. S201910360162 and S202110360149).
Acknowledgments
The authors are thankful for providing material by Ningbo Chuangrun New Materials Co., Ltd., Ningbo, China.
Conflicts of Interest
The authors declare no conflict of interest.
References
- Yu, Q.; Kacher, J.; Gammer, C.; Traylor, R.; Samanta, A.; Yang, Z.Z.; Minor, A.M. In situ TEM observation of FCC Ti formation at elevated temperatures. Scr. Mater. 2017, 140, 9–12. [Google Scholar] [CrossRef] [Green Version]
- Shirooyeh, M.; Xu, J.; Langdon, T.G. Microhardness evolution and mechanical characteristics of commercial purity titanium processed by high-pressure torsion. Mater. Sci. Eng. 2014, 614, 223–231. [Google Scholar] [CrossRef]
- Hong, D.H.; Lee, T.W.; Lim, S.H.; Kim, W.Y.; Hwang, S.K. Stress-induced hexagonal close-packed to face-centered cubic phase transformation in commercial-purity titanium under cryogenic plane-strain compression. Scr. Mater. 2013, 69, 405–408. [Google Scholar] [CrossRef]
- Chakraborty, J.; Kumar, K.; Ranjan, R.; Chowdhury, S.G.; Singh, S.R. Thickness-dependent fcc–hcp phase transformation in polycrystalline titanium thin films. Acta Mater. 2011, 59, 2615–2623. [Google Scholar] [CrossRef]
- Hao, P.D.; Chen, P.; Deng, L.; Li, F.X.; Yi, J.H.; Şopu, D.; Eckert, J.; Tao, J.M.; Liu, Y.C.; Bao, R. Anisotropic elastic and thermodynamic properties of the HCP-Titanium and the FCC-Titanium structure under different pressures. J. Mater. Res. Technol. 2020, 9, 3488–3501. [Google Scholar] [CrossRef]
- Zheng, X.D.; Gong, M.Y.; Xiong, T.; Ge, H.L.; Yang, L.X.; Zhou, Y.T.; Zheng, S.J.; Wang, J.; Ma, X.L. Deformation induced FCC lamellae and their interaction in commercial pure Ti. Scr. Mater. 2019, 162, 326–330. [Google Scholar] [CrossRef]
- Zhao, H.; Ding, N.J.; Ren, Y.P.; Xie, H.B.; Yang, B.; Qin, G.W. Shear-induced hexagonal close-packed to face-centered cubic phase transition in pure titanium processed by equal channel angular drawing. J. Mater. Sci. 2019, 54, 7953–7960. [Google Scholar] [CrossRef]
- Kou, W.J.; Sun, Q.Y.; Xiao, L.; Sun, J. Plastic deformation-induced HCP-to-FCC phase transformation in submicron-scale pure titanium pillars. J. Mater. Sci. 2020, 55, 2193–2201. [Google Scholar] [CrossRef]
- Wei, B.Q.; Ni, S.; Liu, Y.; Song, M. Three dimensional crystallographic orientation relationships for hexagonal close packed structure to face centered cubic structure transformation in pure titanium. Scr. Mater. 2019, 169, 46–51. [Google Scholar] [CrossRef]
- Li, Z.; Cheng, X.; Li, J.; Wang, H.M. Formation of face-centered cubic titanium in laser surface re-melted commercially pure titanium plate. J. Mater. Sci. Technol. 2018, 34, 767–773. [Google Scholar] [CrossRef]
- Jing, R.; Liu, C.Y.; Ma, M.Z.; Liu, R.P. Microstructural evolution and formation mechanism of FCC titanium during heat treatment processing. J. Alloys Compd. 2013, 552, 202–207. [Google Scholar] [CrossRef]
- Jing, R.; Liang, S.X.; Liu, C.Y.; Ma, M.Z.; Liu, R.P. Aging effects on the microstructures and mechanical properties of the Ti–20Zr–6.5Al–4V alloy. Mater. Sci. Eng. 2013, 559, 474–479. [Google Scholar] [CrossRef]
- Bolokang, A.S.; Phasha, M.J.; Motaung, D.E.; Cummings, F.R.; Muller, T.F.G.; Arendse, C.J. Microstructure and phase transformation on milled and unmilled Ti induced by water quenching. Mater. Lett. 2014, 132, 157–161. [Google Scholar] [CrossRef]
- Ren, J.Q.; Sun, Q.Y.; Xiao, L.; Ding, X.D.; Sun, J. Phase transformation behavior in titanium single-crystal nanopillars under [0001] orientation tension: A molecular dynamics simulation. Comp. Mater. Sci. 2014, 92, 8–12. [Google Scholar] [CrossRef]
- Yang, J.X.; Zhao, H.L.; Gong, H.R.; Song, M.; Ren, Q.Q. Proposed mechanism of HCP → FCC phase transition in titianium through first principles calculation and experiments. Sci. Rep. 2018, 8, 1992. [Google Scholar] [CrossRef] [PubMed] [Green Version]
- Chen, P.; Wang, F.; Li, B. Transitory phase transformations during {101¯2} twinning in titanium. Acta Mater. 2019, 171, 65–78. [Google Scholar] [CrossRef]
- Wei, B.; Ni, S.; Liu, Y.; Liao, X.; Song, M. Phase transformation and structural evolution in a Ti-5at.% Al alloy induced by cold-rolling. J. Mater. Sci. Technol. 2020, 49, 211–223. [Google Scholar] [CrossRef]
- Liu, Y.G.; Li, M.Q.; Liu, H.J. Deformation induced face-centered cubic titanium and its twinning behavior in Ti–6Al–4V. Scr. Mater. 2016, 119, 5–8. [Google Scholar] [CrossRef]
- Ma, X.; Guo, X.; Fu, M.; Qiao, Y. In-situ TEM observation of hcp-Ti to fcc-Ti phase transformation in Nb-Ti-Si based alloys. Mater. Charact. 2018, 142, 332–339. [Google Scholar] [CrossRef]
- Niu, L.; Wang, S.; Chen, C.; Qian, S.F.; Liu, R.; Li, H.; Liao, B.; Zhong, Z.H.; Lu, P.; Wang, M.P. Mechanical behavior and deformation mechanism of commercial pure titanium foils. Mater. Sci. Eng. 2017, 707, 435–442. [Google Scholar] [CrossRef]
- Bai, F.; Yin, L.; Zhao, W.; Zhou, H.; Song, M.; Liu, Y.; Liu, X. Deformational behavior of face-centered cubic (FCC) phase in high-pure titanium. Mater. Sci. Eng. 2021, 800, 140287. [Google Scholar] [CrossRef]
- Ren, L.; Xiao, W.; Kent, D.; Wan, M.; Ma, C.; Zhou, L. Simultaneously enhanced strength and ductility in a metastable β-Ti alloy by stress-induced hierarchical twin structure. Scr. Mater. 2020, 184, 6–11. [Google Scholar] [CrossRef]
- Fu, Y.; Xiao, W.L.; Kent, D.; Dargusch, M.S.; Wang, J.S.; Zhao, X.Q.; Ma, C.L. Ultrahigh strain hardening in a transformation-induced plasticity and twinning-induced plasticity titanium alloy. Scr. Mater. 2020, 187, 285–290. [Google Scholar] [CrossRef]
- Zhou, P.; Zhu, G.-Z. Strain Accommodations among Twin Variants in Ti and Mg. Crystals 2021, 11, 453. [Google Scholar] [CrossRef]
- Dyakonov, G.S.; Mironov, S.; Semenova, I.P.; Valiev, R.Z.; Semiatin, S.L. EBSD analysis of grain-refinement mechanisms operating during equal-channel angular pressing of commercial-purity titanium. Acta Mater. 2019, 173, 174–183. [Google Scholar] [CrossRef]
- Zu, Q.; Guo, Y.-F.; Yao, X. Surface and orientation effects on stress-induced hcp-fcc phase transformation in Ti nanopillars. Appl. Surf. Sci. 2020, 509, 145234. [Google Scholar] [CrossRef]
- Yu, Q.B.; Liu, X.H.; Tang, D.L. Extreme Extensibility of Copper Foil under Compound Forming Conditions. Sci. Rep. 2013, 3, 3556. [Google Scholar] [CrossRef] [PubMed] [Green Version]
- Chen, S.D.; Liu, X.H.; Liu, L.Z.; Song, M. Crystal plasticity finite element simulation of slip and deformation in ultrathin copper strip rolling. Acta Metall. Sin. 2016, 52, 120–128. [Google Scholar] [CrossRef]
- Wang, S.; Niu, L.; Chen, C.; Pang, Y.; Liao, B.; Zhong, Z.H.; Lu, P.; Li, P.; Wu, X.D.; Coenen, J.W. Size effects on the tensile properties and deformation mechanism of commercial pure titanium foils. Mater. Sci. Eng. 2018, 730, 244–261. [Google Scholar] [CrossRef]
- Bai, F.M.; Ye, X.; Zhang, H.Y.; Zhou, H.W.; Song, M.; Sun, Y.X.; He, Y.Z. A significant increase in the hardness of nanotwinned titanium alloys prepared via the martensitic phase transformation. Mater. Lett. 2019, 255, 126507. [Google Scholar] [CrossRef]
- Wu, H.C.; Kumar, A.; Wang, J.; Bi, X.F.; Tomé, C.N.; Zhang, Z.; Mao, S.X. Rolling-induced Face Centered Cubic Titanium in Hexagonal Close Packed Titanium at Room Temperature. Sci. Rep. 2016, 6, 24370. [Google Scholar] [CrossRef] [PubMed]
- Zheng, Y.; Williams, R.E.A.; Wang, D.; Shi, R.; Nag, S.; Kami, P.; Sosa, J.M.; Banerjee, R.; Wang, Y.; Fraser, H.L. Role of ω phase in the formation of extremely refined intragranular α precipitates in metastable β-titanium alloys. Acta Mater. 2016, 103, 850–858. [Google Scholar] [CrossRef]
- Wen, J.; Allain, N.; Fleury, E. Determination of orientation relationships between FCC-hydride and HCP-titanium and their correlation with hydrides distribution. J. Alloys Compd. 2020, 817, 153297. [Google Scholar] [CrossRef]
- Conforto, E.; Caillard, D. A fast method for determining favourable orientation relationships and interface planes: Application to titanium–titanium hydrides transformations. Acta Mater. 2007, 55, 785–798. [Google Scholar] [CrossRef]
- Chang, Y.; Zhang, S.; Liebscher, C.H.; Dye, D.; Ponge, D.; Scheu, C.; Dehm, G.; Raabe, D.; Gault, B.; Lu, W. Could face-centered cubic titanium in cold-rolled commercially-pure titanium only be a Ti-hydride? Scr. Mater. 2020, 178, 39–43. [Google Scholar] [CrossRef] [Green Version]
- Sarkar, R.; Ghosal, P.; Prasad, K.S.; Nandy, T.K.; Ray, K.K. An FCC phase in a metastable β-titanium alloy. Phil. Mag. Lett. 2014, 94, 311–318. [Google Scholar] [CrossRef]
- Manna, I.; Chattopadhyay, P.P.; Nandi, P.; Banhart, F.; Fecht, H.-J. Formation of face-centered-cubic titanium by mechanical attrition. J. Appl. Phys. 2003, 93, 1520–1524. [Google Scholar] [CrossRef]
- Ali, N.; Zhang, L.; Zhou, H.; Zhao, A.; Zhang, C.; Fu, K.; Cheng, J. Effect of soft reduction technique on microstructure and toughness of medium carbon steel. Mater. Today Commun. 2021, 26, 102130. [Google Scholar] [CrossRef]
- Zhao, P.; Chen, B.; Kelleher, J.; Yuan, G.; Guan, B.; Zhang, X.; Tu, S. High-cycle-fatigue induced continuous grain growth in ultrafine-grained titanium. Acta Mater. 2019, 174, 29–42. [Google Scholar] [CrossRef]
- Liu, C.; Li, G.; Gu, H.; Yuan, F.; Han, F.; Ali, M.; Zhang, Y.; Guo, W. Observation of FCC-Zr phase in as-cast Zircaloy-4 alloy. Mater. Lett. 2020, 267, 127551. [Google Scholar] [CrossRef]
- Liu, J.; Yu, H.; Karamched, P.; Hu, J.; He, G.; Goran, D.; Hughes, G.M.; Wilkinson, A.J.; Lozano-Perez, S.; Grovenor, C.R.M. Mechanism of the α-Zr to hexagonal-ZrO transformation and its impact on the corrosion performance of nuclear Zr alloys. Acta Mater. 2019, 179, 328–341. [Google Scholar] [CrossRef]
- Xiao, B.; Xu, L.; Cayron, C.; Xue, J.; Sha, G.; Logé, R. Solute-dislocation interactions and creep-enhanced Cu precipitation in a novel ferritic-martensitic steel. Acta Mater. 2020, 195, 199–208. [Google Scholar] [CrossRef]
- Li, X.L.; Deng, X.T.; Lei, C.S.; Wang, Z.D. New orientation relationship with low interfacial energy in MC/ferrite system observed in Nb-Ti bearing steel during isothermal quenching process. Scr. Mater. 2019, 163, 101–106. [Google Scholar] [CrossRef]
- Rong, Y. Introduction to Analytical Electron Microscopy, 2nd ed.; Higher Education Press: Beijing, China, 2015. [Google Scholar]
- Zhang, M.X.; Kelly, P.M. Edge-to-edge matching and its applications: Part II. Application to Mg–Al, Mg–Y and Mg–Mn alloys. Acta Mater. 2005, 53, 1085–1096. [Google Scholar] [CrossRef]

Publisher’s Note: MDPI stays neutral with regard to jurisdictional claims in published maps and institutional affiliations. |
© 2021 by the authors. Licensee MDPI, Basel, Switzerland. This article is an open access article distributed under the terms and conditions of the Creative Commons Attribution (CC BY) license (https://creativecommons.org/licenses/by/4.0/).