
Development and Optimization of VGF-GaAs Crystal Growth Process Using Data Mining and Machine Learning Techniques


Abstract
:
1. Introduction
2. Models and Methodology
2.1. Generation of Training Data by CFD Modelling
2.2. Data Mining
2.3. Machine Learning
3. Results and Discussion
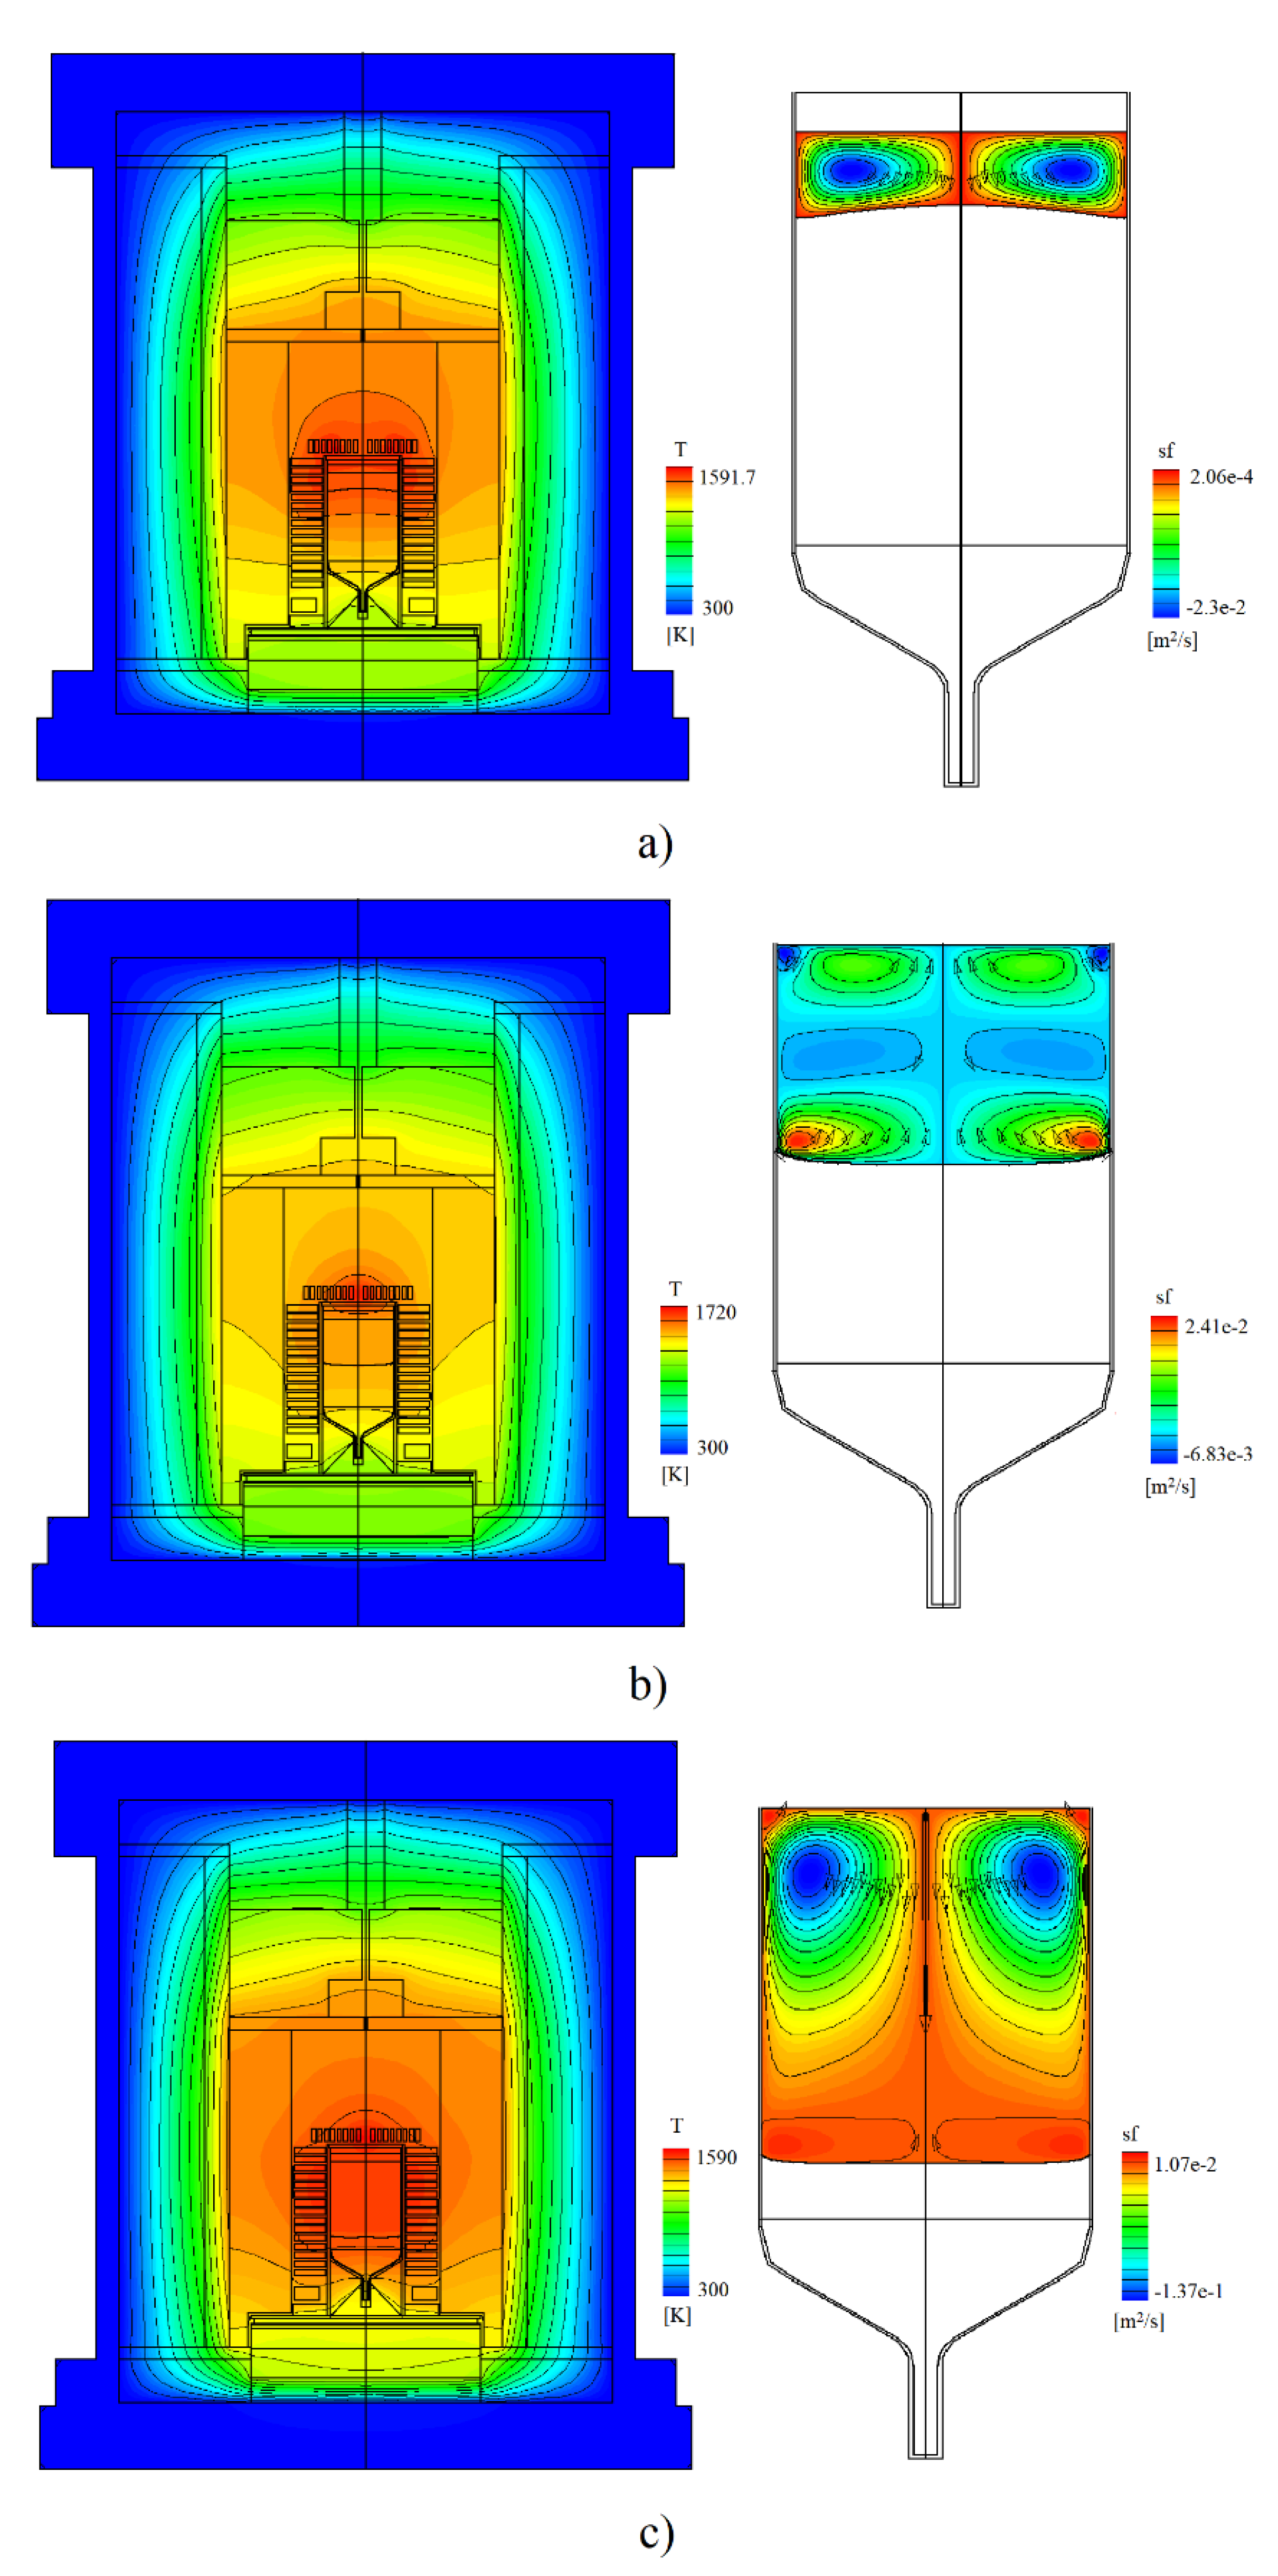
3.1. CFD Modeling
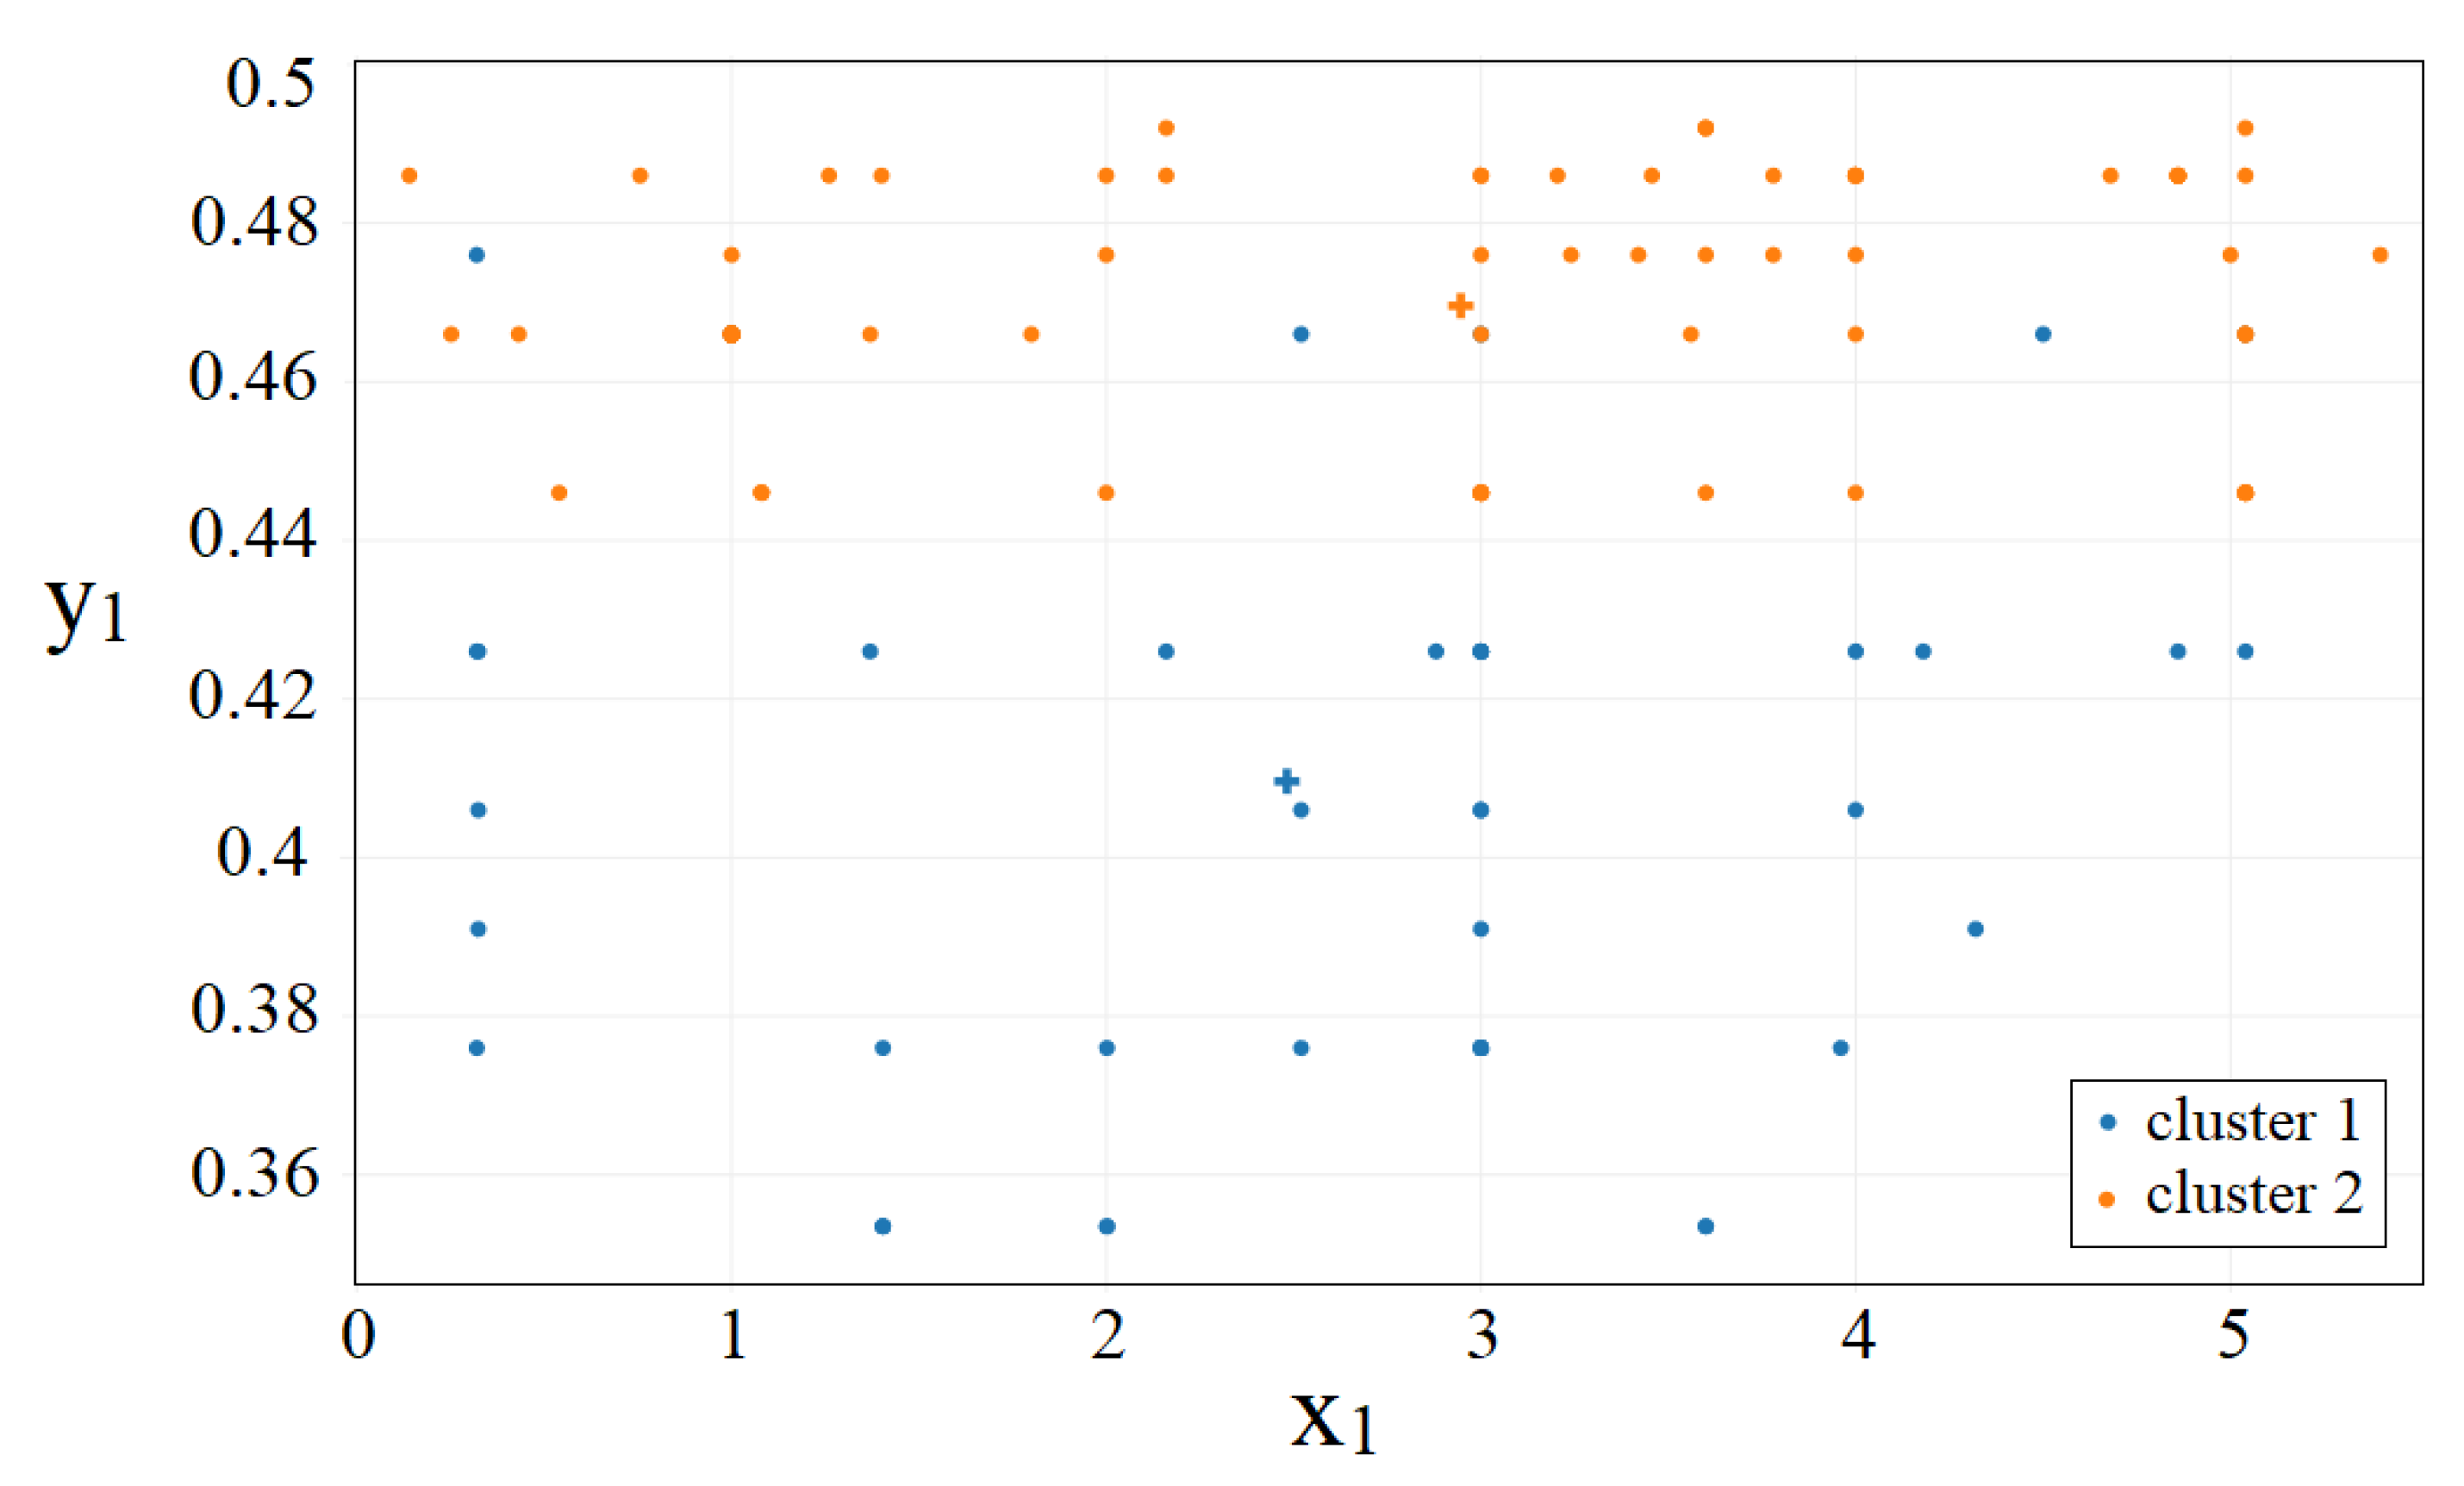
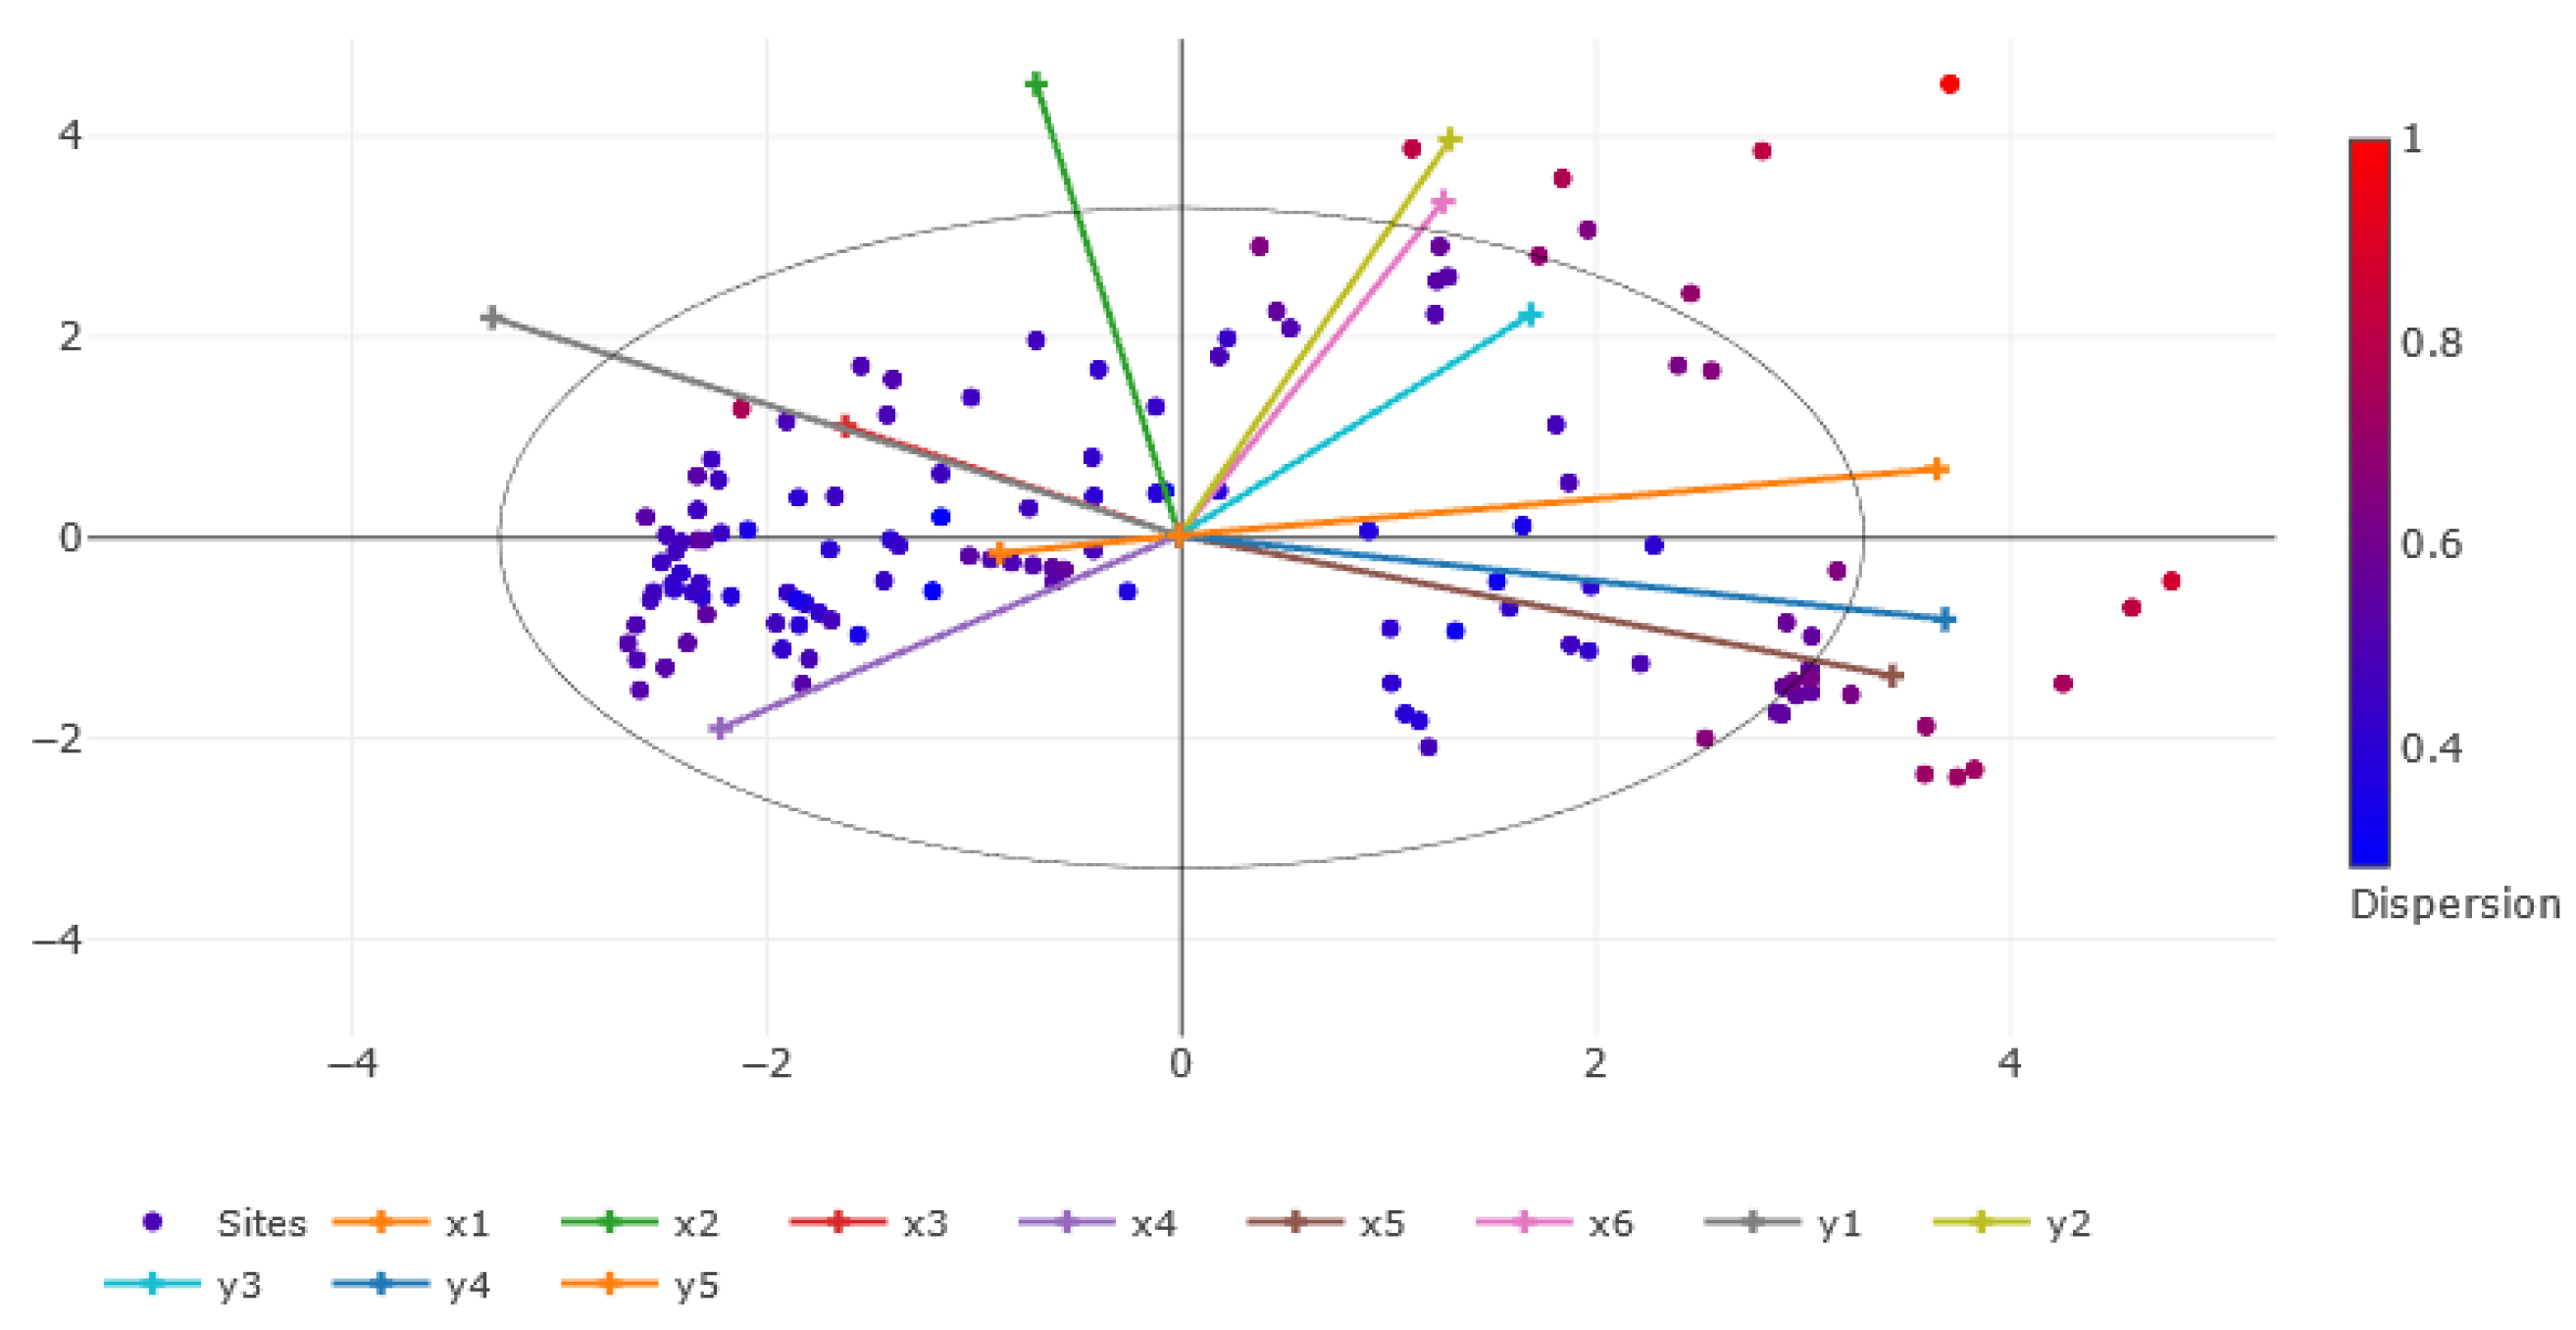
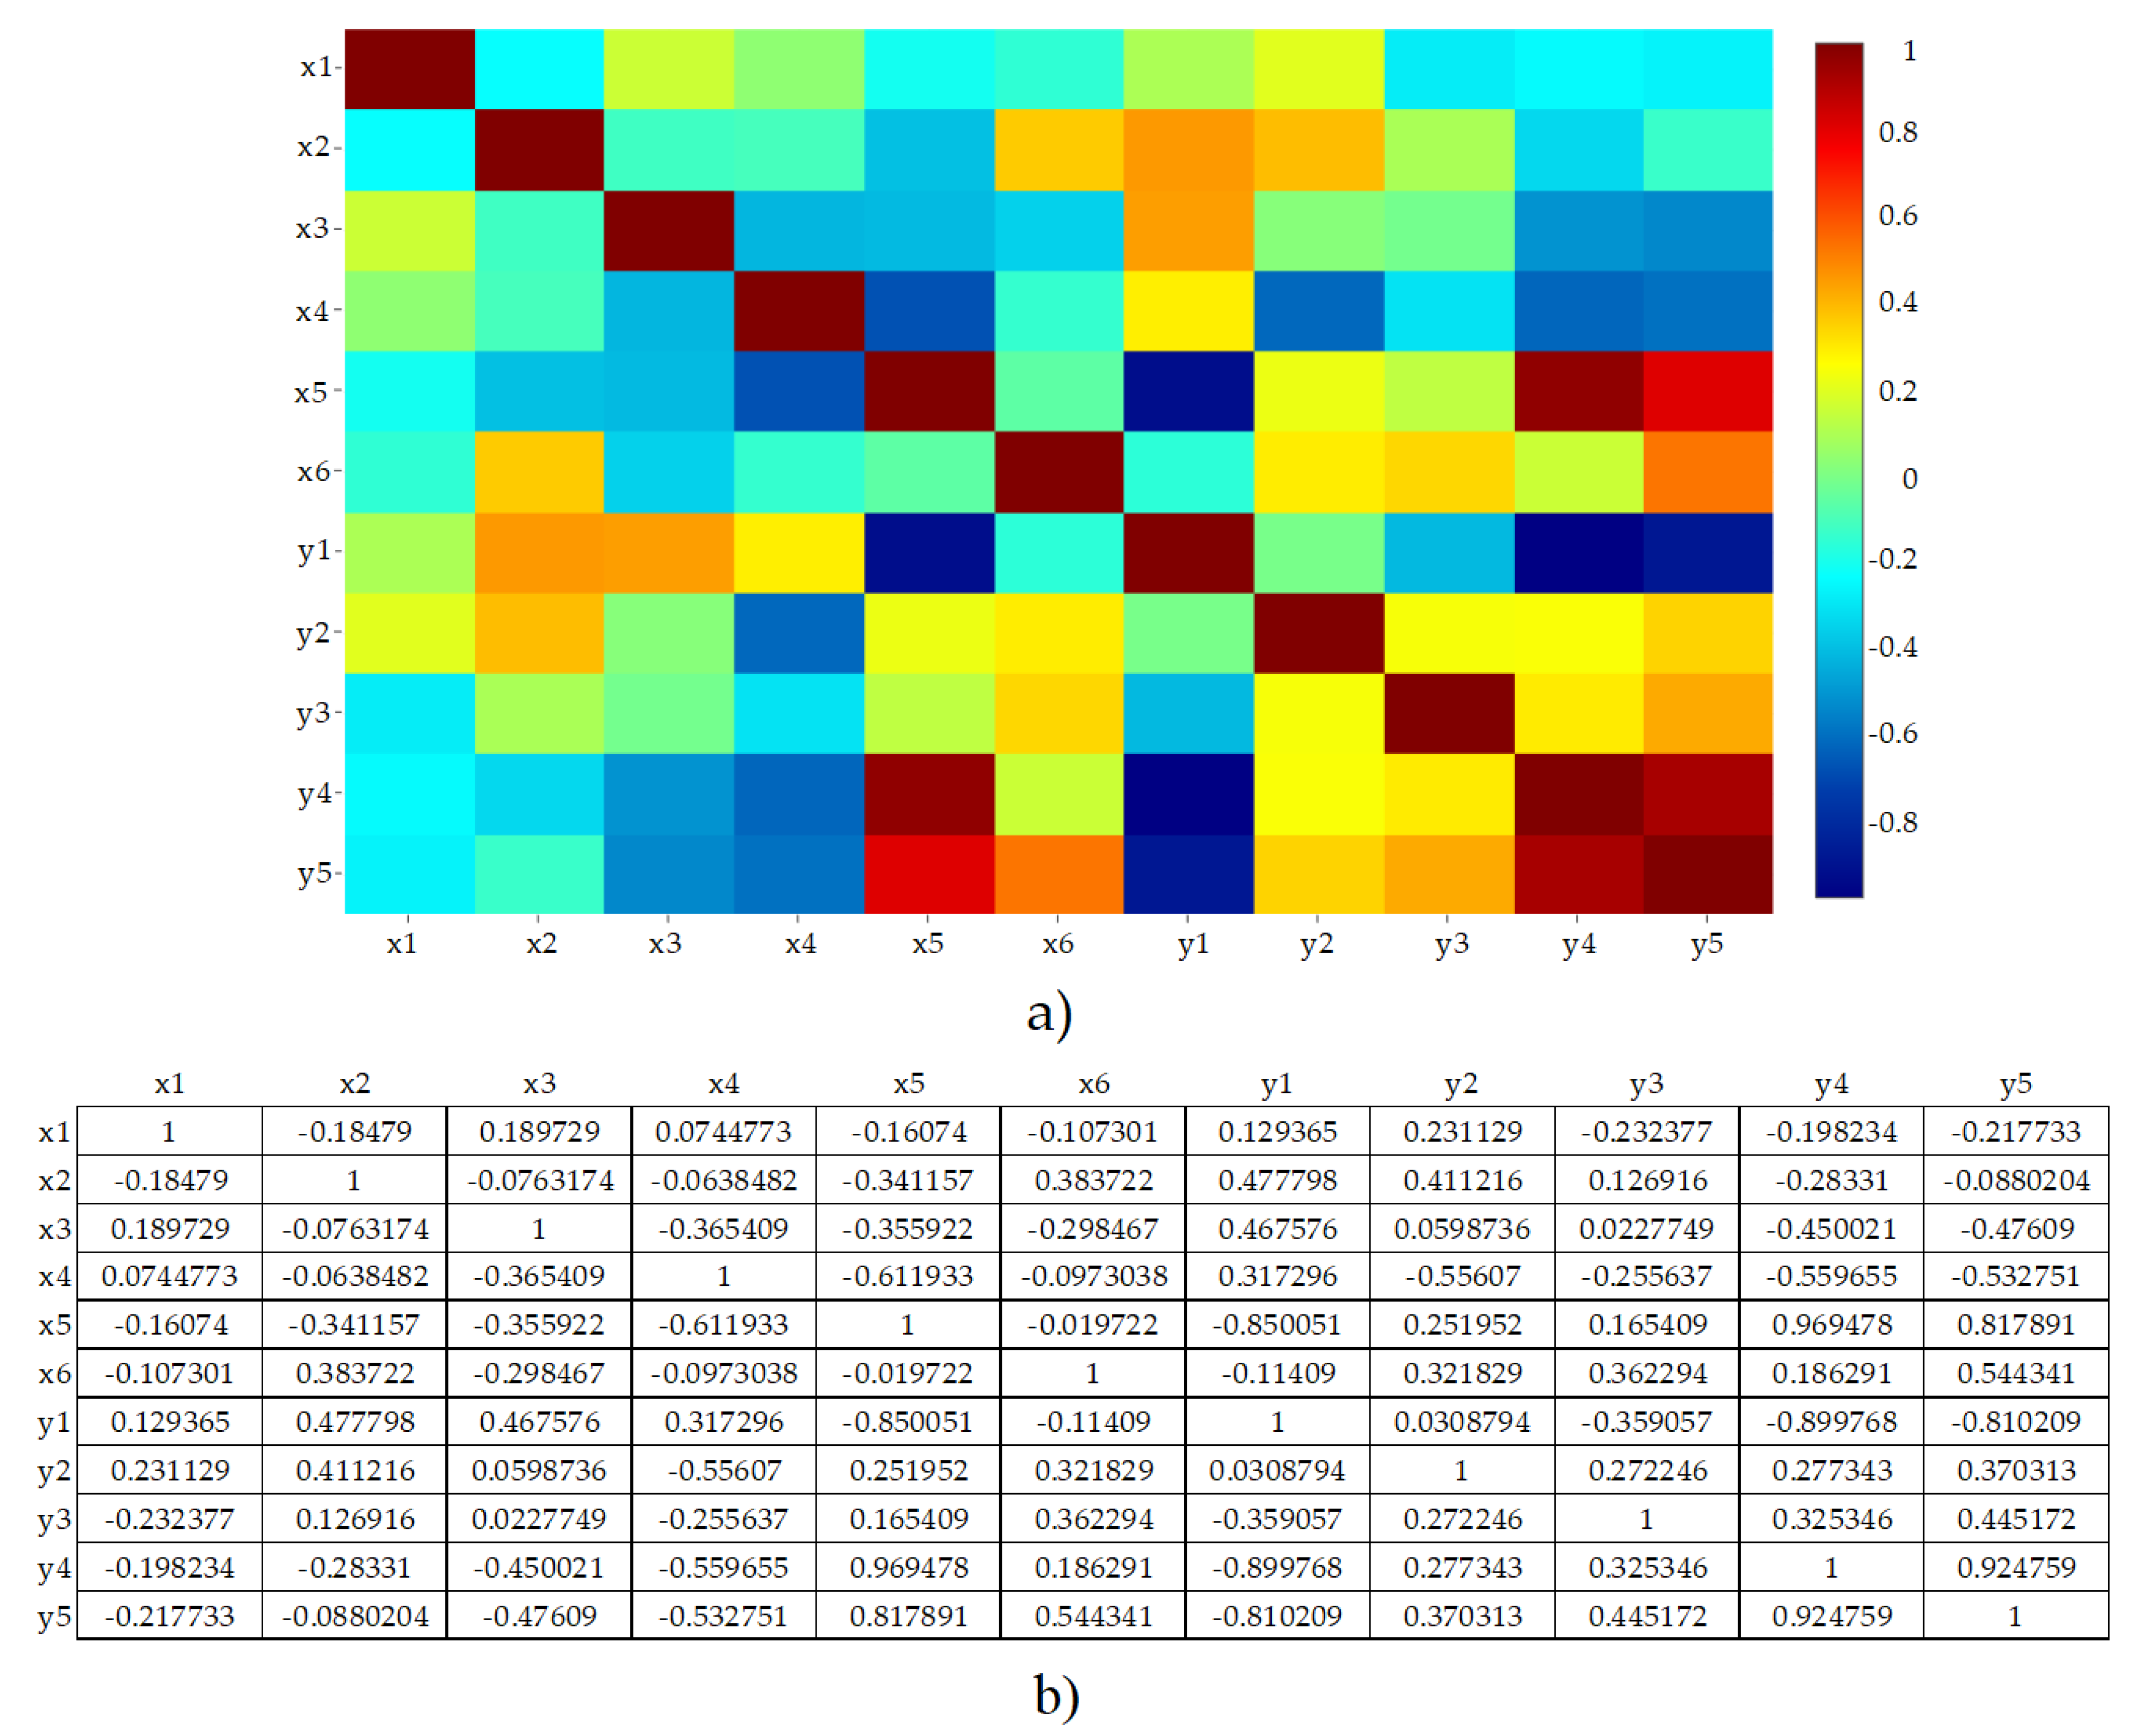
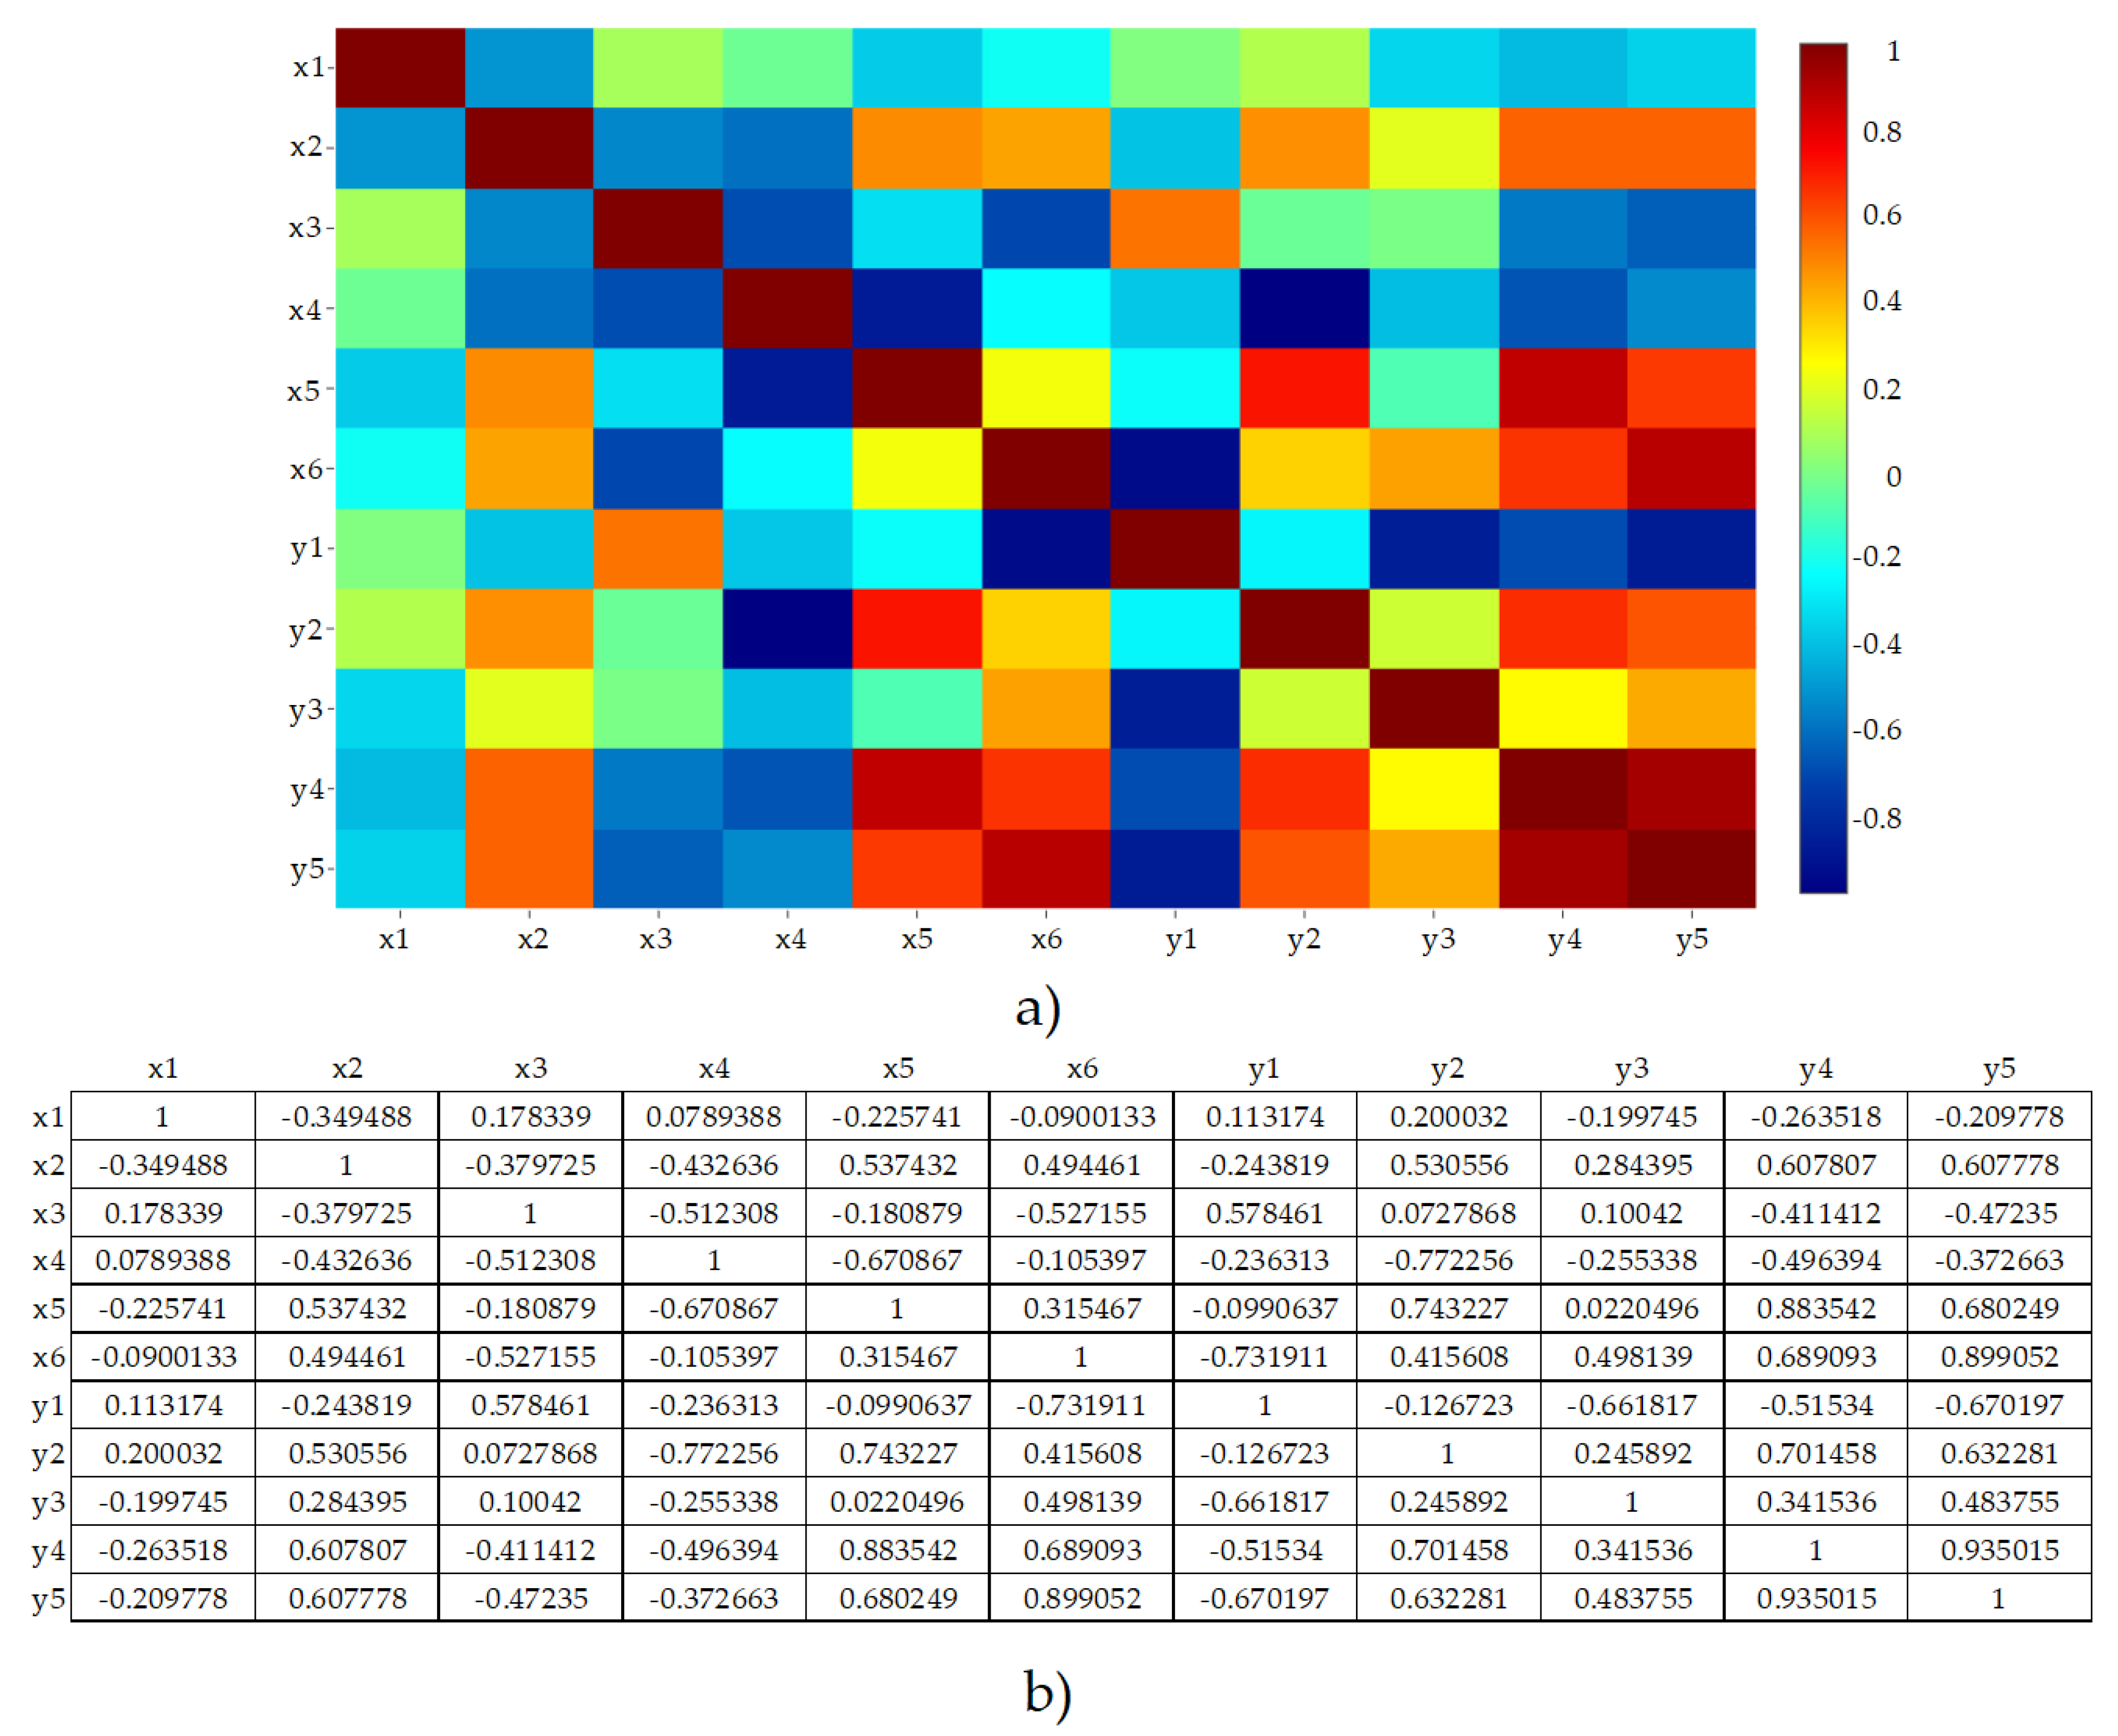
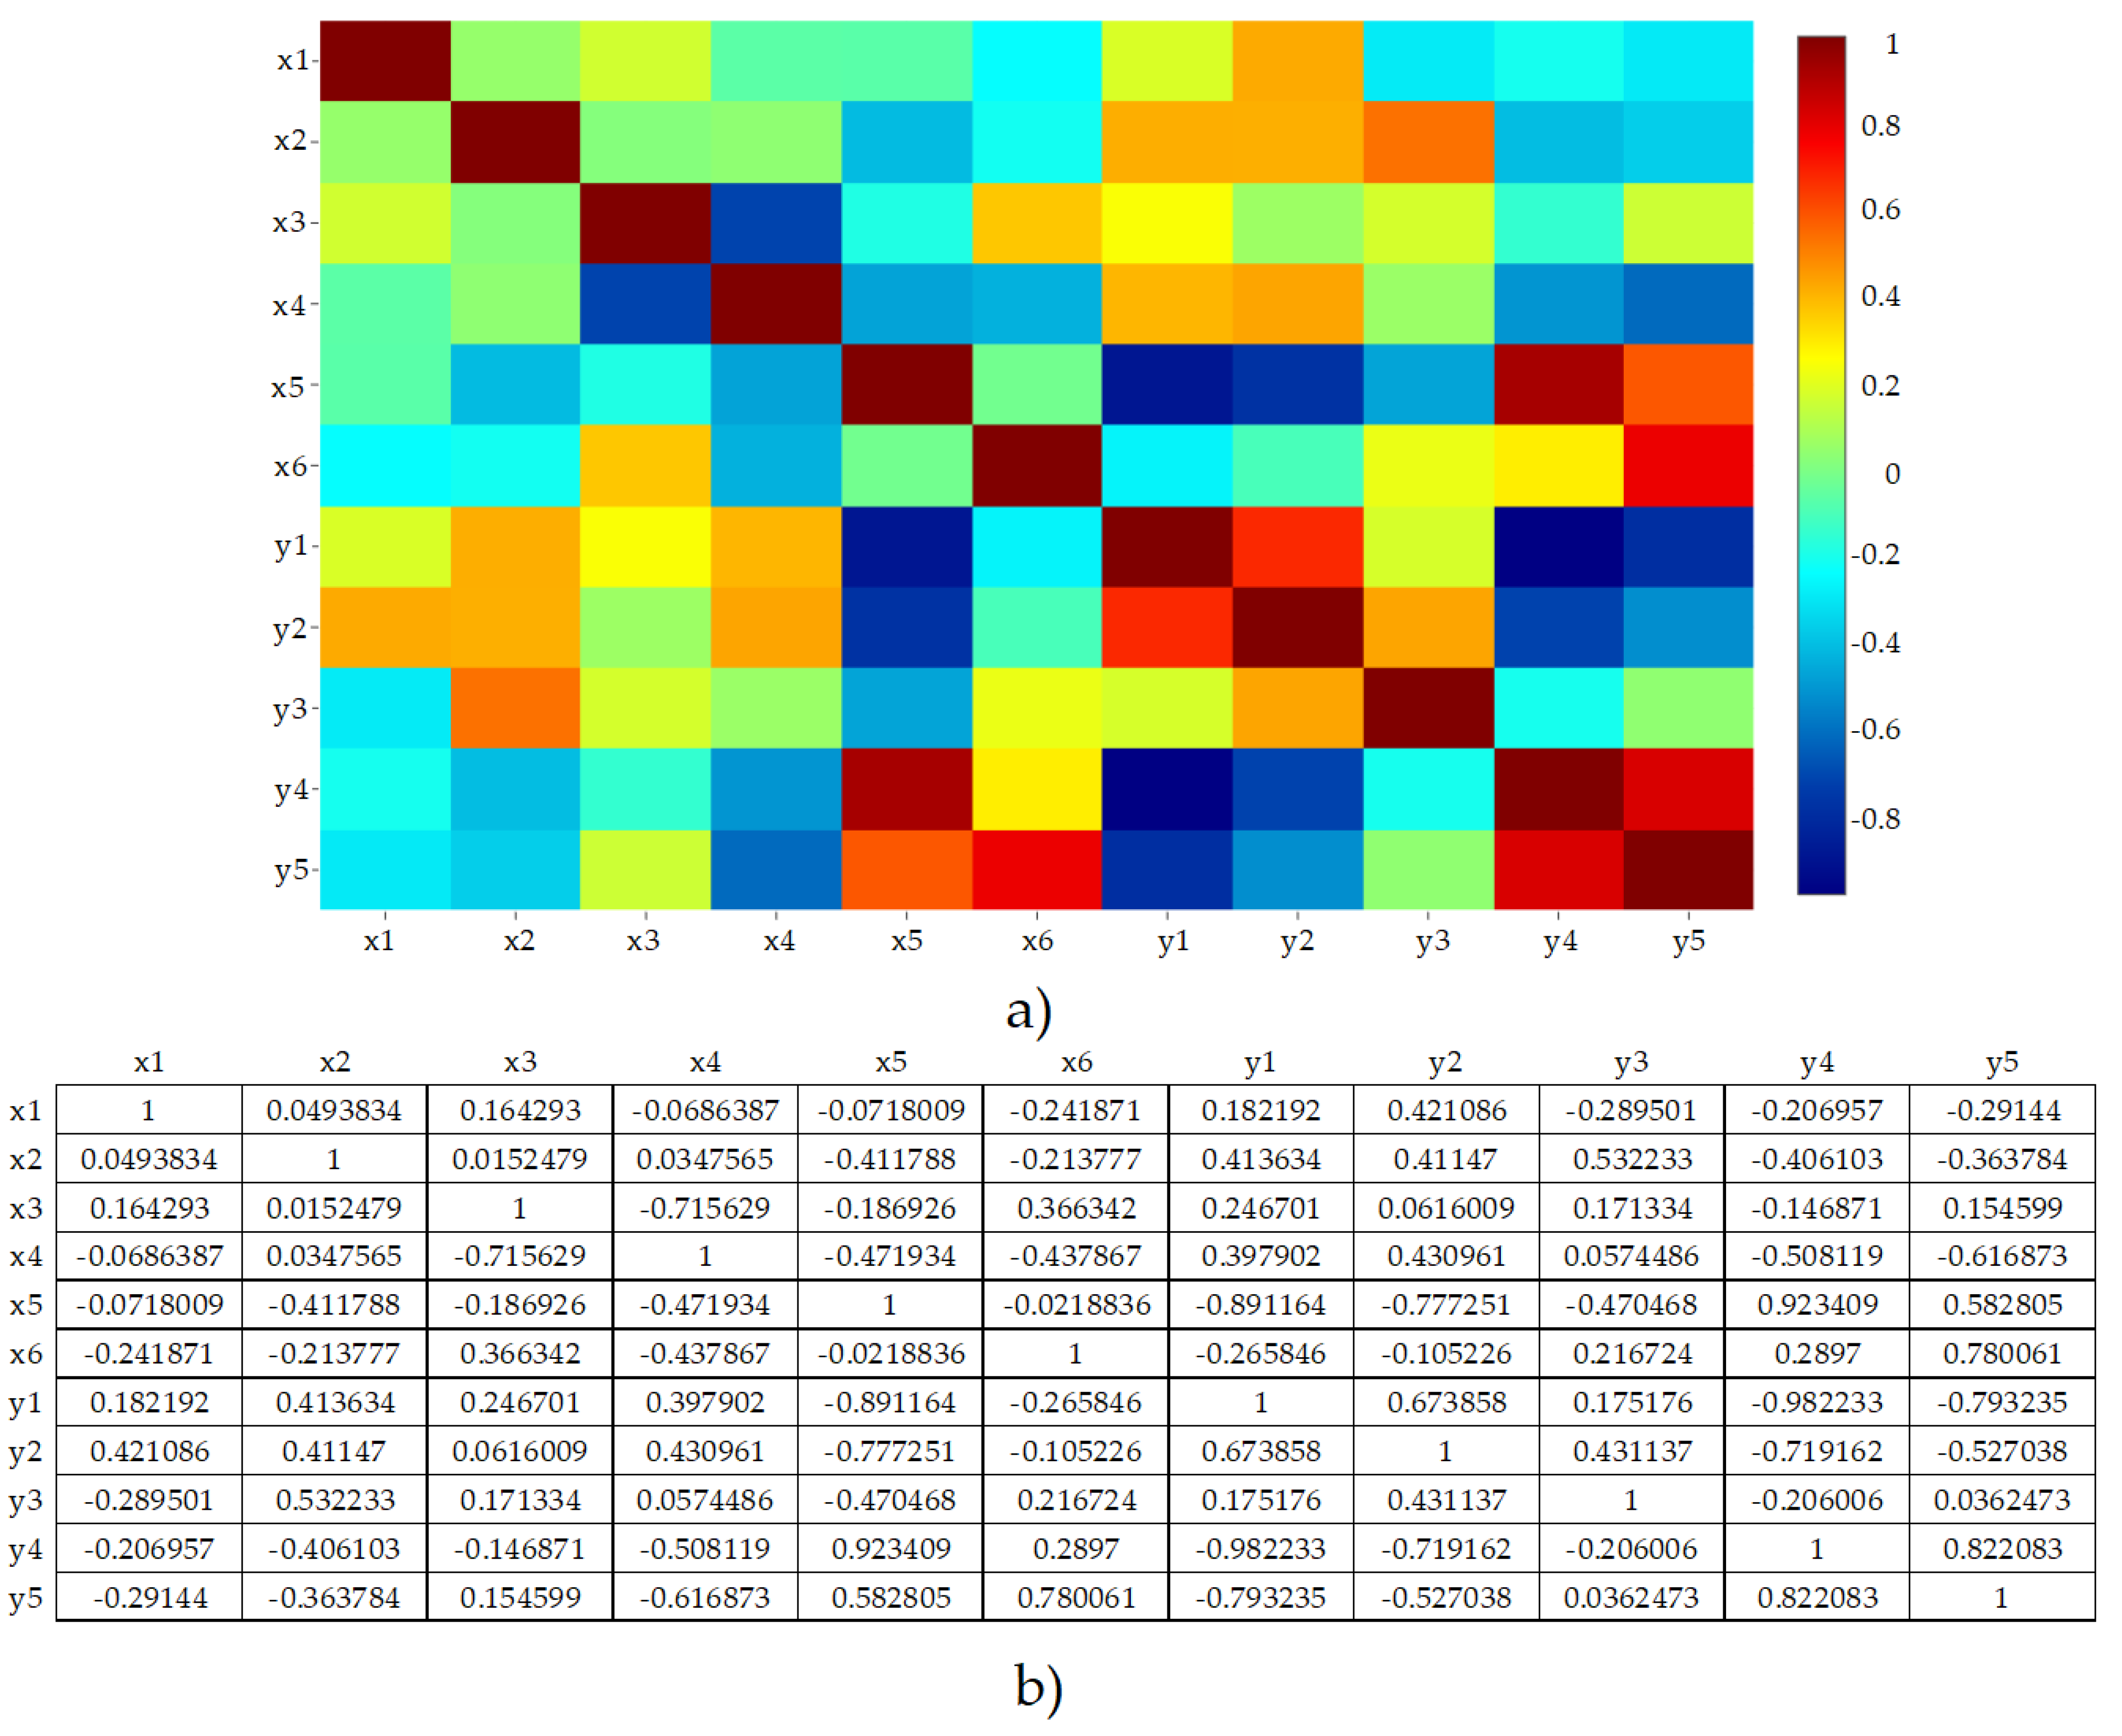
3.2. Data Mining
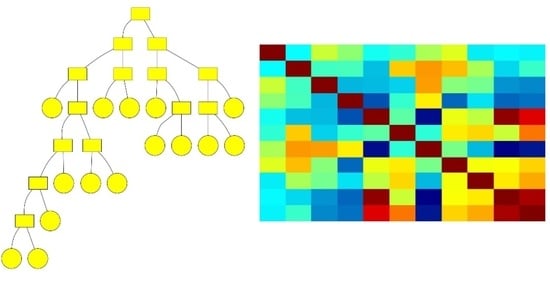
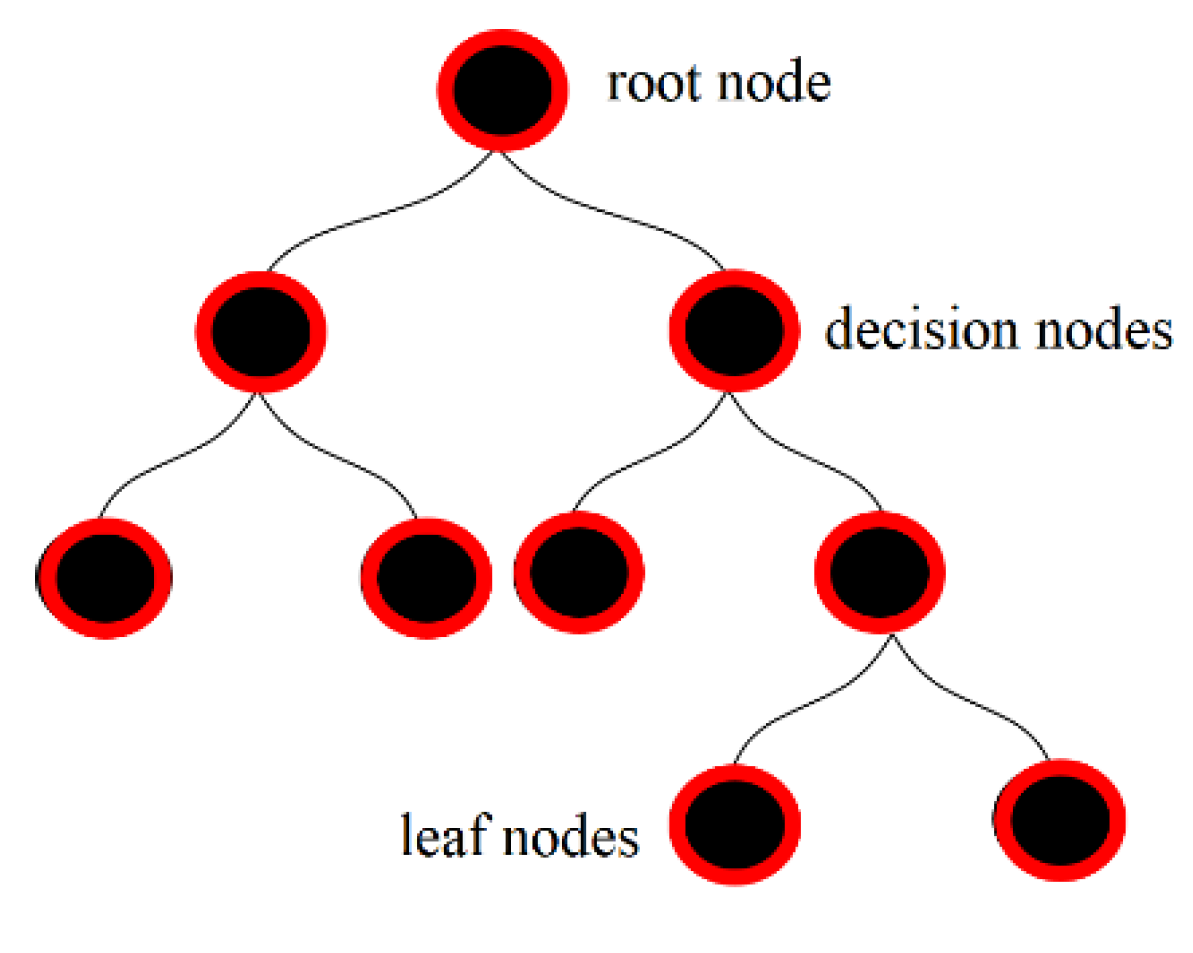
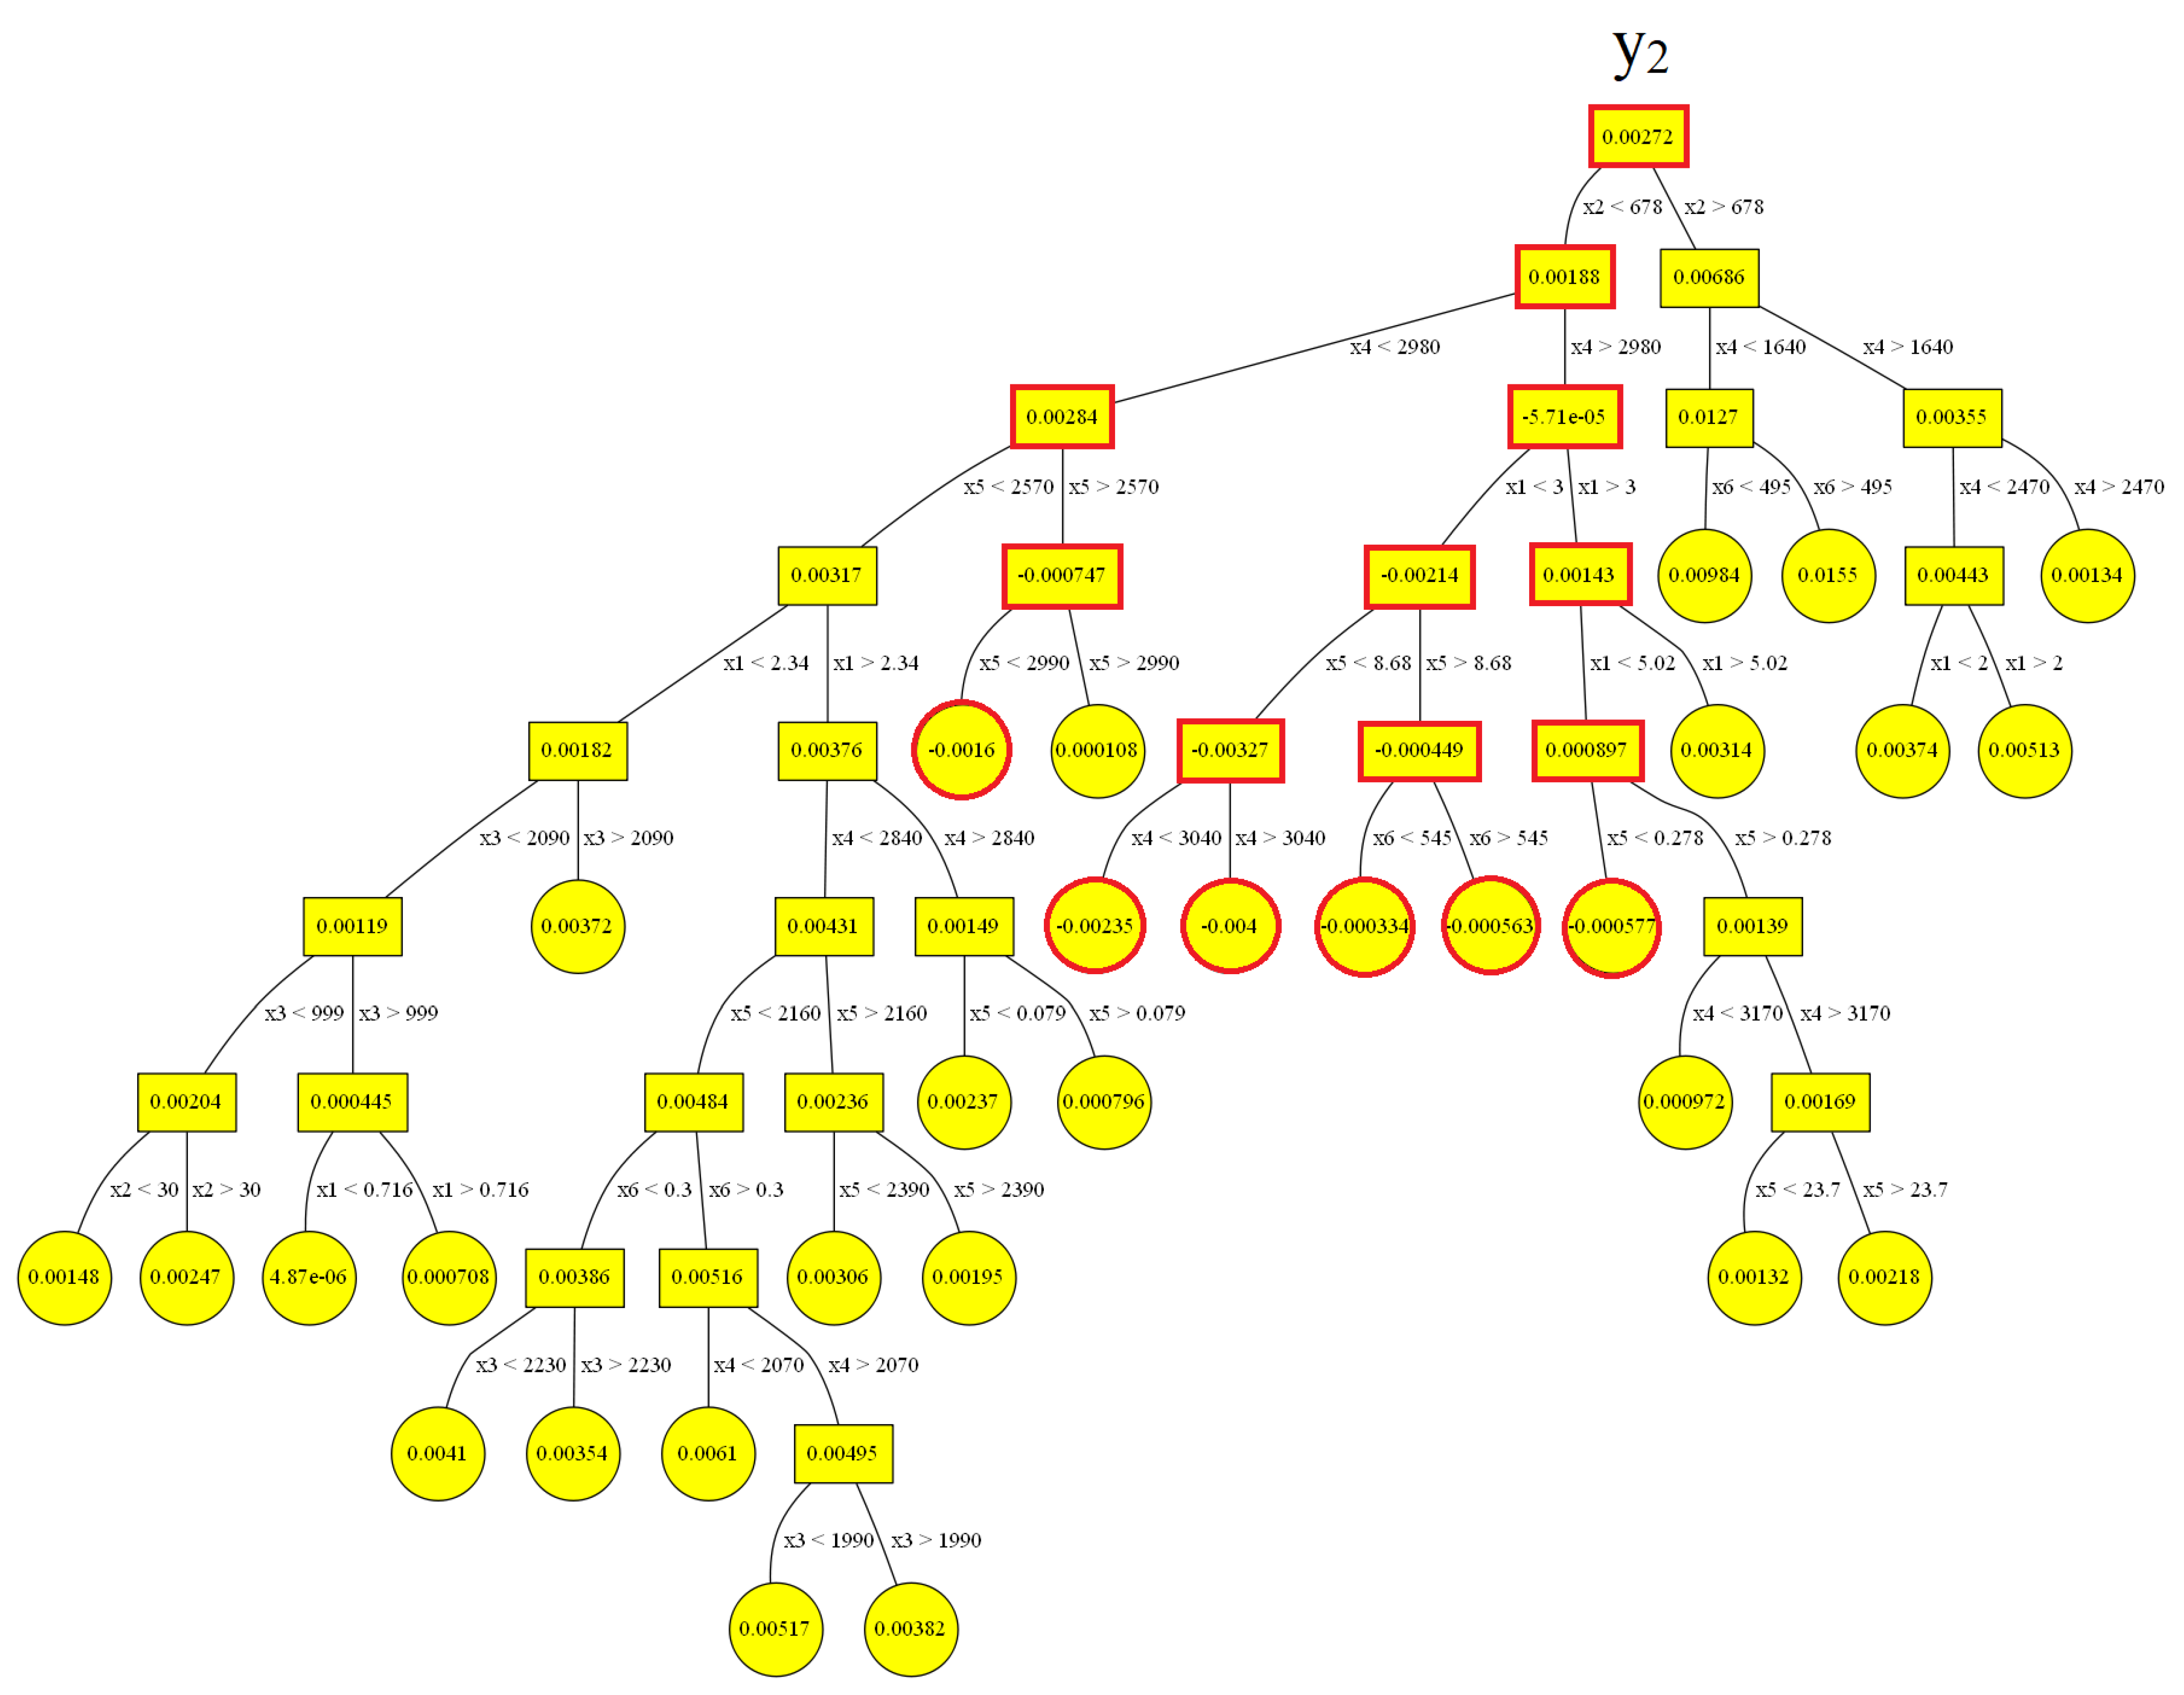
3.3. Decision Trees
4. Conclusions
Author Contributions
Funding
Acknowledgments
Conflicts of Interest
Nomenclature
| Cp | heat capacity [J/kgK] |
| HS,L | latent heat of solidification [J/m3] |
| p | pressure [Pa] |
| r | coefficient of correlation [-] |
| rgrowth | growth rate [mm/h] |
| T | temperature [K] |
| Tm | melting temperature [K] |
| t | time [s] |
| u | velocity [m/s] |
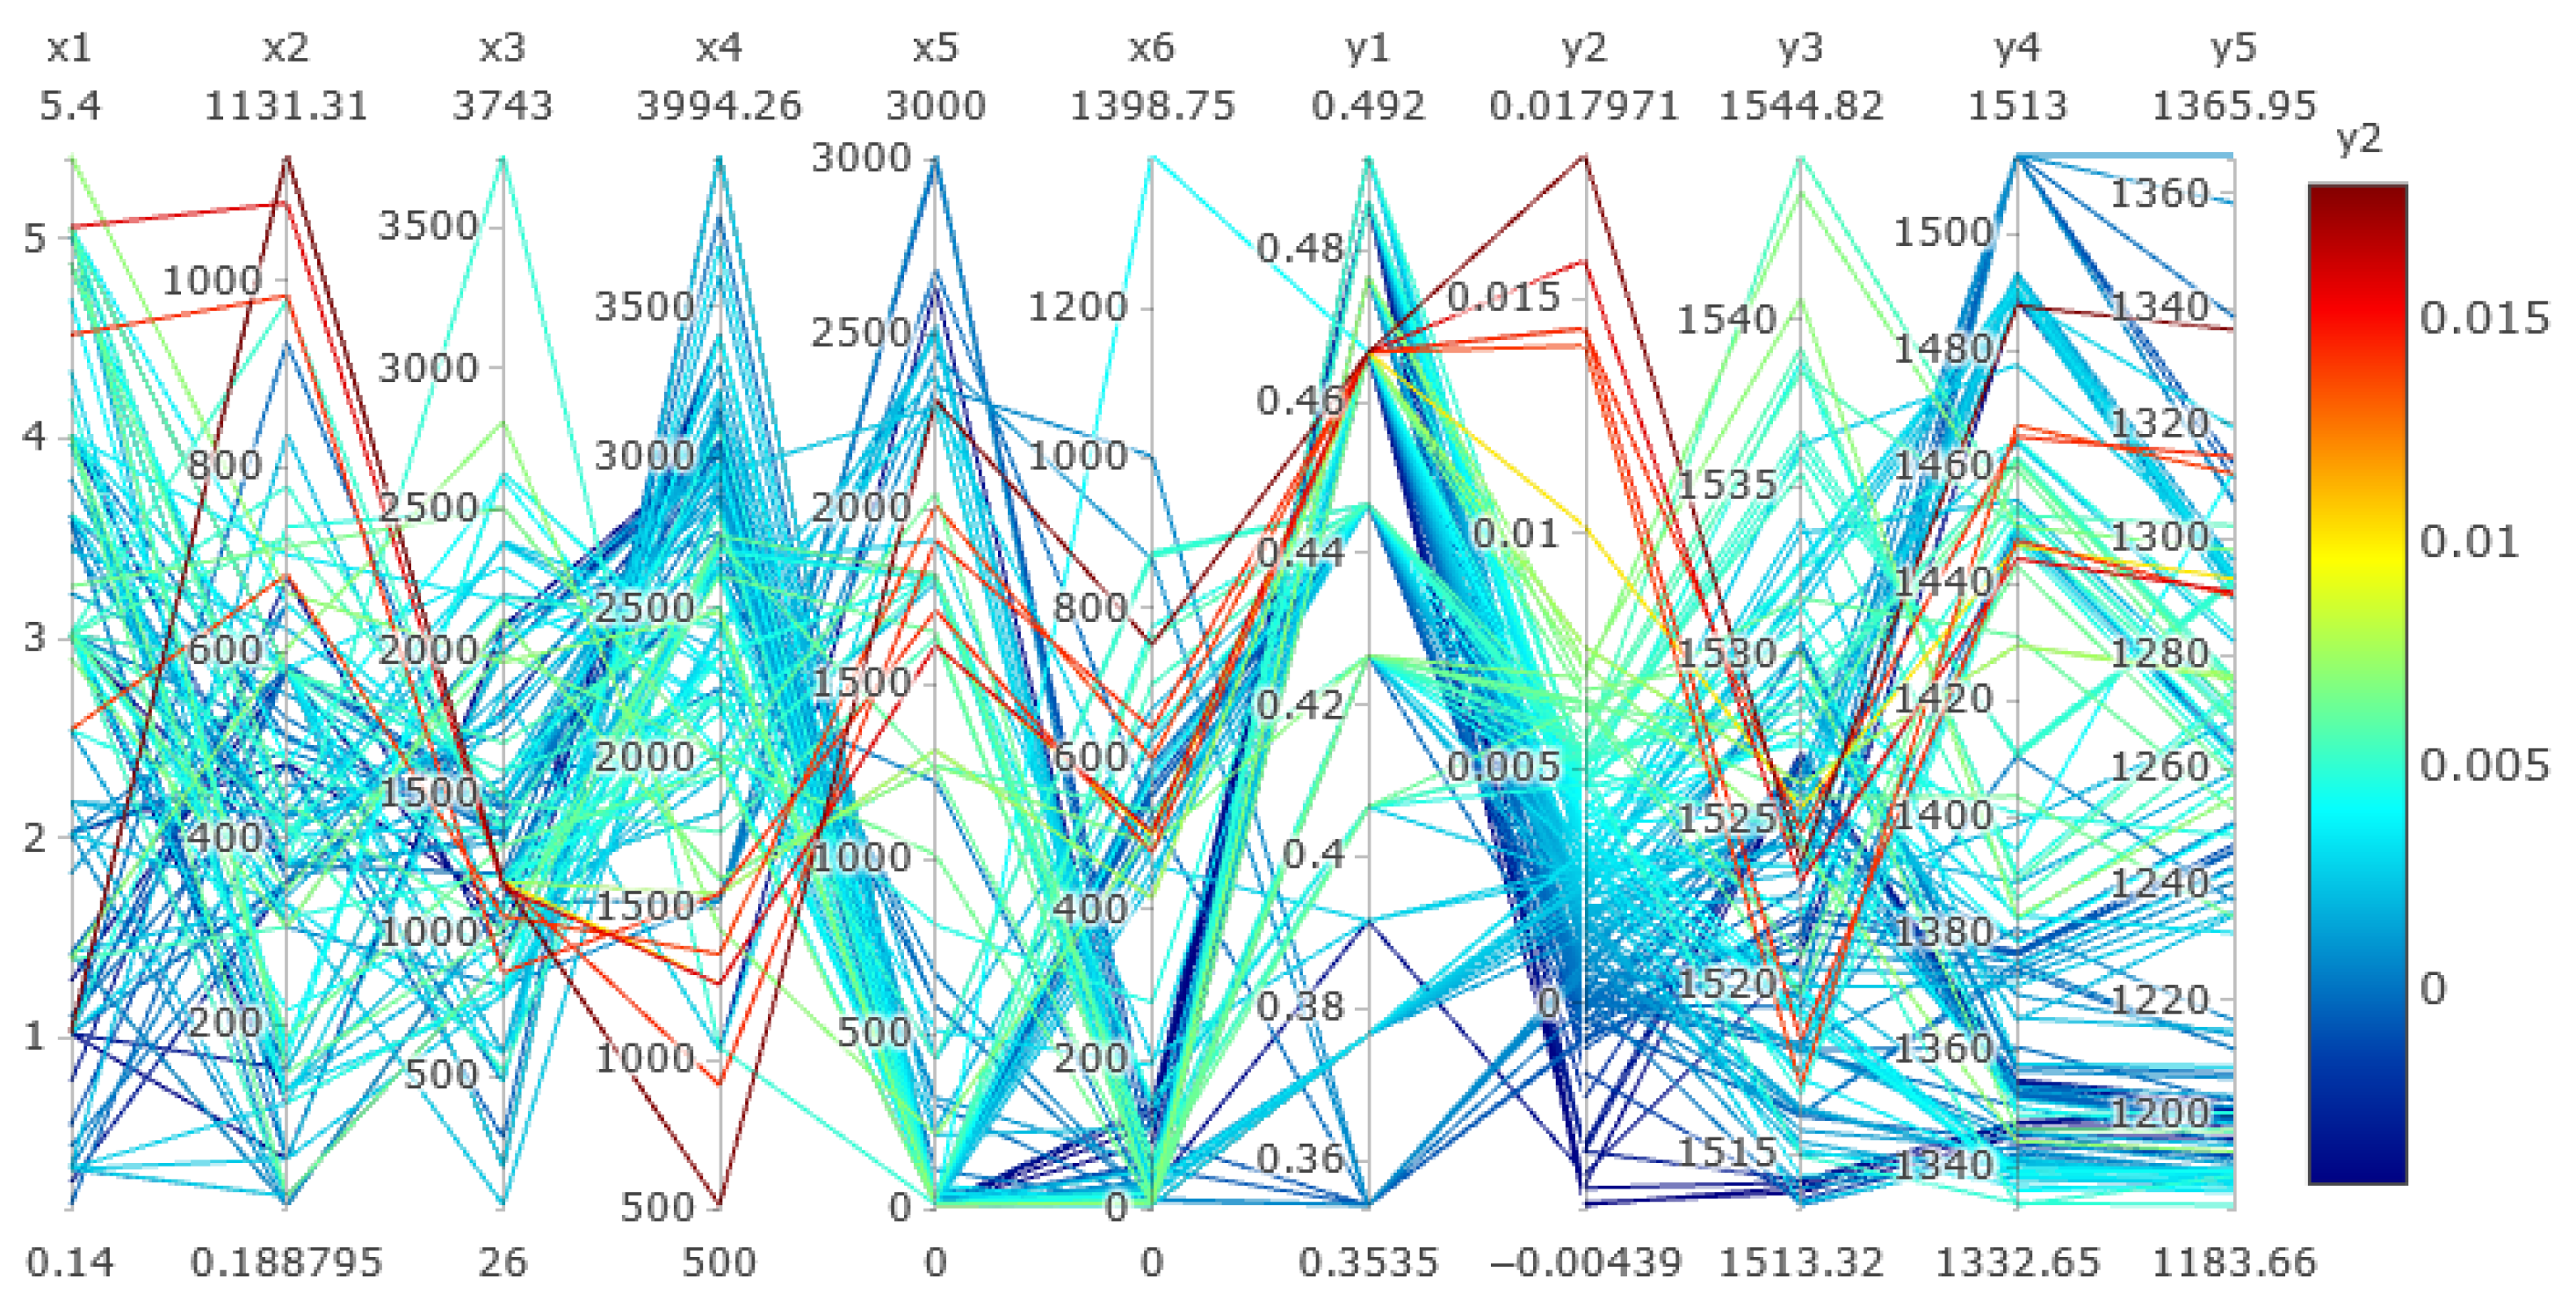
| x1 | crystal growth rate [mm/h] |
| x2 | heating power in inner top heater [W] |
| x3 | heating power in outer top heater [W] |
| x4 | heating power in upper side heater [W] |
| x5 | heating power in lower side heater [W] |
| x6 | heating power in bottom heater [W] |
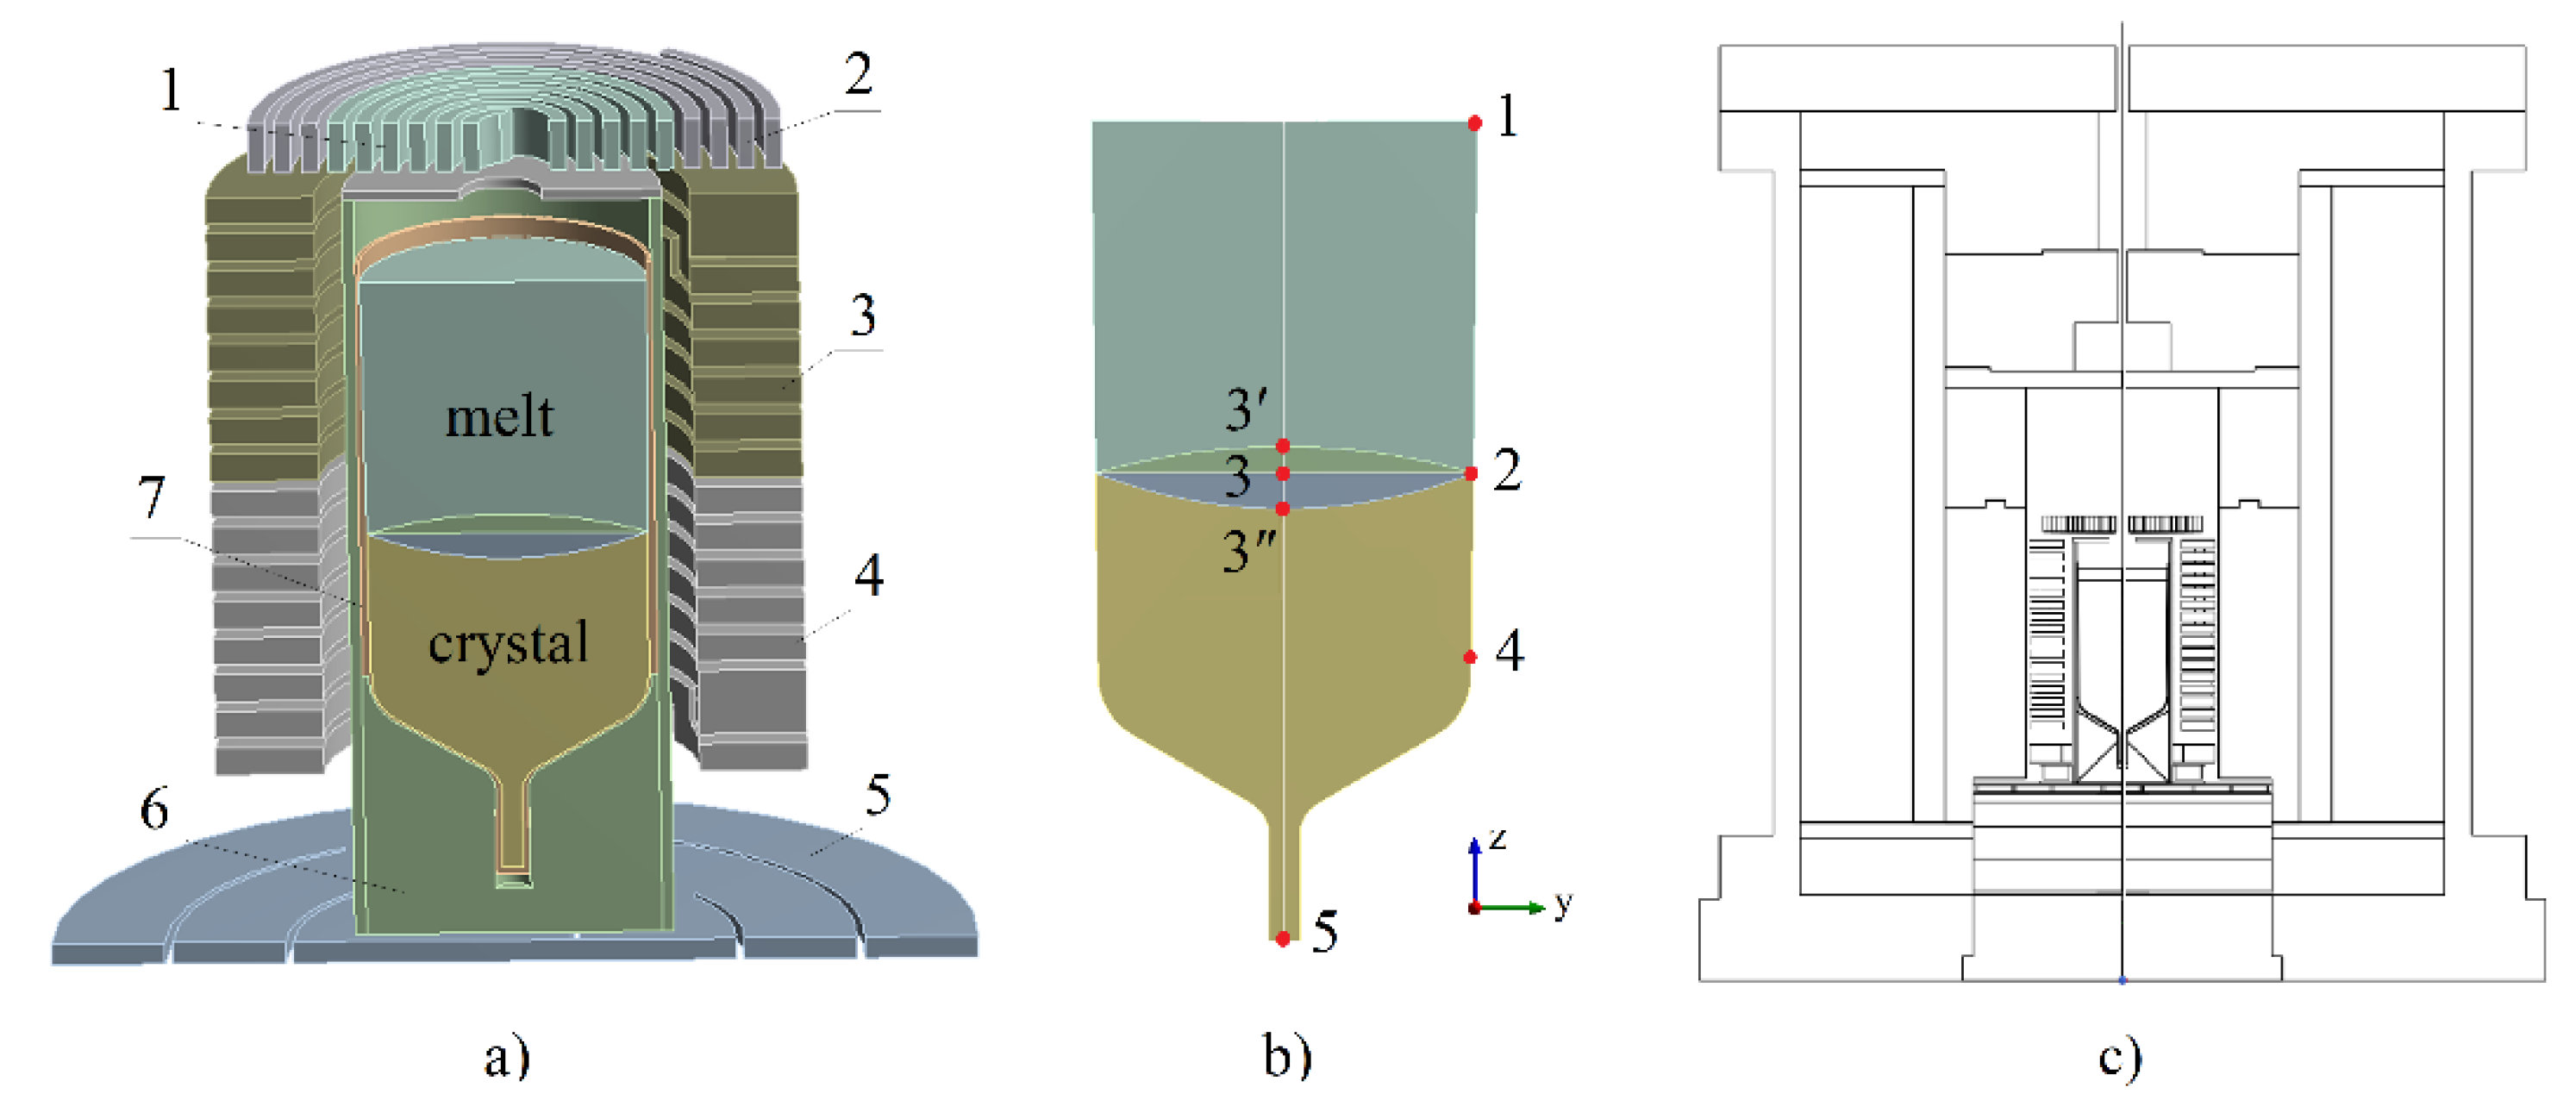
| y1 | interface position at crucible rim in MP2 [m] |
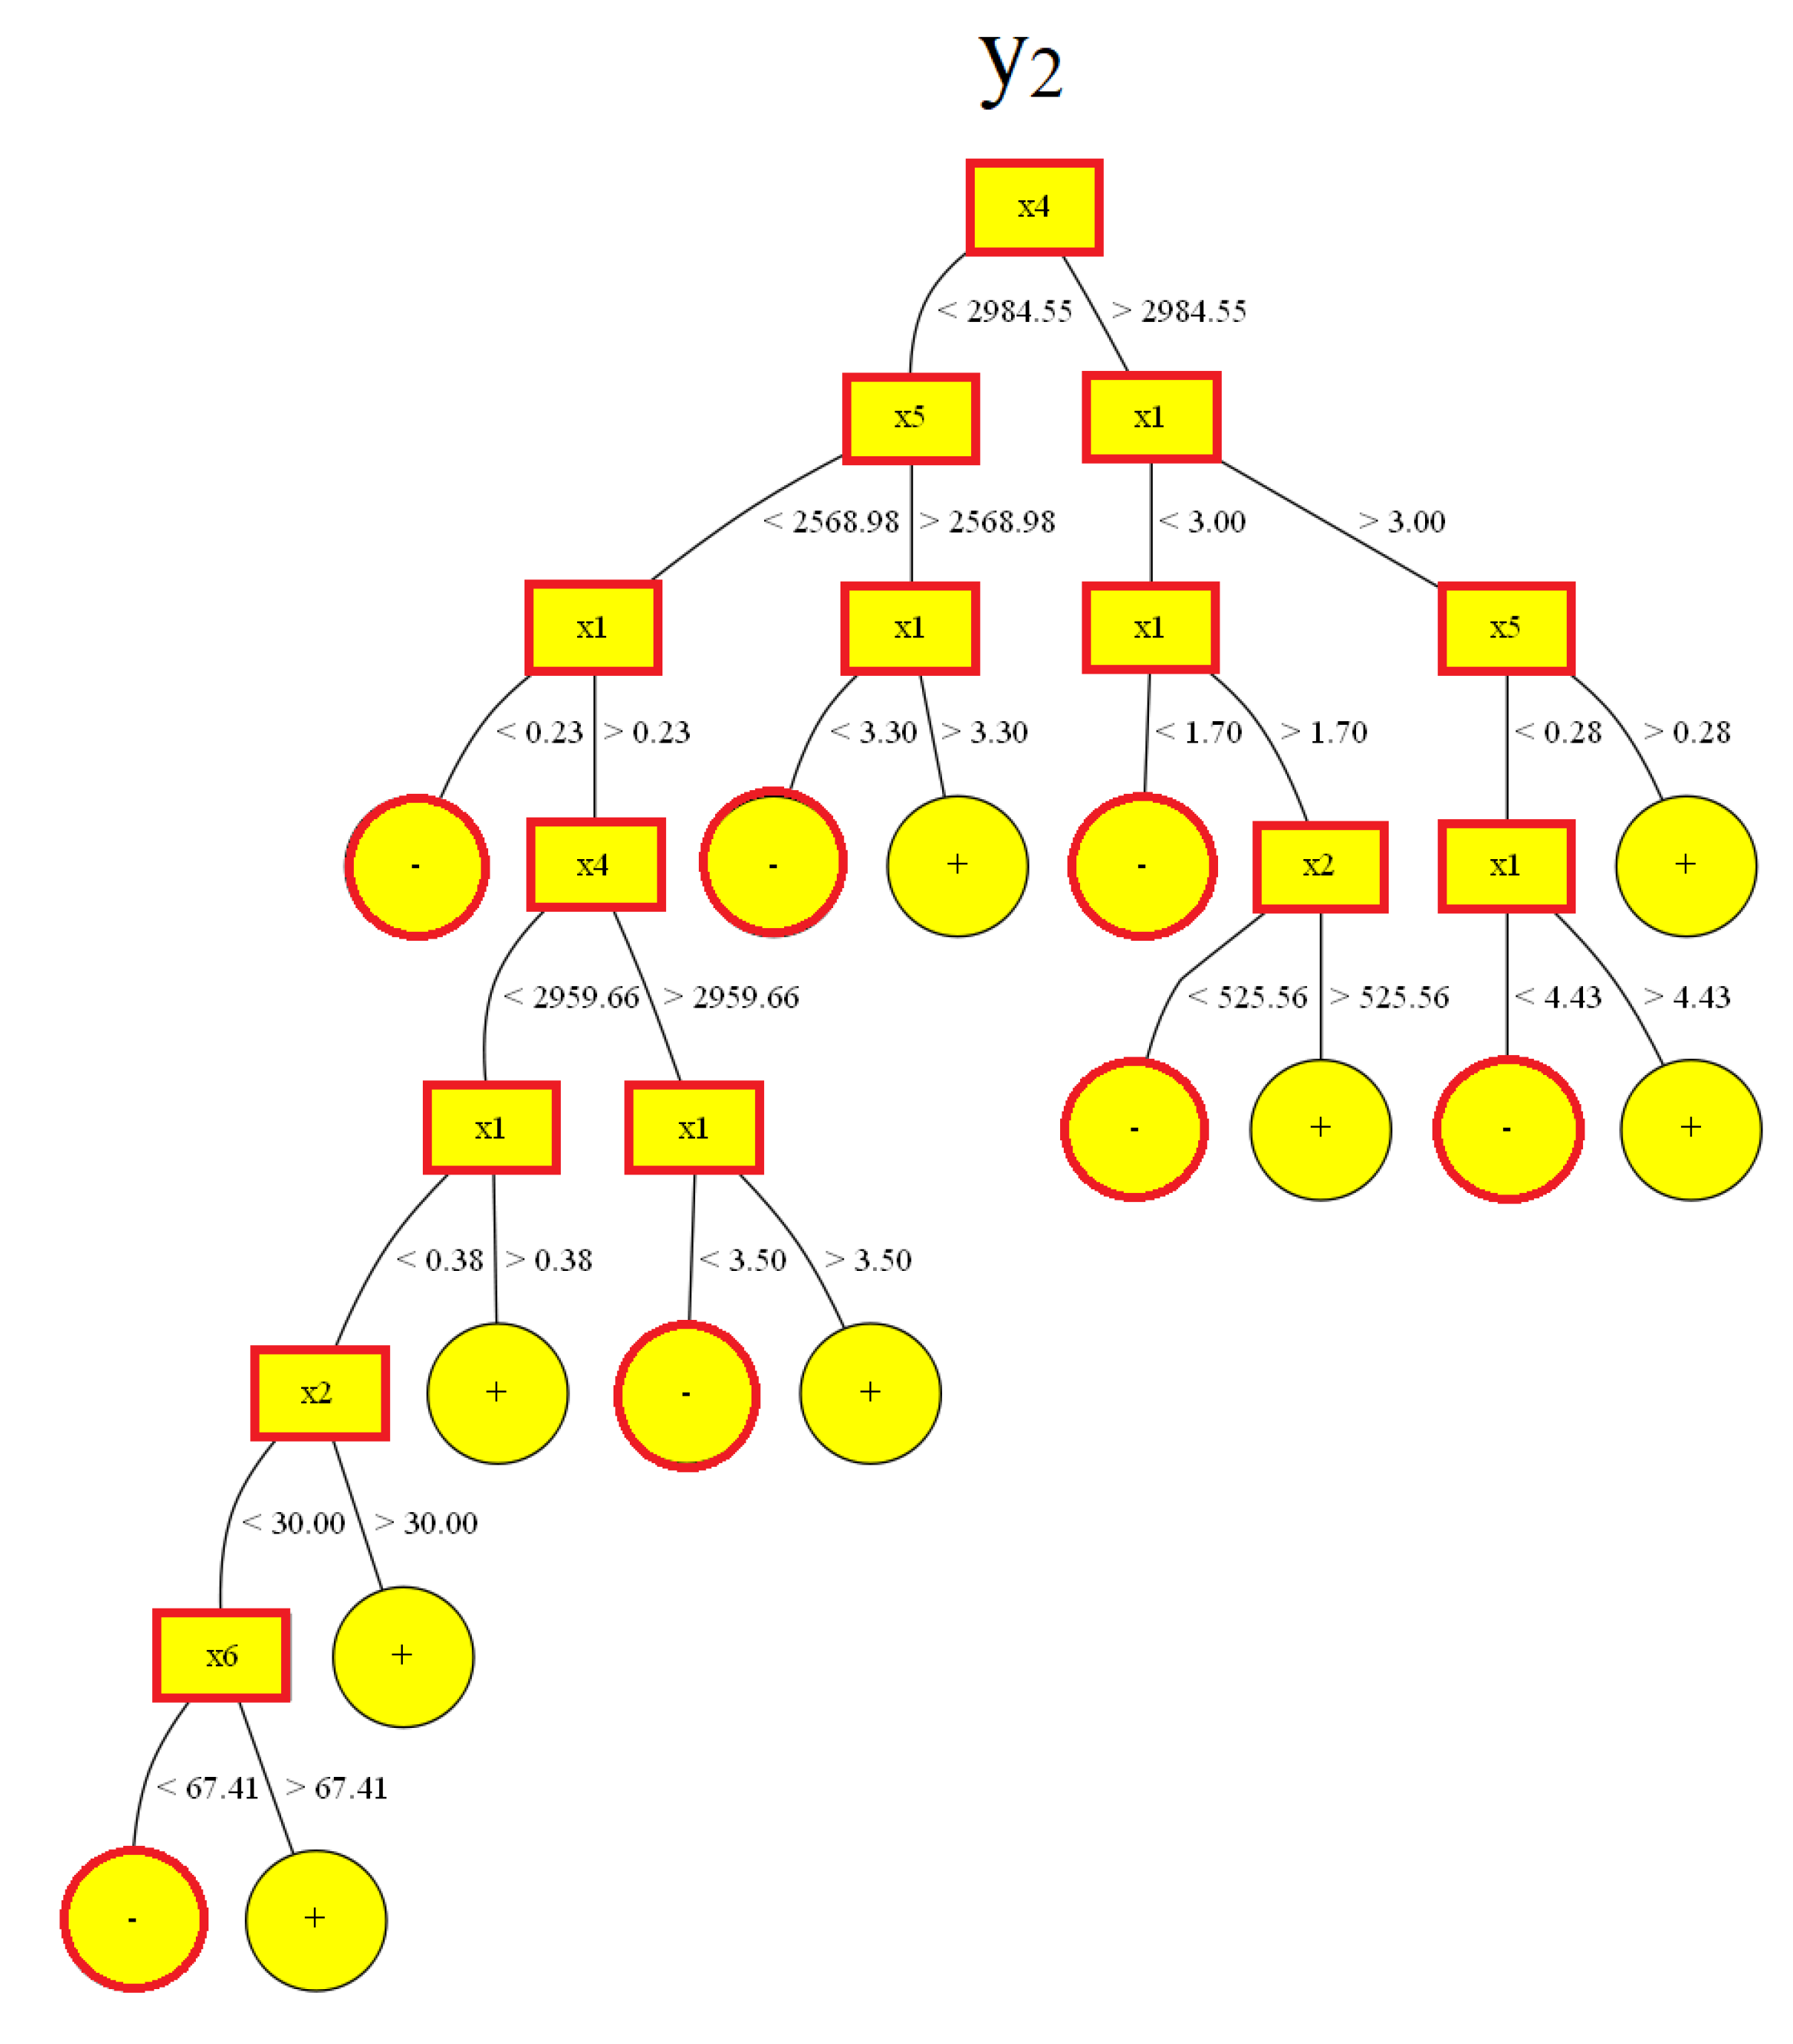
| y2 | interface deflection at MP3 [m] |
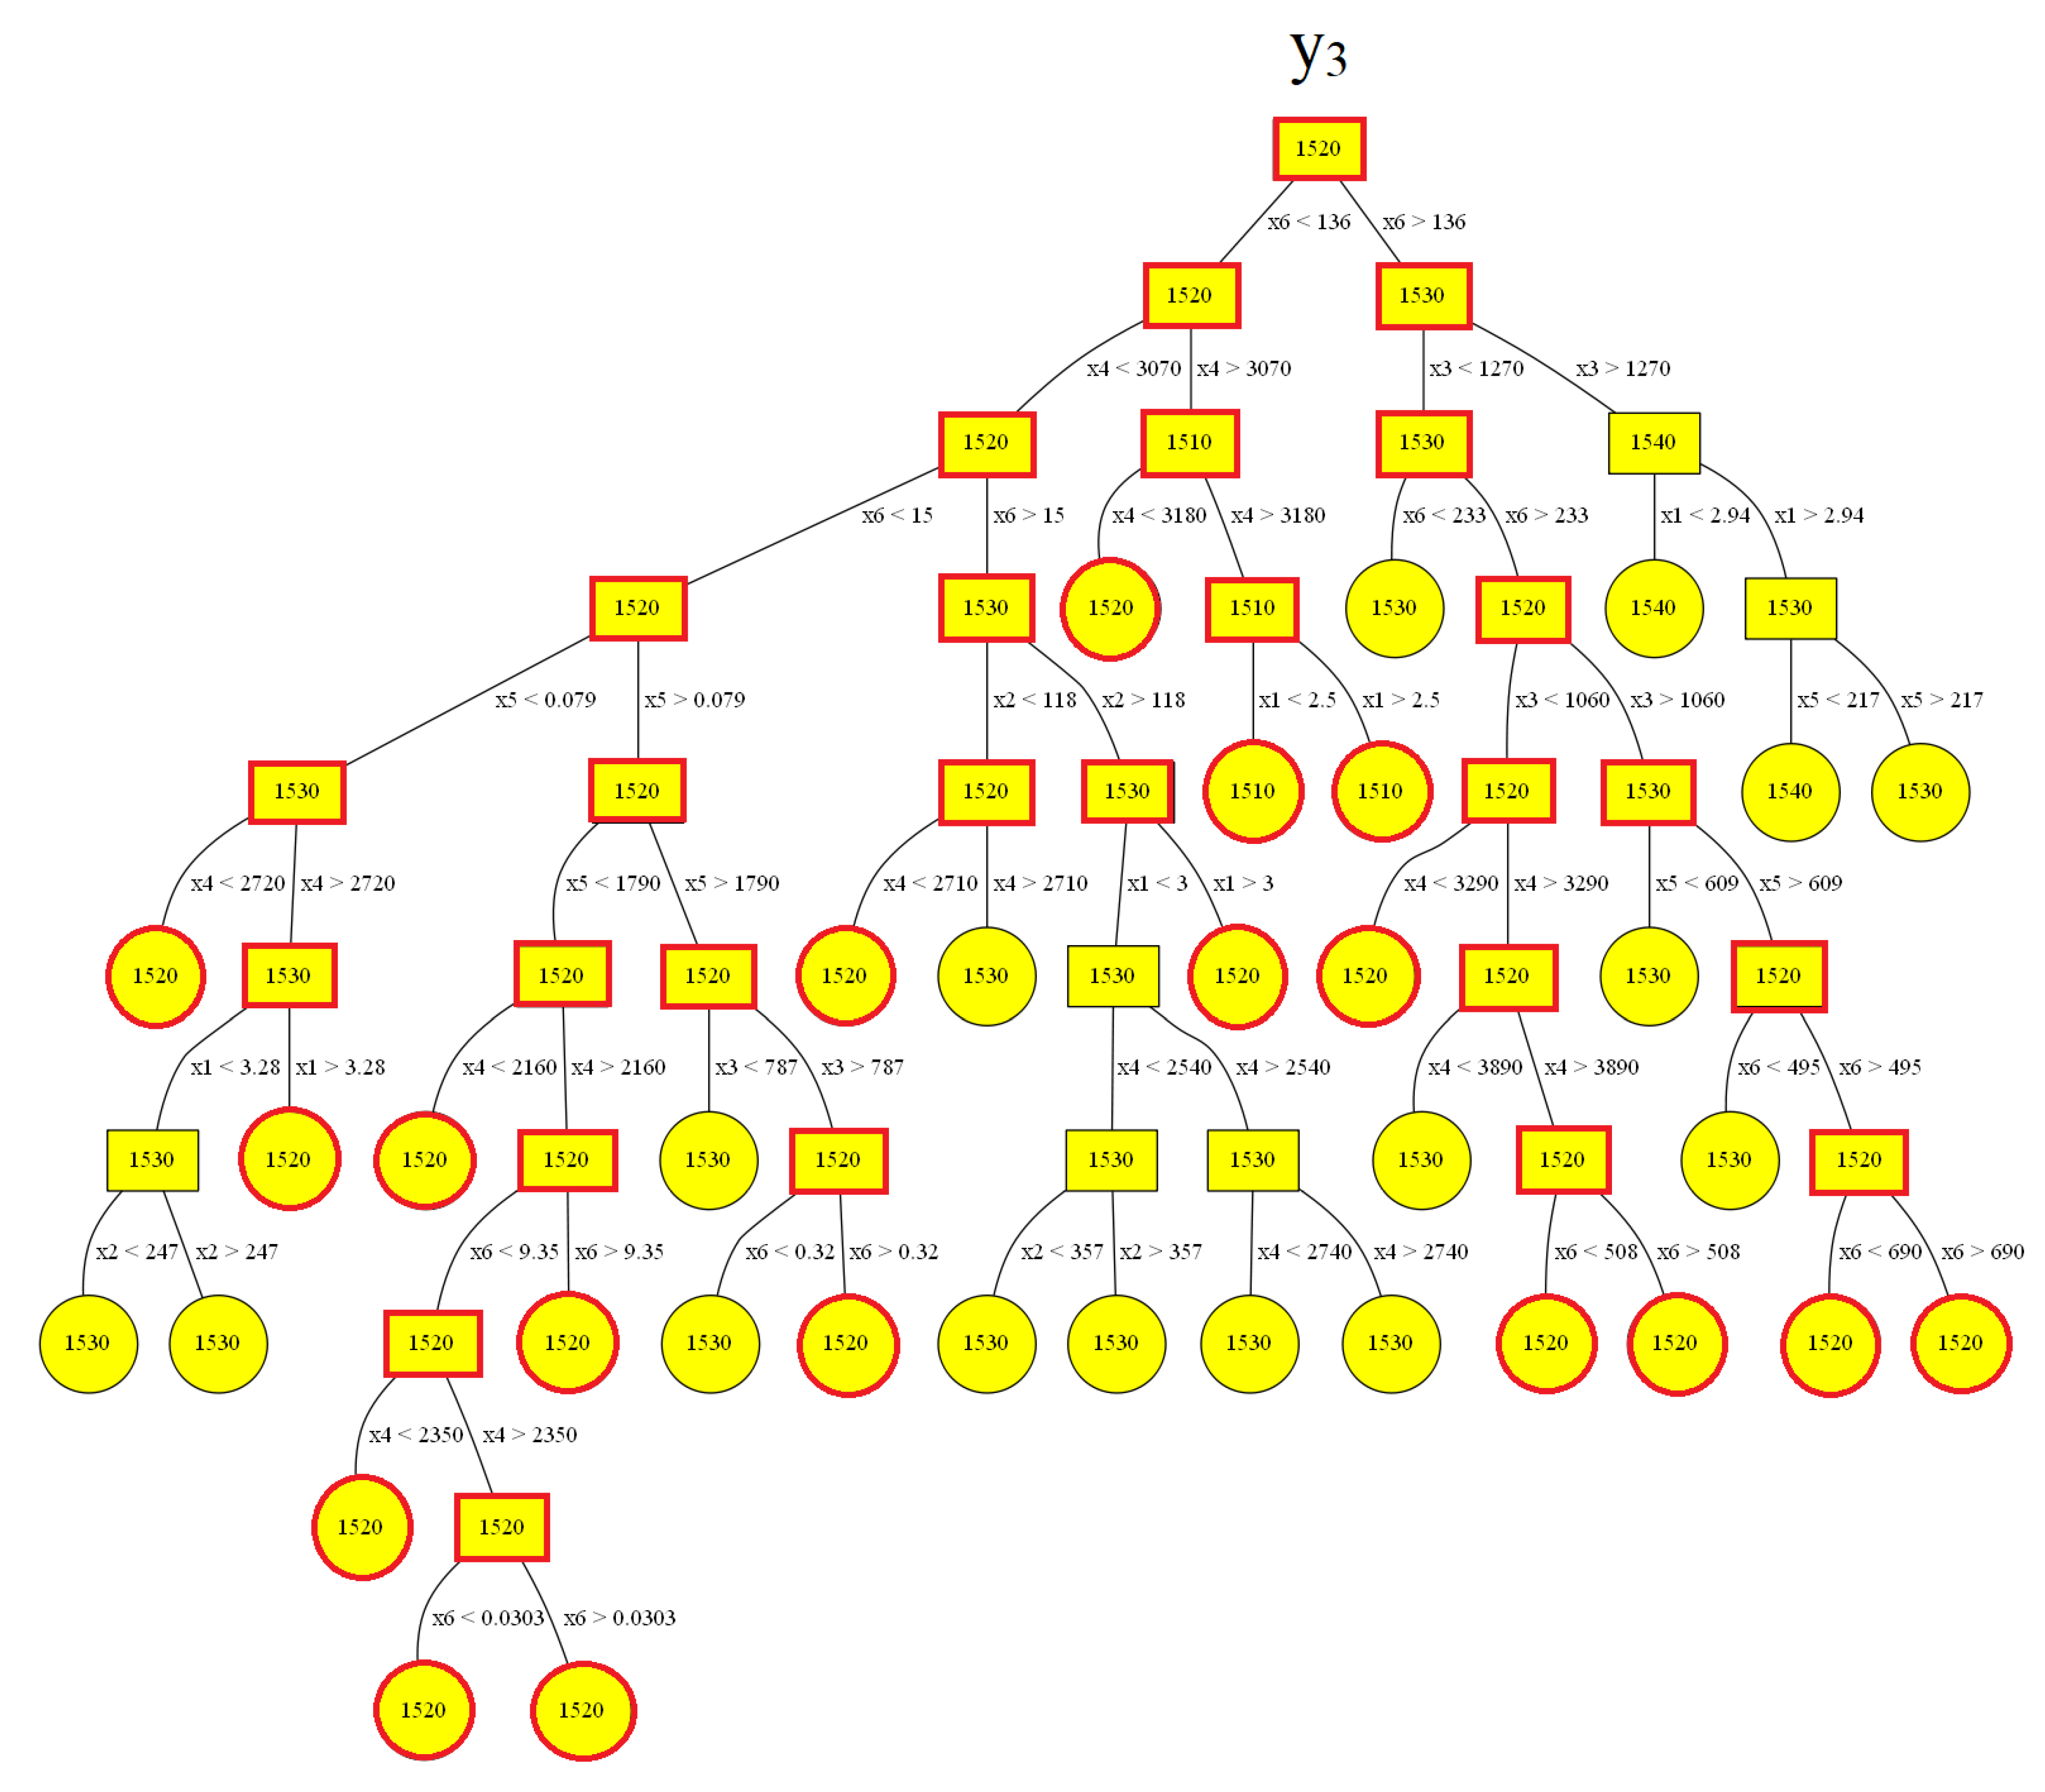
| y3 | temperature at GaAs free surface in MP1 [K] |
| y4 | temperature at the end of GaAs cone in MP4 [K] |
| y5 | temperature at the seed bottom in MP5 [K] |
| z | axial coordinate [m] |
| β | thermal expansion coefficient [1/K] |
| ε | emissivity [-] |
| λ | thermal conductivity [W/m· K] |
| ν | viscosity [Pa·s] |
| ρ | density [kg/m3] |
References
- Müller, G.; Friedrich, J. Challenges in modeling of bulk crystal growth. J. Cryst. Growth 2004, 266, 1–19. [Google Scholar] [CrossRef]
- Kurz, M.; Müller, G. Control of thermal conditions during crystal growth by inverse modeling. J. Cryst. Growth 2000, 208, 341–349. [Google Scholar] [CrossRef]
- Rojas, R. Neural Networks: A Systematic Introduction; Springer: Berlin/Heidelberg, Germany, 1996. [Google Scholar]
- Schmidt, J.; Marques, M.R.G.; Botti, S.; Marques, M.A.L. Recent advances and applications of machine learning in solid state materials science. Npj Comput. Mater. 2019, 5, 83. [Google Scholar] [CrossRef]
- Schimmel, S.; Tomida, D.; Saito, M.; Bao, Q.; Ishiguro, T.; Honda, Y.; Chichibu, S.; Amano, H. Boundary Conditions for Simulations of Fluid Flow and Temperature Field during Ammonothermal Crystal Growth-A Machine-Learning Assisted Study of Autoclave Wall Temperature Distribution. Crystals 2021, 11, 254. [Google Scholar] [CrossRef]
- Qi, X.; Ma, W.; Dang, Y.; Su, W.; Liu, L. Optimization of the melt/crystal interface shape and oxygen concentration during the Czochralski silicon crystal growth process using an artificial neural network and a genetic algorithm. J. Cryst. Growth 2020, 548, 125828. [Google Scholar] [CrossRef]
- Tsunooka, Y.; Kokubo, N.; Hatasa, G.; Harada, S.; Tagawa, M.; Ujihara, T. High-speed prediction of computational fluid dynamics simulation in crystal growth. Cryst. Eng. Comm. 2018, 20, 6546–6550. [Google Scholar] [CrossRef] [Green Version]
- Tang, Q.; Zhang, J.; Lui, D. Diameter Model Identification of Cz Silicon Single Crystal Growth Process. In Proceedings of the International Symposium on Industrial Electronics (IEEE) 2018, Banja Luka, Bosnia and Herzegobina, 1–3 November 2018; pp. 2069–2073. [Google Scholar]
- Boucetta, A.; Kutsukake, K.; Kojima, T.; Kudo, H.; Matsumoto, T.; Usami, N. Application of artificial neural network to optimize sensor positions for accurate monitoring: An example with thermocouples in a crystal growth furnace. Appl. Phys. Express 2019, 12, 125503. [Google Scholar] [CrossRef]
- Dang, Y.; Liu, L.K.; Li, Z. Optimization of the controlling recipe in quasi-single crystalline silicon growth using artificial neural network and genetic algorithm. J. Cryst. Growth 2019, 522, 195–203. [Google Scholar] [CrossRef]
- Ujihara, T. The Prediction Model of Crystal Growth Simulation Built by Machine Learning and Its Applications. Vac. Surf. Sci. 2019, 62, 136–140. [Google Scholar] [CrossRef]
- Wang, L.; Sekimoto, A.; Takehara, Y.; Okano, Y.; Ujihara, T.; Dost, S. Optimal Control of SiC Crystal Growth in the RF-TSSG System Using Reinforcement Learning. Crystals 2020, 10, 791. [Google Scholar] [CrossRef]
- Asadian, M.; Seyedein, S.H.; Aboutalebi, M.R.; Maroosi, A. Optimization of the parameters affecting the shape and position of crystal–melt interface in YAG single crystal growth. J. Cryst. Growth 2009, 311, 342–348. [Google Scholar] [CrossRef]
- Zhang, J.; Tang, Q.; Liu, D. Research into the LSTM neural network based crystal growth process model identification. IEEE Trans. Semicond. Manuf. 2019, 32, 220–225. [Google Scholar] [CrossRef]
- Yu, W.; Zhu, C.; Tsunooka, Y.; Huang, W.; Dang, Y.; Kutsukake, K.; Harada, S.; Tagawa, M.; Ujihara, T. Geometrical design of a crystal growth system guided by a machine learning algorithm. Cryst. Eng. Comm. 2021, 23, 2695–2702. [Google Scholar] [CrossRef]
- Dropka, N.; Holena, M.; Ecklebe, S.; Frank-Rotsch, C.; Winkler, J. Fast forecasting of VGF crystal growth process by dynamic neural networks. J. Cryst. Growth 2019, 521, 9–14. [Google Scholar] [CrossRef]
- Dropka, N.; Holena, M. Optimization of magnetically driven directional solidification of silicon using artificial neural networks and Gaussian process models. J. Cryst. Growth 2017, 471, 53–61. [Google Scholar] [CrossRef]
- Dropka, N.; Ecklebe, S.; Holena, M. Real Time Predictions of VGF-GaAs Growth Dynamics by LSTM Neural Networks. Crystals 2021, 11, 138. [Google Scholar] [CrossRef]
- Wu, X.; Kumar, V.; Ross Quinlan, J.; Ghosh, J.; Yang, Q.; Motoda, H.; Ng, A.; Liu, B.; Yu, P.S.; Zhou, Z.-H.; et al. Top 10 algorithms in data mining. Knowl. Inf. Syst. 2008, 14, 1–37. [Google Scholar] [CrossRef] [Green Version]
- Shalev-Shwartz, S.; Ben-David, S. Decision Trees. In Understanding Machine Learning; Cambridge University Press: Cambridge, UK, 2014. [Google Scholar]
- Yuan, Y.; Zhao, Y.; Zong, B.; Parolari, S. Potential Key Technologies for 6G Mobile Communications. Sci. China Inf. Sci. 2018, 61, 080404. [Google Scholar]
- Frank-Rotsch, C.; Dropka, N.; Rotsch, P. Chapter 6: III-Arsenides. In Single Crystals of Electronic Materials: Growth and Properties; Fornari, R., Ed.; Woodhead Publishing Elsevier: Amsterdam, The Netherlands, 2018; ISBN 9780081020968. [Google Scholar]
- Virozub, A.; Brandon, S. Revisiting the quasi-steady state approximation for modeling heat transport during directional crystal growth. The growth rate can and should be calculated! J. Cryst. Growth 2003, 254, 267–278. [Google Scholar] [CrossRef]
- Derby, J.J.; Brown, R.A. On the quasi-steady-state assumption in modeling Czochralski crystal growth. J. Cryst. Growth 1988, 87, 251–260. [Google Scholar] [CrossRef]
- Han, J.; Kamber, M. Data Mining: Concepts and Techniques; Morgan Kaufmann: Amsterdam, The Netherlands, 2001; ISBN 978-1-55860-489-6. [Google Scholar]
- Breiman, L.; Friedman, J.; Olshen, R.; Stone, C. Classification and Regression Trees; CRC Press: Boca Raton, FL, USA, 1984. [Google Scholar]


| Node | Mean y2 | RMSE |
|---|---|---|
| 1 | 0.00272 | 0.00370 |
| 2 | 0.00188 | 0.00265 |
| 3 | 0.00686 | 0.00510 |
| 4 | 0.00284 | 0.00224 |
| 5 | −5.71×10⁻⁵ | 0.00232 |
| 6 | 0.01266 | 0.00361 |
| 7 | 0.00355 | 0.00179 |
| 8 | 0.00317 | 0.00200 |
| 9 | −0.00075 | 0.00146 |
| 10 | −0.00214 | 0.00163 |
| 11 | 0.00143 | 0.00144 |
| 12 | 0.00984 | 0.00277 |
| 13 | 0.01547 | 0.00159 |
| 14 | 0.00443 | 0.00118 |
| 15 | 0.00134 | 0.00096 |
| 16 | 0.00182 | 0.00178 |
| 17 | 0.00376 | 0.00180 |
| 18 | −0.00160 | 0.00153 |
| 19 | 0.00011 | 0.00065 |
| 20 | −0.00327 | 0.00107 |
| 21 | −0.00045 | 0.00036 |
| 22 | 0.00090 | 0.00109 |
| 23 | 0.00314 | 0.00100 |
| 24 | 0.00374 | 0.00090 |
| 25 | 0.00513 | 0.00100 |
| 26 | 0.00119 | 0.00106 |
| 27 | 0.00372 | 0.00213 |
| 28 | 0.00431 | 0.00148 |
| 29 | 0.00149 | 0.00110 |
| 30 | −0.00235 | 0.00092 |
| 31 | −0.00400 | 0.00041 |
| 32 | −0.00033 | 0.00029 |
| 33 | −0.00056 | 0.00039 |
| 34 | −0.00058 | 0.00061 |
| 35 | 0.00139 | 0.00071 |
| 36 | 0.00204 | 0.00091 |
| 37 | 0.00044 | 0.00043 |
| 38 | 0.00484 | 0.00116 |
| 39 | 0.00236 | 0.00064 |
| 40 | 0.00237 | 0.00092 |
| 41 | 0.00080 | 0.00064 |
| 42 | 0.00097 | 0.00065 |
| 43 | 0.00169 | 0.00059 |
| 44 | 0.00148 | 0.00116 |
| 45 | 0.00247 | 0.00011 |
| 46 | 0.00000 | 0.00032 |
| 47 | 0.00071 | 0.00021 |
| 48 | 0.00386 | 0.00075 |
| 49 | 0.00516 | 0.00109 |
| 50 | 0.00306 | 0.00016 |
| 51 | 0.00195 | 0.00043 |
| 52 | 0.00132 | 0.00040 |
| 53 | 0.00218 | 0.00041 |
| 54 | 0.00410 | 0.00086 |
| 55 | 0.00354 | 0.00036 |
| 56 | 0.00610 | 0.00072 |
| 57 | 0.00495 | 0.00104 |
| 58 | 0.00517 | 0.00099 |
| 59 | 0.00382 | 0.00027 |
| Mean | Decisive Inputs | ||||
|---|---|---|---|---|---|
| y2 | x1 | x2 | x4 | x5 | x6 |
| −0.0016 | - | <678 | <2980 | 2570< x5 < 2990 | - |
| −0.00235 | <3 | <678 | 2980< x4 < 3040 | <8.48 | - |
| −0.004 | <3 | <678 | >3040 | <8.48 | - |
| −0.000334 | <3 | <678 | >2980 | >8.68 | <545 |
| −0.000563 | <3 | <678 | >2980 | >8.68 | >545 |
| −0.000577 | 3< x1 <5.02 | <678 | >2980 | <0.278 | - |
| Mean | Decisive Inputs | ||||
|---|---|---|---|---|---|
| y2 | x1 | x2 | x4 | x5 | x6 |
| 3 < x1 < 4.43 | - | >2984.55 | <0.28 | - | |
| <1.7 | - | >2984.55 | - | - | |
| 1.7 < x1 < 3 | <525.56 | >2984.55 | - | - | |
| < 0 | <3.3 | - | <2984.55 | >2568.98 | - |
| 0.23 | - | <2984.55 | <2568.98 | - | |
| 0.23 < x1 < 3.5 | - | 2959.66 < x4 < 2984.55 | <2568.98 | - | |
| 0.23 < x1 < 0.38 | <30 | 2959.66 < x4 < 2984.55 | <2568.98 | 67.41 | |
| Node | Mean y3 | RMSE |
|---|---|---|
| 1 | 1520 | 6.893 |
| 2 | 1520 | 6.105 |
| 3 | 1530 | 7.036 |
| 4 | 1520 | 5.694 |
| 5 | 1510 | 1.853 |
| 6 | 1530 | 4.472 |
| 7 | 1540 | 5.871 |
| 8 | 1520 | 4.747 |
| 9 | 1530 | 5.375 |
| 10 | 1520 | 1.372 |
| 11 | 1510 | 0.261 |
| 12 | 1530 | 3.366 |
| 13 | 1520 | 3.905 |
| 14 | 1540 | 1.828 |
| 15 | 1530 | 5.216 |
| 16 | 1530 | 2.617 |
| 17 | 1520 | 4.624 |
| 18 | 1520 | 4.551 |
| 19 | 1530 | 4.726 |
| 20 | 1510 | 0.083 |
| 21 | 1510 | 0.189 |
| 22 | 1520 | 2.646 |
| 23 | 1530 | 3.589 |
| 24 | 1540 | 1.683 |
| 25 | 1530 | 5.888 |
| 26 | 1520 | 4.208 |
| 27 | 1530 | 0.850 |
| 28 | 1520 | 2.827 |
| 29 | 1520 | 4.379 |
| 30 | 1520 | 1.734 |
| 31 | 1530 | 1.128 |
| 32 | 1530 | 3.229 |
| 33 | 1520 | 4.901 |
| 34 | 1520 | 2.417 |
| 35 | 1520 | 2.166 |
| 36 | 1530 | 3.054 |
| 37 | 1520 | 1.355 |
| 38 | 1530 | 0.312 |
| 39 | 1520 | 0.282 |
| 40 | 1520 | 2.794 |
| 41 | 1520 | 1.795 |
| 42 | 1530 | 3.140 |
| 43 | 1520 | 3.315 |
| 44 | 1530 | 3.352 |
| 45 | 1530 | 1.801 |
| 46 | 1530 | 1.396 |
| 47 | 1520 | 0.815 |
| 48 | 1530 | 0.689 |
| 49 | 1520 | 1.099 |
| 50 | 1530 | 0.368 |
| 51 | 1530 | 0.043 |
| 52 | 1520 | 1.429 |
| 53 | 1520 | 0.735 |
| 54 | 1530 | 2.170 |
| 55 | 1520 | 0.986 |
| 56 | 1530 | 2.966 |
| 57 | 1530 | 2.710 |
| 58 | 1530 | 1.359 |
| 59 | 1530 | 1.586 |
| 60 | 1520 | 0.437 |
| 61 | 1520 | 0.272 |
| 62 | 1520 | 0.752 |
| 63 | 1520 | 0.976 |
| 64 | 1520 | 0.451 |
| 65 | 1520 | 1.045 |
| 66 | 1520 | 0.582 |
| 67 | 1520 | 0.802 |
| Mean | Decisive Inputs | |||||
|---|---|---|---|---|---|---|
| y3 | x1 | x2 | x3 | x4 | x5 | x6 |
| 1520 | - | - | - | <2720 | <0.079 | <15 |
| 1520 | >3.28 | - | - | 2720 < x4 < 3070 | <0.079 | <15 |
| 1520 | - | - | - | <2160 | 0.079 < x5 < 1790 | <15 |
| 1520 | - | - | - | 2160 < x4 < 2350 | 0.079 < x5 < 1790 | <9.35 |
| 1520 | - | - | - | 2350 < x4 < 3070 | 0.079 < x5 < 1790 | <0.0303 |
| 1520 | - | - | - | 2350 < x4 < 3070 | 0.079 < x5 < 1790 | 0.0303 < x6 < 9.35 |
| 1520 | - | - | - | 3070 < x4 < 3180 | - | <136 |
| 1510 | <2.5 | - | - | >3180 | - | <136 |
| 1510 | >2.5 | - | - | >3180 | - | <136 |
| 1520 | - | <118 | - | <2710 | - | 15 < x6 < 136 |
| 1520 | >3 | >118 | - | <3070 | - | 15 < x6 < 136 |
| 1520 | - | - | <1060 | <3290 | - | >233 |
| 1520 | - | - | 1060 < x3 < 1270 | - | >609 | >690 |
| 1520 | - | - | 1060 < x3 < 1270 | - | >609 | 495 < x6 < 690 |
| 1520 | - | - | <1060 | >3890 | - | 233 < x6 < 508 |
| 1520 | - | - | <1060 | >3890 | - | <508 |
| 1520 | - | - | >787 | <3070 | >1790 | 0.32 < x6 < 15 |
| 1520 | - | - | - | 2160 < x4 < 3070 | 0.079 < x5 < 1790 | 9.35 < x6 < 15 |
Publisher’s Note: MDPI stays neutral with regard to jurisdictional claims in published maps and institutional affiliations. |
© 2021 by the authors. Licensee MDPI, Basel, Switzerland. This article is an open access article distributed under the terms and conditions of the Creative Commons Attribution (CC BY) license (https://creativecommons.org/licenses/by/4.0/).
Share and Cite
Dropka, N.; Böttcher, K.; Holena, M. Development and Optimization of VGF-GaAs Crystal Growth Process Using Data Mining and Machine Learning Techniques. Crystals 2021, 11, 1218. https://doi.org/10.3390/cryst11101218
Dropka N, Böttcher K, Holena M. Development and Optimization of VGF-GaAs Crystal Growth Process Using Data Mining and Machine Learning Techniques. Crystals. 2021; 11(10):1218. https://doi.org/10.3390/cryst11101218
Chicago/Turabian StyleDropka, Natasha, Klaus Böttcher, and Martin Holena. 2021. "Development and Optimization of VGF-GaAs Crystal Growth Process Using Data Mining and Machine Learning Techniques" Crystals 11, no. 10: 1218. https://doi.org/10.3390/cryst11101218
APA StyleDropka, N., Böttcher, K., & Holena, M. (2021). Development and Optimization of VGF-GaAs Crystal Growth Process Using Data Mining and Machine Learning Techniques. Crystals, 11(10), 1218. https://doi.org/10.3390/cryst11101218