
Thermal Stability and Radiation Tolerance of Lanthanide-Doped Cerium Oxide Nanocubes

 , and
, and
Abstract
:
1. Introduction
2. Experimental
- Oleylamine (ON) [17]. In a round-bottomed flask, (CeCl3•6H2O) and any dopant (LnCl3•6H2O) where Ln = Nd, Eu, Er, and Lu were added to ON. After heating the reaction to 90 °C and stirring for 1 h, the reaction was then warmed to 265 °C. The reaction turned from pale brown to black. After cooling to room temperature, the solution was collected by centrifugation, washed with ethanol and hexanes and used without further manipulations.
- Hexamethylenetetramine (HMTA) [18]. In a round-bottomed flask, (Ce(NO3)3•6H2O) and any dopant (Ln(NO3)3•6H2O) where Ln = Nd, Eu, Er, and Lu were dissolved in water. An equal volume of concentrated HMTA was added at room temperature and the reaction was allowed to stir (24 h). The precipitate was collected by centrifugation, washed with hexanes and used without further manipulations.
- t-butylamine (TBA) [19]. In an Ehrlyenmeyer flask, (Ce(NO3)3•6H2O) and any dopant (Ln(NO3)3•6H2O) where Ln = Nd, Eu, Er, and Lu were dissolved in water and poured into a TeflonTM-lined Parr-bombTM. To this mixture, toluene, oleic acid, and t-butylamine were added; the sample was sealed and heated at 180 °C for 12 h. The precipitate was collected by centrifugation, washed with hexanes, and used without further manipulations.
3. Results and Discussion
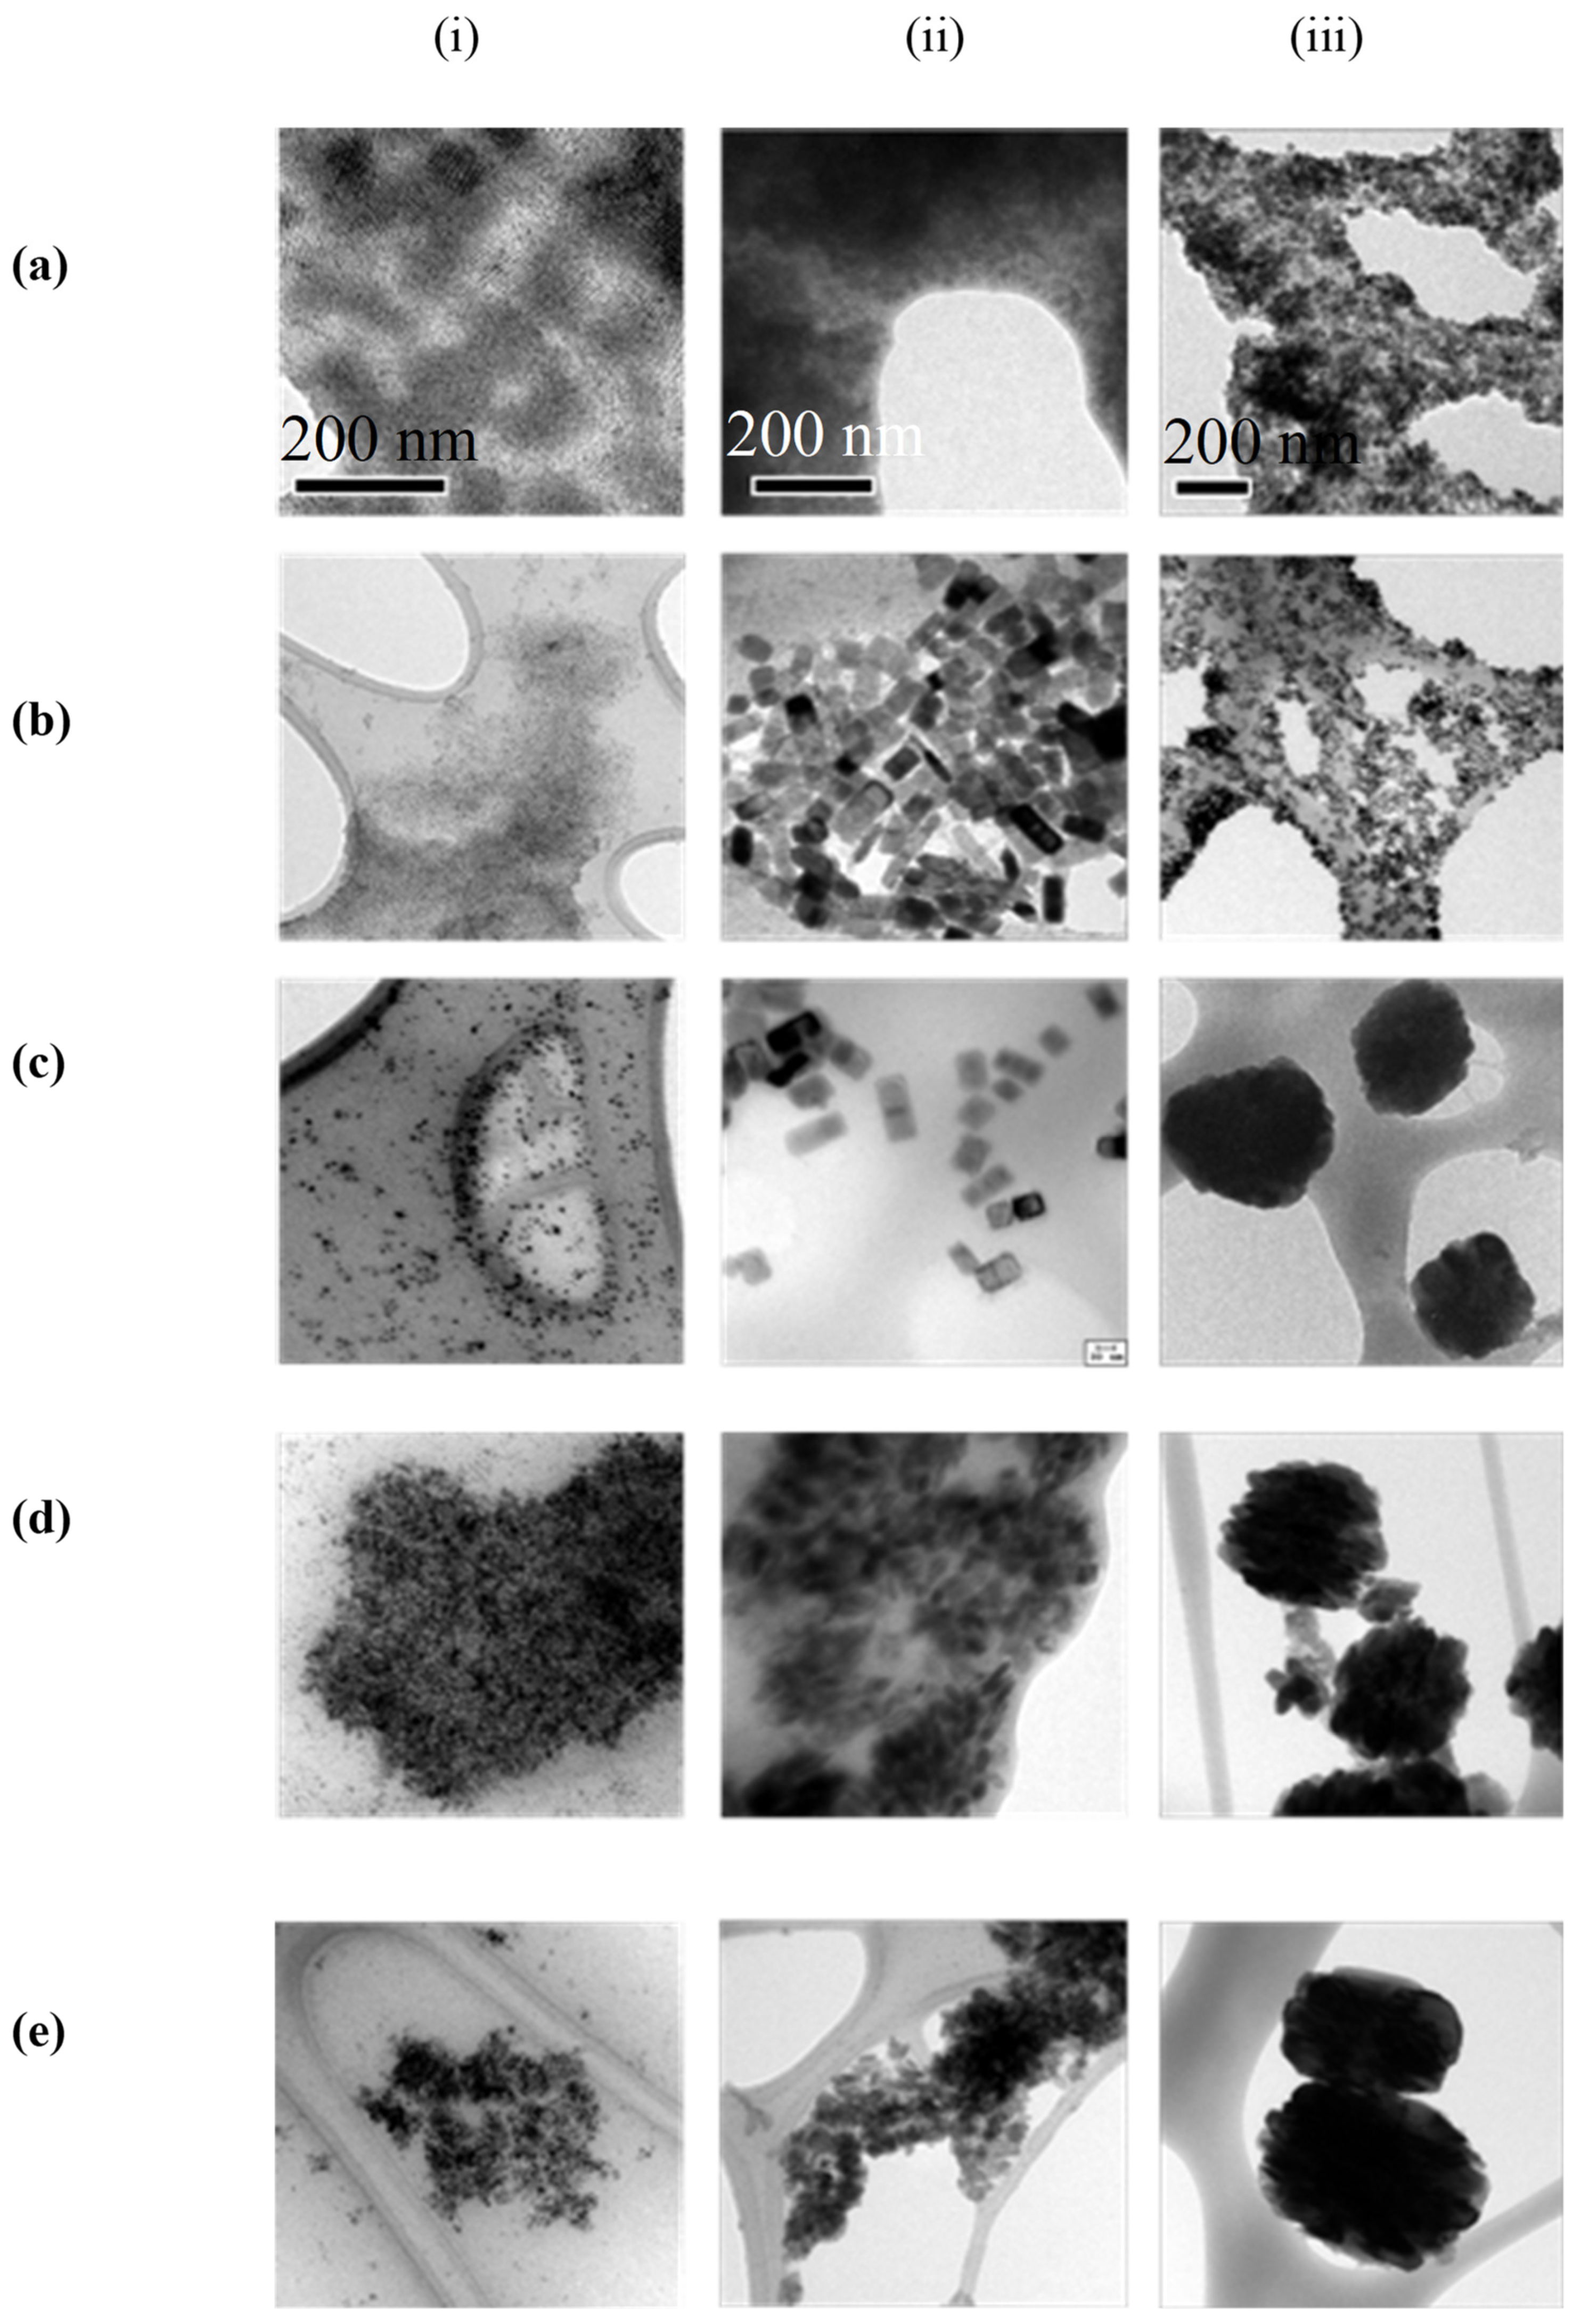
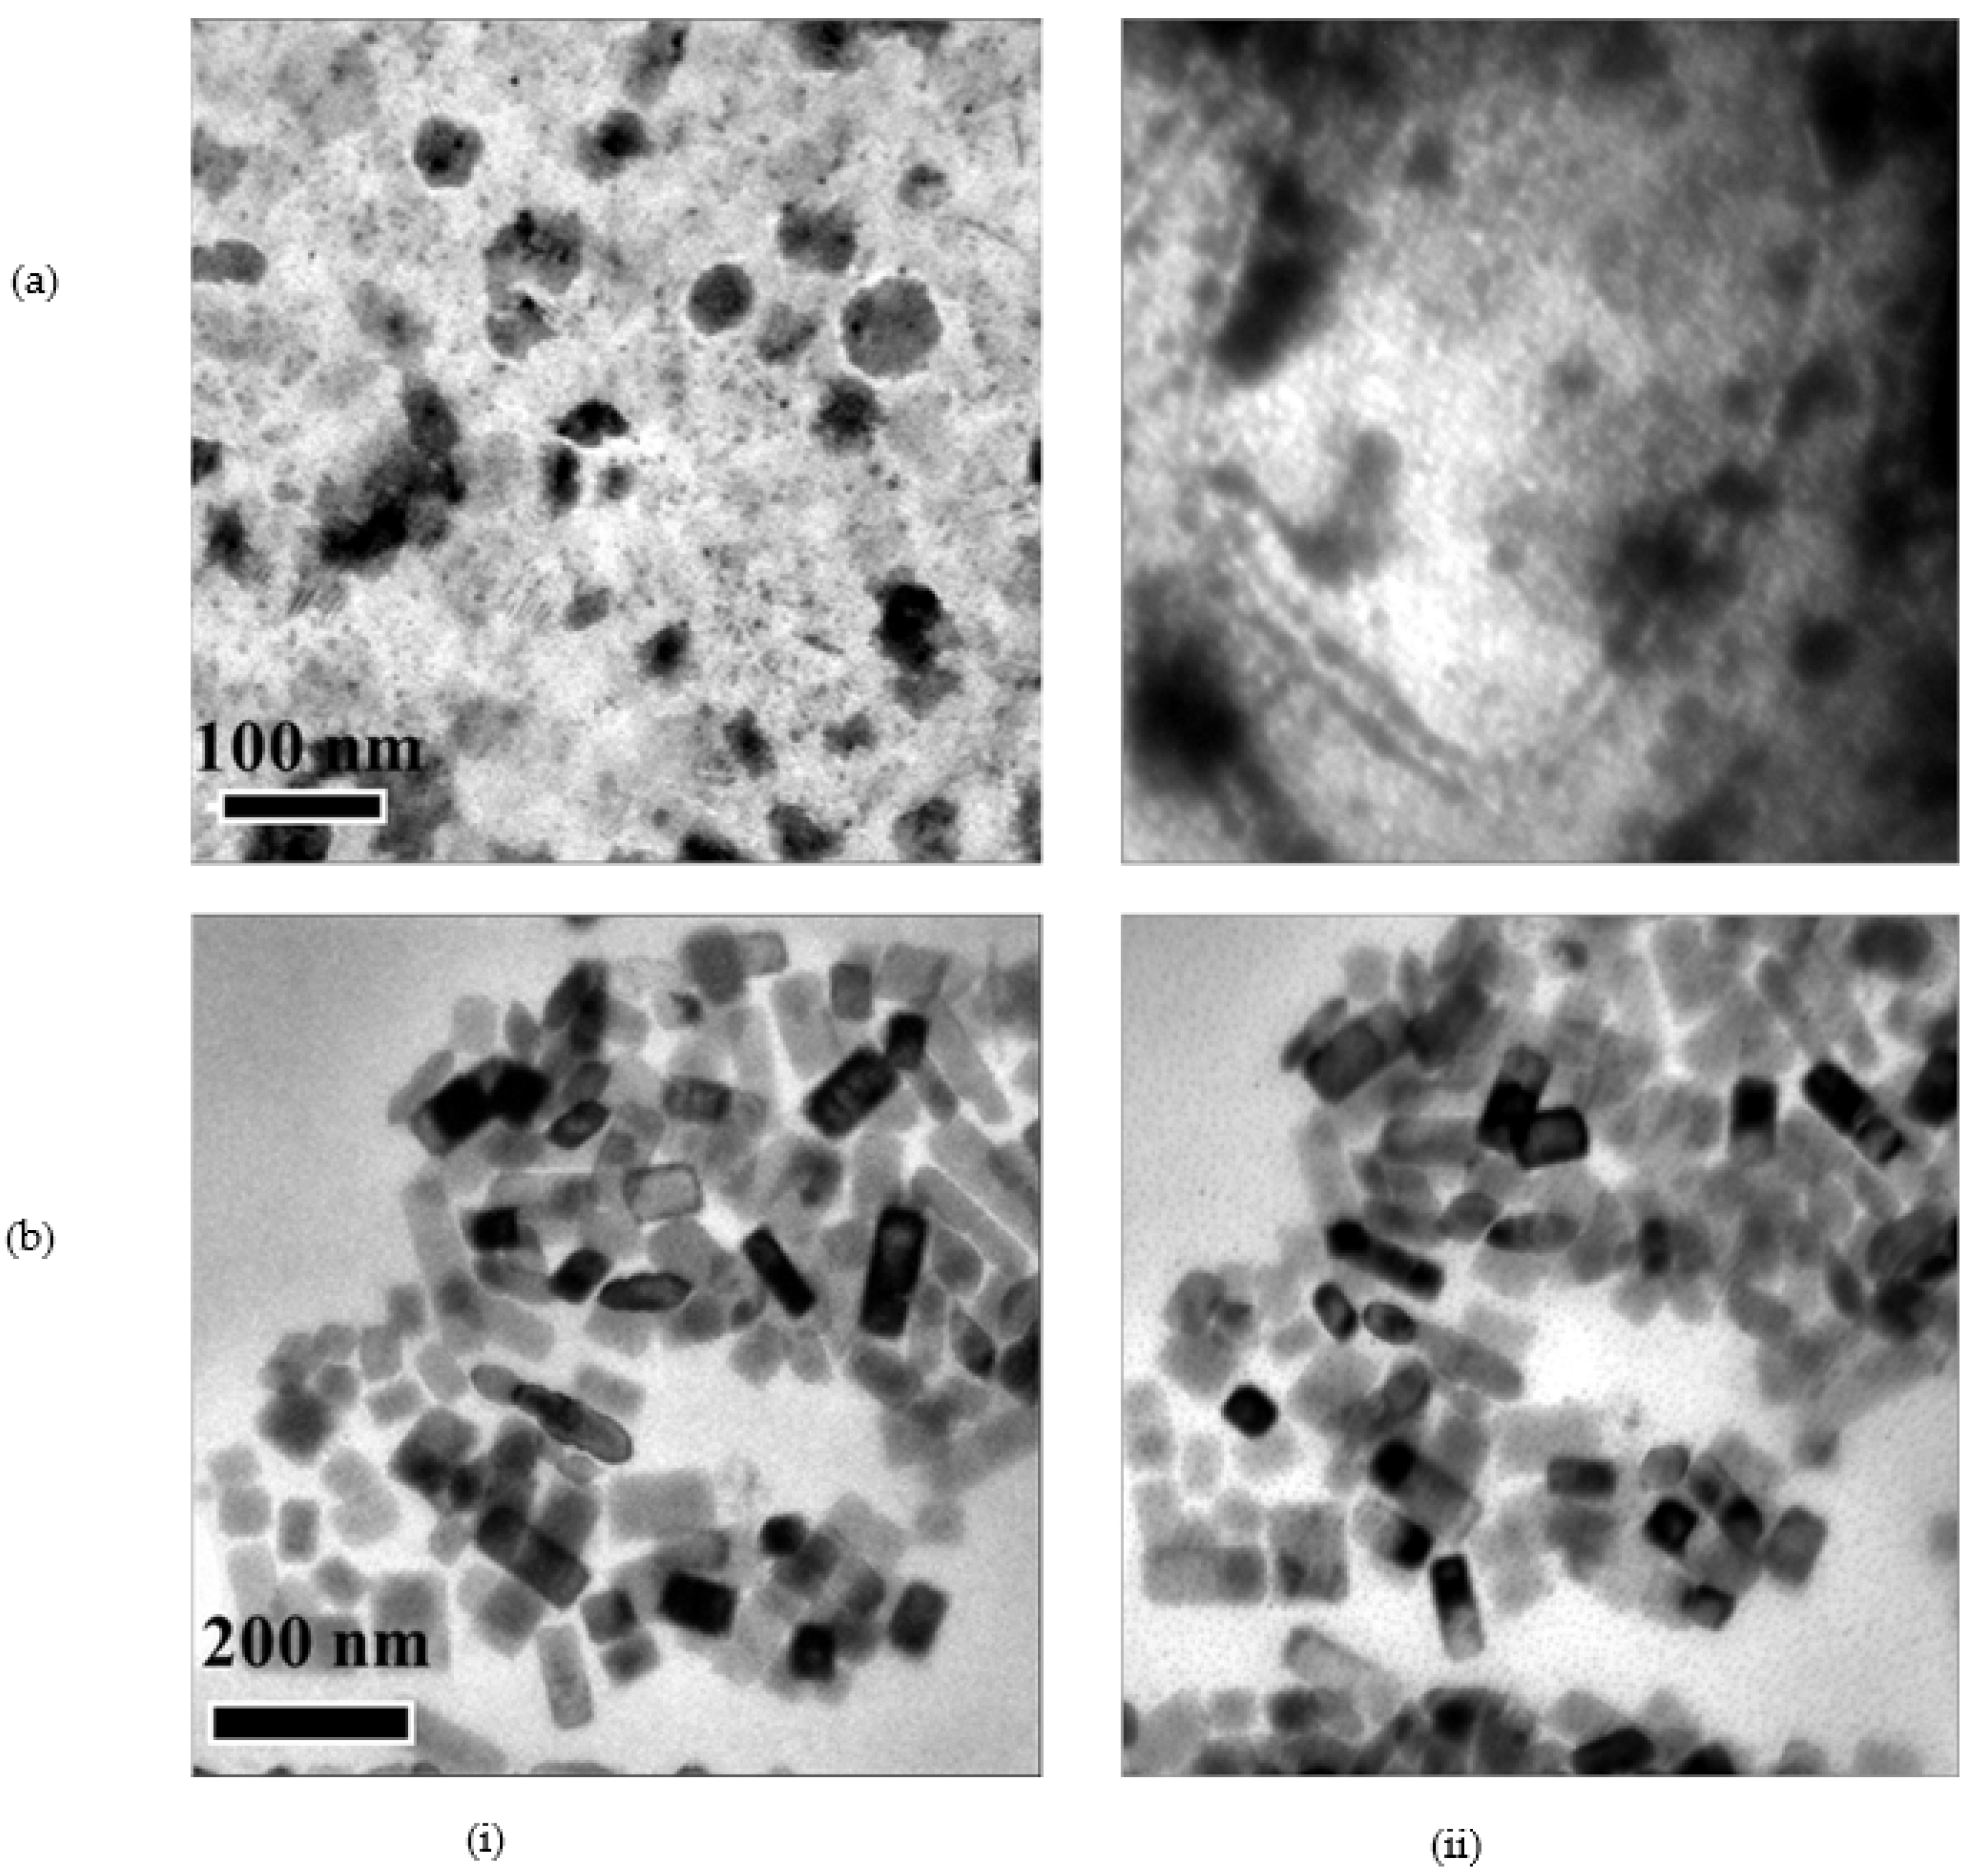
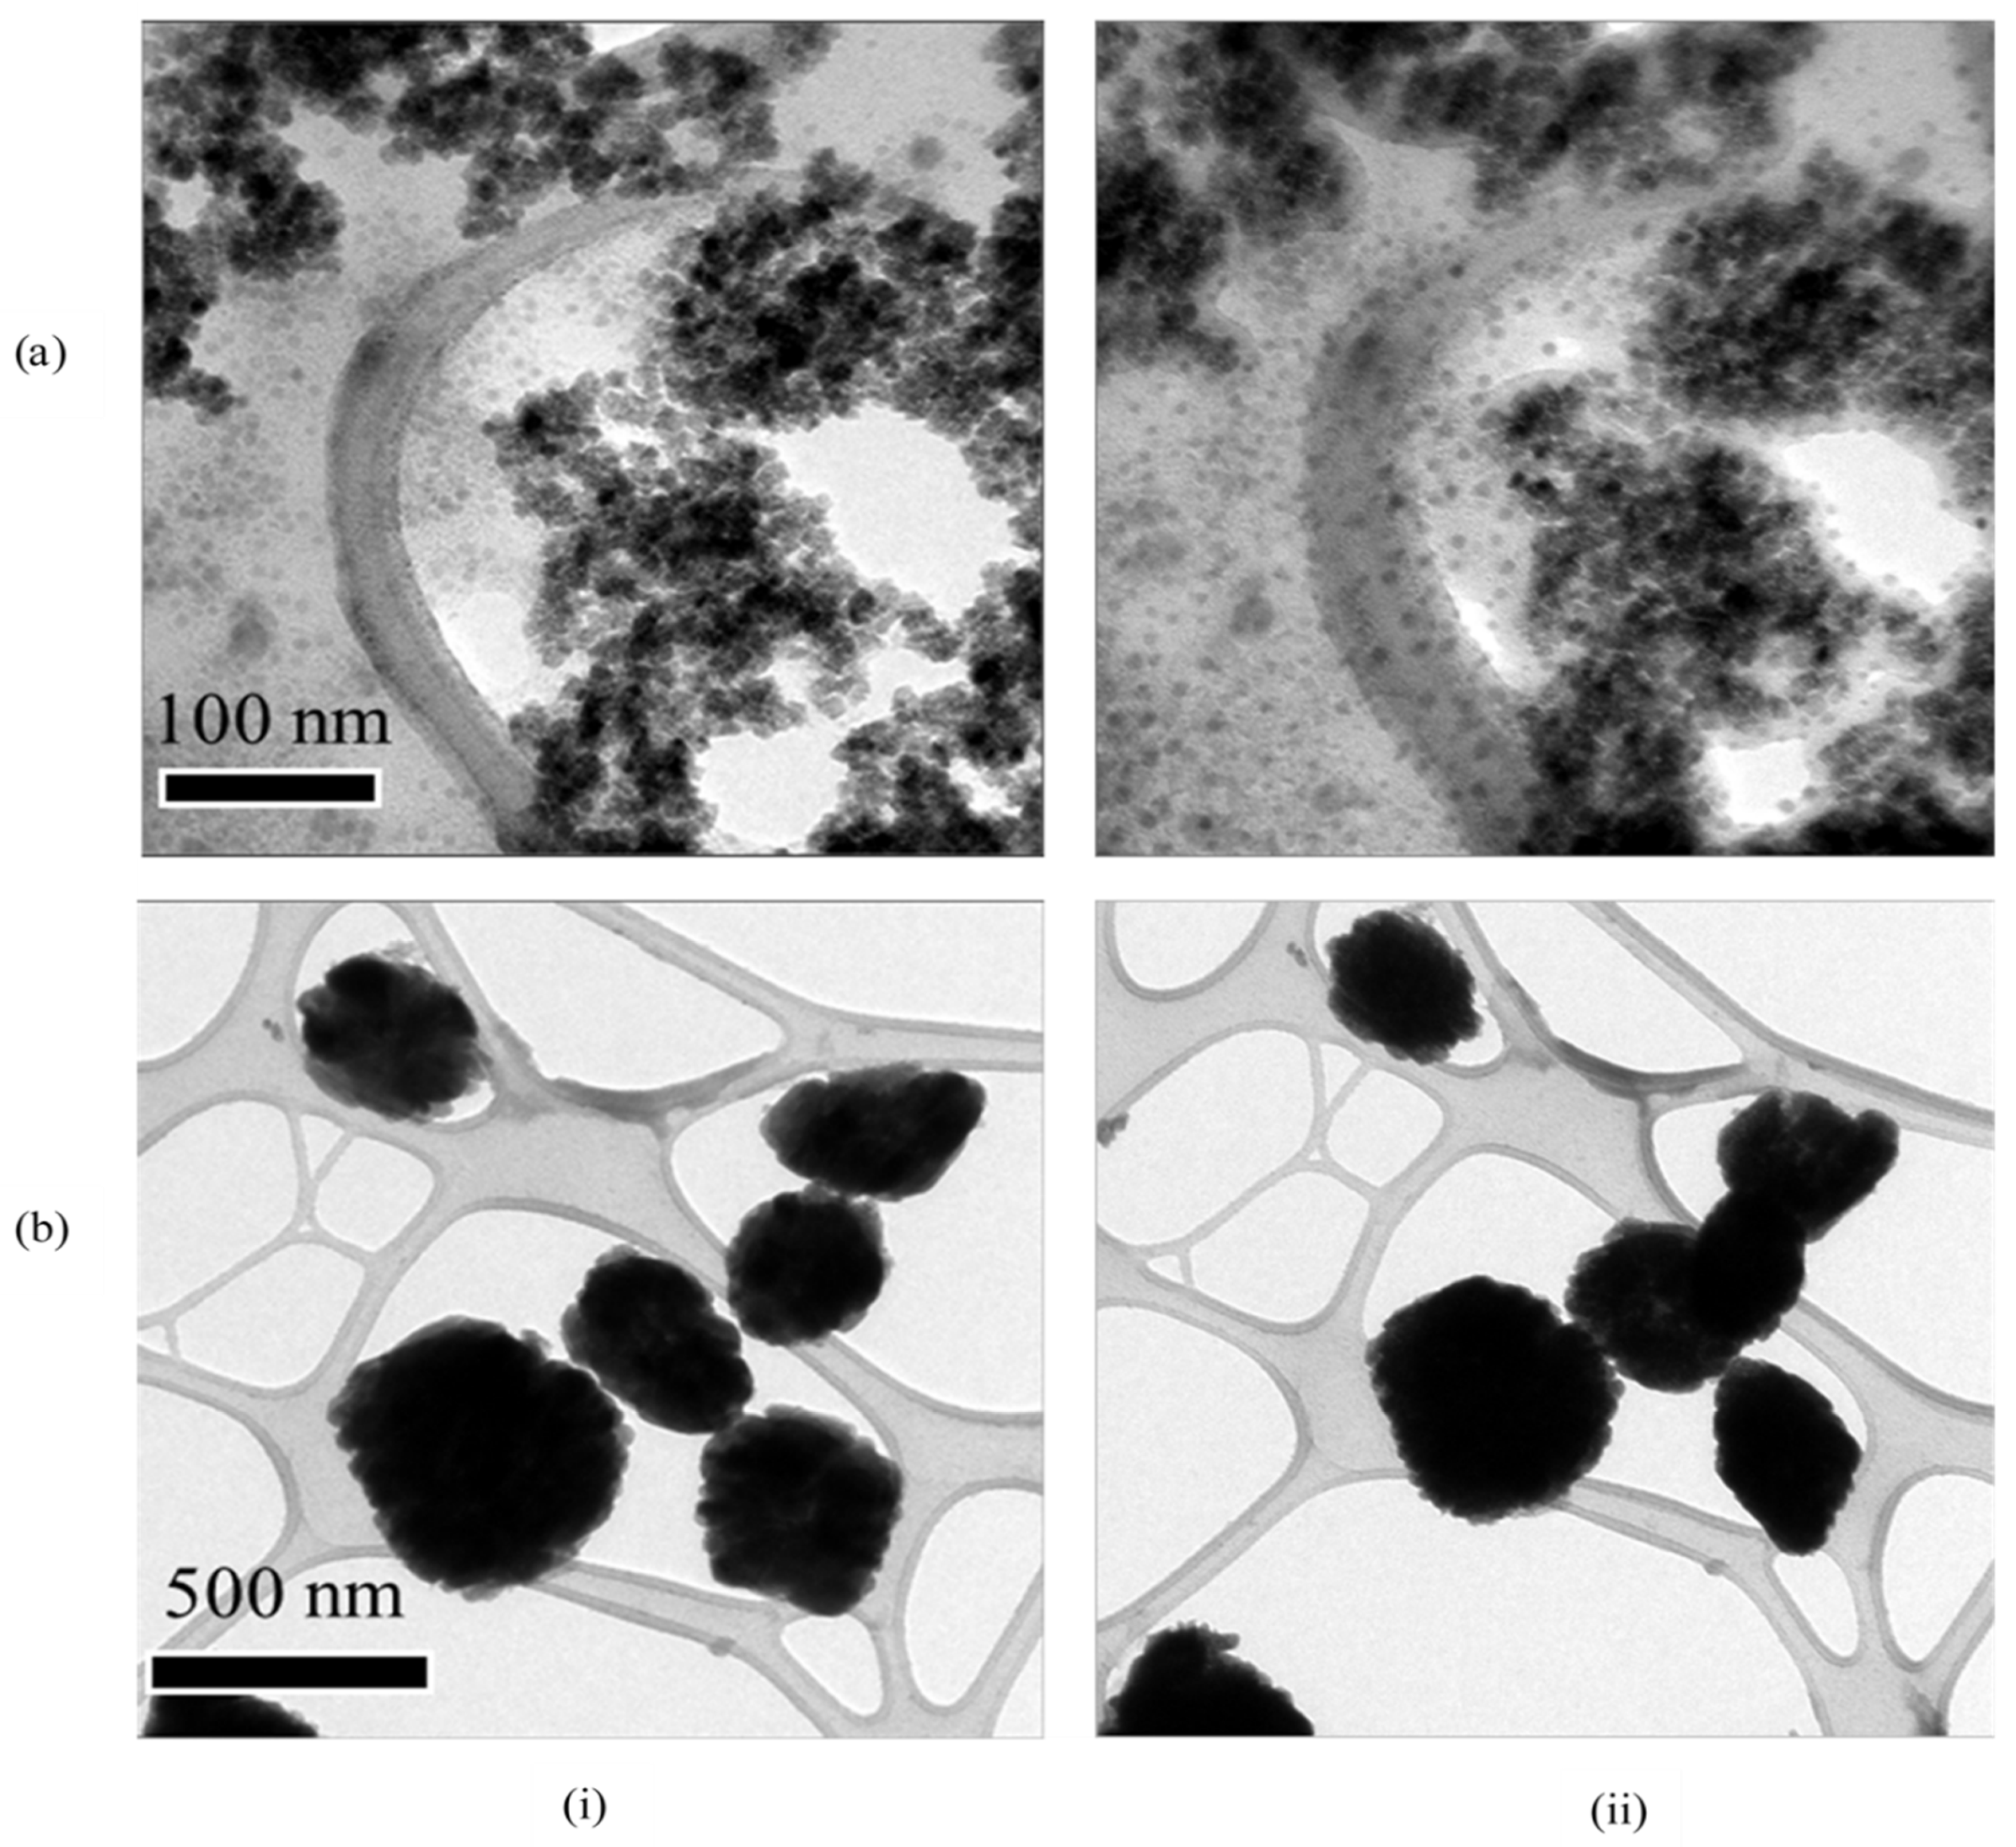
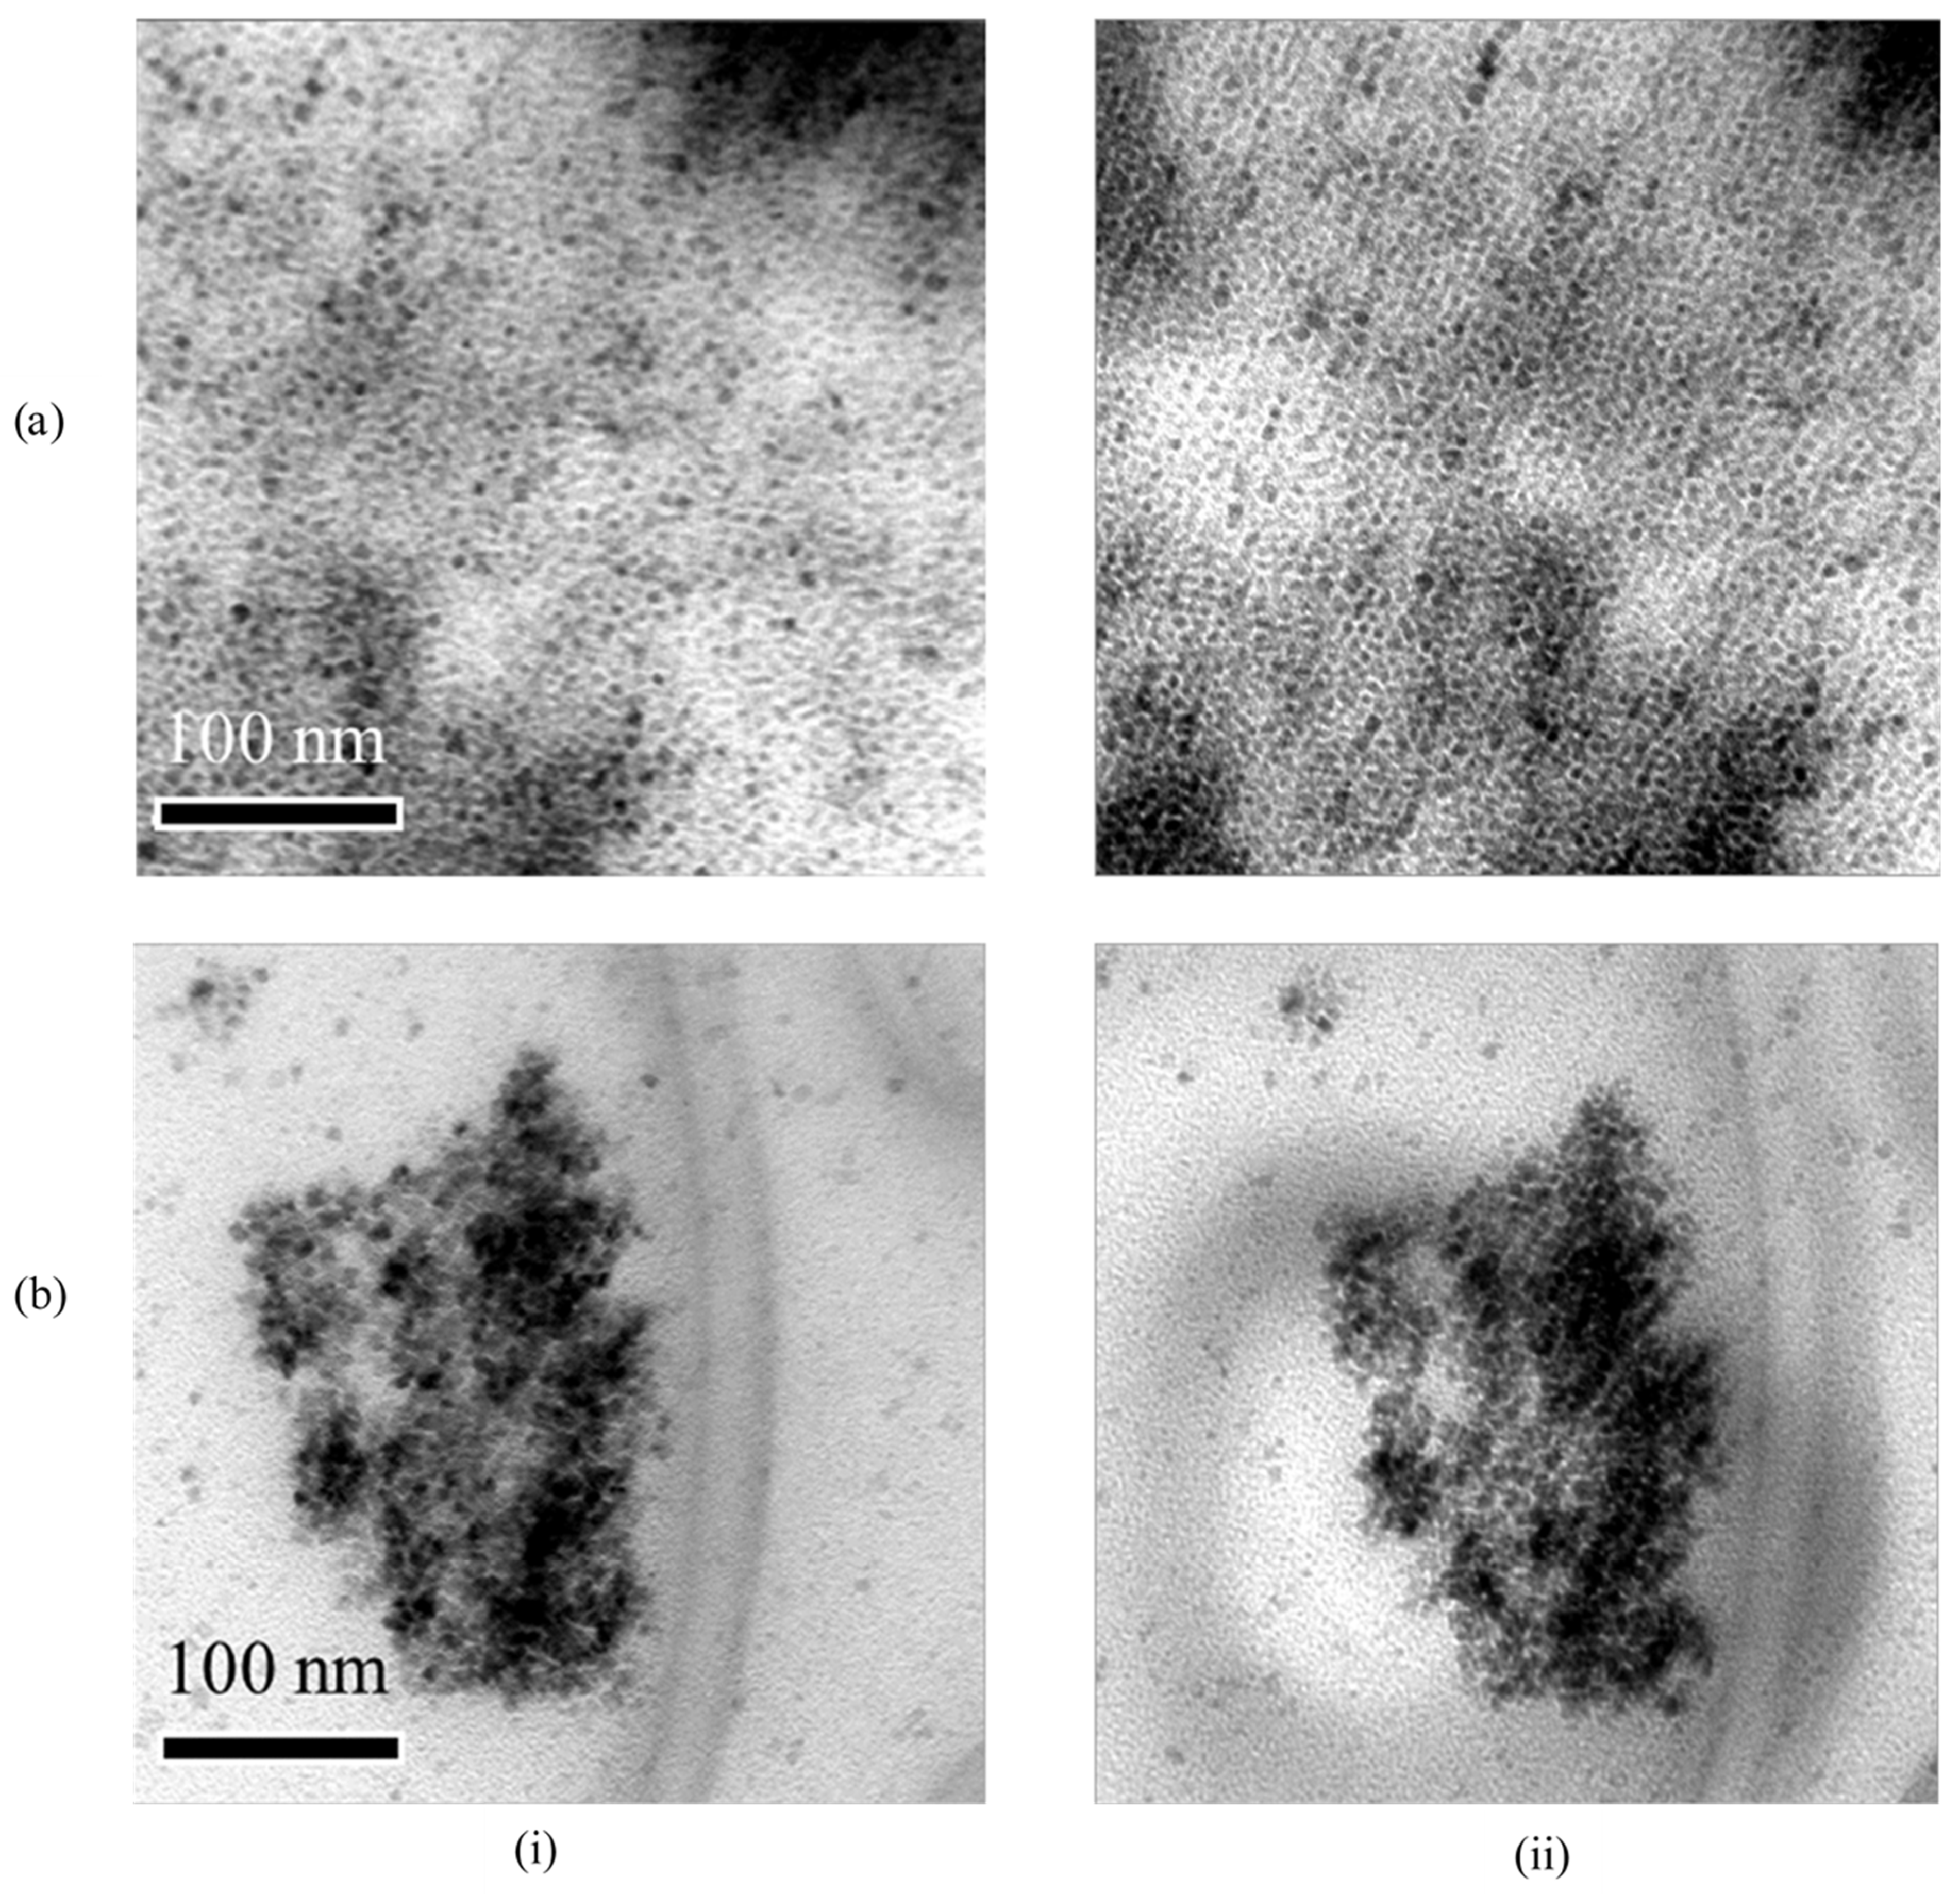
3.1. Synthesis and Characterization
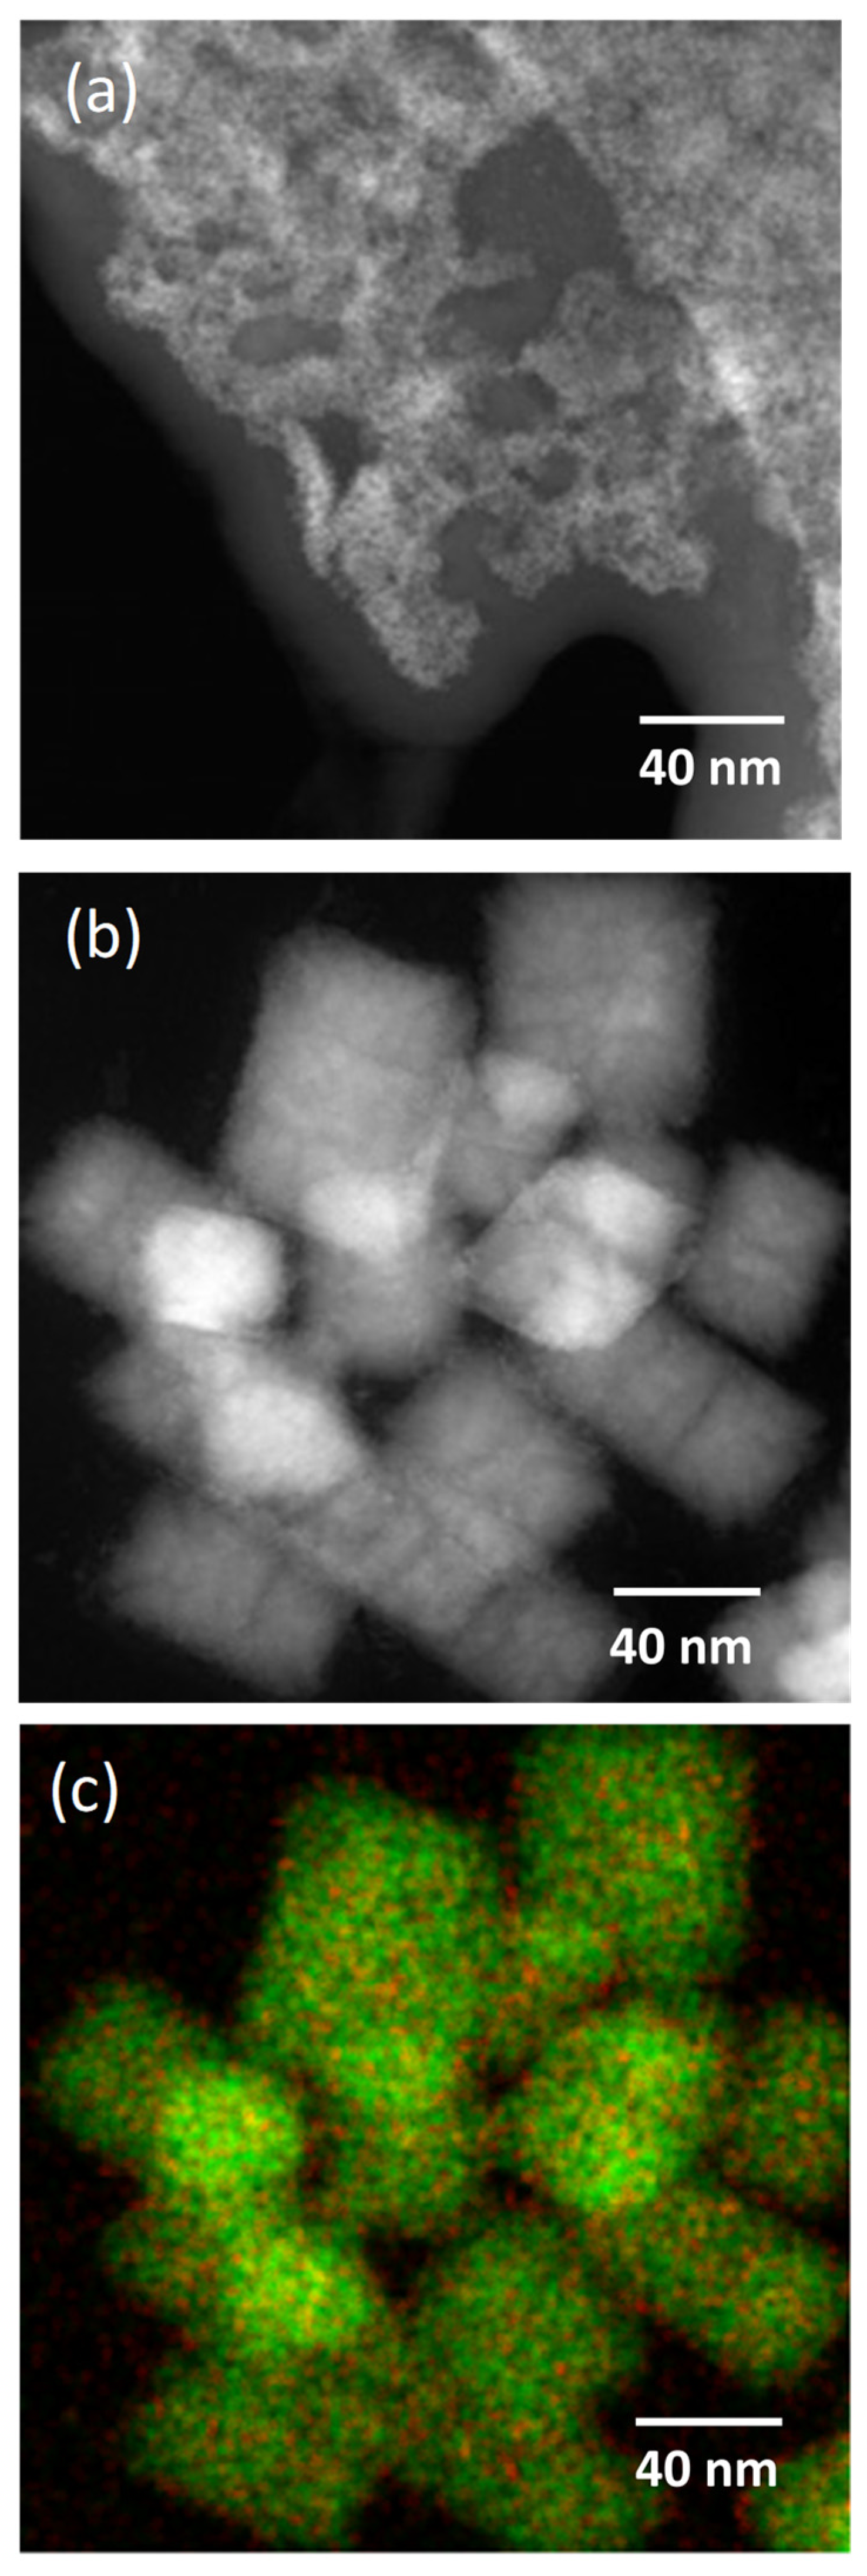
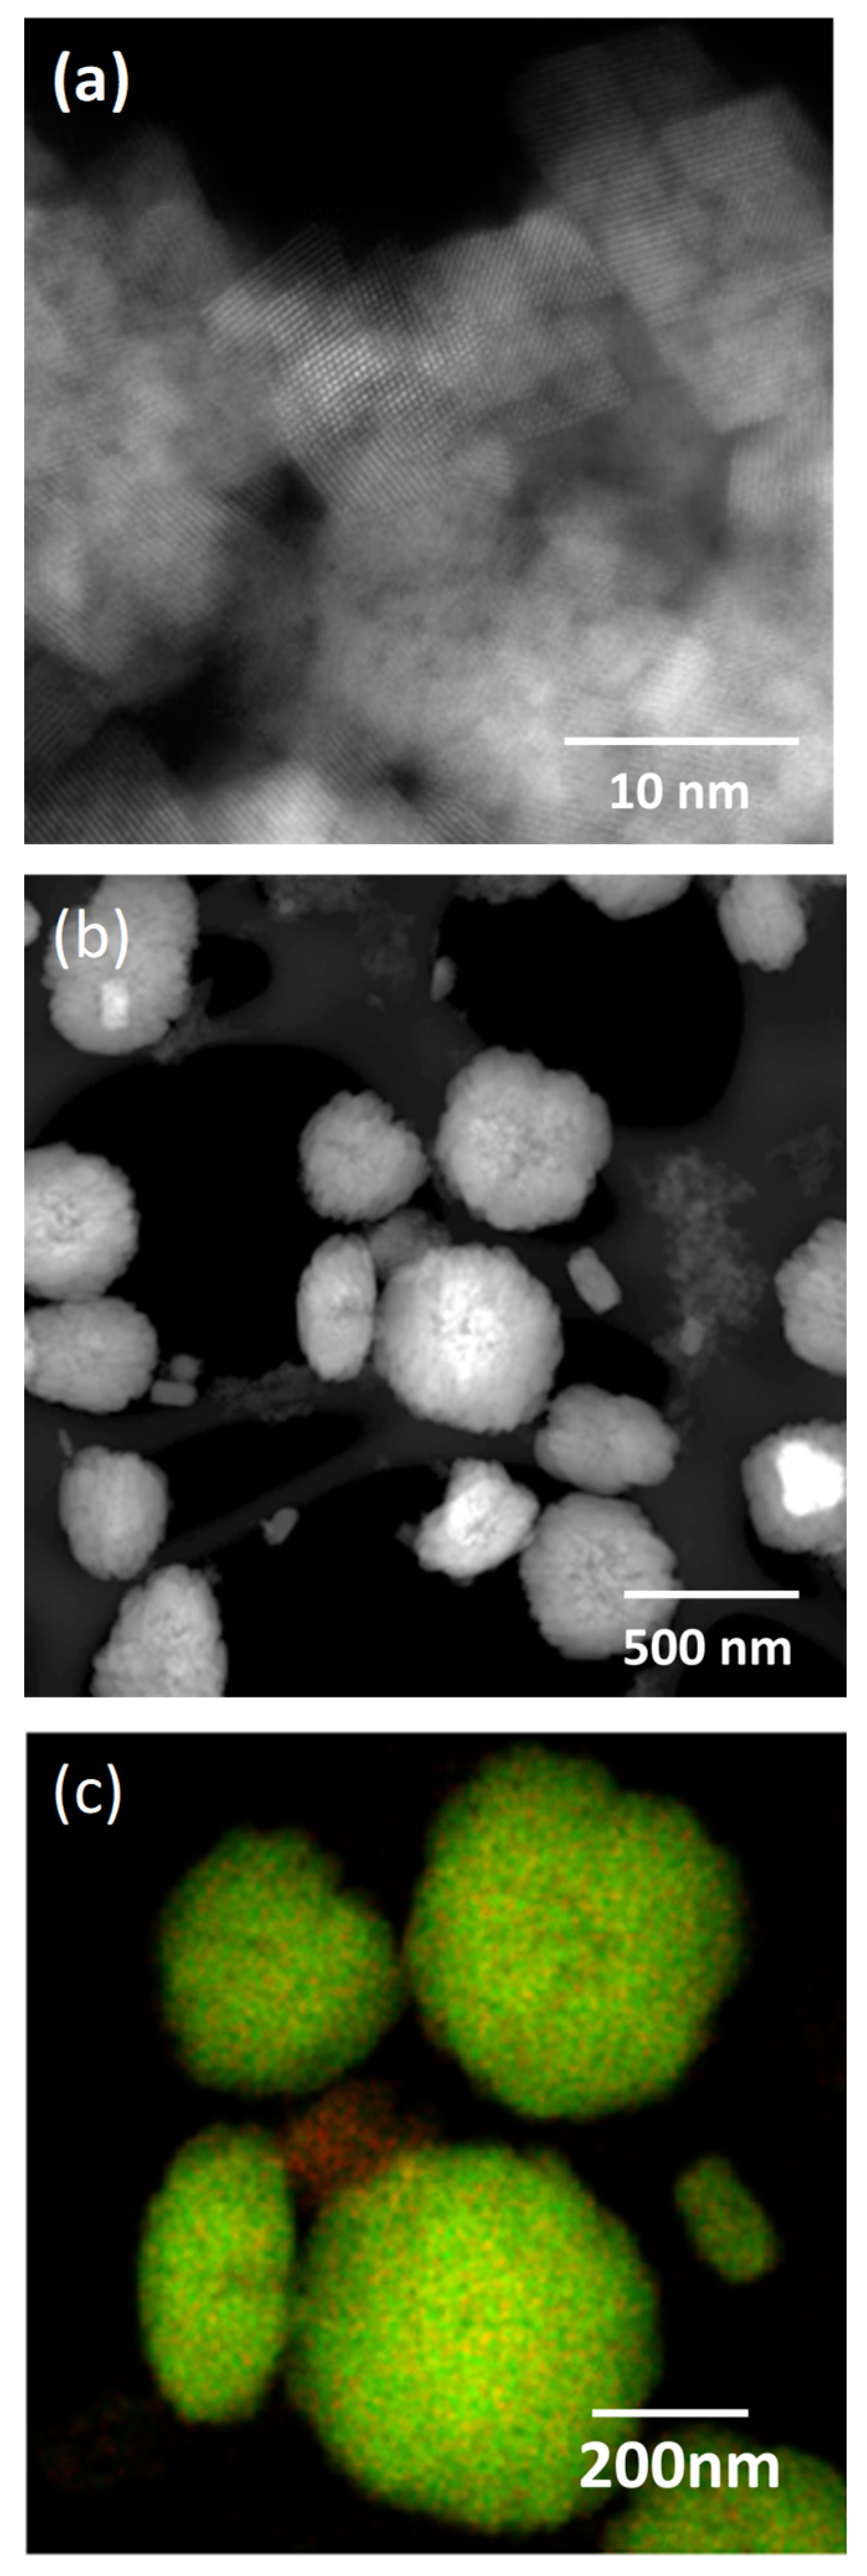
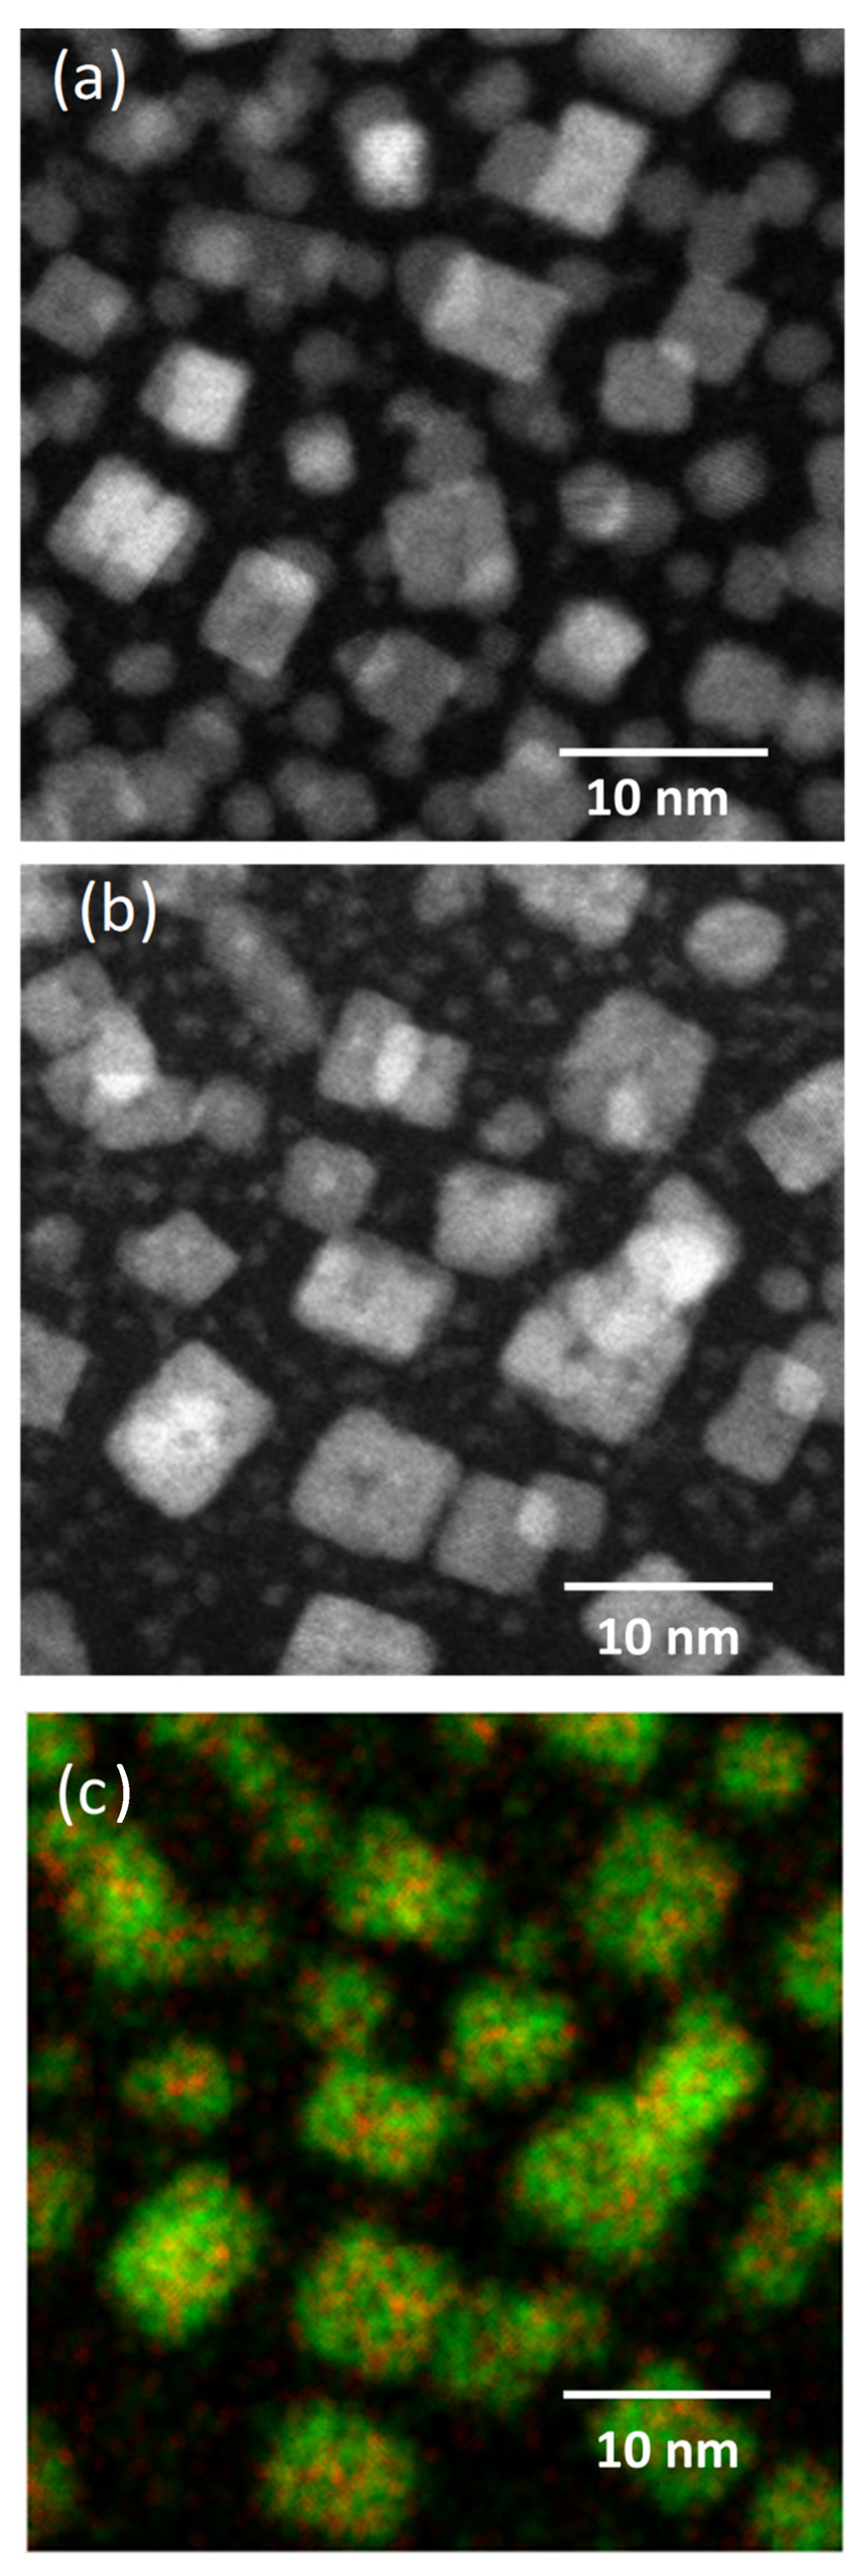
3.2. Dopant Mapping for Eu
3.3. Thermal Stability
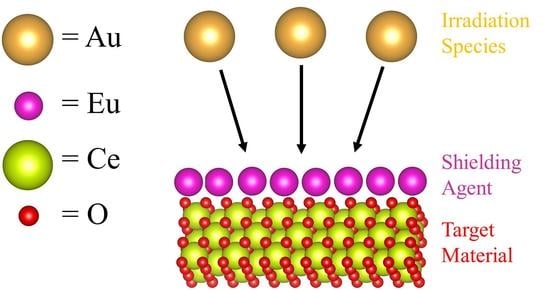
3.4. Irradiation Stability
4. Summary and Conclusions
Supplementary Materials
Author Contributions
Funding
Data Availability Statement
Acknowledgments
Conflicts of Interest
References
- Baker, C.H. Harnessing cerium oxide nanoparticles to protect normal tissue from radiation damage. Transl. Cancer Res. 2013, 2, 343–358. [Google Scholar]
- Issa, S.A.M.; Sayyed, N.I.; Zaid, N.H.N.; Matori, K.A. Effect of Bi2O3 in borate-tellurite-silicate glass system for development of gamma-rays shielding materials. Results Phys. 2018, 9, 206–210. [Google Scholar] [CrossRef]
- Niranjan, R.S.; Rudraswamy, B.; Dhananjaya, N. Effective atomic number, electron density and kerma of gamma radiation for oxides of lanthanides. Pramana 2012, 78, 451–458. [Google Scholar] [CrossRef]
- Al-Hadeethia, Y.; Sayyedc, M.I.; Kaewkhaod, J.; Raffah, B.M.; Almalkia, R.; Rajaramakrishnad, R.; Hussein, M.A. Chalcogenide glass-ceramics for radiation shielding applications. Ceram. Int. 2020, 46, 5380–5386. [Google Scholar]
- Abd-Allah, W.M.; Fayad, A.M.; Saudi, H.A. Structure and Physical Properties of Al2O3 Nanofillers Embedded in Poly(Vinyl Alcohol). Opt. Quantum Electron. 2019, 51, 1–14. [Google Scholar]
- Graham, J.T.; Zhang, Y.; Weber, W.J. Irradiation-induced defect formation and damage accumulation in single crystal CeO2. J. Nucl. Mater. 2018, 498, 400–408. [Google Scholar] [CrossRef]
- Costantini, J.M.; Lelong, G.; Guillaumet, M.; Gourier, D. Recovery of damage in electron-irradiated ceria. J. Appl. Phys. 2021, 129, 155901. [Google Scholar] [CrossRef]
- Sorenson, J.J.; Tieu, E.; Morse, M.D. Bond dissociation energies of lanthanide sulfides and selenides. J. Chem. Phys. 2021, 154, 124307. [Google Scholar] [CrossRef]
- Dhall, A.; Self, W. Cerium Oxide Nanoparticles: A Brief Review of Their Synthesis Methods and Biomedical Applications. Antioxidants 2018, 7, 97. [Google Scholar] [CrossRef] [Green Version]
- Xu, C.; Qu, X. Cerium oxide nanoparticle: A remarkably versatile rare earth nanomaterial for biological applications. NPG Asia Mater. 2014, 6, e90. [Google Scholar] [CrossRef]
- Wang, G.; Peng, Q.; Li, Y. Lanthanide-Doped Nanocrystals: Synthesis, Optical-Magnetic Properties, and Applications. Accounts Chem. Res. 2010, 44, 322–332. [Google Scholar] [CrossRef]
- Wang, Z.; Quan, Z.; Lin, J. Remarkable Changes in the Optical Properties of CeO2 Nanocrystals Induced by Lanthanide Ions Doping. Inorg. Chem. 2007, 46, 5237–5242. [Google Scholar] [CrossRef] [PubMed]
- Lin, Y.-H.; Shen, L.-J.; Chou, T.-H.; Shih, Y.-H. Synthesis, Stability, and Cytotoxicity of Novel Cerium Oxide Nanoparticles for Biomedical Applications. J. Clust. Sci. 2021, 32, 405–413. [Google Scholar] [CrossRef]
- Kumar, A.; Babu, S.; Karakoti, A.S.; Schulte, A.; Seal, S. Luminescence Properties of Europium-Doped Cerium Oxide Nanoparticles: Role of Vacancy and Oxidation States. Langmuir 2009, 25, 10998–11007. [Google Scholar] [CrossRef] [PubMed]
- Hubbard, J.A.; Boyle, T.J.; Sepper, E.T.; Brown, A.; Settecerri, T.; Santarpia, J.L.; Kotula, P.; McKenzie, B.; Lucero, G.A.; Lemieux, L.J.; et al. Airborne Release Fractions from Surrogate Nuclear Waste Fires Containing Lanthanide Nitrates and Depleted Uranium Nitrate in 30% Tributyl Phosphate in Kerosene. Nucl. Technol. 2021, 207, 103–118. [Google Scholar] [CrossRef]
- Olegárioa, R.C.; de Souzaa, E.C.F.; Borges, J.F.M.; da Cunhac, J.B.M.; de Andrade, A.V.C.; Antunesa, S.R.M.; Antunes, C.A. Synthesis and characterization of Fe3+ doped cerium–praseodymium oxide pigments. Dye. Pigment. 2013, 97, 113–117. [Google Scholar] [CrossRef]
- Yabe, S.; Yamashita, M.; Momose, S.; Tahira, K.; Yoshida, S.; Li, R.; Yin, S.; Sato, T. Synthesis and UV-shielding properties of metal oxide doped ceria via soft solution chemical processes. Int. J. Inorg. Mater. 2001, 3, 1003–1008. [Google Scholar] [CrossRef]
- Cabral, A.C.; Cavalcante, L.S.; Deus, R.C.; Longo, E.; Simoes, A.Z.; Moura, F. Photoluminescence properties of praseodymium doped cerium oxide nanocrystals. Ceram. Int. 2014, 40, 4445–4453. [Google Scholar] [CrossRef]
- Hattar, K.; Bufford, D.C.; Buller, D.L. Concurrent in situ ion irradiation transmission electron microscope. Nucl. Instrum. Methods Phys. Res. Sect. B Beam Interact. Mater. At. 2014, 338, 56–65. [Google Scholar] [CrossRef] [Green Version]
- Yu, T.; Park, Y.I.; Kang, M.-C.; Joo, J.; Par, J.K.; Won, H.Y.; Hyeon, K.J.J.T. Large-Scale Synthesis of Water Dispersible Ceria Nanocrystals by a Simple Sol–Gel Process and Their Use as a Chemical Mechanical Planarization Slurry. Eur. J. Inorg. Chem. 2008, 2008, 855–858. [Google Scholar] [CrossRef]
- Zhang, F.; Chan, S.-W.; Spanier, J.E.; Apak, E.; Jin, Q.; Robinson, R.D.; Herman, I.P. Cerium oxide nanoparticles: Size-selective formation and structure analysis. Appl. Phys. Lett. 2002, 80, 127–129. [Google Scholar] [CrossRef] [Green Version]
- Yang, S.; Gao, L. Controlled Synthesis and Self-Assembly of CeO2 Nanocubes. J. Am. Chem. Soc. 2006, 128, 9330–9331. [Google Scholar] [CrossRef] [PubMed]
- Branson, J.V.; Hattar, K.; Rossi, P.; Vizkelethy, G.; Powell, C.J.; Hernandez-Sanchez, B.; Doyle, B. Ion beam characterization of advanced luminescent materials for application in radiation effects microscopy. Nucl. Instrum. Methods Phys. Res. Sect. B Beam Interact. Mater. At. 2011, 269, 2326–2329. [Google Scholar] [CrossRef]
- Hoppe, S.M.; Hattar, K.; Boyle, T.J.; Villone, J.; Yang, P.; Patrick Doty, F.; Hernandez-Sanchez, B.A. Application of in-situ ion irradiation TEM and 4D tomography to advanced scintillator materials. In Penetrating Radiation Systems and Applications XIII; International Society for Optics and Photonics: Bellingham, WA, USA, 2012; Volume 8509. [Google Scholar]
- Blair, S.J.; Muntifering, B.R.; Chan, R.O.; Barr, C.M.; Boyle, T.J.; Hattar, K. Unexpected radiation resistance of core/shell ceramic oxide nanoparticles. Mater. Today Commun. 2018, 17, 109–113. [Google Scholar] [CrossRef]
- Kiani, M.T.; Hattar, K.; Wendy Gu, X. In situ TEM Study of Radiation Resistance of Metallic Glass–Metal Core–Shell Nanocubes. ACS Appl. Mater. Interfaces 2020, 12, 40910–40916. [Google Scholar] [CrossRef] [PubMed]


| CeO2 | Nd:CeOx | Eu:CeOx | Er:CeOx | Lu:CeOx | |
|---|---|---|---|---|---|
| XRF | Ce (major) Eu (minor) Cl(minor) | Ce (major) Nd (minor) Cl (minor) Zr (minor) | Ce (major) Eu (minor) Cl (minor) | Ce (major) Er (minor) | Ce (major) Lu (minor) |
| pXRD | (25 °C) 00-067-0123 CeO2 ceria|Cerium Oxide | (600 °C) 00-067-0123 CeO2 ceria|Cerium Oxide | (600 °C) 00-067-0122 CeO2 ceria|Cerium Oxide | (600 °C) 00-067-0123 CeO2 ceria|Cerium Oxide | (600 °C) 00-067-0123 CeO2 ceria|Cerium Oxide |
| ATR-FTIR (cm−1) | 3317.93 (m) 2920.58 (s) 2851.09 (m) 2163.86 (w) 2037.01 (w) 1613.62 (m) 1460.77 (w) 1411.48 (m) 1064.97 (w) 965.24 (w) | 3355.01 (m, br) 2923.12 (m) 2853.10 (m) 2583.18 (w) 2164.12 (w) 2079.88 (w) 1980.97 (w) 1467.17 (s) 1393.84 (s) 1260.87 (w) 1083.29 (w) 843.62 (m) 802.36 (m) 708.90 (m) | 3340.37 (m) 3003.64 (w) 2920.74 (s) 2851.20 (m) 2162.81 (w) 2035.73 (w) 1494.59 (m) 1460.04 (s) 1404.08 (m) 1079.23 (w) 965.75 (w) 841.10 (w) 720.57 (m) | 3323.03 (s) 3213.14 (s) 2920.59 (s) 2851.22 (m) 2214.27 (w) 1624.61 (s) 1462.78 (w) 1410.58 (m) 1049.92 (w) 966.31 (w) 719.16 (s) | 3315.26 (s) 3210.01 (s) 2922.62 (m) 2852.34 (w) 2216.86 (w) 1618.16 (s) 1411.97 (m) 1117.11 (w) 966.47 (w) 699.03 (m) |
| DLS (nm) | 257 (100%) | 295 (100%) | 257 (54%) 901 (46%) | 343 (100%) | 518 (100%) |
| Prep Route | Temp (°C) | Sample | Aerial Density (µm−2) | Size (nm) | Sample | Aerial Density (µm−2) | Size (nm) |
|---|---|---|---|---|---|---|---|
| ON | 25 | CeO2 | N/A | N/A | Eu:CeO2 | 190.63 | 42.4 |
| 100 | 201.06 | 42.34 | |||||
| 200 | 189.14 | 42.42 | |||||
| 300 | 177.23 | 42.42 | |||||
| 400 | 171.27 | 42.43 | |||||
| 500 | 160.85 | 42.45 | |||||
| HMTA | 25 | CeO2 | 2919 | 5.77 | Eu:CeO2 | 2.204 | 340.57 |
| 100 | 3216 | 5.75 | 2.204 | 340.61 | |||
| 200 | 3797 | 5.79 | 2.204 | 340.6 | |||
| 300 | 4932 | 5.84 | 2.204 | 340.59 | |||
| 400 | 4676 | 5.81 | 2.204 | 340.6 | |||
| 500 | 4649 | 5.81 | 2.204 | 340.62 | |||
| TBA | 25 | CeO2 | 15,882 | 4.07 | Eu:CeO2 | 4593 | 7.3 |
| 100 | 16,445 | 4.04 | 4931 | 7.27 | |||
| 200 | 15,519 | 4.09 | 5026 | 7.23 | |||
| 300 | 15,501 | 4.09 | 4342 | 7.31 | |||
| 400 | 14,818 | 4.1 | 3910 | 7.34 | |||
| 500 | 14,083 | 4.12 | 3850 | 7.34 |
Publisher’s Note: MDPI stays neutral with regard to jurisdictional claims in published maps and institutional affiliations. |
© 2021 by the authors. Licensee MDPI, Basel, Switzerland. This article is an open access article distributed under the terms and conditions of the Creative Commons Attribution (CC BY) license (https://creativecommons.org/licenses/by/4.0/).
Share and Cite
Burns, K.; Reuel, P.C.; Guerrero, F.; Lang, E.; Lu, P.; Aitkaliyeva, A.; Hattar, K.; Boyle, T.J. Thermal Stability and Radiation Tolerance of Lanthanide-Doped Cerium Oxide Nanocubes. Crystals 2021, 11, 1369. https://doi.org/10.3390/cryst11111369
Burns K, Reuel PC, Guerrero F, Lang E, Lu P, Aitkaliyeva A, Hattar K, Boyle TJ. Thermal Stability and Radiation Tolerance of Lanthanide-Doped Cerium Oxide Nanocubes. Crystals. 2021; 11(11):1369. https://doi.org/10.3390/cryst11111369
Chicago/Turabian StyleBurns, Kory, Paris C. Reuel, Fernando Guerrero, Eric Lang, Ping Lu, Assel Aitkaliyeva, Khalid Hattar, and Timothy J. Boyle. 2021. "Thermal Stability and Radiation Tolerance of Lanthanide-Doped Cerium Oxide Nanocubes" Crystals 11, no. 11: 1369. https://doi.org/10.3390/cryst11111369