Communication

Enhanced Fluorescence Detection of Interleukin 10 by Means of 1D Photonic Crystals

1
Department of Basic and Applied Sciences for Engineering, Sapienza University of Rome, 00161 Roma, Italy
2
Department of Biology and Biotechnology “C. Darwin”, Sapienza University of Rome, 00185 Rome, Italy
3
Fraunhofer Institute for Applied Optics and Precision Engineering IOF, 07743 Jena, Germany
*
Author to whom correspondence should be addressed.
Crystals 2021, 11(12), 1517; https://doi.org/10.3390/cryst11121517
Submission received: 2 November 2021 / Revised: 29 November 2021 / Accepted: 3 December 2021 / Published: 5 December 2021
(This article belongs to the Section Inorganic Crystalline Materials)

Abstract

:
In the present communication, we report on the exploitation of a Bloch surface wave-enhanced fluorescence scheme for the detection of Interleukin (IL)-10 in a protein-rich buffer mimicking a biological sample. IL-10 is a cytokine known for its potent anti-inflammatory and immunosuppressive effects. It is considered a valuable biomarker for prognostic prediction for both solid tumors and hematological malignancies, and recently, a distinguishing feature of hyperinflammation during severe viral infections. To demonstrate the validity of the technique, we transferred all the reagents and working concentrations used in a gold-standard technique, such as ELISA, to our assay, with a substantial reduction in the execution time and without using any enzymatic amplification during IL-10 recognition. We estimate a limit of detection (LoD) in terms of the concentration of IL-10 in solution of the order of 110 pg/mL (5.8 pM) with a 14% accuracy; in other terms, the presented technique is compatible with the assay range and resolution (1.6 pM) of commercial gold-standard ELISA kits. Moreover, such LoD successfully matches the concentrations reported in literature for IL-10 detection in COVID-19 patients, making the BSW-based sensors a viable solution for rapid and accurate screening of COVID-19-related molecules.

Graphical Abstract

1. Introduction

Interleukin (IL)-10 is a cytokine known for its potent anti-inflammatory and immunosuppressive effects. Such a molecule is a valuable biomarker for prognostic prediction for both solid tumors and hematological malignancies [1], and recently, a distinguishing feature of hyperinflammation during severe viral infections [2]. Indeed, the main function of IL-10 during infections is to inhibit the host immune response to pathogens and microbiota, thereby tempering hyperinflammation and preventing tissue damage [2]. Recently, clinical evidence has suggested that the cytokine storm, involving a dramatic early proinflammatory IL-10 elevation, may play a pathological role in COVID-19 severity [3]. Such a dramatic early rise in IL-10 appears to be a distinguishing feature of hyperinflammation during severe SARS-CoV-2 infection [3] demonstrating that IL-10 can be used as biomarker in patients with COVID-19 [4,5].
During recent decades, optical biosensors have provided clear advantages over traditional analytical techniques in terms of real-time, label-free and fluorescence detection of biological molecules in a highly sensitive, specific and cost-effective manner [6,7].
Recently, nanopatterned photonic crystals and photonic lab-on-a-chip have attracted the interest of scientific researchers for their performances. The first solution offered a limit of detection (LoD) of 6 pg/mL (0.12 pM) in tumor necrosis factor detection [8], whereas the second approach was developed for rapid determination of interleukin-2 working in a concentration range from 50 to 1000 pg/mL (3.2–62.5 pM) [9]. In contrast, among gold-standard methods, enzyme-linked immunosorbent assay (ELISA) is highly sensitive but requires time-consuming antibody immobilization and long incubation periods for biological recognition. This technique however guarantees an LoD of 1.6 pM for IL-10 detection [10].
More recently, one-dimensional photonic crystal (1DPC) fluorescence biosensors sustaining Bloch surface waves (BSW) [11,12,13,14,15,16,17] have been proposed as a valid alternative to metal-enhanced fluorescence biosensors based on surface plasmon polariton (SPP) [18,19]. Similarly to the SPP case, fluorescence emitters in proximity of the surface of the 1DPC can couple to the BSW, thus leading to enhanced excitation rates and BSW-coupled emission, which provide opportunities for new formats of fluorescence detection and biosensing [13,20,21]. The strength of coupling is governed by the local density of optical states, which can be relatively large for BSW due to their strong localization at the 1DPC surface [22]. In general, the radiative rate of a fluorophore in proximity to a 1DPC depends on the position, orientation, and direction of the emitter [11,22,23].
Thus, the aim of this work is to exploit Bloch surface wave-enhanced fluorescence collection on 1DPC to detect IL-10 in a less time-consuming way, without enzymatic amplification and with keeping the LoD in the range of the ELISA technique. To demonstrate the validity of the proposed technique, we transferred all the reagents and working concentrations used in a gold-standard technique such as ELISA to our assay, with a substantial reduction in the execution time and without using any enzymatic amplification during IL-10 recognition. The present work paves the way towards a larger study on cytokine release syndrome associated with COVID-19 [3].

2. Materials and Methods

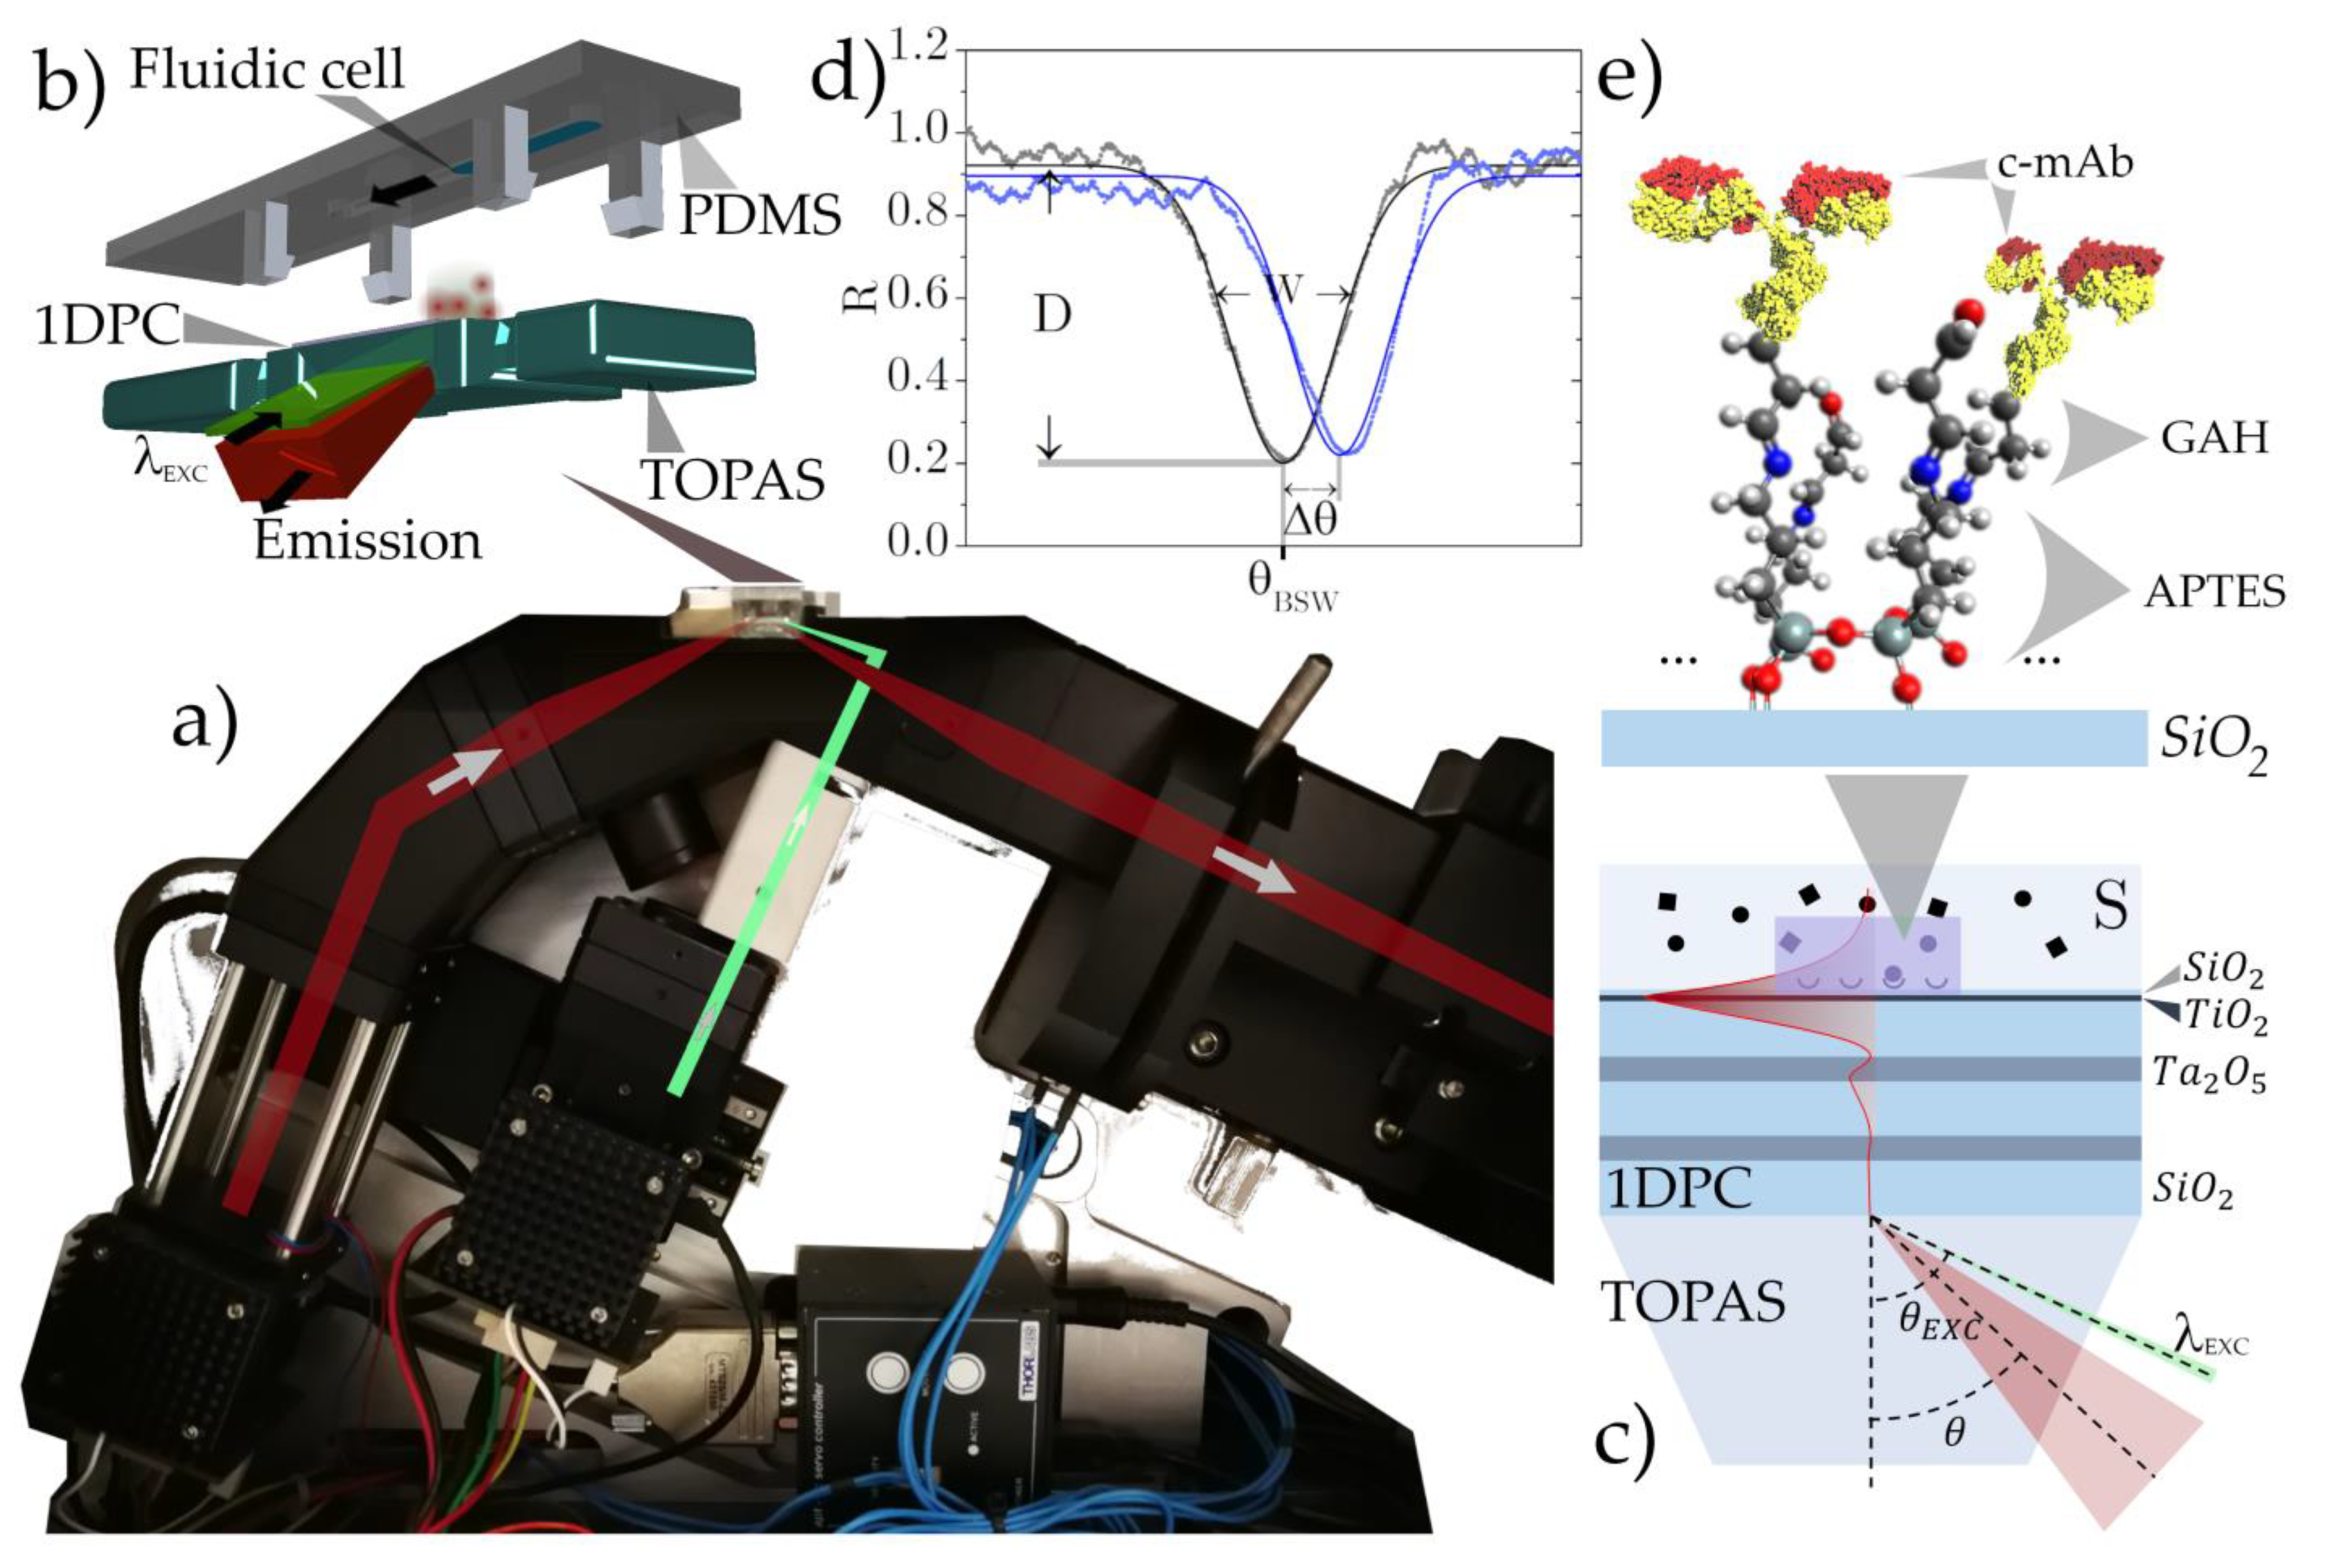
2.1. Optical Read-Out System and 1DPC Design

In Figure 1a, we show a picture of the custom-made optical read-out system system (optical components provided by Thorlabs, Inc., Newton, NJ, USA, and Edmund Optics, Inc., Mainz, D, Barrington, NJ, USA) used for our experiments. It is an integrated optical system developed to acquire and analyse the signal that emerges from a sensor based on 1DPC (or biochip in the following), which is customized to integrate both the optical and the fluidic components (Figure 1b). The 1DPC were deposited onto optical quality organic substrates (TOPAS, manufactured by KDS Radeberger GMBH, Großröhrsdorf, Germany) with a prism-shaped cross section that permits operating in the attenuated total internal reflection (TIR) configuration (Kretschmann-Raether, Figure 1c) [24,25]. The organic substrates are fabricated by injection moulding, and are designed to be complemented with a fluidic cell containing a 0.8 mm-wide and 100 µm-high channel. During the experiments, the biochip was kept at constant temperature ( T M = 30   ° C ) by means of a Peltier element.
The read-out system has been developed to work both in a label-free and a fluorescence operation mode by exploiting the peculiar properties of the BSWs excited on the top of the 1DPC. By using cylindrical optical systems for both modes, the laser beams are focused to a line along the longitudinal biochip axis [14,26], as schematically sketched in Figure 1b. The label-free mode exploits a transverse, electric, polarized laser beam at the wavelength λ LF = 670   nm to illuminate the biochip (in Figure 1a, the laser beam path is highlighted in red). In Figure 1d, we show an exemplary case of an angular reflectance profile when a BSW is properly excited, as witnessed by the presence of a resonant dip. Such a profile can be characterized by a minimum angular reflectance position ( θ B S W ), depth ( D ) and full-width half maximum ( W ). Thus, the label-free mode represents a convenient tool to detect real-time biorecognition events on top of the 1DPC surface. This latter task is performed by tracking the minimum reflectance position shift Δθ as a function of time.
The fluorescence operation mode exploits a different laser source ( λ EXC = 635   nm , the beam path is depicted in green in Figure 1a) to excite a BSW mode and resonantly excite fluorescent molecules which are close enough to the 1DPC surface [22,23,27]. The exciting beam is also transverse electric polarized, and is focused to a narrow strip.
The fluorescence is emitted according to the resonance condition of the optical surface states [22,28], and is therefore radiated into a narrow angular range through the TOPAS. It is detected by the same CCD camera (Apogee Ascent camera, Apogee Imaging Systems, Inc., Roseville, CA, USA) used to collect reflectance in the label-free mode. A dichroic beam splitter separates the label-free illumination beam and the fluorescence emission beam from the fluorescence excitation beam. For both operation modes, rows and columns of each image recorded by the CCD refer to the lateral position along the biochip midline and the spectral/angular information, respectively.
The 1DPC geometry and materials used here for the experiments result from a numerical simulation optimization (custom-made MatLab code), finalized at developing resolved BSW label-free and fluorescence biosensors [13,26,29]. The 1DPC biochips are designed to excite a BSW in the visible range in the presence of aqueous solutions ( n S = 1.328 at λ E X C ) [30]. As sketched in Figure 1c, the multilayer is composed by two periods and half of SiO2 (275 nm, n = 1.450 + i5 × 10−6 at λ E X C ) and Ta2O5 (120 nm, n = 2.095 + i5 × 10−5 at λ E X C ) terminated by topping layers of TiO2 (20 nm, n = 2.294 + i1.8 × 10−3 at λ E X C ) and SiO2 (20 nm). We highlighted the fact that the stack deposited can sustain BSW modes in both the transverse electric (TE) and transverse magnetic (TM) polarization at λLF and λFLUO. Moreover, the top layers play a crucial role in tuning the BSW resonance in the middle of the 1DPC photonic band gap [31], increasing the confinement at the 1DPC/external medium interface of the electric field associated with the surface mode [32]. Furthermore, the silica represents the most cost-effective choice for the terminal layer, by permitting the use of the well-known silane-based chemical surface functionalization, as shown in detail in the next section. The 1DPC deposition process is performed by plasma ion-assisted deposition technology (PIAD) technique under high-vacuum conditions (3 × 10⁻⁴ mbar, Leybold Optics APS904 coating system) [33]. The PIAD deposition technique allows for achieving a precision better than 1.5% for the thick layers (SiO2 and Ta2O5) and better than 1.5 nm for the thin layers (20 nm SiO2 and TiO2 top layers) [25]. In order to achieve low internal stress and absorption losses in the layers, a medium-level Argon ion assistance with ion energies of about 80 eV was applied.

2.2. Surface Bioconiugation of the 1DPC

The functionalization procedure consists of the modification of the chemical groups available at the outer surface of the biochips (see Figure 1e). After an initial cleaning process of the 1DPC surface with piranha solution (3:1 mixture of sulfuric acid and 30% hydrogen peroxide) for 10 min, the biochips are rinsed thoroughly with deionized (DI) water and dried under a stream of air. Such an initial step provides at the same time two benefits: it removes all organic contaminants from the surface, and it exposes hydroxyl groups for the next functionalization step. Then, the biochips are immersed in a 2% solution of APTES (3-aminopropyl) triethoxysilane in an ethanol/water (95:5 v/v) mixture at ambient temperature (AT) for 1 h. After removing from the APTES bath solution, the chips are sonicated and rinsed with pure ethanol. In order to stabilize the APTES film, a soft baking treatment on a hot plate at 110 °C for 1 h is performed. To make the silanized surface more reactive, the biochips are then immersed in a solution of 1% (v/v) glutaraldehyde (GAH) in 100 mM sodium bicarbonate buffer (pH 8.5) in the presence of 0.1 mM sodium cyanoborohydride for 1 h at AT. Further sonication and rinsing in DI water follows. The GAH-activated surface of the biochips is now ready to be conjugated with biological probes for biosensing purposes.
The assay format consists of a typical sandwich assay with the immobilization of a capture antibody, interaction with samples, and finally, with a biotinylated detection antibody. The bioconjugation step for antibody immobilization is performed in static conditions and consists of two steps: immobilization of the capture antibody and passivation of the surface (Figure 1e). In this work, a solution of 2 µg/mL of the capture monoclonal antibody (c-mAb) mouse anti-human IL10 (DuoSet ELISA DY217B-05, R&D) dissolved in PBS is poured on the 1DPC surface and allowed to react with the GAH-activated surface for 1 h at AT. After such an immobilization step, the biochip is rinsed with PBS and subsequently covered (overnight at +4°C) with a bovine serum albumin (BSA, 10% v/v) solution to passivate the sensitive region and reduce nonspecific interactions with the sample. The biochips are then thoroughly washed and are ready to be used for the bioassays.

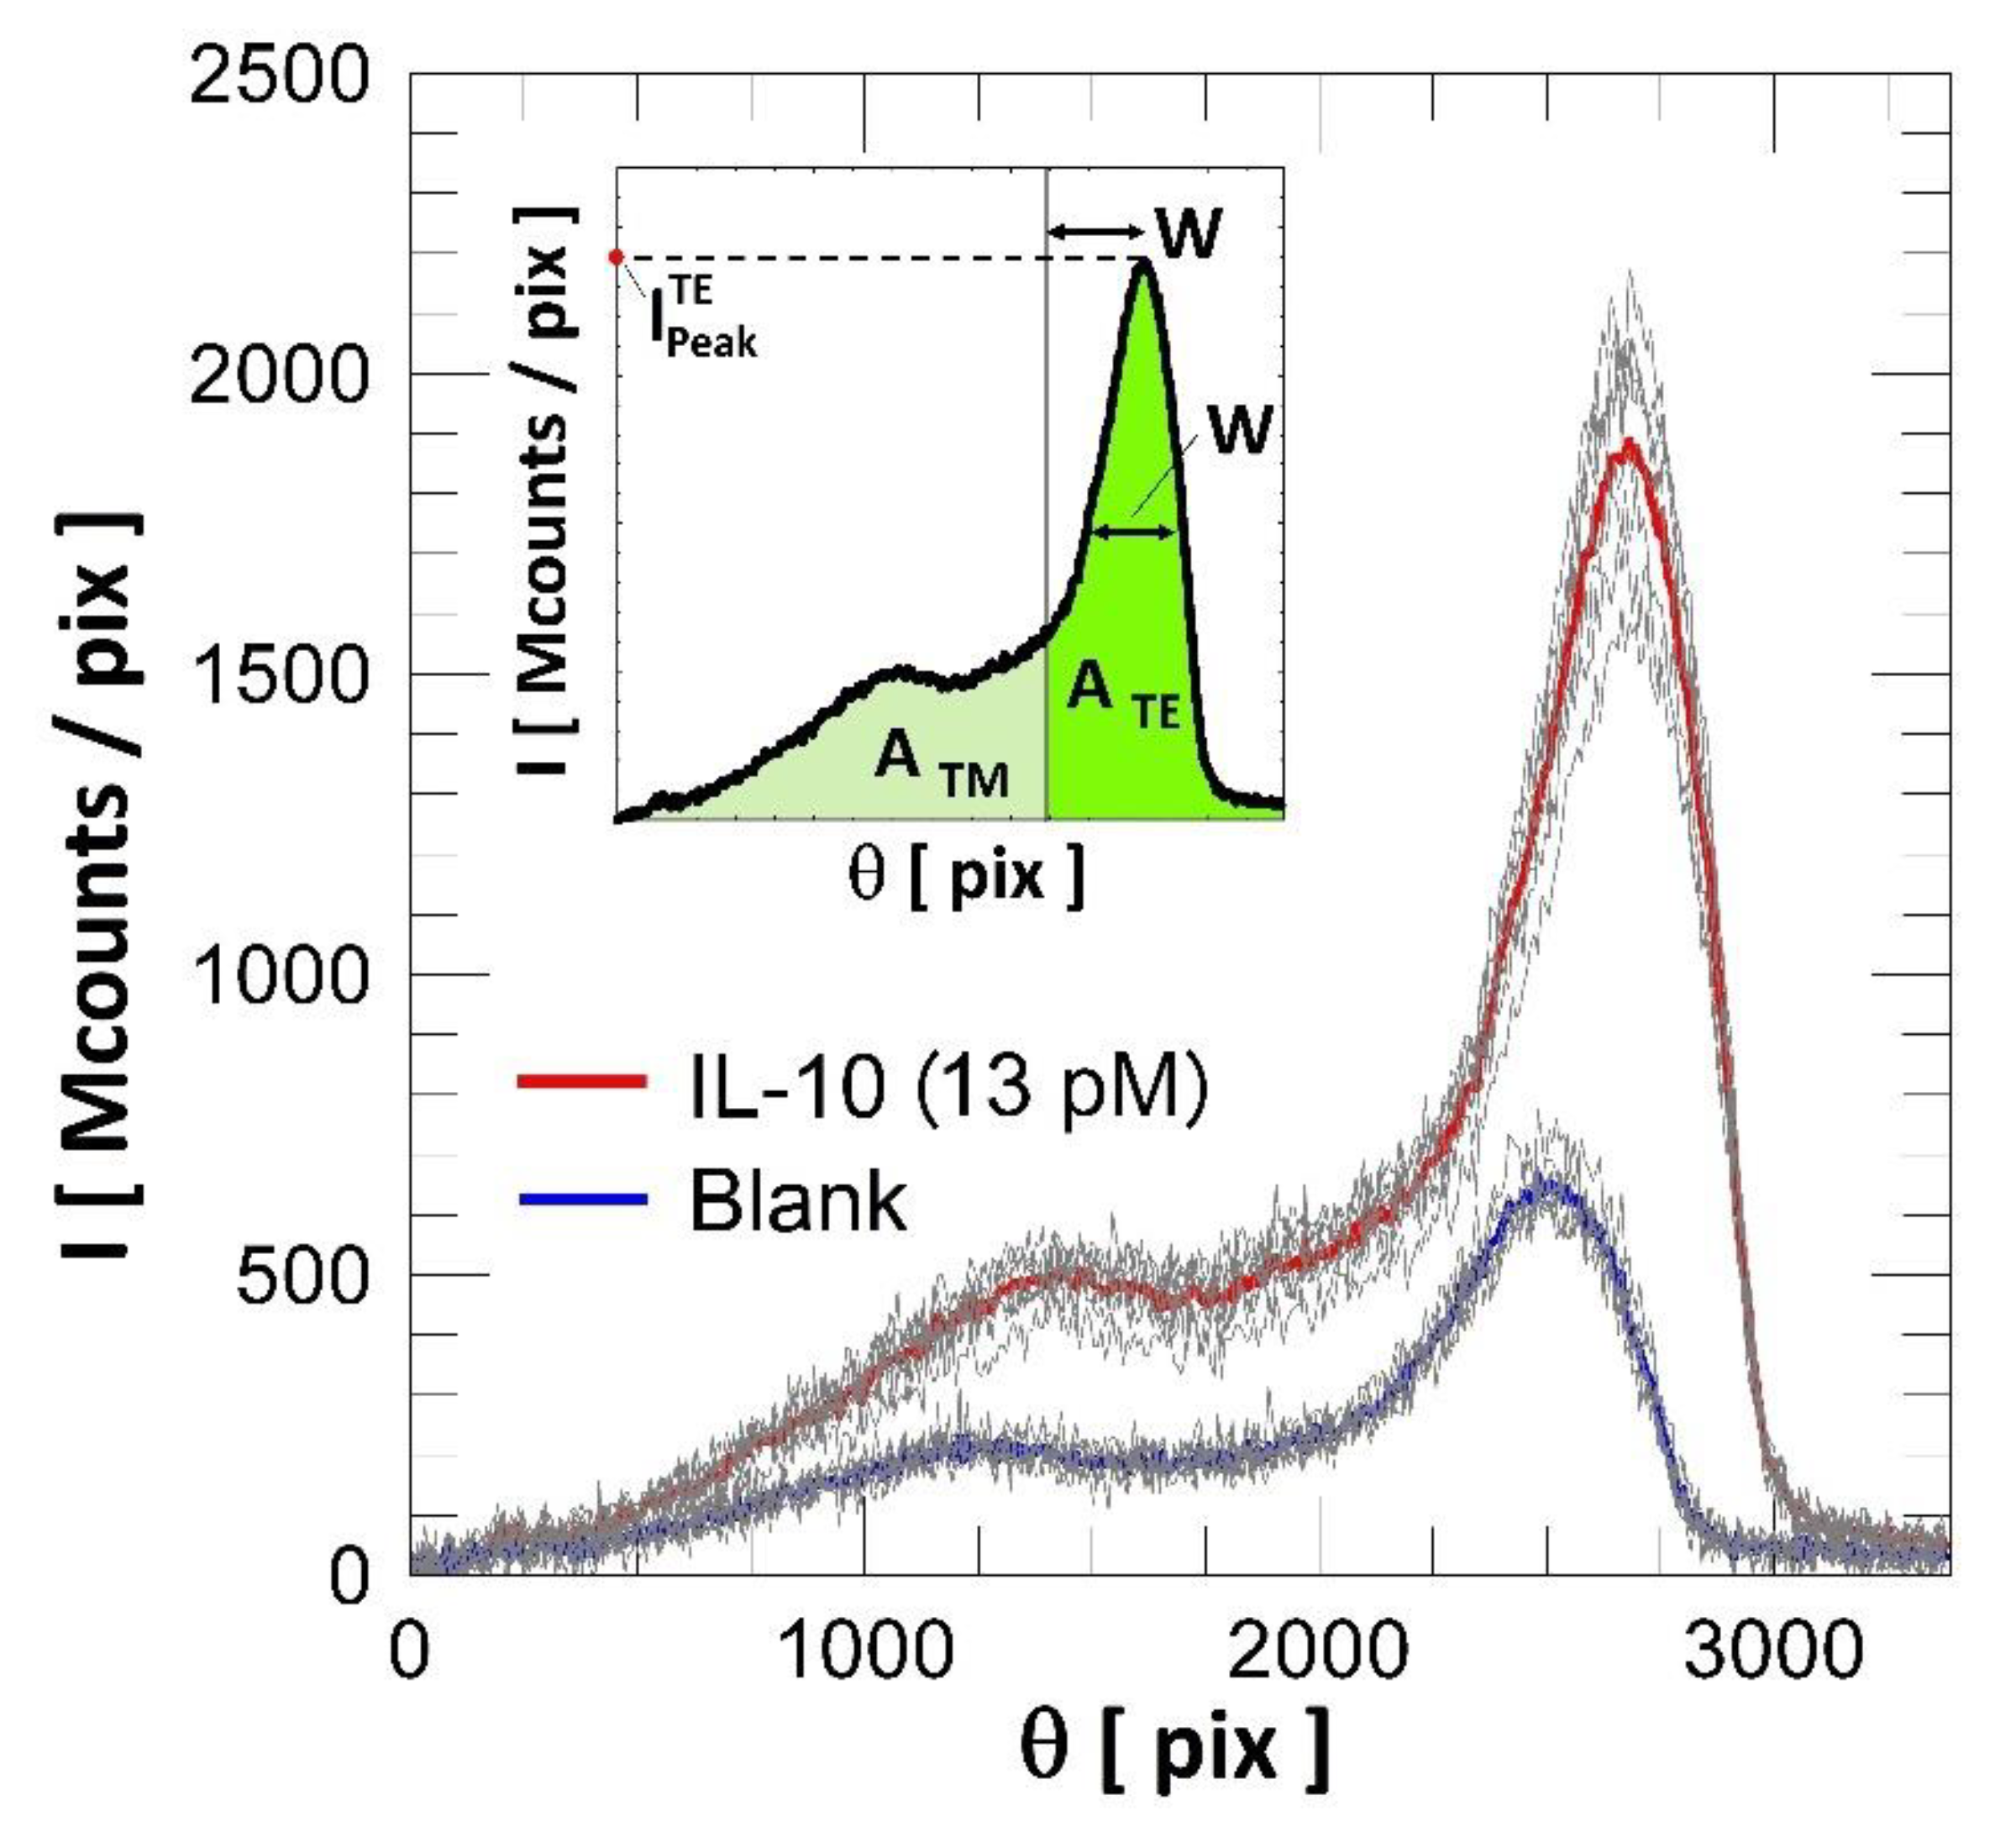
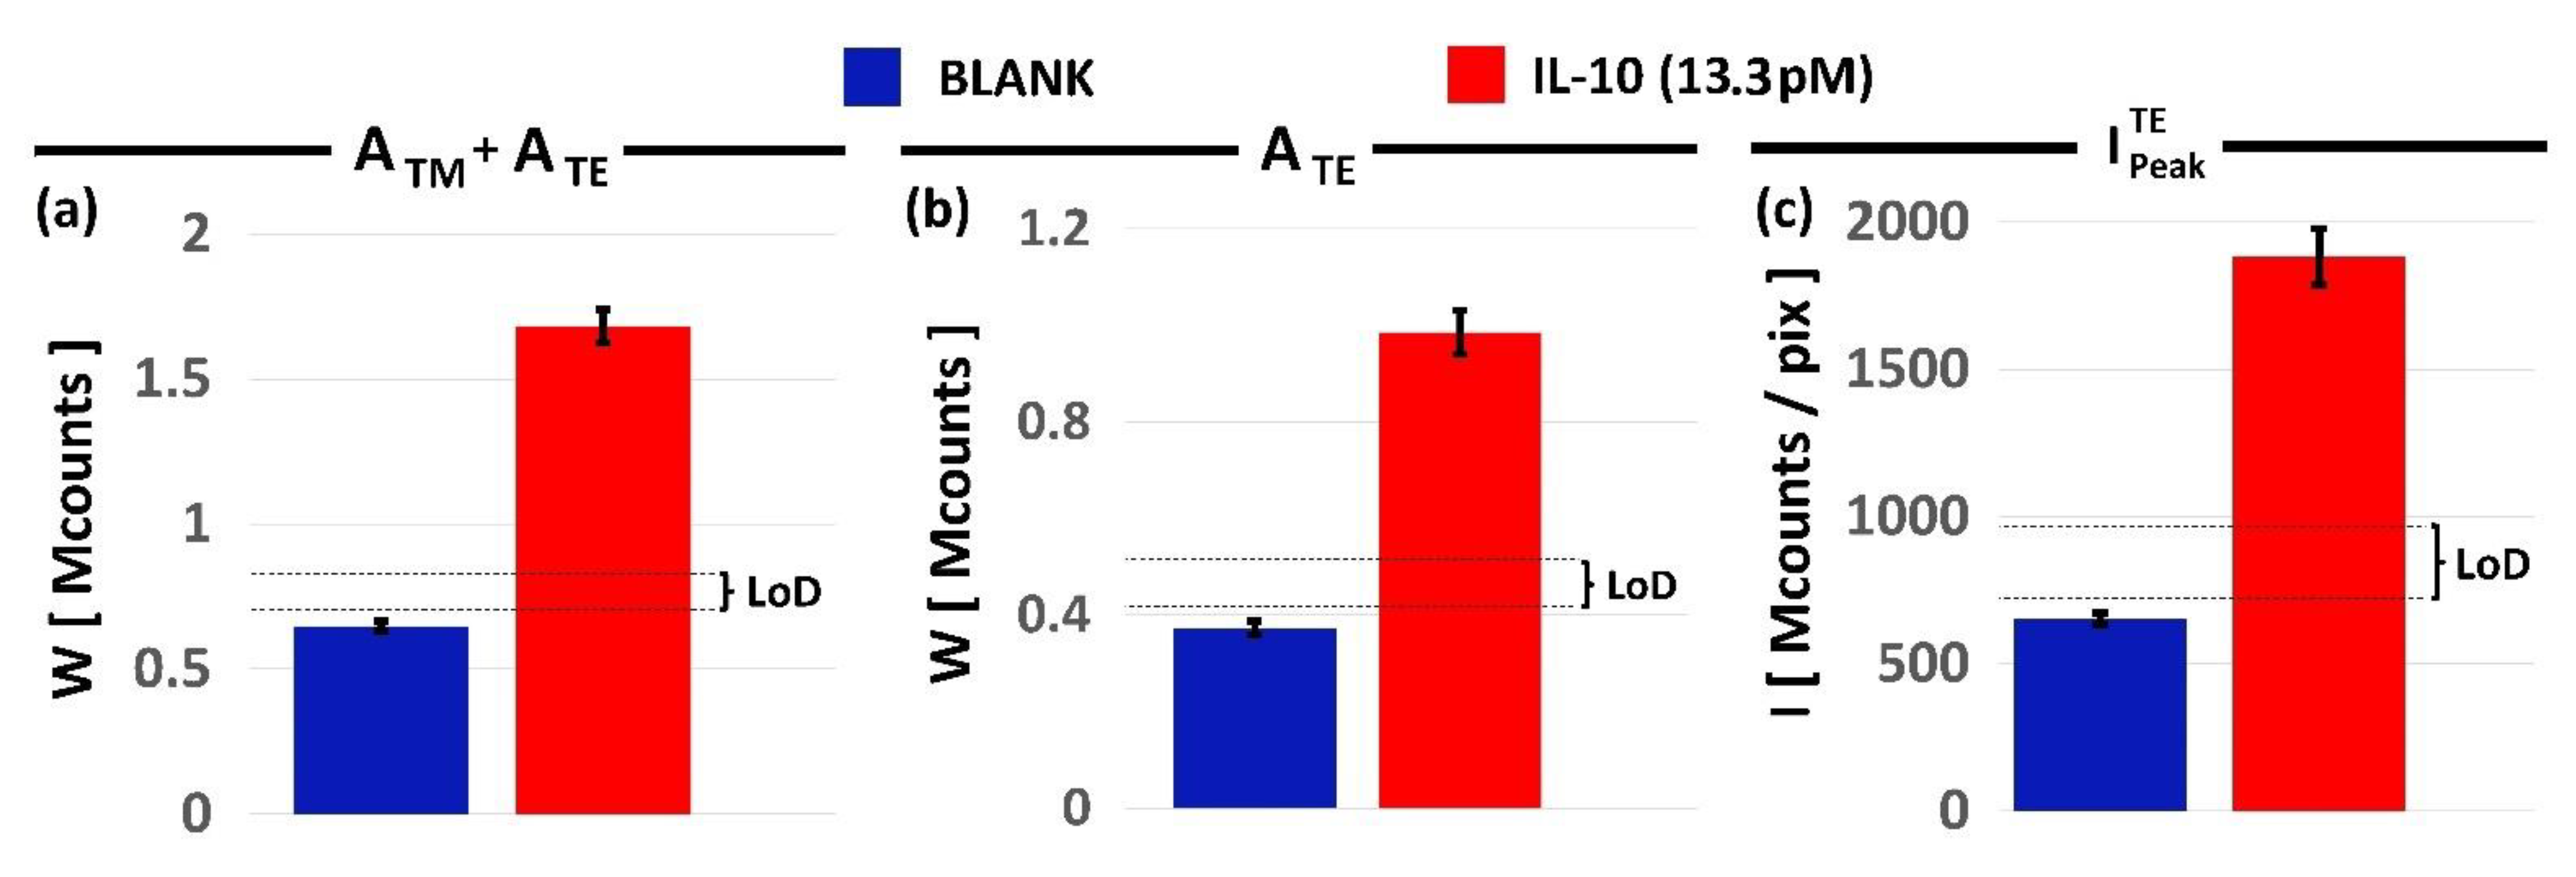
3. Results and Discussions

In the following section, we report the experimental results obtained in a IL-10 (recombinant human IL-10 standard from DuoSet ELISA DY217B-05, R&D) recognition assay. We used a solution of 250 pg/mL (13.3 pM) IL-10 dissolved in a reagent diluent (RD, 1% BSA in PBS).
Once ready for bioassay, a biochip is complemented with its microfluidic counterpart and is inserted into the optical read-out system. The recognition assay started with the injection of the IL-10 sample at a flow rate of 1.3 µL/s. The same flow rate was used in the following assay steps, if not differently specified. The interaction of the IL-10 sample with the anti-human IL-10 lasted 30 minutes, while recirculating the solution to avoid depletion of molecules at the surface. This step was followed by a washing procedure with a washing buffer (WB, 0.05% Tween20 in PBS, pH 7.2–7.4). The sandwich assay was then completed by injecting a solution of a biotinylated goat anti-human IL-10 detection antibody (DuoSet ELISA DY217B-05, R&D) with a concentration of 75 ng/mL in RD. Additionally, for this step, the contact time was 30 min, and the washing procedure was performed with the WB.
The label-free operation mode usually enables one to follow the angular resonance shift in real-time, which is caused by the refractive index changes at the surface of the biochips during the specific (or not) molecular interactions. Thus, a real-time sensogram (not reported here) can be plotted as a function of time, providing information on the evolution of the IL-10 recognition assay. In the present case, where the IL-10 concentration is in the range 0–250 pg/mL, the label-free sensograms did not show any significant changes because the optical read-out system operates below its label-free limit of detection. To exploit the lower limit of detection provided when operating in fluorescence mode [13,14], we added a fluorescent feature to the sandwich IL-10 assay. This was performed by injecting into the biochip a solution of neutravidin conjugated to DyLight 650 (ThermoFisher, PN: 84607). Since neutravidin shows a very high avidity for the biotin, which is present on the detection antibodies, it will bind preferentially in the region were the sandwich assay was completed. In the present case, we used a solution of 1 µg/mL of Neutravidin DyLight 650 and allowed it to react with the biochip for 15 min, followed by a final washing step in WB.
At the end of the incubation of the neutravidin solution and after washing with WB, the enhanced fluorescence signal is collected from the chip side and recorded by the CCD camera. Such a signal appears as a replica of the (angularly dispersed) dye spectrum decoupled by means of TE and TM surface modes of the 1DPC. In order to quantitatively evaluate the amount of fluorescence, we acquired a fluorescence background prior to the injection of the fluorescent neutravidin solution and subtracted it from the fluorescence signal. The results obtained for the IL-10 sample at 250 pg/mL (13.3 pM, from ELISA working range) are then compared to those obtained for the blank sample, constituted by the RD. In Figure 2, we show the background subtracted averaged fluorescence spectra for the IL-10 sample (red) and the blank (blue). The curves are the average over eight spots, each about 140 µm wide (grey spectra in Figure 2), from the biochip’s central region (in total approximately 1.12 mm wide). This result clearly demonstrates that the BSW-based assay can detect an IL-10 concentration of 13.3 pM and discriminate it from the blank.

4. Discussion

The parameters, which can be determined for a fluorescent molecule or system, are the fluorescence intensity, the fluorescence spectrum (excitation and emission), the fluorescence lifetime and the fluorescence polarization [6,27,34]. Consequently, it is difficult to find a unique method to evaluate the LoD of fluorescence-based techniques [34]. The BSW-based sensors provide a fluorescence signal with all the characteristics listed above, therefore this analysis section aims to compare the different methods to estimate the LoD and to understand how and to what extent they can influence the determination of the LoD itself.
Such parameters are depicted in the inset of Figure 2, and are defined as follows: the whole spectrum integrated area (ATM + ATE), the area subtended by the TE-polarized spectrum (ATE) and its peak intensity ( I P e a k T E ). In details, ATE is defined as the area under the acquired spectrum in the angular range θ ( I P e a k T E ) ± W (dark-green area in the inset of Figure 2), where W and θ ( I P e a k T E ) are the full-width half maximum (W) and the center position of the TE part of the spectrum, respectively. This implicitly defines the residual area related to TM (ATM, light green in the inset of Figure 2) and the total integrated area ATM + ATE. The parameters θ ( I P e a k T E ) and W are evaluated by fitting the experimental curves by means of a Lorentzian function-based model.
By taking into account the standard deviation of the mean of the emitted fluorescence intensities measured for the eight spots and their subtended areas, we defined a minimum and a maximum LoD as the mean value of the blank, adding three-times σB and σS in a way to define a range of variation for the LoD. In Figure 3, we plotted the three histograms related to the ATM + ATE, ATE and I P e a k T E cases with their LoD ranges of variation for the blank (blue bars) and IL-10 (13.3 pM) sample (red bars).
Moreover, as reported in Table 1, we calculated the coefficient of variation for each LoD estimated from different experimental parameters. The LoD estimated from I P e a k T E parameter provides the best performance, reaching an LoD of 110 pg/mL (5.8 pM) of IL-10 with respect of the LoDs obtained from the ATM + ATE and ATE. Nevertheless, the accuracy of such an LoD is lower (CV ≅ 14%) than what obtained with the LoD from ATM + ATE (CV ≅ 8%). This demonstrates that even if we can guarantee a better LoD with the I P e a k T E case, the accuracy is lower with respect to ATE and ATM + ATE cases.
Firstly, all the estimated LoDs are comparable in the limit of their errors, thus the most accurate in LoD estimation is the ATM + ATE case. Secondly, the range of LoDs obtained with the presented technique is compatible with the assay range and resolution (1.6 pM) of commercial gold-standard ELISA kits [10]. It must be noted that the concentrations used in the protocols are the same as those used in the ELISA test (DuoSet ELISA DY217B-05, R&D), with the exception of the Neutravidin DyLight 650 solution used to adapt the ELISA protocol to our platform. Furthermore, in this work, we dramatically reduced the duration time of the assay (from about 280 minutes for the ELISA kit to our 90 minutes, from analyte to horseradish peroxidase conjugated with streptavidin) and avoided any kind of enzymatic amplification.
For the sake of comparison with respect to novel photonic devices, it is worth noticing that our LoD is in line of that obtained with photonic Lab-on-a-Chip (5 pM) and with nanopatterned photonic crystals (0.12 pM) for interleukin-2 [9] and tumor necrosis factor [8] detection, respectively. In addition, our approach presents a reduced assay duration with respect to nanopatterned photonic crystals (more than 280 minutes). Moreover, the LoD obtained from our analysis is in good agreement with the concentrations reported in literature for IL-10 detection in COVID-19 patients [3,4], making the presented technique a viable solution for rapid and accurate screening of COVID-19-related molecules.
Such experimental results confirm the enormous potential of this technique for the detection of cytokines in biological samples, and open up the possibility of multiplexed and real-time investigations of several different cytokines using a single biochip. In this regard, the use of our biochips in the detection of inflammatory biomarkers can be helpful in prognostics, as well as in the health management of COVID-19 patients.

Author Contributions

Conceptualization, A.S.; software, A.O. and N.D.; biological reagents, P.D.P.; writing—original draft preparation, figure preparation, data analysis and investigation, A.S. and A.O.; writing—review and editing, A.S., A.O., P.D.P., N.D., P.M. and F.M.; 1DPC design and fabrication, N.D. and P.M.; supervision and funding acquisition, F.M. and A.S. All authors have read and agreed to the published version of the manuscript.

Funding

This research was funded by Regione Lazio through the two projects with grant number A0375-202036528 and G18143.

Institutional Review Board Statement

Not applicable.

Informed Consent Statement

Not applicable.

Data Availability Statement

Not applicable.

Conflicts of Interest

The authors declare no conflict of interest.

References

  1. Zhao, S.; Wu, D.; Wu, P.; Wang, Z.; Huang, J. Serum IL-10 Predicts Worse Outcome in Cancer Patients: A Meta-Analysis. PLoS ONE 2015, 10, e0139598. [Google Scholar] [CrossRef] [PubMed] [Green Version]
  2. Islam, H.; Chamberlain, T.C.; Mui, A.L.; Little, J.P. Elevated Interleukin-10 Levels in COVID-19: Potentiation of Pro-Inflammatory Responses or Impaired Anti-Inflammatory Action? Front. Immunol. 2021, 12, 677008. [Google Scholar] [CrossRef]
  3. Lu, L.; Zhang, H.; Dauphars, D.J.; He, Y.-W. A Potential Role of Interleukin 10 in COVID-19 Pathogenesis. Trends Immunol. 2021, 42, 3–5. [Google Scholar] [CrossRef] [PubMed]
  4. Han, H.; Ma, Q.; Li, C.; Liu, R.; Zhao, L.; Wang, W.; Zhang, P.; Liu, X.; Gao, G.; Liu, F.; et al. Profiling serum cytokines in COVID-19 patients reveals IL-6 and IL-10 are disease severity predictors. Emerg. Microbes Infect. 2020, 9, 1123–1130. [Google Scholar] [CrossRef] [PubMed]
  5. Zhao, Y.; Qin, L.; Zhang, P.; Li, K.; Liang, L.; Sun, J.; Xu, B.; Dai, Y.; Li, X.; Zhang, C.; et al. Longitudinal COVID-19 profiling associates IL-1RA and IL-10 with disease severity and RANTES with mild disease. JCI Insight 2020, 5, 139834. [Google Scholar] [CrossRef]
  6. Lakowicz, J.R. Principles of Fluorescence Spectroscopy, 3rd ed.; Springer Science & Business Media: New York, NY, USA, 2013; ISBN 978-1-4757-3061-6. [Google Scholar]
  7. Gao, B.; Liu, H.; Gu, Z. Patterned Photonic Nitrocellulose for Pseudo-Paper Microfluidics. Anal. Chem. 2016, 88, 5424–5429. [Google Scholar] [CrossRef]
  8. Mathias, P.; Ganesh, N.; Cunningham, B.T. Application of Photonic Crystal Enhanced Fluorescence to a Cytokine Immunoassay. Anal. Chem. 2008, 80, 9013–9020. [Google Scholar] [CrossRef] [PubMed]
  9. Usuba, R.; Yokokawa, M.; Ackermann, T.N.; Llobera, A.; Fukunaga, K.; Murata, S.; Ohkohchi, N.; Suzuki, H. Photonic Lab-on-a-Chip for Rapid Cytokine Detection. ACS Sens. 2016, 1, 979–986. [Google Scholar] [CrossRef]
  10. Available online: www.rndsystems.com/products/human-il-10-quantikine-elisa-kit_d1000b (accessed on 1 December 2021).
  11. Badugu, R.; Nowaczyk, K.; Descrovi, E.; Lakowicz, J.R. Radiative decay engineering 6: Fluorescence on one-dimensional photonic crystals. Anal. Biochem. 2013, 442, 83–96. [Google Scholar] [CrossRef] [Green Version]
  12. Mathias, P.C.; Ganesh, N.; Chan, L.L.; Cunningham, B.T. Combined enhanced fluorescence and label-free biomolecular detection with a photonic crystal surface. Appl. Opt. 2007, 46, 2351–2360. [Google Scholar] [CrossRef]
  13. Rizzo, R.; Alvaro, M.; Danz, N.; Napione, L.; Descrovi, E.; Schmieder, S.; Sinibaldi, A.; Rana, S.; Chandrawati, R.; Munzert, P.; et al. Bloch surface wave enhanced biosensor for the direct detection of Angiopoietin-2 tumor biomarker in human plasma. Biomed. Opt. Express 2018, 9, 529–542. [Google Scholar] [CrossRef] [PubMed] [Green Version]
  14. Rizzo, R.; Alvaro, M.; Danz, N.; Napione, L.; Descrovi, E.; Schmieder, S.; Sinibaldi, A.; Chandrawati, R.; Rana, S.; Munzert, P.; et al. Bloch surface wave label-free and fluorescence platform for the detection of VEGF biomarker in biological matrices. Sens. Actuators B Chem. 2018, 255, 2143–2150. [Google Scholar] [CrossRef] [Green Version]
  15. Sinibaldi, A.; Fieramosca, A.; Rizzo, R.; Anopchenko, A.; Danz, N.; Munzert, P.; Magistris, C.; Barolo, C.; Michelotti, F. Combining label-free and fluorescence operation of Bloch surface wave optical sensors. Opt. Lett. 2014, 39, 2947–2950. [Google Scholar] [CrossRef]
  16. Toma, K.; Descrovi, E.; Toma, M.; Ballarini, M.; Mandracci, P.; Giorgis, F.; Mateescu, A.; Jonas, U.; Knoll, W.; Dostálek, J. Bloch surface wave-enhanced fluorescence biosensor. Biosens. Bioelectron. 2013, 43, 108–114. [Google Scholar] [CrossRef] [PubMed]
  17. Lakowicz, J.R. Plasmonics in Biology and Plasmon-Controlled Fluorescence. Plasmonics 2006, 1, 5–33. [Google Scholar] [CrossRef] [PubMed]
  18. Toma, K.; Vala, M.; Adam, P.; Homola, J.; Knoll, W.; Dostálek, J. Compact surface plasmon-enhanced fluorescence biochip. Opt. Express 2013, 21, 10121–10132. [Google Scholar] [CrossRef]
  19. Reiner, A.T.; Fossati, S.; Dostalek, J. Chemical Biosensor platform for parallel surface plasmon-enhanced epifluorescence and surface plasmon resonance detection. Sens. Actuators B Chem. 2018, 257, 594–601. [Google Scholar] [CrossRef]
  20. Danz, N.; Occhicone, A.; Pflumm, C.; Munzert, P.; Michelotti, F.; Michaelis, D. Spectral analysis of organic LED emitters’ orientation in thin layers by resonant emission on dielectric stacks. Opt. Express 2021, 29, 6608–6619. [Google Scholar] [CrossRef]
  21. Drexhage, K. Influence of a dielectric interface on fluorescence decay time. J. Lumin. 1970, 1–2, 693–701. [Google Scholar] [CrossRef]
  22. Michelotti, F.; Sepe, E. Anisotropic Fluorescence Emission and Photobleaching at the Surface of One-Dimensional Photonic Crystals Sustaining Bloch Surface Waves. I. Theory. J. Phys. Chem. C 2019, 123, 21167–21175. [Google Scholar] [CrossRef]
  23. Sinibaldi, A.; Fieramosca, A.; Danz, N.; Munzert, P.; Occhicone, A.; Barolo, C.; Michelotti, F. Effects of Reabsorption due to Surface Concentration in Highly Resonant Photonic Crystal Fluorescence Biosensors. J. Phys. Chem. C 2018, 122, 26281–26287. [Google Scholar] [CrossRef]
  24. Kretschmann, E.; Raether, H. Radiative Decay of Non Radiative Surface Plasmons Excited by Light. Z. fur Nat. Sect. A J. Phys. Sci. 1968, 23, 2135–2136. [Google Scholar] [CrossRef]
  25. Munzert, P.; Danz, N.; Sinibaldi, A.; Michelotti, F. Surface & Coatings Technology Multilayer coatings for Bloch surface wave optical biosensors. Surf. Coat. Technol. 2017, 314, 79–84. [Google Scholar]
  26. Sinibaldi, A.; Rizzo, R.; Figliozzi, G.; Descrovi, E.; Danz, N.; Munzert, P.; Anopchenko, A.; Michelotti, F. A full ellipsometric approach to optical sensing with Bloch surface waves on photonic crystals. Opt. Express 2013, 21, 23331–23344. [Google Scholar] [CrossRef]
  27. Sepe, E.; Sinibaldi, A.; Danz, N.; Munzert, P.; Michelotti, F. Anisotropic Fluorescence Emission and Photobleaching at the Surface of One-Dimensional Photonic Crystals Sustaining Bloch Surface Waves. II. Experiments. J. Phys. Chem. C 2019, 123, 21176–21184. [Google Scholar] [CrossRef]
  28. Yeh, P.; Yariv, A.; Hong, C.S. Electromagnetic propagation in periodic stratified media. I. General theory. J. Opt. Soc. Am. 1977, 67, 423–438. [Google Scholar] [CrossRef] [Green Version]
  29. Rizzo, R.; Danz, N.; Michelotti, F.; Maillart, E.; Anopchenko, A.; Wächter, C. Optimization of angularly resolved Bloch surface wave biosensors. Opt. Express 2014, 22, 23202–23214. [Google Scholar] [CrossRef]
  30. Michelotti, F.; Rizzo, R.; Sinibaldi, A.; Munzert, P.; Wächter, C.; Danz, N. Design rules for combined label-free and fluorescence Bloch surface wave biosensors. Opt. Lett. 2017, 42, 2798–2801. [Google Scholar] [CrossRef]
  31. Johnson, S.G.; Joannopoulos, J.D. Block-iterative frequency-domain methods for Maxwell’s equations in a plane wave basis. Opt. Express 2001, 8, 173–190. [Google Scholar] [CrossRef] [Green Version]
  32. Joannopoulos, J.D.; Johnson, S.G.; Winn, J.N.; Meade, R.D. Photonic Crystals: Molding the Flow of Light; Princeton University Press: Princeton, NJ, USA, 2008. [Google Scholar]
  33. Mahan, J.E. Physical Vapor Deposition of Thin Films; Wiley: New York, NY, USA, 2000. [Google Scholar]
  34. Hofstraat, J.W. Polymer Characterization by Fluorescence Spectroscopy. In Applied Polymer Science: 21st Century; Elsevier Science: Amsterdam, The Netherlands, 2000; pp. 829–850. [Google Scholar]
Figure 1. (a) Picture of the optical read-out system. The optical path of the illumination beams for the label-free and fluorescence modes are drawn in red and green, respectively. (b) Sketch of the biochip, the TOPAS substrate is topped with the 1DPC and the fluidic cell in PDMS. (c) Sketch of the Kretschmann–Raether configuration and of the 1DPC design, with the fluorescence excitation beam in green and the fluorescence collection cone in red. The field intensity associated with the BSW is shown in red, with the exponential tail penetrating in the external medium (S). (d) Exemplary case of an experimental reflectance profile of a 1DPC when a BSW is excited in TE polarization. (e) Sketch of the biosensitive 1DPC top surface (SiO2) (molecules not to scale).
Crystals 11 01517 g001
Figure 2. Background subtracted average fluorescence spectra for a blank (blue curve) and an IL-10 (red curve) sample. The curves were obtained by averaging eight spots from central regions of different biochips exposed to such solutions.
Crystals 11 01517 g002
Figure 3. Histograms of fluorescence integrated and intensity fluorescence for the blank (blue bars) and IL-10 (13.3 pM) (red bars) related to the analysis of three parameters: (a) ATM + ATE; (b) ATE; (c) I P e a k T E . The dashed lines define, for the three cases, the estimated LoD ranges.
Crystals 11 01517 g003
Table 1. LoDs and coefficients of variation for the three analyses represented in Figure 3.
LoD [pg/mL]LoD [pM]CVLoD [%]
ATM + ATE113 ± 96.0 ± 0.58.3
ATE118 ± 126.25 ± 0.6510.4
I P e a k T E 110 ± 155.8 ± 0.813.8
Publisher’s Note: MDPI stays neutral with regard to jurisdictional claims in published maps and institutional affiliations.

