Article

Reactive Crystallization Kinetics of K2SO4 from Picromerite-Based MgSO4 and KCl

1
Carrera de Química, Facultad de Ciencias Puras, Universidad Autónoma Tomás Frías, Potosí 53820, Bolivia
2
Departamento de Ingeniería Química y Procesos de Minerales, Facultad de Ingeniería, Universidad de Antofagasta, Av. Angamos 601, Antofagasta 1270300, Chile
3
Centro de Economía Circular en Procesos Industriales (CECPI), Facultad de Ingeniería, Universidad de Antofagasta, Av. Angamos 601, Antofagasta 1270300, Chile
4
Max Planck Institute for Dynamics of Complex Technical Systems, 39106 Magdeburg, Germany
*
Author to whom correspondence should be addressed.
Crystals 2021, 11(12), 1558; https://doi.org/10.3390/cryst11121558
Submission received: 31 October 2021 / Revised: 5 December 2021 / Accepted: 8 December 2021 / Published: 14 December 2021
(This article belongs to the Special Issue Recent Progress in Industrial Crystallization)

Abstract

:
In this work, the kinetic parameters, the degrees of initial supersaturation (S0) and the profiles of supersaturation (S) were determined for the reactive crystallization of K2SO4 from picromerite (K2SO4.MgSO4.6H2O) and KCl. Different reaction temperatures between 5 and 45 °C were considered, and several process analytical techniques were applied. Along with the solution temperature, the crystal chord length distribution (CLD) was continuously followed by an FBRM probe, images of nucleation and growth events as well as the crystal morphology were captured, and the absorbance of the solution was measured via ATR-FTIR spectroscopy. In addition, the ion concentrations were analyzed. It was found that S0 is inversely proportional to the reactive crystallization temperature in the K+, Mg2+/Cl, SO42−//H2O system at 25 °C, where S0 promotes nucleation and crystal growth of K2SO4 leading to a bimodal CLD. The CLD was converted to square-weighted chord lengths for each S0 to determine the secondary nucleation rate (B), crystal growth rate (G), and suspension density (MT). By correlation, from primary nucleation rate (Bb) and G with S0, the empirical parameters b = 3.61 and g = 4.61 were obtained as the order of primary nucleation and growth, respectively. B versus G and MT were correlated to the reaction temperature providing the rate constants of B and respective activation energy, E = 69.83 kJ∙mol−1. Finally, a general Equation was derived that describes B with parameters KR = 13,810.8, i = 0.75 and j = 0.71. The K2SO4 crystals produced were of high purity, containing maximal 0.51 wt% Mg impurity, and were received with ~73% yield at 5 °C.

1. Introduction

Potassium is one of the three types of macronutrients [1]. Its natural sources are mineral salt deposits containing KCl in sylvinite or K2SO4 in kainite or picromerite and natural brines from salt flats such as Atacama-Chile [2,3] and Uyuni-Bolivia [4]. There are several known and traditional methods to produce K2SO4 as, for example, the reaction of KCl with sulphate containing compounds such as H2SO4 [5], Phosphogypsum in an NH4OH and isopropanol medium [6], Na2SO4 [7,8], and (NH4)2SO4 [9], or from seawater [10] and leonite or langbeinite minerals to produce intermediate picromerite by hydration and final transformation to K2SO4 [11].
Producing K2SO4 from MgSO4 and KCl by reactive crystallization in an aqueous solution involves the formation of picromerite and K2SO4, using the Jänecke projection that describes the reactions via the phase diagram of the reciprocal quaternary system K+, Mg2+/Cl, SO42−//H2O at 25 °C [12]. The latter also allows estimating the proportions of reactants and products. Jannet et al. [12], Voigt [13], Fezei et al. [14], and Goncharik et al. [15] depict the reactive crystallization process based on the underlying phase equilibria in two stages: first, the formation of picromerite and second, the generation of K2SO4. The work mentioned above on the conversion processes and the K2SO4 yield improvement in a batch crystallizer do not explicitly consider the reactive crystallization kinetics of K2SO4.
Crystallization is the first and most crucial step to produce, purify, and isolate high purity products in batch and continuous processes, and batch crystallization is one of the unit operations widely used in the chemical, pharmaceutical, and food industries [16,17]. However, batch crystallization has disadvantages associated with its control and, in particular batch-to-batch variability, expressed in terms of product purity, crystal morphology, mean particle size, crystal size distribution (CSD), bulk density, filterability, and flow properties of the dry solids that depend on the profile of supersaturation achieved during the crystallization, drying, packaging, and transport process [18,19,20].
Therefore, to design the operating conditions with optimal control of a crystallizer, the crystallization kinetics must first experimentally be determined based on the population density [17]. This requires the collection of CSD data that directly relate the nucleation and crystal growth events occurring simultaneously. Furthermore, new crystals can result from two different nucleation mechanisms, classified as primary and secondary nucleation or a combination of both [18].
Nemdili et al. [21], Bari et al. [22], and Luo et al. [23] measured the metastable zone width (MSZW) of a K2SO4-water solution by means of a turbidimeter and an ultrasonic probe and used an ultrasonic and Focused Beam Reflectance Measurement (FBRM) probe, respectively, to determine mainly the primary nucleation parameters. Bari and Pandit [24] simulated the order and the primary and secondary nucleation constants of K2SO4 using the gPROMS program and data from MSZW. Luo et al. [23] concluded that the MSZW of the potassium sulfate solution increases with the increasing concentration of aluminium and silicon ions as impurities because they suppress nucleation and block the active sites of K2SO4 crystals. They reported a nucleation activation energy of 33.99 kJ·mol−1.
In relation to the K2SO4 growth kinetics, Nemdili et al. [21] determined the de-supersaturation curve of a K2SO4-H2O solution when cooling from 40 to 27 °C and using a seed size of 250–355 μm. They derived the order of growth and concluded that growth occurs via the spiral growth mechanism. Gougazeh et al. [25] investigated the growth kinetics of a K2SO4 single crystal under a microscope analyzing the obtained images. They concluded that the order of growth is not affected by temperature, and the single crystal growth is governed by the spiral growth mechanism. They specified the activation energy of growth as 39.4 kJ·mol−1 and claimed that the presence of 5 ppm Cr3+ blocks the active growth sites of K2SO4. Kubota et al. [26] confirmed this mechanism leading to suppressed growth. Mullin and Gaska [27] determined the growth kinetics of a K2SO4 single crystal in two selected directions, width (001) and length (100), finding that the linear growth rate is greater for axis 001 and minor for axis 100, due to flow effects of the supersaturated aqueous solution circulating through the cell. Furthermore, they reported that crystal growth of K2SO4 under the conditions used is diffusion-controlled.
Secondary nucleation occurs in the presence of “father” crystals and their interaction with themselves, the crystallizer walls, and the agitator. It results from seeding, presence of dendrites, breakage, and fluid shear forces according to mechanical, hydrodynamic, and supersaturation forces. In industry, secondary nucleation is the mechanism that governs the crystallization of soluble substances from a singular solute solution (e.g., salt-water) [28].
Chianese et al. [29] studied the effect of secondary nucleation on CSD for the K2SO4-H2O system in a seeded batch crystallizer. They found that the generation of fragments depends on suspension density and supersaturation. They incorporated the effects of secondary nucleation due to attrition in their model and established that the model does not predict the experimental behaviour at all. Mohamed et al. [30] simultaneously determined the kinetic parameters of secondary nucleation and growth of K2SO4 in its aqueous solution with seeding based on the population density data. They performed the population balance and solved the population equilibrium Equation using the “s” plane analysis method. They correlated the magma density (MT), growth rate (G), solution circulation rate (Q), and absolute temperature (T). They reported the relative parameters of secondary nucleation rate (B) according to the model B = KRGiMTjQkexp(-E⁄RT) with values of relative kinetic order, i = 0.90, exponent of magma density, j = 0.57, exponent of solution circulation rate, k = 1.49, and apparent secondary nucleation activation energy, E = −3.36 kJ∙mol−1.
The effect of secondary nucleation on CSD is generally determined in binary systems because supersaturation and seeding can be adequately controlled. However, both primary and secondary nucleation mechanisms occur in the reactive crystallization process via the generation of supersaturation by reaction [31]. There, the reaction rate, the narrow variation in agitation, and the limited transfer of mass to the crystal interface make the study of secondary nucleation and growth complex. Despite these limitations, it is important to study secondary nucleation for soluble salts in reciprocal salt pair systems because many reactions produce intermediate compounds such as double salt hydrates as picromerite to which another reagent can be added to obtain the desired anhydrous product. Furthermore, these products can be redissolved to further improve the CSD by controlled cooling. There are a few related reports in the literature on reactive crystallization for sparingly soluble salts, such as the works of Taguchi et al. [31], Lu et al. [32] and Mignon et al. [33], but to the knowledge of the authors not on soluble salts in a reciprocal salt pair system.
Thus, the purpose of this work is to study the reactive crystallization kinetics between aqueous solutions (aq) of KCl(aq) and MgSO4(aq) (the latter from picromerite) to produce K2SO4. Reaction temperatures of 5, 15, 25, 35, and 45 °C were applied, and initial local supersaturations and the supersaturation profiles as a function of time were determined. Population density data in terms of crystal count, length, area, and volume were collected using an FBRM probe to simultaneously estimate primary (Bb) and secondary (B) nucleation kinetics, growth (G), and suspension density (MT) over time. Since the CLD measured by FBRM is related but not similar to the CSD [34], the CLD data was converted to CSD data based on the works of Heath et al. [35]; Togkalidou et al. [17]; Trifkovic et al. [36]; Óciardhá et al. [37], and, Ajinkya et al. [34]. During reactive crystallization, the absorbance and temperature of the solution were followed in situ and in real time using ATR-FTIR and Pt-100, respectively. In addition, the change in ion concentrations was measured, and images of nucleation and growth events, as well as crystal morphology were captured.
This work contributes to determining the kinetic parameters of nucleation and growth for the reciprocal salt system under study and the degree of supersaturation based on the Pitzer ionic interaction parameters for the reactive crystallization process of K2SO4(s). In addition, this research constitutes a potential tool for producing K2SO4 from picromerite.

1.1. Reaction, Thermodynamic and Crystallization Kinetics Framework

1.1.1. Dissolution and Reaction of Picromerite

The dissolution of picromerite is an incongruent process; it decomposes in the presence of water according to the following Equation:
K2SO4·MgSO4·6H2O(s)/H2O ↔ nK2SO4(s) + (1 − n)K2SO4(aq) + MgSO4(aq)+ 6H2O(l)/H2O
In a second step, a KCl(aq) solution reacting with MgSO4(aq) from picromerite leads to the formation of K2SO4(s) product crystals according to Equation (2) which forms the basis of the crystallization kinetics study in this work.
(1 − n)K2SO4(aq) + MgSO4(aq) + 2KCl(aq) ↔ K2SO4(s) + (1 − n)K2SO4(aq) + MgCl2(aq)

1.1.2. Thermodynamic Supersaturation

The determination of the thermodynamic supersaturation is based on estimating the activity coefficients of the ionic pair K+-SO42− as a function of temperature in a mixture of electrolytes K+-Mg2+//Cl-SO42−, based on the Pitzer model. The latter considers the ionic strength of the electrolyte mixture since supersaturation is the driving force that promotes nucleation and growth of crystals in crystallization processes.
Pitzer’s model [38,39,40,41] requires the binary ionic interaction parameter values of
β i j ( 0 ) ,   β i j ( 1 ) ,   β i j ( 2 ) ,     and   C i j for reactant electrolytes and products as a function of temperature, where i   and   j represent the ionic pair cation and anion, respectively. The ionic interaction parameters of KCl ( aq ) ,   MgCl 2 ( aq ) ,   and   MgSO 4 ( aq ) as a function of temperature are given in Table 1. They were obtained by Equations (S1)–(S3), whose empirical parameters are found in Tables S1–S3, established by Holmes et al. [42], De Lima and Pitzer. [43], and Phutela and Pitzer [44], respectively (see Supplementary Information (SI).
Once the activity coefficients of the ion pair K+-SO42− are determined in the system K+-Mg2+//Cl-SO42−, they are related to the molal concentration and the thermodynamic equilibrium constant Ksp of K2SO4, which was determined using the Pitzer model for isotherms of 5, 15, 25, 35, and 45 °C based on solubility data [45]. The Ksp data for K2SO4 estimated in this work are similar to those reported by Jiménez et al. [46] for isotherms of 15, 25, 35, and 45 °C. The Ksp results of K2SO4 found in Table S4 (SI) are replaced in Equation (3) to obtain the dimensionless degree of supersaturation “S” used in the reactive crystallization process of K2SO4. Then, S is given by:
S = γ ± ( m + v + m v K s p ) 1 / v
where, γ ± is the mean activity coefficient corresponding to K2SO4, m + v +   a n d   m v are the molal concentration of the K+ and SO42− ions raised to their respective stoichiometric coefficients and v is the total coefficient of K+ and SO42− ( v + + v ) .

1.1.3. Crystallization Kinetics

The CLD measured by the FBRM probe differs from the CSD measured by sieving, laser diffraction, and PVM. However, using the mean or mode average of the square-weighted chord length was found to be comparable to conventional sizing techniques for the range of about 50–400 μm [35]. Therefore, on that basis, it is possible to determine the population density and then exploit it for crystallization kinetic studies [17,35]. The mathematical Equations that allow obtaining CSD-based moments from CLD are presented below [17,35].
The jth moments from CLD data are calculated with Equation (4) according to Trifkovic et al. [36]:
μ j ( t ) 0 L j n ( L , t ) d l i = 1 F B R M L a v e , i j N i ( L a v e , i , k ) = N k
where L i is the chord length, N i the number of particles in channel i , and k the discrete time counter. L a v e , i is the arithmetic mean between the upper ( L i ) and lower ( L i 1 ) channel size and is expressed as:
L a v e , i = L i + L i 1 2
Trifkovic et al. [36] used the total number of crystals in the entire FBRM size range (1 to 1000 microns) to calculate the nucleation rate. The number of particles as a function of time is given by Equation (6).
N ( t ) = 0 n ( t ) d L i = 1 F B R M N i , k = N k
Furthermore, it is possible to determine the nucleation rate as a difference of the total number of particles at each moment per mass of solvent, according to Equation (7).
B e x p ( t ) = 1 M ( t ) d N ( t ) d t 1 M k Δ N k Δ t = B e x p , k
where B e x p , k and M k are the nucleation rate and the total mass of solvent in the kth time interval. From this Equation, the ratio of the particle count to the mass of the solvent can be considered. However, by adopting Equation (4) to determine the 0th moment, this would become a summation of CLD of original FBRM data, which does not consider the conversion from CLD to CSD. According to the report of Heath et al. [35], the population density is considered via the conversion of CLD to CSD as counts of square-weighted chord lengths by the following Equation:
N i , n = N i , 0 C i , A n
where N i , n is the number of n-weighted chord length counts in the ith channel, N i , 0 the count of unweighted chord lengths in the ith channel, and C i , A n is the geometric mean length of the ith channel given by:
C i , A = ( C i , u · C i , l ) 1 / 2
with C i , u and C i , l the length of the upper and lower limit of the ith channel, respectively. Then, by combining Equations (4) and (8), Equation (10) is constituted to determine the moments based on the population density as a function of time per unit mass of solvent. M is the mass of the solvent (H2O).
μ j ( t ) 0 L j n ( L , t ) d l i = 1 F B R M L a v e , i j N i , n ( L a v e , i , k ) 1 M
Following the previous Equation, moments of the order 0, 1, 2, and 3 can be determined with the units ( # / kgH 2 O ) ,   ( μ m / kgH 2 O ) ,   ( μ m 2 / kgH 2 O ) ,   and   ( μ m 3 / kgH 2 O ) , respectively as a function of time, also for different degrees of initial local supersaturation reached at temperatures of 5, 15, 25, 35, and 45 °C.
Based on the population balance equation (PBE), different ordinary differential equations (ODE’s) are obtained that allow for the determination of the nucleation and growth rate and suspension density with respect to time considering the conversion from CLD to counts of square-weighted chord lengths, which are presented below.
Primary nucleation rate.
In the reactive crystallization of K2SO4, primary and secondary nucleation (Bb and B, respectively) occur, whereas Bb results from the high supersaturation generated by the reaction. The nucleation rate (B) of K2SO4 is determined based on the 0th moment (μo) after conversion of the CLD to square-weighted counts [35] (Figures S1 and S2 (see SI)). Then, the B is estimated using the following Equation [47]:
d μ o d t = B
In the present work, Bb is related with the initial local supersaturation (S0) since it has been obtained from the thermodynamic approach when considering the activities of the species K+ and SO42− in the multicomponent system K+, Mg2+/Cl, SO42−//H2O. To determine the kinetic parameters such as order and rate constant of primary nucleation rate, the following Equation [48] has been used:
B b = k b · S o b
where b is the primary nucleation order and kb is the primary nucleation rate constant.
Secondary nucleation rate.
Secondary nucleation usually depends on suspension density (MT) and supersaturation (S). Furthermore, growth (G) is also a function of S. Then, the relationship of B with G and MT describes the secondary nucleation rate of K2SO4 in the reactive crystallization process with time and is given as follows [49]:
B = K R · G i · M T j
Their i is the nucleation relative to the order of growth, j the suspension density exponent, and K R the relative rate coefficient.
Crystal growth rate.
The crystal growth rate (G) of K2SO4 was simultaneously determined from the population density data, where G is linked to the 0th and first moment (Figure S3 (SI)), according to the following Equation [47]:
1 μ o d μ 1 d t = G
With the data of G for different degrees of initial supersaturation S0, the empirical fit parameters are determined according to [48]:
G = k g · S 0 g
Crystal suspension density.
The suspension density as a function of time, based on the data of the total volume of crystals μ3 (μm3) (Figure S5 (SI)), was determined as follows [35]:
d M T d t = 3 · k v · ρ c · G · μ 2
where ρ c is the K2SO4 crystals density (2.66 × 10⁻¹² g/μm3), k v is the volume shape factor (0.69 for K2SO4), and μ 2 is the second moment (Figure S4 (SI)). However, the empirical Equation (17) was specified gravimetrically to corroborate the behaviour of the suspension density and through the mass balance (Equation (18)) using data from the third moment as follows:
M T i = μ 3 i μ 3 f M T f .
where μ3i and μ3f are the initial and final total crystal volume, and MTi and MTf are the initial and final suspension density in the reactive crystallization. The mass balance Equation is given by [50]:
C ( t ) = C 0 M T i
with C 0 being the initial concentration of the solute resulting from mixing both reactive solutions, C ( t ) the concentration of the solute over time, and M T i as given above.
Secondary nucleation activation energy.
In a chemical reaction, efficient collisions occur between atoms, molecules, or ions. The ions of the reciprocal system K+, Mg2+Cl, SO42−//H2O require the minimum kinetic energy to form the active complex specified by the activation energy Ea and expressed by the Arrhenius Equation:
K = A · exp ( E a R T )
where K is the reaction rate constant, A is the frequency of molecular collisions, R is the universal gas constant, and T is the absolute temperature. Taking the logarithm, it gives:
l n K = l n A + ( E a R ) 1 T
The graphical relationship of l n K versus 1/T is linear, with the slope equals (−Ea/R) and the intercept l n A . Thus, the activation energy Ea can be obtained from the slope of this plot. For reactive crystallization, the dependence of the secondary nucleation rate constant KR on the absolute temperature allows estimating the secondary nucleation activation energy (E) in [kJ/mol] [30].

2. Materials and Methods

2.1. Reagents

Magnesium sulfate (MgSO4) was purchased from Acros Organic (Geel, Belgium; purity > 97 wt%), potassium sulfate (K2SO4) from Carl Roth GmbH & Co. (Karlsruhe, Germany; purity ≥ 98 wt%), and potassium chloride (KCl) from Merck (Darmstadt, Germany; purity 99.5–100 wt%). All three reagents were used as received. Solid picromerite was obtained by slow evaporation, filtration, and drying. Deionized ultrapure water used as a solvent in all experiments was provided by a Merck Millipore, Milli-Q® Advantage A10 system.

2.2. Experimental Setup and Process Analytical Technology (PAT)

The experimental setup for reactive crystallization studies is shown in Figure 1. The applied PAT, additional optical process monitoring using the Technobis Crystalline PV system, and further implemented offline analytics will be discussed below.

2.2.1. Focused Beam Reflectance Measurement (FBRM)

For monitoring the change in the CLD of K2SO4 crystals during reactive crystallization, the Particle Track S400A FBRM® probe with focused beam reflectance measurement technology from Mettler Toledo, Gießen, Germany was used. It is based on the backscattering of a rotating laser beam tracking particles flowing in front of the probe window. Since particles can be scanned in parts smaller or larger than their average size, the detected value is called the “chord length”. In this study, the terms chord length distribution and a “number of crystals” is used to determine the nucleation rate B, growth rate G, and suspension density MT of K2SO4, but in CLD. The CLD of the crystals was measured in real time and fell in 100 channels. The CLD by channels varies on a logarithmic scale from 1 to 1000 μm, allowing a higher resolution of the CLD of particles <100 μm with the ability to characterize the presence of uni and bimodal particle size distributions. The counts of CLD data were captured every 10 s during 60 min of reactive crystallization. The operational variables of the FBRM to collect data consisted in adjusting the FBRM with an angle of inclination of 82° that also acts as a deflector, with the focal position (window) located above the tip of the impeller at a height less than 8 mm. To ensure the presence of crystal samples with the impeller speed used, the pulp concentration should not exceed 20 wt/wt%, and the CLD collection was established in fine mode. In addition, mechanical stirring was kept constant at 317 rpm allowing for a good suspension of crystals. Higher stirring speed generates vortices, small and large bubbles near the edge of the propellant and on the surface of the solution, respectively, which is a problem for moment data reads. All previous operations were based on Heath et al. [35].

2.2.2. Attenuated Total Reflectance-Fourier Transform Infrared (ATR-FTIR) Spectroscopy

The change in absorbance of the solution during reactive crystallization was monitored in real time using the Mettler Toledo ReactIR™ 15 ATR-FTIR probe (Mettler Toledo, Gießen, Germany). The probe immersed in the solution measured the absorbance every 60 s during the 60 min of the reactive crystallization process.

2.2.3. Temperature Measurement

A Pt-100 sensor (Ahlborn Mess- und Regelungstechnik GmbH, Holzkirchen, Germany) was used to follow the temperature of the solution before and during reactive crystallization. Temperature data were collected and recorded with a measurement precision ± 0.01 °C. The FBRM-S400A, ATR-FTIR, and Pt-100 probes are shown in Figure 1 as the main components collecting process data on the reactive crystallization of K2SO4.

2.2.4. Technobis Crystalline PV

For image monitoring of nucleation and growth of K2SO4 crystals, the Crystalline PV multi-reactor system with particle viewer module (Technobis Crystallization Systems, Alkmaar, The Netherlands) was used. Images were taken every 20 s during the 60 min of the reactive crystallization process of K2SO4. Digital photographic images of K2SO4 particles as a function of time are displayed directly on the computer screen.

2.2.5. X-ray Powder Diffraction Phase (XRPD) Analysis

Powder samples of the reactive crystallization products were subjected to XRPD analysis using a PANalytical X’Pert-Pro diffractometer (PANalytical GmbH, Kassel, Germany) with an X’Celerator detector and Cu Kα radiation. Samples were measured in a 2-Theta range of 10–100° with a step size of 0.0167° and a counting time of 30 s per step.

2.2.6. Chemical Analysis by Ion Chromatography (IC)

The concentrations of K+, Mg2+, Cl and SO42− were determined by ion chromatography using the Dionex ICS 1100 IC system (Thermo Fischer Scientific, Dreieich, Germany). For calibration, standard solutions of known composition were prepared for the anionic and cationic pairs Cl-SO42− and K+-Mg2+, respectively. These standards allowed determining the concentrations of the cations and anions, with priority for Mg2+ as an impurity in the K2SO4 product crystals to evaluate the product quality.

2.3. Experimental Procedure

2.3.1. Preparation of the Saturated Solution of Magnesium Sulfate from Picromerite

There are two methods to prepare MgSO4(aq) from picromerite: (1) by dissolving the MgSO4 from the picromerite crystal lattice by addition of water and (2) by isothermal synthesis. Both methods are based on the phase diagram for the ternary system K2SO4-MgSO4-H2O at 25 °C (see Figure S6 (SI)). In this work, method (2) has been adopted to prepare MgSO4(aq) from pure reagents K2SO4, MgSO4 and H2O without the need to prepare the picromerite. Since the dissolution of picromerite is an incongruent process, it decomposes in the presence of water, according to Equation (1). As a result, a solid phase of K2SO4(s) is in equilibrium with a saturated liquid phase of K+, Mg2+and SO42− ions in water. The solid potassium sulfate is filtered under a vacuum, and the resulting solution is used in the K2SO4 reactive crystallization process to determine the kinetic parameters. For the pulp synthesis according to point C in Figure S6 (see SI), pure reagents K2SO4(s), MgSO4(s) and H2O(l) were mixed to obtain a synthetic pulp constituted of 11.10, 12.54, and 76.34 wt/wt% of K2SO4, MgSO4, and H2O, respectively.
The pulp synthesis and the generation of the saturated MgSO4(aq) solution from picromerite was performed in a jacketed vessel. All the reagents were added on a precision analytical balance (± 1× 10⁻⁴ g): 12.9660 g of K2SO4(s), 8.9700 g of MgSO4(s), and 54.5820 g of H2O(l). The vessel with the reagents was hermetically closed, taken into the thermostatted reactor at 25 °C and left stirring for 24 h to reach solid–liquid equilibrium and guarantee the pulp composition. The solid was separated from the pulp by vacuum filtration, and the particle-free solution was transferred to another closed vessel maintaining the temperature in a thermostatic bath. The product K2SO4(s) was allowed to dry at room temperature under a fume hood for 24 h. This synthesis procedure was repeated for all the reactive crystallization runs of K2SO4.

2.3.2. Preparation of Saturated Solution of KCl

The KCl(aq) solution reacting with MgSO4(aq) from picromerite gives rise to the formation of crystals of K2SO4(s) according to Equation (2). A saturated solution of KCl(aq) was prepared at 25 °C with an excess of 1% of KCl(s) to guarantee solid–liquid equilibrium. The dissolution of KCl(s) in water was carried out separately with magnetic stirring.

2.3.3. Operating Conditions of the Reactive Crystallization Process

The experimentation plan with the operating conditions used is given in Table S5 (SI). Based on Equation (1), the saturated solution of MgSO4(aq) from picromerite was prepared at 25 °C. For all the reactive crystallization runs, the concentration of 457 (g of solute/kg H2O) was kept constant where the solute concentration was composed only of (1 − n) K2SO4(aq) and MgSO4(aq) at 25 °C, with n = 0.38. On the other hand, the saturated solution of KCl(aq) was prepared according to Equation (2), the concentration was 343.98 (g solute/kg H2O), which also remained constant for all reactive crystallization runs.

2.3.4. Mixing of Reagents and Generation of Initial Supersaturation (S0)

For performing reactive crystallization between the saturated synthetic solution of MgSO4(aq) from picromerite with KCl(aq), it is essential to determine the degree of initial supersaturation S0 and the supersaturation profile with time S to derive the nucleation rates, growth rates, and the suspension density during the reactive crystallization of potassium sulfate at different temperatures.
The initial supersaturation S0 was generated by mixing the MgSO4(aq) solutions from picromerite at 25 °C, and the saturated solution of KCl(aq), also at 25 °C. Mixing of both solutions was carried out at each of the temperatures under study (5, 15, 25, 35, and 45 °C) in the experimental setup shown in Figure 1. In each run, the change of CLD, absorbance and temperature was recorded using the FBRM, ATR-FTIR, and Pt-100 probes, respectively. For offline monitoring of the change of ion concentrations K+, Mg2+, Cl, and SO42− over time, aliquots of the solution were taken every 2.5 min until 5 min, then every 5 min until 30 min, and finally every 10 min until 60 min. The weight of the aliquots was 0.3291 g of particle-free solution. At the end of the reactive crystallization process programmed for 60 min, the crystallized solid was separated from the pulp by vacuum filtration and dried for 24 h at room temperature. Afterwards, samples of the products obtained were subjected to XRPD analysis to check the phase identity and to chemical analysis by IC.
For the optical reactive crystallization process monitoring of nucleation, growth, and crystal morphology via the Crystalline PV particle vision system, the same conditions described above were applied, with a difference in the reagent amounts. In this case, 4.00 g of MgSO4(aq) from picromerite with 2.19 g of a saturated solution of KCl(aq) were studied in a closed vessel using a hook type stirrer at 400 rpm.

3. Results and Discussion

3.1. Absorbance and Temperature in the Reactive Crystallization Process

The results of monitoring the change in absorbance of the solution by ATR-FTIR spectroscopy are shown in Figure S7 (SI). The absorbance decreases as a function of time as the reaction progresses and moves to smaller absolute values at lower temperatures, caused by the lower saturation concentrations of the solute. The absorbance peaks of SO42− and H2O are found in the wavenumber range of 1080–1100 cm−1 and 1645 cm−1, respectively. The corresponding temperature profiles are shown in Figure S8 (SI). As expected, after the addition of KCl(aq), stored at 25 °C, to the MgSO4 solution at 5, 15, 25, 35, and 45 °C, the temperature in the resulting solution increased for lower reaction temperatures of 5 and 15 °C to 10 and 17 °C, and, decreased for higher reaction temperatures of 35 and 45 °C to 32.5 and 41 °C, respectively, for a short time only. For the reaction isotherm at 25 °C, the temperature remained constant. However, in all cases, in less than 3 min, the initial reaction temperature is restored except for a slight difference at 45 °C.

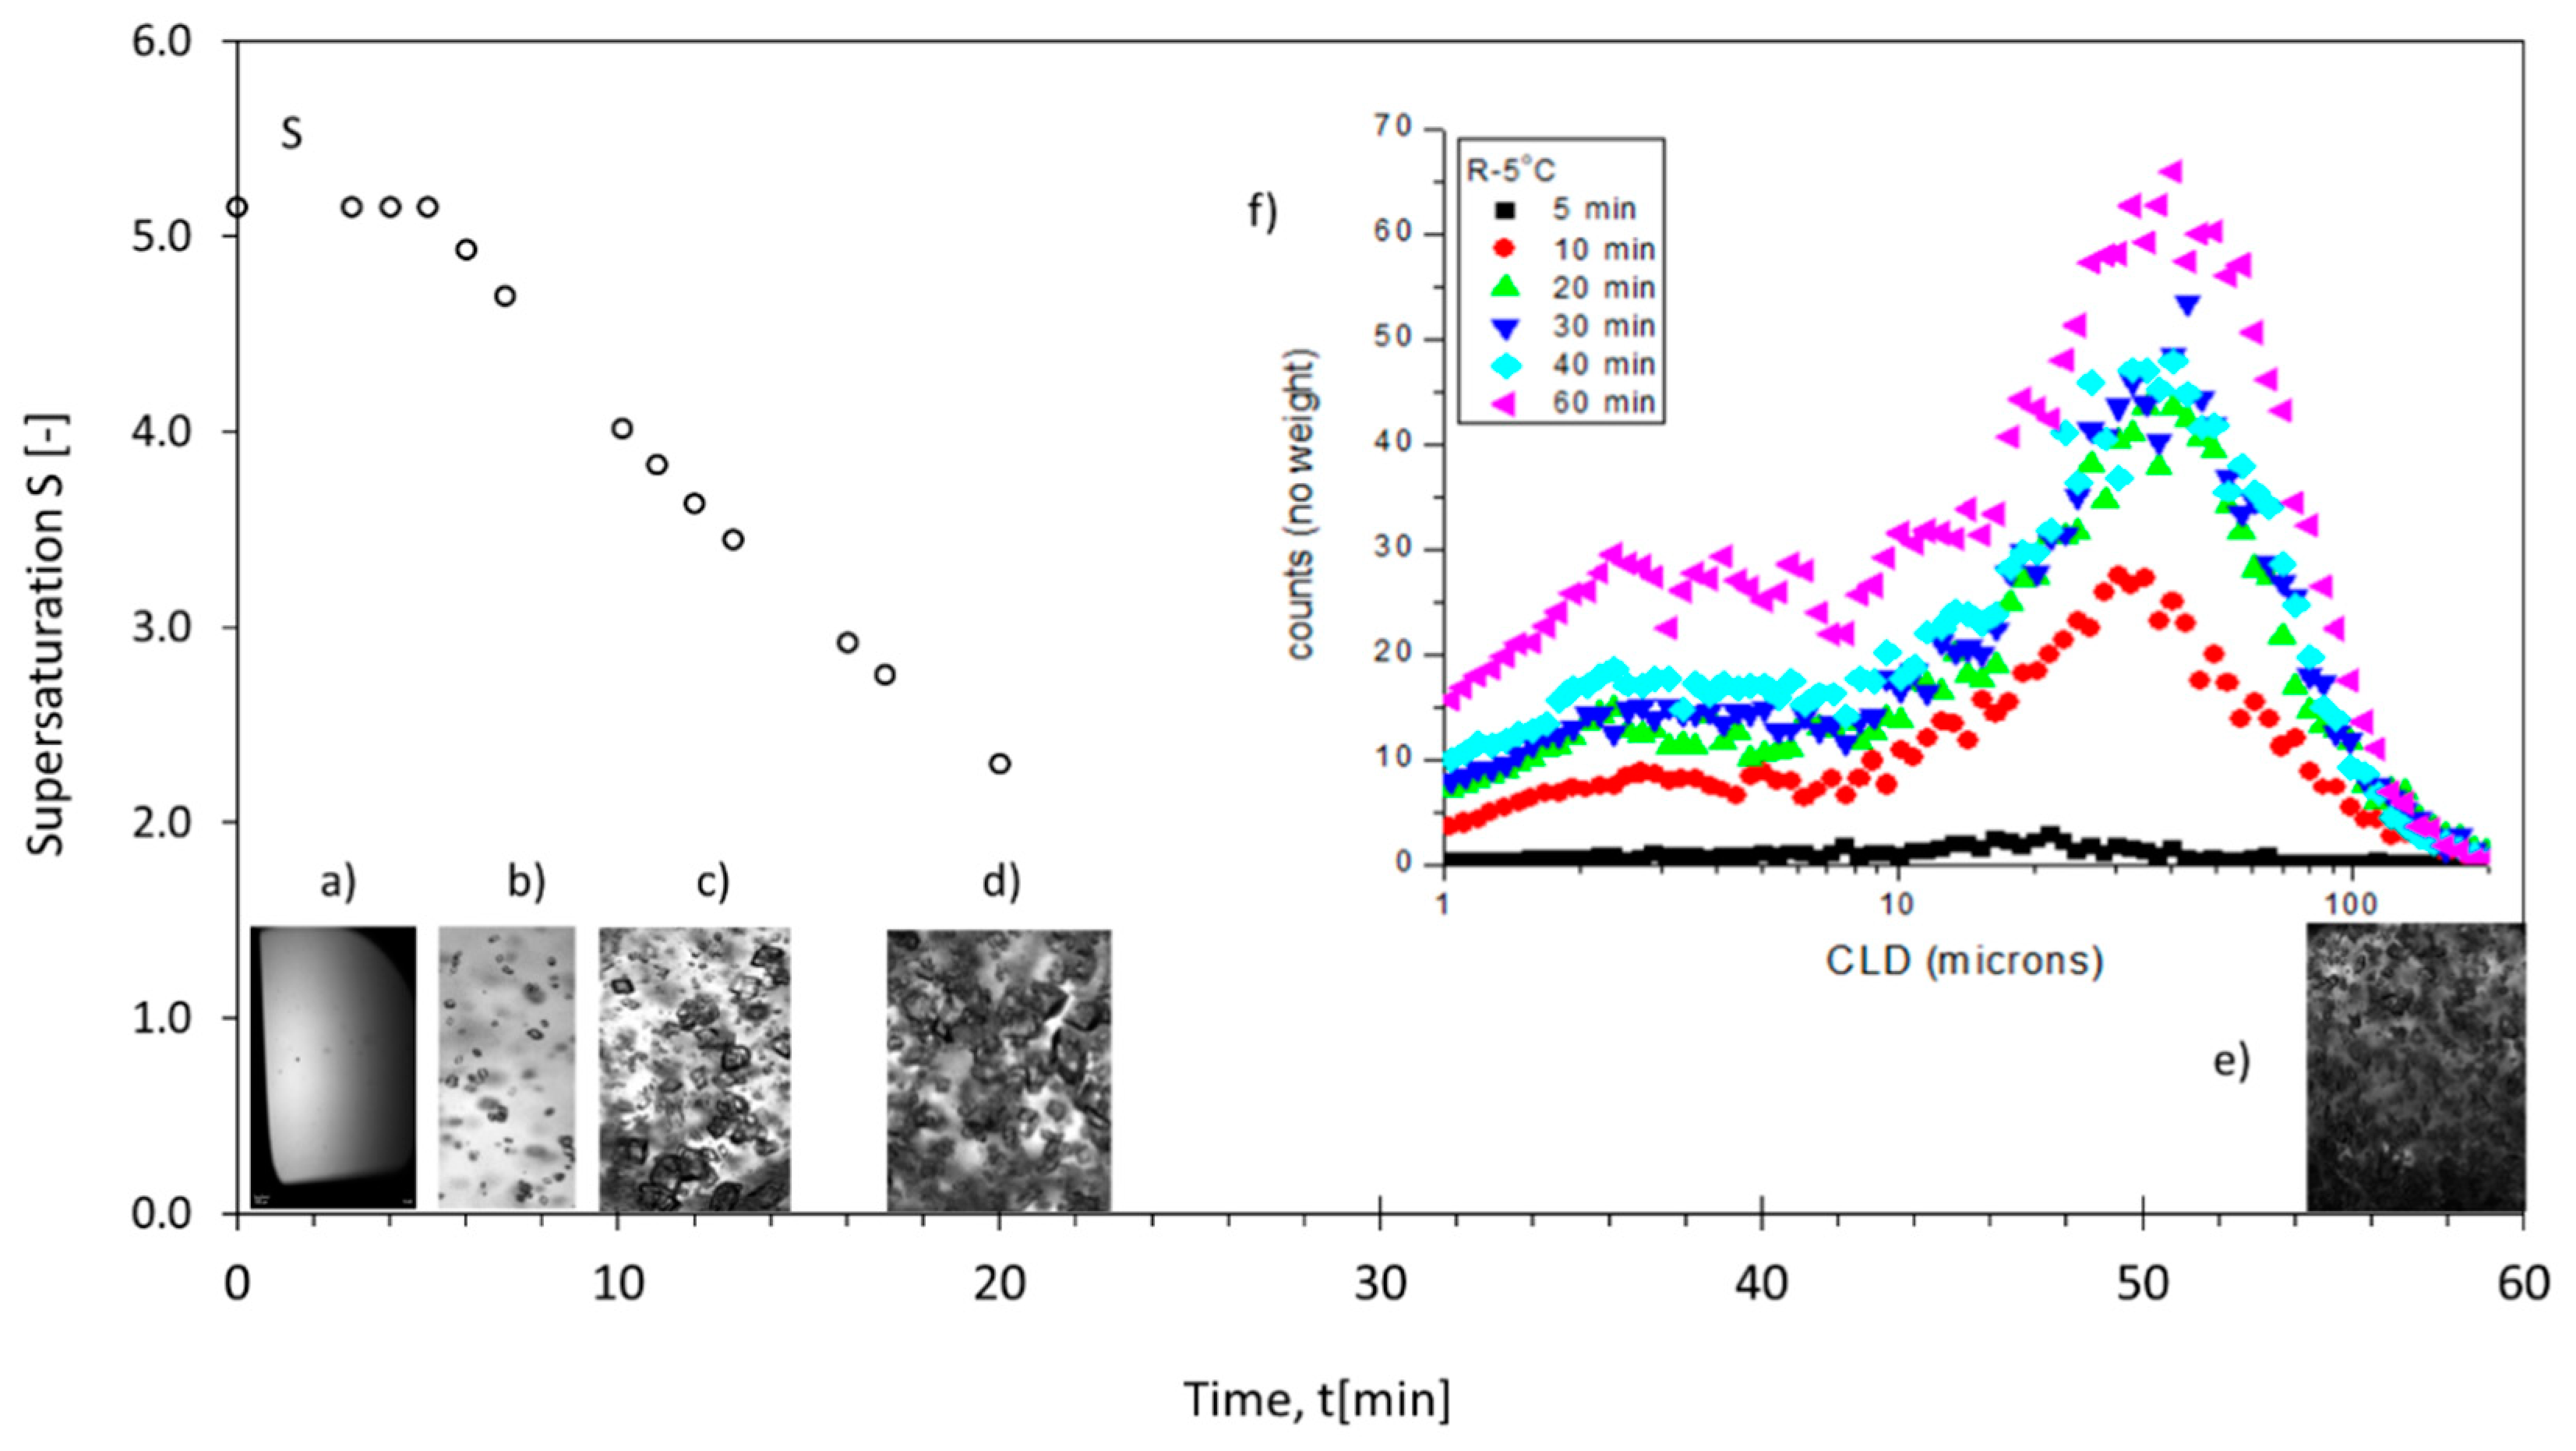
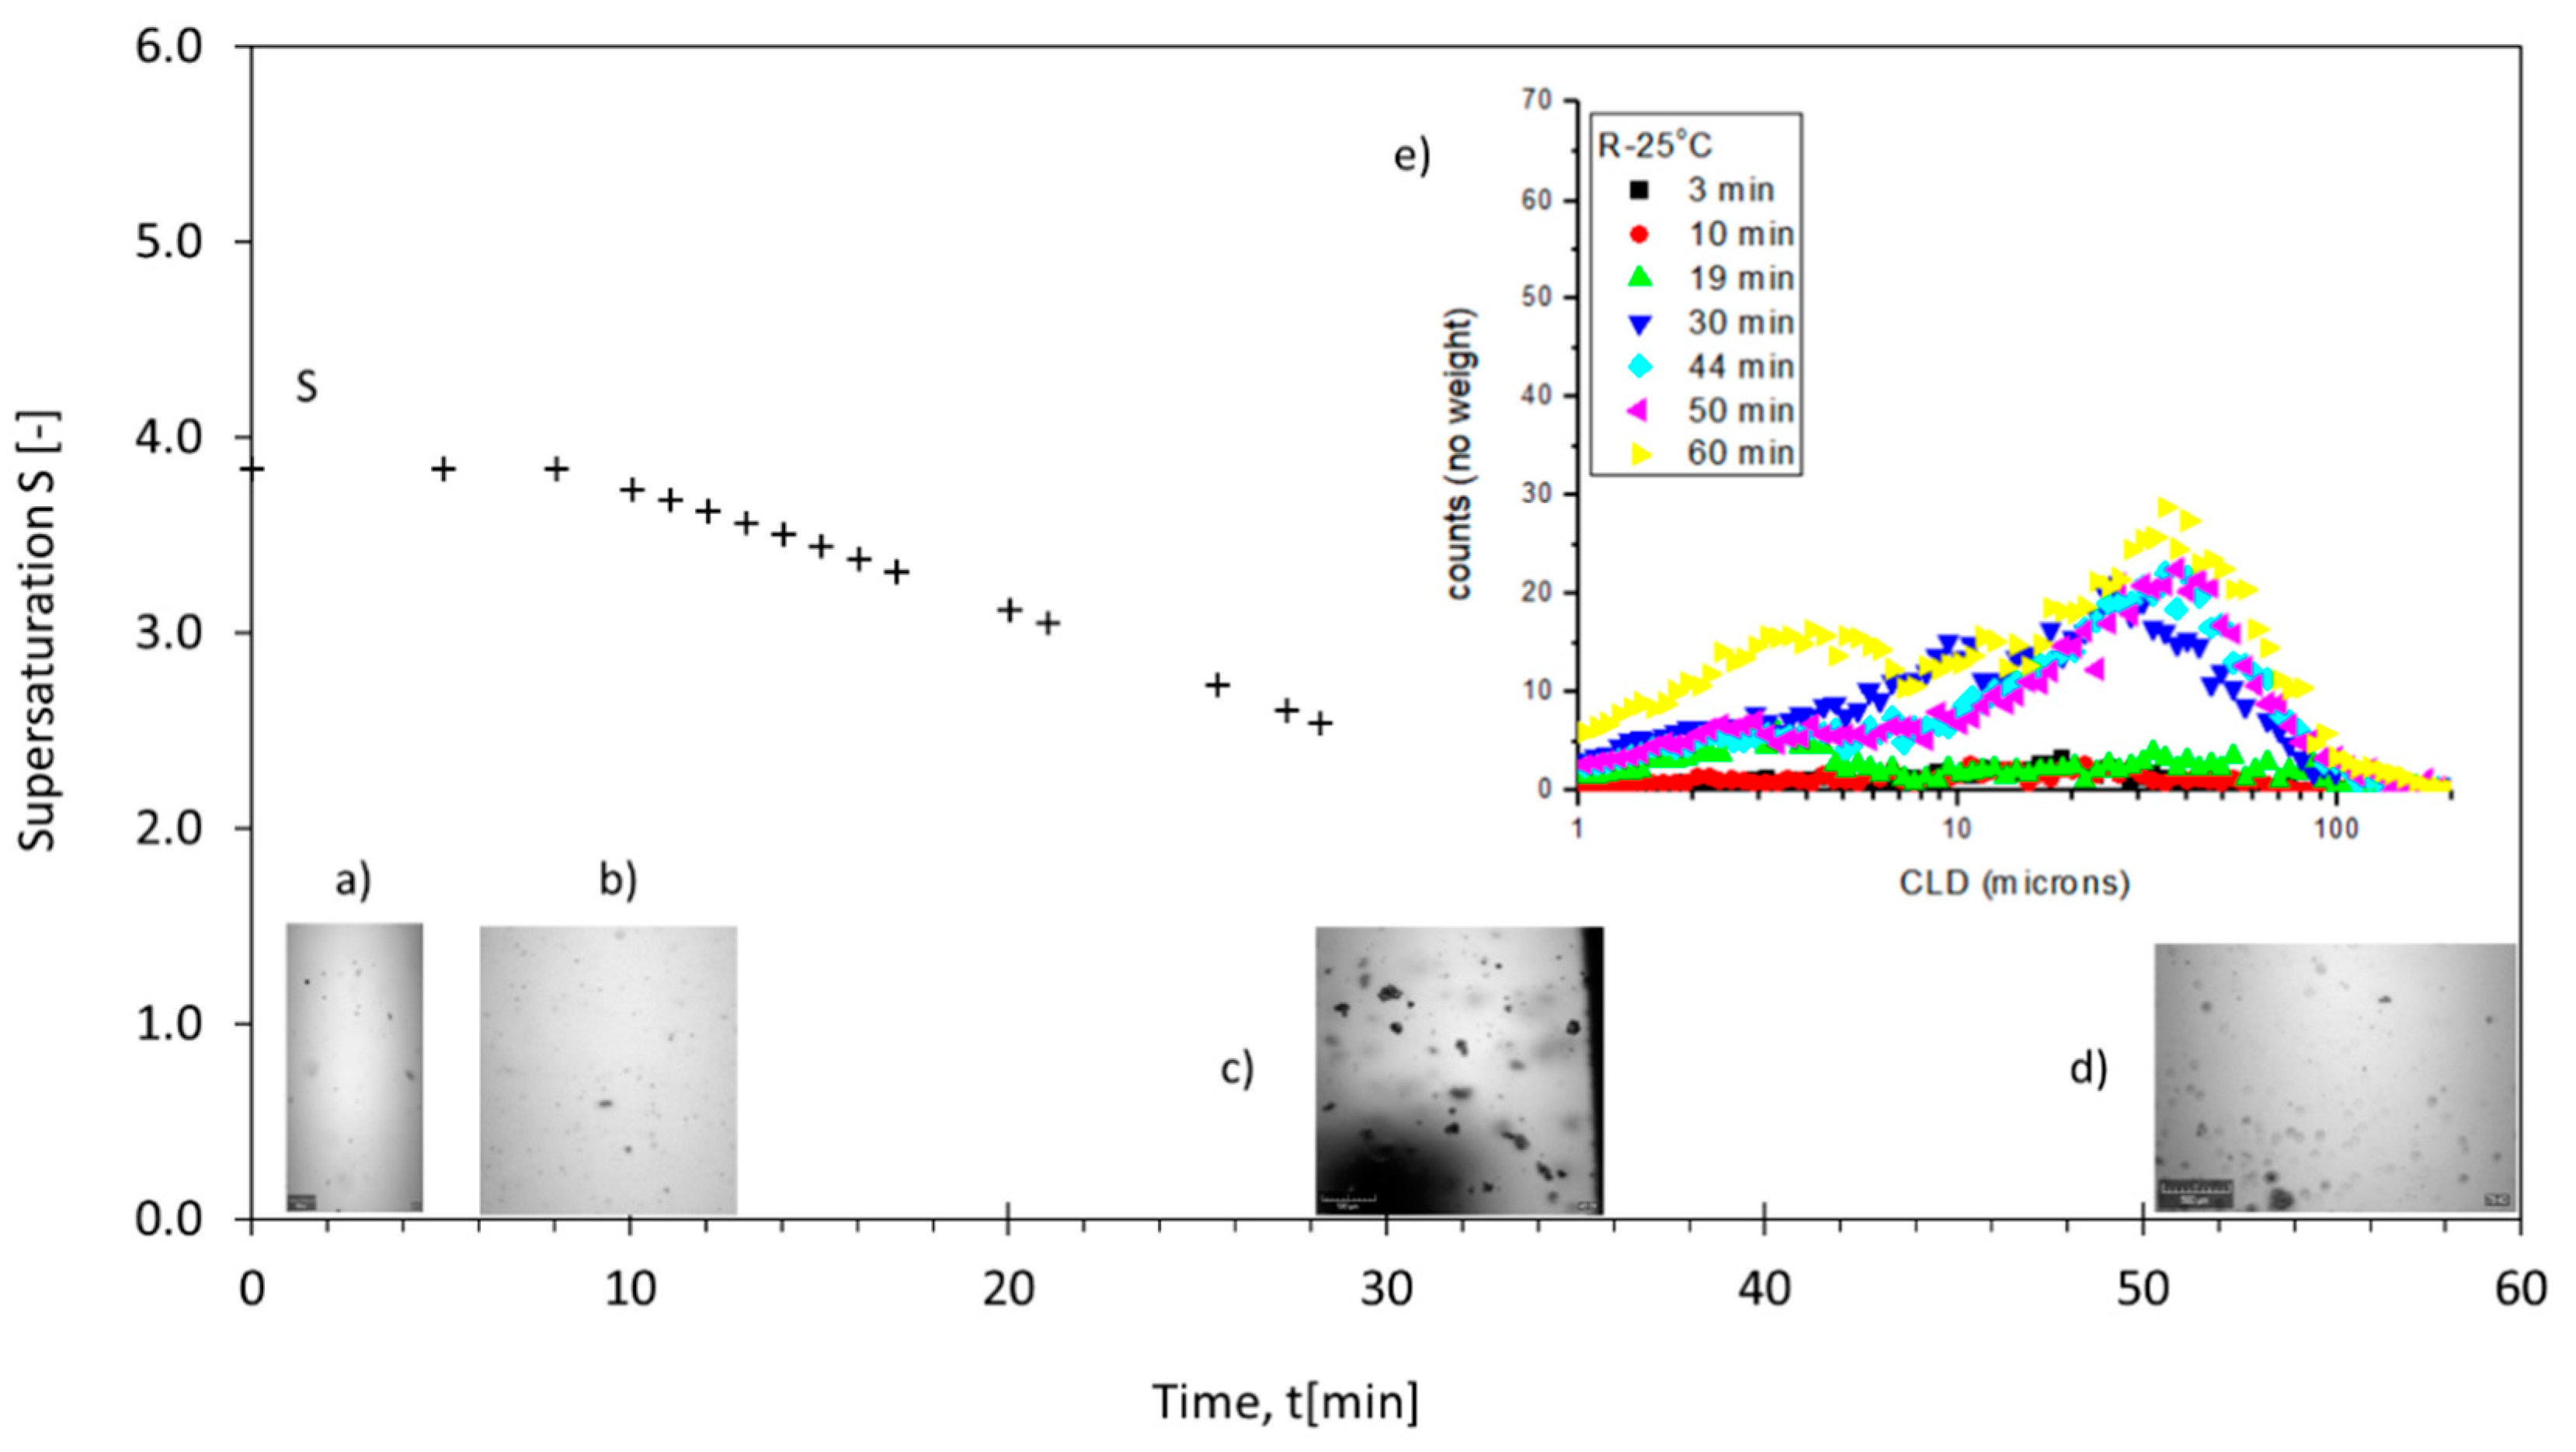
3.2. Supersaturation Profiles, Reactive Crystallization Images and CLD

The supersaturation as a function of time, S, was determined based on the concentration of the ions K+, Mg2+, Cl, and SO42−. Assuming that the Mg2+ and Cl concentrations in the solution remain constant but K+ and SO42− concentrations vary due to the formation of K2SO4(s) crystals, the concentrations of K+ and SO42− were obtained by subtracting those integrated into K2SO4(s) crystals from those entering the reaction. The molal concentrations of m K + ,   m SO 4 2 ,   m Mg 2 +   and   m Cl obtained were used to determine the activity coefficients and S, according to Equation (3).
Figure 2 shows the trajectory of S starting from the initial supersaturation S0, images of solution/crystals captured by Crystalline PV, and the respective CLD as a function of time during the reactive crystallization of K2SO4 at 5 °C. The S0 value in the reaction mixture was 5.15, showing a strong supersaturation as a precondition to initiate nucleation and growth. After an induction time of ~5 min where the reaction solution reached thermal equilibrium and became homogenized, the supersaturation decreased as a result of crystallization, reaching a minimum value of S = 2.30 at 20 min. The Crystalline PV system detected at 1.44 and 5 min of reaction (Figure 2a,b) embryo clouds and tiny pseudohexagonal crystals due to nucleation and growth. At the same time, after ~5 min, a low CLD in terms of crystals counted by the FBRM per s <2.5 crystals/s with a chord length of 20–30 microns and a rather unimodal CLD is determined. Once the driving force has been exhausted, after 20 min, the supersaturation remains constant and reactive crystallization is finished, which is corroborated by chemical analysis of the K+, Mg2+, Cl and SO42− shown in Figure S9 (SI). At ~10 min, Figure 2c shows growing K2SO4 crystals, separated from each other but overlapping in some parts with defined vertices, maintaining the pseudohexagonal and orthorhombic morphology. The crystal count reached 25 crystals/s with a chord length between 30–40 microns. A few particles between 2 and 5 microns having a crystal count of 8 crystals/s also appear (Figure 2f), thus leading to a bimodal CLD.
With the time at 20 min (Figure 2d), the crystals grow with a considerable presence of fines whose crystal count reached 42.5 crystals/s in the size range of 30–50 microns and 15 crystals/s in the range of 2–3 microns, keeping the bimodal CLD. Finally, at 60 min (Figure 2e), the pulp contains a considerable amount of fines that obstruct the image viewer of the Crystalline PV equipment; the crystal count reaches 70 crystals/s in the size range of 40–50 microns and 30 crystals/s in the 2–3 microns size range shown in Figure 2f. As seen, the counts of CLD increase with time, specifying product crystals with a bimodal CLD, which is attributed to breakage, attrition by friction or collision of crystals, or crystals with the propeller blades. Thus, crystal count increased but not growth.
At a reactive crystallization temperature of 25 °C, an initial supersaturation of S0 = 3.84 is generated (Figure 3), which remains constant for ~10 min and then decreases slowly, reaching the final S of 2.53 at 30 min. This implies that the supersaturation was consumed in 20 min and the crystallization process was stopped. Figure 3a,b show the presence of very tiny crystals with a crystal count <2.5 crystals/s in the chord length range of 10–40 microns (Figure 3e). After 30 min (Figure 3c), it is impossible to identify the crystals’ morphology due to their tiny sizes, with a crystal count of 20 crystals/s in a chord length range of 20–30 microns and 15 crystals/s with the size of 9–10 microns. After 60 min (Figure 3d), many tiny crystals are observed with a crystal count of 30 crystals/s between 30–40 microns size and 18.5 crystals/s between 3–6 microns size. Thus, again a bimodal CLD was developed as a result of the generation of fine particles from secondary nucleation mechanisms.
Comparing the reactive crystallization processes of K2SO4 at the two temperatures of 5 and 25 °C, as expected, the initial degree of supersaturation is greater at lower temperature and vice versa. As a result, for higher initial supersaturation, de-supersaturation and induction times were shorter, and crystal growth was enhanced, leading to a defined morphology, and a higher crystal count was reached with bimodal CLD. As the crystal images provide qualitative proof of the crystallization progress, in this report, the moment data collected by the FBRM probe were considered to determine the crystallization kinetics. The supersaturation profiles for all reaction temperatures used are compiled in Figure S10 (SI). They confirm the reaction crystallization trends discussed above.
The initial supersaturations S0 generated by reactive crystallization in the reciprocal system are large with values of S0 = 5.15, 4.13, 3.84, 3.54, and 3.24 at 5, 15, 25, 35, and 45 °C, respectively. In contrast, the S0- values used in solution crystallization by cooling methods for the binary K2SO4-H2O system are usually lower. For example, Bari and Pandit [24] worked in a range of S0 = 1.07–1.11 when cooling a saturated solution of K2SO4-H2O from 60 °C to a temperature between 53–49 °C. Gougazeh et al. [25] worked with S ≅ 0.00913 at 50 °C and Lyczko et al. [51] with S0 = 1.31 at 30 °C. Mohamed et al. [30] used an initial supersaturation of S0 = 1.07 for a controlled cooling in a temperature range of 63.5 to 24.6 °C. Furthermore, Garside and Tavare [52] applied S0 = 1.09, Mullin and Gaska [27] worked with S ≅ 1.07 at 20 °C, and Garside et al. [53] with S = 1.15 at 30 °C. On the other hand, in reactive crystallization processes of sparingly soluble salts, the S0 generated is much larger than for the reciprocal salt system studied in this work. Therefore, crystal nucleation and growth events occur within a few seconds of the induction time. Lu et al. [32] report an initial supersaturation of S0 = 1596, with an induction time of 26 s at 15 °C to crystallize Mg(OH)2; Taguchi et al. [31] an S0 = 70 with an induction time of 60 s to crystallize BaSO4, Steyer C. [54] an S0 = 500 to crystallize BaSO4, and Mignon et al. [33] values of S0 = 771 and 960 to crystallize SrSO4 and CaCO3, respectively. This results from the fact that sparingly soluble salts exhibit minimal values of the thermodynamic equilibrium constant (KSP). For example, the KSP of BaSO4 is 2.88 × 10⁻¹⁰ (mol/kg)2 at 25 °C [31], compared with a KSP of 0.0162 (mol/kg H2O)3 for K2SO4 according to the solubility data [45].
Figure 4 presents the CLDs of K2SO4 crystals after 5 min and the final product after 60 min at the different reaction temperatures investigated. Usually, for an industrial mass crystallization product, a narrow and unimodal CLD, as far as possible free of fine crystals, is targeted. However, in the experiments, a unimodal CLD is only observed at the beginning after 5 min of reaction (Figure 4a), where crystal counts are very low (1 to 4 crystals/s) with crystal sizes between 10–100 μm and fines <10 μm, which is found for all the isotherms studied. Likewise, Figure 4b shows the CLDs of the final K2SO4 product with a bimodal distribution. The region of fines of size <10 μm is specified by crystal counts <2 crystals/s at 45 °C, 30 crystals/s at 5 °C, and 10–15 crystals/s for isotherms in-between. In the coarse region, the size of the crystals is 15–200 μm with crystal counts of 5 crystals/s at 45 °C, 70 crystals/s at 5 °C, and 25–35 crystals/s for isotherms between 15 and 35 °C. The bimodal distribution is attributed to the effect of secondary nucleation due to the suspension density or breakage and attrition of the crystals. The difference between Figure 4a,b is related to uncontrolled depletion of supersaturation during isothermal reactive crystallization. Therefore, supersaturation is independent and predominant in reactive crystallization as the crystals simultaneously grow while others are born due to the motive force. As a result, the final CLD of the K2SO4 product is not narrow and thus not favourable for subsequent downstream processes such as filtration, drying, storage and transport, and the resistance to relative humidity as well due to the presence of fines <10 μm that can generate lumps, dust release, moisture absorption, etc.
In this work, the maximum K2SO4 crystal size obtained according to the semiquantitative analysis of CLD was between 70 and 80 µm at 5 °C, which is small compared with crystallization from pure K2SO4-H2O solutions. For example, Bari and Pandit [24] reported an average size of 286 μm via the isothermal method for low supersaturation and Bari et al. [22] an average size of 250 μm by the cooling method. Jones et al. [55] received an average size of 500 μm without fines using seeding and cooling, while via salting out with acetone, they obtained crystal sizes <350 μm with a greater presence of fines and agglomerates. It is concluded that reactive crystallization of K2SO4 from the quaternary K+, Mg2+, Cl, and SO42−system provides smaller crystals as obtained in K2SO4-H2O systems, which is due to the reaction-inherent high degree of initial local supersaturation.

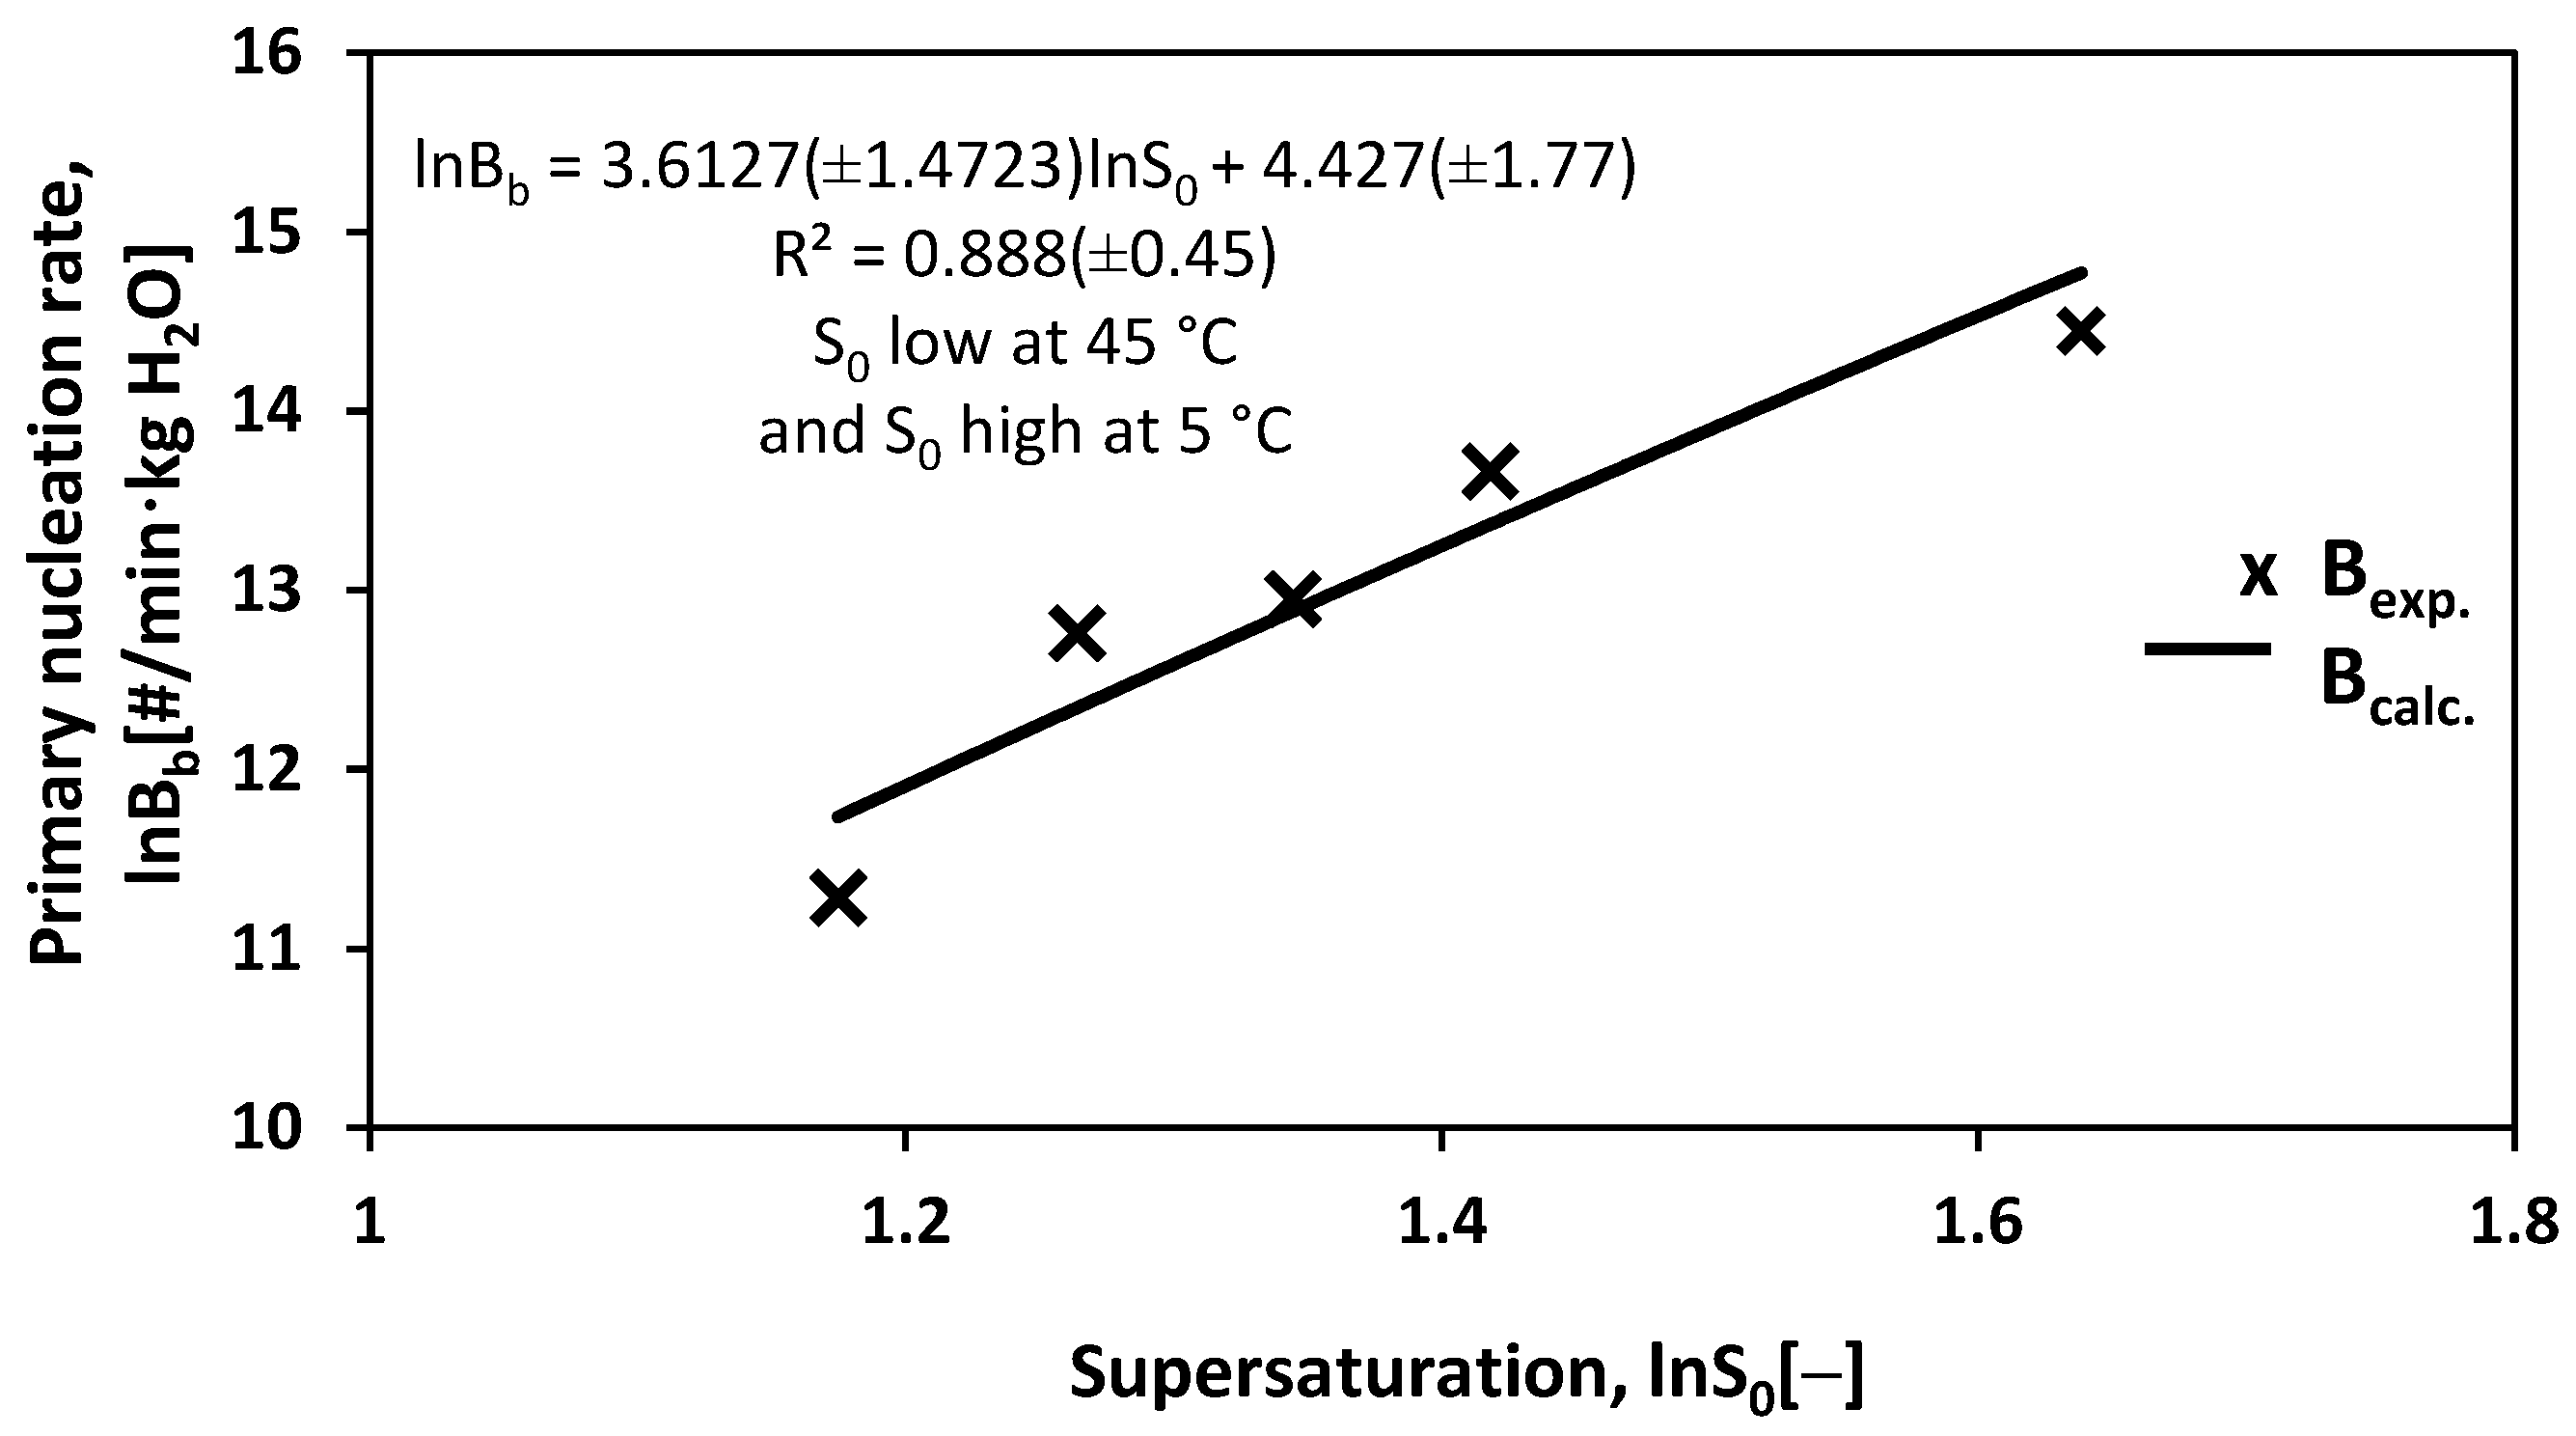
3.3. Primary Nucleation Rate Bb

To determine the nucleation rate, the CLD data have been converted to CLD counts square-weighted as a function of time for each reaction isotherm. The results transformed to moment data of the order 0, 1, 2, and 3 by Equation (10) are shown in Figures S2–S5 (SI).
In the reactive crystallization of K2SO4, primary nucleation (Bb) and secondary nucleation (B) occur, while Bb results from the high supersaturation generated. The nucleation rate (B) of K2SO4 was determined by Equation (11). Bb is related with S0 since it has been obtained from the thermodynamic approach when considering the activities of the species K+ and SO42− in the multicomponent system K+, Mg2+/Cl, SO42−//H2O. To determine the kinetic order and rate constant parameters of Bb, the nucleation rates obtained for each S0 were averaged and then fitted to Equation (12) presented in Figure 5. The fitting parameters derived are b = 3.61 and kb = 83.68 [#/min·kg H2O] with a coefficient of determination R2 = 0.89, verifying that the behaviour of Bb is proportional to S0.
The primary nucleation order obtained for the reactive crystallization of K2SO4 is lower than found for the single solute system K2SO4-H2O, as reported by Bari et al. [22], with b = 6.5 for the isothermal method (tind). Nemdili et al. [21] reported b = 4.10 and 4.68 when measuring MSZW and tind, respectively. Additionally, Bari and Pandit [24] reported b = 6.5 and 5.73 when determining MSZW via the conventional method and sonocrystallization, respectively. There, b is a physical parameter that describes the dependence of the MSZW on the cooling rate regardless of the method used. In contrast, high values for the primary nucleation order are observed in reactive crystallization kinetics of sparingly soluble salts, such as SrSO4 and CaCO3 with b = 36.0 and 12.0, respectively, reported by Mignon et al. [33]. In this report, the empirical value of b = 3.61 for the reactive crystallization of K2SO4 has no relation to the MSZW but classifies into the range established by the value of the primary nucleation order for inorganic compounds obtained by cooling, which, as a general rule, are found between 0.98 and 8.3 [23].

3.4. Secondary Nucleation Rate B

The profiles of the nucleation rates B during reactive crystallization of K2SO4 at different temperatures are shown in Figure 6. At 5 °C (with S0 = 5.15), B decreases from a maximum of 2.68 × 10⁶ (#/min·kgH2O) at 3 min to a minimum of 8.35 × 10⁵ (#/min·kgH2O) at 20 min, which implies the consumption of supersaturation due to spontaneous nucleation. The decrease in B is attributed to the presence of crystals within the solution since the growth of crystals consumes the supersaturation, the concentration resulting from the suspension density is higher, which is also observed for the 15 °C isotherms. However, at 25 °C (with S0 = 3.84) B starts with 7.7 × 10⁴ (#/min·kgH2O) at 10 min reaching a maximum of 8 × 10⁵ (#/min·kgH2O) at ~30 min of crystallization. Clearly B increases, with the increase being slight and attributed to slow crystal growth consuming less supersaturation. The concentration resulting from the suspension density is lower, a behaviour also seen for the 35 and 45 °C isotherms. Therefore, it is concluded that the greater S0, the greater is B, and it is depleted in less time than with less S0. This statement agrees with the report by Bari and Pandit [24], also referring to reactive crystallization.
Once the nuclei appear, they become stable crystals and grow over time. However, nucleation persists assisted by crystals constituted as suspension density, supersaturation decreases to a low level, and it is there that secondary nucleation occurs (B). Therefore, secondary nucleation is often dependent on suspension density (MT) and supersaturation (S). Furthermore, growth (G) is also a function of S. Then, the relationship of B with G and MT describes the secondary nucleation rate of K2SO4 in the reactive crystallization process with time and is given by Equation (13). The parameters KR, i, and j are estimated by adjusting the experimental data of G and MT with time using multiple linear regression to obtain the secondary nucleation rate calculated (Bcal) for each So.
The results of Bexp and Bcal are shown in Figure 6. A good correlation of secondary nucleation with G and MT is observed for most of the isotherms. The Bexp and Bcal values have practically the same tendencies, superimposed, at 5, 15, 25 and 45 °C (S0 = 5.15, 4.15, 3.84 and 3.24), with a coefficient of determination of R2 = 0.976, 0.997, 0.998, and 0.979, respectively, and a slightly lower correlation for the 35 °C isotherm (S0 = 3.54), with R2 = 0.943.
The empirical parameters KR, i, and j obtained for each reaction isotherm are compiled in Table S6 (SI). From the results, it can be concluded that B depends on the density of the suspension, whose values of j are between 0.20 and 0.80. However, i has values of 1.18, 0.63 and 0.1 for the 5, 15, and 25–45 °C isotherms, which is attributed to the fact that B depends on G implied by the supersaturation, whose value of i is greater than j for isotherms of 5 and 15 °C. For the 25–45 °C isotherms, i is less than j, suggesting little dependence on B for G. On the other hand, the KR values show irregular behaviour, as seen in the trends of B in Figure 6.
To finally evaluate secondary nucleation via Equation (13), the G and MT values for different S0 (Figure 6) were fitted to the following Equation:
B = 13810.83 · G 0.75 · M T 0.71
This general description of secondary nucleation in the reactive crystallization process of K2SO4 leads to a relatively low coefficient of determination R2 = 0.11. Therefore it is difficult to attribute the dependence of B to the suspension density or crystal growth rate, whose values of i and j are 0.75 and 0.71, respectively, and thus, both are close to unity [20]. For the crystallization processes in the single solute K2SO4-H2O system via cooling and seeding, Mohamed et al. [30] reported i = 0.9 and j = 0.57 and concluded that B depends on S and MT.
The presence of K2SO4(s) in the reactive crystallization solution contributes to nucleation so that the exponents i and j take on characteristic values. However, the primary nucleation order (b) depends solely on the degree of supersaturation and the method of detecting the appearance of nuclei, so the nucleation order is greater than the secondary one. Bari et al. [22] reported the dependence of secondary nucleation order (b2) on supersaturation and MT. They found b2 = 2.25 and b = 6.5 for the K2SO4-H2O system, obtained by the isothermal method and, as evident, b2 <b. Taguchi et al. [31] observed in the reactive crystallization process of BaSO4, when mixing two equimolar solutions of BaCl2 and Na2SO4 at 25 °C, that secondary nucleation is influenced by the stirring speed (Ns), MT and S, whose exponents are 0.98, 0.84 and 1.72, respectively, with a multiple correlation coefficient of 0.61. The KR parameter implies the dependence of temperature, hydrodynamics, presence of impurities and the properties of the established crystals. Thus, the KR data obtained for each reactive crystallization isotherm of K2SO4 is used to estimate the secondary nucleation activation energy in the following.

3.5. Crystal Growth Rate of K2SO4

The crystal growth rate (G) of K2SO4 was simultaneously determined from the square weighted CLD data, according to Equation (14). Figure 7 shows the growth rate of K2SO4 crystals as a function of time during the reactive crystallization process for different S0. At 5 °C (with S0 = 5.15), G starts with a value of 231.06 μm/min determined at 4.01 min and reaches a minimum value of 4.94 μm/min after 20 min. The decrease in G is caused by the decrease in supersaturation due to crystallization. At 25 °C (with S0 = 3.84), G has an initial value of 101.5 μm/min and decreases over time to 5.30 μm/min at ≈30 min.
As seen in Figure 7, the crystal growth rate is low due to the predominance of 0th. moment values (μ0) according to Equation (14). It is estimated that the nuclei are in a metastable state; therefore, the decrease in supersaturation is slight. Then, G becomes predominant, and S decreases.
As expected, the initial growth rates in the K2SO4 reactive crystallization are significantly higher than observed in the binary K2SO4-H2O system. Bari and Pandit [24] reported a G of 8.82 μm/min at 49 °C studying K2SO4 growth by microscopy. Mohamed et al. [30] reported a maximum growth rate of 6 μm/min at 40 °C with seeding, based on population balance data measured in the multichannel Coulter Counter. Mullin and Gaska [27] reported single K2SO4 crystal growth rates of 4.68 and 5.16 μm/min for faces 100 and 001 at 20 °C, respectively. In the present report, a maximum growth rate of 231 μm/min was observed at 5 °C for the reciprocal quaternary system K+, Mg2+/Cl, SO42−/H2O using the FBRM probe in situ, without the need to take samples and without seeding.
With the G data for different degrees of S0, the empirical fit parameters were determined according to Equation (15). As shown in Figure 7, the growth rates steadily decreased from an initial maximum to a minimum for all isotherms. However, for reaction isotherms 35 and 45 °C, G increased at the beginning and then diminished to the minimum due to depletion of supersaturation. Thus, the crystals grew, as seen in Figure 2a–c. To correlate G as a function of S0, the G values of each isotherm were averaged to estimate the empirical parameters kg and g. Figure 8 shows the correlation and adjustment of G versus S0, obtaining a value of g = 4.64 and kg = 0.028 (μm/min) with a coefficient of determination of R2 = 0.761.
In reactive crystallization, the high supersaturation promotes both nucleation and crystal growth, leading to a fast [31] and relatively uncontrolled decrease in supersaturation. Thus, g is much higher due to the higher growth rate that implies higher S0. However, in reactive crystallization processes for sparingly soluble salts, Taguchi et al. [31] correlated the G of BaSO4 with the stirring speed (N) and S0. They mention that the influence of N implies the occurrence of growth controlled by diffusion, while the order with respect to S0 indicates that both diffusion and surface reaction exert some influence on growth rates. Tavare and Gaikar [47] correlated the growth rate of salicylic acid crystals with solution concentration and stirring speed. They report that due to the complexity of determining supersaturation, S was omitted in the correlation. Therefore, the adjusting exponents of both the concentrations of salicylic acid and the agitation speed prevented the attribution of any mechanism of influence on growth.
In this report, the value of g = 4.64 is strongly influenced by the initial supersaturation. When S0 is higher for 5, 15, and 25 °C, a higher crystal growth rate is promoted. However, the growth rate is much lower for S0 at 35 and 45 °C. Therefore, when adjusting G vs. S0 (obtained for 5–45 °C) to an empirical Equation, the slope is greater than those known for the K2SO4-H2O systems attributable to growth mechanisms. Thus, for future studies, it is proposed to develop a strategy that allows determining the growth mechanism of K2SO4, taking advantage of the generation of supersaturation by reaction and the initial presence of fine crystals so that a cubic cooling profile can be used to control supersaturation. As a result, a fairly narrow CSD and acceptable average crystal size [56,57] would be feasible.
On the other hand, there are numerous reports for the K2SO4-H2O system for the isolated determination of the growth mechanisms in crystallization processes with low supersaturation controlled by a cooling technique. In these works, generally, the mechanism that controls the growth of K2SO4 is diffusion [21,25,26,27].

3.6. Crystal Suspension Density MT

The variation of the suspension density with respect to time was determined by Equation (16), with the results presented in Figure S11 (SI). However, the absolute suspension density was identified via empirical Equation (17) to relate the amount by weight of crystals obtained gravimetrically at the end of reactive crystallization. The results allowed estimating the amount of potassium and sulfate ions in the solution during the reaction to later be used to determine the supersaturation profile.
In Figure 9, the absolute suspension densities at different reactive crystallization isotherms are shown as a function of time. At 5 °C (S0 = 5.15), the suspension density increased linearly from 6.84 g of K2SO4/kg H2O at 6 min to 108.45 g of K2SO4/kg H2O at the end of the reactive crystallization at 20 min. At 25 °C (S0 = 3.84), an increase in MT from 3.95 g of K2SO4/kg H2O at 10 min to 56.68 g of K2SO4/kg H2O at the end of the reactive crystallization at 30 min is obtained. Thus, the higher S0, the higher the suspension density reached in less time. The final MT for the isotherms at 15, 35 and 45 °C, with the respective S0 of 4.13, 3.54 and 3.24, were 67.41, 47.03 and 21.29 g of K2SO4/kg H2O, respectively.
The suspension density (MT) targeted by crystallization is limited by the solubility, and the S0 reached in the system under study. It depends on the crystallization method and is further affected by the morphology and size distribution of the crystals, filtration demands, and the cocrystallization of an undesired compound. Mohamed et al. [30] reported an MT between 58 and 95 (g of K2SO4 crystals/kg H2O) by cooling from 63.5 to 24.6 °C, and 75 (g of K2SO4 crystals/kg H2O) at 40 °C for a K2SO4-H2O solution with seeding. In this report of reactive crystallization, a maximum MT of 108.45 g of K2SO4/kg H2O at 5 °C was obtained and was limited by the potential cocrystallization of another compound from the reciprocal salt pair.
The product yield was estimated based on the suspension density data at the end of the reactive crystallization process. For the 5, 15, 25, 35, and 45 °C isotherms, the yields achieved were 72.6%, 45.2%, 37.9%, 31.5%, and 14.3% of K2SO4, respectively. As expected, the higher the S0 in the system, the higher the yield and the less reactive crystallization time is required. The yield was determined by relating the amount of K2SO4 obtained experimentally with that calculated by stoichiometry. The mass balances of the reactive crystallization experiments established from the suspension density and the solute concentration (as obtained by Equations (17) and (18)) are depicted in Figure S12 (SI). While the solute concentration decreases, the suspension density increases due to the consumption of supersaturation by crystallization.
The solid K2SO4 obtained at 5 °C represents a solid concentration of 11 wt/wt% in the pulp, which is highly favourable for process monitoring by FBRM, as recommended by Senaputra et al. [58], who recommend a pulp concentration not greater than 20 wt/wt%.

3.7. Activation Energy E

As mentioned above, the dependence of the secondary nucleation rate constant KR on the absolute temperature enables estimating the secondary nucleation activation energy E via the Arrhenius Equation (20). The results for the reactive crystallization process studied are presented in Figure 10, specifying the secondary nucleation activation energy as E = 69.83 kJ∙mol−1. However, to obtain E, the KR values were considered as a function of the temperature that best fit. In addition, the Excel solver has been used under the restrictions of j ≥ 1 for the isotherms of 5, 15, and 25 °C, also to i ≥ 1.5 and 0.12 for the isotherms of 35 and 45 °C, respectively, which improves the determination coefficient (R2 = 0.92) in the activation energy estimation. As seen in Figure 10, the secondary nucleation activation energy is higher in the 5–25 °C segment due to the higher S0 promoting secondary nucleation, while S0 is lower in the 25–45 °C range with the consequence of a lower E.
In general, the secondary nucleation activation energy of 69.83 kJ∙mol−1 obtained for the reactive crystallization process of K2SO4 obeys the principle of positivity. However, it is believed that the activation energy for reactive crystallization primary nucleation of K2SO4 would be much lower due to the rate K2SO4 nucleated from a crystal-free solution. As there are no similar works, they cannot yet be compared with other values related to the reactive crystallization kinetics of soluble salts. However, for reference, Luo et al. [23] reported the activation energy of primary nucleation for cooling crystallization in the K2SO4-H2O system to be 33.99 kJ∙mol−1, much less than obtained for the secondary nucleation of K2SO4 by reactive crystallization in this work. On the other hand, for reactive crystallization of a poorly soluble salt, Lu et al. [32] reported a nucleation activation energy of 73.049 kJ∙mol−1 for Mg(OH)2. As seen, when nucleation depends only on supersaturation, the activation energy of primary nucleation is much lower, implying that nucleation is faster than obtained in the present report, where the activation energy of secondary nucleation depends on the density of suspension.

3.8. K2SO4 Product Quality

The crystals of K2SO4 obtained as a final product in the reactive crystallization experiments were subjected to X-ray diffraction analysis to be compared with the reagents K2SO4, KCl, and MgSO4 and synthesized picromerite. The diffractograms are compiled in Figure 11. In addition, the product crystals were analyzed regarding the presence of Magnesium as an impurity by ion chromatography. As a result, only very small contents of 0.51, 0.11, and 0.01 wt% of Magnesium were detected in the products of reaction temperatures 5, 15, and 25, 35, and 45 °C, respectively. The X-ray patterns in Figure 11 and the low residual Mg amounts in the crystals prove that the K2SO4 obtained is of high quality. The diffractogram obtained for the K2SO4 product at 5 °C exhibits several intense peaks that correspond to the patterns of K2SO4 and picromerite, verifying the somewhat higher Mg content in the respective product. K2SO4 is the majority phase, and no other crystalline phase is present, considering a detection limit of XRPD <1%. The presence of picromerite peaks might be attributed to mother liquor occluded between the K2SO4 crystals which, after filtration, crystallizes as picromerite when drying. In this work, the washing process of the K2SO4 product was omitted. Of course, when including washing after solid–liquid separation, a further increase of purity is possible but at the expense of yield. The washing process is essential to improve the quality of K2SO4, as accomplished in the crystallization process of K2SO4 from the KCl(s) picromerite(s)-H2O system reported by Fezei et al. [12,13, 14,15].
It is important to mention the presence of the eutectic point in the system, which allows deriving the lowest feasible crystallization temperature. In this sense, despite the reactive crystallization of K2SO4 from the multicomponent system K+, Mg2+/Cl, SO42−//H2O, the remaining solution still contains salts like MgSO4(aq), KCl(aq), and MgCl2(aq) that could provide more K2SO4 at reaction temperatures below 5 °C. The eutectic points of the salts with solubilities are 7.29 g of K2SO4/100 g of saturated solution at −1.9 °C, 19 g of MgSO4/100 g of saturated solution at −3.9 °C, 19.87 g of KCl/100 g of saturated solution at −10.8 °C, and 21.0 g of MgCl2/100 g of saturated solution at −33.6 °C [45].
Based on the quality of the K2SO4 obtained by reactive crystallization at 5 °C and the eutectic points mentioned above, they allow working at reactive crystallization temperatures below 5 °C. In addition, this enables generating higher S0 to improve the process performance since the eutectic point of K2SO4 is −1.9 °C, and it is estimated that this temperature is even much lower in the presence of K+, Mg2+, Cl, and SO42− ions. In this regard, Song et al. [59] mention that the solubility of the precipitating compound in a reactive crystallization process increases in the presence of ions in the system; for example, for CaSO4, the solubility increases in the presence of Cl, H+, Ca2+, and SO42− ions at 60 °C.

4. Conclusions

Based on the research on the reactive crystallization kinetics of K2SO4 from KCl(aq) with MgSO4(aq) from picromerite, several conclusions can be drawn. The S0 obtained is inversely proportional to the reactive crystallization temperature of K2SO4 and, the S0 was sufficient to promote nucleation and crystal growth at all reactive crystallization conditions used. The CLD obtained at different S0 is unimodal in the first minutes of reaction and bimodal in the final K2SO4 product. The bimodal CLD can be attributed to growth, secondary nucleation, and suspension density due to the higher S0 generated by the reaction. The presence of bimodal CLD’s is a reflection of the secondary nucleation effect and is unfavourable for subsequent processes such as filtration, drying, storage, etc. On the other hand, real time images captured during reactive crystallization evidenced the appearance and growth of crystals with pseudohexagonal morphology.
Online monitoring of the CLD and using square-weighted CLD counts shows that Bb, G, and MT are directly proportional to S0. The primary nucleation parameters were determined with the order b = 3.61 and constant kb = 83.68 [#/min·kg H2O] by correlation of Bb with S0. The b-value indicates that the primary nucleation strongly depends on the supersaturation generated by the reaction in the K+, Mg2+/Cl, SO42−//H2O system and the primary nucleation rate quantification method. In addition, G has been correlated with S0 to estimate the empirical parameter g = 4.61. The allocation of one of the growth mechanisms, such as transport and surface reaction, to the mechanism controlling growth in the performed reactive crystallization of K2SO4 is generally challenging due to the rapid mass transfer of the solute to the solid phase in reactive crystallization processes. The K2SO4 crystals obtained were of high quality containing (unwashed) 0.01–0.51 wt% of magnesium as impurity under the conditions used.
In general, it can be concluded that it was possible to estimate the degree of S0 and the trajectories of S with time in the K+, Mg2+/Cl, SO42−//H2O system at 25 °C by directly varying the reaction temperature to produce soluble salt crystals like K2SO4. Furthermore, all the S0 values obtained at different reaction isotherms were sufficient to promote the crystallization parameters. However, to improve the quality and performance of the crystals’ CSD, it is suggested to apply a programmed cubic cooling profile to the studied system since the coexistence of crystals/solution, e.g., at 45 °C, could replace a seeding stage.

Supplementary Materials

The following are available online at https://www.mdpi.com/article/10.3390/cryst11121558/s1. Table S1: Empirical values to determine the ionic interaction parameters of KCl, Table S2. Empirical values to determine the ionic interaction parameters of MgCl2, Table S3. Empirical values to determine the ionic interaction parameters of MgSO4, Table S4. Solubility product for potassium sulfate at different temperatures based on solubility data, Table S5. Experimentation plan for reactive crystallization of potassium sulfate in batch crystallization modea, Table S6. Summary of empirical parameters of secondary nucleation rate and coefficient of determination at different temperatures, Figure S1. CLD and square-weighted count, for the final product of K2SO4 crystals at 5 °C, Figure S2. 0th moments μ0(#/kg H2O) as a function of time for different S o generated at 5, 15, 25, 35 and 45 °C during reactive crystallization of K 2 SO 4 . Based on square-weighted counts, Figure S3. First moment, μ1(μm/kg H2O) of K 2 SO 4 as a function of time for different S o generated at 5, 15, 25, 35 and 45 °C during reactive crystallization of K 2 SO 4 . Based on square-weighted counts, Figure S4. Second moment, μ2(μm2/kg H2O) of K 2 SO 4 as a function of time for different S o generated at 5, 15, 25, 35 and 45 °C during reactive crystallization of K 2 SO 4 . Based on square-weighted counts, Figure S5. Third moment, μ3(μm3/kg H2O) of K 2 SO 4 as a function of time for different S o generated at 5, 15, 25, 35 and 45 °C during reactive crystallization of K 2 SO 4 . Based on square-weighted counts, Figure S6. Dissolution process of picromerite in water at 25 °C. Figure S7. Absorbance profiles of the solution during reactive crystallization at different temperatures, Figure S8. Temperature profiles during reactive crystallization at different temperatures, Figure S9. Behavior of K+, Mg2+, Cl and SO42− (g. ion/kg H2O) as a function of time during the reactive crystallization process of potassium sulfate for S0 at 5 °C, Figure S10. Supersaturation profiles S as a function of time for different S0 generated at different reaction isotherms: (a) 5 °C, (b) 15 °C, (c) 25 °C, (d) 35 °C and (e) 45 °C, Figure S11. Suspension density rate of K2SO4 (dMT/dt) as a function of time for different degrees of local initial supersaturation obtained at 5, 15, 25, 35 and 45 °C, Figure S12. Suspension density, MT (grams K2SO4 crystals/kg H2O) and solute concentration, C (grams solute/kg H2O) as a function time for 5 to 45 °C isotherms.

Author Contributions

Conceptualization, A.A. and Y.P.J.; methodology, A.A., Y.P.J. and H.L.; formal analysis, A.A. and Y.P.J.; investigation, A.A.; writing—original draft preparation, A.A.; writing—review and editing, Y.P.J., T.A.G. and H.L.; visualization, A.A.; supervision, T.A.G. and H.L.; funding acquisition, A.A. and T.A.G.; All authors have read and agreed to the published version of the manuscript.

Funding

This research was funded by Universidad Autónoma Tomas Frías from Potosí Bolivia 2016–2019.

Data Availability Statement

Not applicable.

Acknowledgments

We are thankful to Universidad Autónoma Tomás Frías (U.A.T.F.) from Potosí Bolivia for declaring the first author in commission via Consejo Carrera de Química, Consejo Facultativo de Ciencias Puras, Comisión Académica and the Honorable Consejo Universitario de la U.A.T.F. 2016–2019. Further, we thank the Universidad de Antofagasta (U.A.) Chile, Programa Doctorado en Ingeniería de Procesos Minerales and the Max Planck Institute for Dynamics of Complex Technical Systems in Magdeburg/Germany for the support of the research internship.

Conflicts of Interest

The authors declare no conflict of interest.

References

  1. Sanchez, J. Fertirrigación, Pricipios, Factores y Aplicaciones. In Seminario de Fertirrigación Apukai-Comex; Apukai-Comex: Lima, Perú, 2000; pp. 1–26. [Google Scholar]
  2. Vergara-Edwards, L.; Parada-Frederick, N. Study of the Phase Chemistry of the Salar de Atacama Brines. In Sixth International Symposium on Salt; Salt Institute-Documentary: Santiago, Chile, 1983; Volume II, pp. 345–366. [Google Scholar]
  3. Alonso, H. Origen De Los Componentes Y Balance Salino. Rev. Geol. Chile. 1996, 23, 113–122. [Google Scholar]
  4. Risacher, F. Estudio Econòmico Del Salar de Uyuni; ORSTOM en Bolivie Mission de la Paz: La Paz, Bolvia, 1989. [Google Scholar]
  5. Hidemaro, I.; Kenichi, H. Process of Producing a Potassium Sulfate Salt. U.S. Patent US4342737A, 3 August 1982. [Google Scholar]
  6. Abu-eishah, S.I.; Bani-kananeh, A.A.; Allawzi, M.A. K2SO4 Production via the Double Decomposition Reaction of KCl and Phosphogypsum. Chem. Eng. J. 2000, 76, 197–207. [Google Scholar] [CrossRef]
  7. Holdengraber, C.; Lampert, S. Process for Producing Potassium Sulfate from Potash and Sodium Sulfate. U.S. Patent US6143271A, 7 November 2000. [Google Scholar]
  8. Grzmil, B.U.; Kic, B. Single-Stage Process for Manufacturing of Potassium Sulphate from Sodium Sulphate. Chem. Pap. 2005, 59, 476–480. [Google Scholar]
  9. Mubarak, Y.A. Integrated Process for Potassium Sulfate and a Mixture of Ammonium Chloride/Potassium Sulfate Salts Production. Int. J. Eng. Technol. 2018, 7, 185–197. [Google Scholar] [CrossRef] [Green Version]
  10. Marx, H.; Kaps, S.; Schultheis, B.; Pfânder, M. Potassium Sulfate—A Precious by-Product for Solar Salt Works. In Proceedings of the World Salt Symposium 2018, Park City, UT, USA, 11 June 2018. [Google Scholar]
  11. Ryan, J.H.; Lukes, J.A.; Neitzel, U.E.; Duyster, H.P.; Great Salt Lake Minerals and Chemicals Corp. Method for the Production of Potassium Sulfate from Potassium-Containing Double Salts of Magnesium Sulfate. U.S. Patent US3634041A, 12 January 1972. [Google Scholar]
  12. Jannet, D.B.; M’nif, A.; Rokbani, R. Natural Brine Valorisation: Application of the System K+, Mg2+/Cl, SO42−/H2O at 25 °C. Desalination 2004, 167, 319–326. [Google Scholar] [CrossRef]
  13. Voigt, W. Solubility of Inorganic Salts and Their Industrial Importance. In Developments and Applications in Solubility; RSC Publishing: Freiberg, Germany, 2007; Chapter 24; pp. 390–406. [Google Scholar] [CrossRef]
  14. Fezei, R.; Hammi, H.; Adel, M. Study of the Sylvite Transformation into Arcanite At 25 °C. World J. Agric. Sci. 2008, 4, 390–397. [Google Scholar]
  15. Goncharik, I.I.; Shevchuk, V.V.; Krut, N.P.; Smychnik, A.D.; Kudina, O.A. Synthesis of Potassium Sulfate by Conversion of Potassium Chloride and Magnesium Sulfate. Inorg. Synth. Ind. Inorg. Chem. 2014, 87, 1804–1809. [Google Scholar] [CrossRef]
  16. Jha, S.K.; Karthika, S.; Radhakrishnan, T.K. Modelling and Control of Crystallization Process. Resour. Technol. 2017, 3, 94–100. [Google Scholar] [CrossRef]
  17. Togkalidou, T.; Tung, H.H.; Sun, Y.; Andrews, A.T.; Braatz, R.D. Parameter Estimation and Optimization of a Loosely Bound Aggregating Pharmaceutical Crystallization Using in Situ Infrared and Laser Backscattering measurements. Ind. Eng. Chem. Res. 2004, 43, 6168–6181. [Google Scholar] [CrossRef]
  18. Shoji, M. Kinetic Studies for Industrial Crystallization to Improve Crystal Size Distribution and Crystal Shape. Available online: https://tuat.repo.nii.ac.jp/index.php?action=pages_view_main&active_action=repository_action_common_download&attribute_id=16&block_id=39&file_no=1&item_id=908&item_no=1&page_id=13 (accessed on 1 December 2012).
  19. Nagy, Z.K.; Chew, J.W.; Fujiwara, M.; Braatz, R.D. Advances in the Modeling and Control of Batch Crystallizers. IFAC Proc. Vol. 2004, 37, 83–90. [Google Scholar] [CrossRef]
  20. Tavare, N.S. Characterization of Crystallization Kinetics from Batch Experiments. Sep. Purif. Rev. 1993, 22, 93–210. [Google Scholar] [CrossRef]
  21. Nemdili, L.; Koutchoukali, O.; Mameri, F.; Gouaou, I.; Koutchoukali, M.S.; Ulrich, J. Crystallization Study of Potassium Sulfate-Water System, Metastable Zone Width and Induction Time Measurements Using Ultrasonic, Turbidity and 3D-ORM Techniques. J. Cryst. Growth 2018, 500, 44–51. [Google Scholar] [CrossRef]
  22. Bari, A.H.; Chawla, A.; Pandit, A.B. Ultrasonics Sonochemistry Sono-crystallization Kinetics of K2SO4: Estimation of Nucleation, Growth, Breakage and Agglomeration Kinetics. Ultrason. Sonochem. 2017, 35, 196–203. [Google Scholar] [CrossRef]
  23. Luo, M.; Liu, C.; Xue, J.; Li, P.; Yu, J. Determination of Metastable Zone Width of Potassium Sulfate in Aqueous Solution by Ultrasonic Sensor and FBRM. J. Cryst. Growth 2017, 469, 144–153. [Google Scholar] [CrossRef]
  24. Bari, A.H.; Pandit, A.B. Sequential Crystallization Parameter Estimation Method for Determination of Nucleation, Growth, Breakage, and Agglomeration Kinetics. Ind. Eng. Chem. Res. 2018, 57, 1370–1379. [Google Scholar] [CrossRef]
  25. Gougazeh, M.; Omar, W.; Ulrich, J. Growth and Dissolution kKinetics of Potassium Sulfate in Pure Solutions and in the Presence of Cr3+ Ions. Cryst. Res. Technol. 2009, 1210, 1205–1210. [Google Scholar] [CrossRef]
  26. Kubota, N.; Fukazawa, J.; Yashiro, H.; Mullin, J.W. Impurity Effect of Chromium (III) on the Growth and Dissolution Rates of Potassium Sulfate Crystals. J. Cryst. Growth 1995, 149, 113–119. [Google Scholar] [CrossRef]
  27. Mullin, J.W.; Gaska, C. Potassium Sulfate Crystal Growth Rates in Aqueous Solution. J. Chem. Eng. Data 1973, 18, 217–220. [Google Scholar] [CrossRef]
  28. Avila, S.T. Control del Proceso de Cristalización Continuo No-isotérmico Empleando Lógica Difusa; Celaya: Guanajuato, México, 2010. [Google Scholar]
  29. Chianese, A.; Di Berardino, F.; Jones, A.G. On the Effect of Secondary Nucleation on the Crystal Size Distribution from a Seeded Batch Crystallizer. Chem. Eng. Sci. 1993, 48, 551–560. [Google Scholar] [CrossRef]
  30. Mohamed-Kheir, A.K.M.; Tavare, N.S.; Garside, .J. Crystallization Kinetics of Potassium Sulphate in a 1 M3 Batch Cooling Crystallizer; Pergamon Press: Oxford, UK, 1987. [Google Scholar]
  31. Taguchi, K.; Garside, J.; Tavare, N.S. Nucleation and Growth Kinetics of Barium Sulphate in Batch Precipitation. J. Cryst. Growth 1996, 163, 318–328. [Google Scholar] [CrossRef]
  32. Lu, L.; Hua, Q.; Tang, J.; Liu, Y.; Liu, L.; Wang, B. Reactive Crystallization Kinetics of Magnesium Hydroxide in the Mg(NO3)2–NaOH System. Cryst. Res. Technol. 2018, 53, 1–10. [Google Scholar] [CrossRef]
  33. Mignon, D.; Manth, T.; Offermann, H. Kinetic Modelling of Batch Precipitation Reactions. Chem. Eng. Sci. 1996, 51, 2565–2570. [Google Scholar] [CrossRef]
  34. Pandit, A.V.; Vivek, V.R. Chord Length Distribution to Particle Sized Distribution. AIChE J. 2016, 62, 1–14. [Google Scholar] [CrossRef] [Green Version]
  35. Heath, A.R.; Fawell, P.D.; Bahri, P.A.; Swift, J.D. Estimating Average Particle Size by Focused Beam Reflectance Measurement (FBRM). Part. Part. Syst. Charact. 2002, 19, 84–95. [Google Scholar] [CrossRef]
  36. Trifkovic, M.; Sheikhzadeh, M.; Rohani, S. Kinetics Estimation and Single and Multi-Objective Optimization of a Seeded, Anti-solvent, Isothermal Batch Crystallizer. Ind. Eng. Chem. Res. 2008, 47, 1586–1595. [Google Scholar] [CrossRef]
  37. Óciardhá, C.T.; Hutton, K.W.; Mitchell, N.A.; Frawley, P.J. Simultaneous Parameter Estimation and Optimization of a Seeded Antisolvent Crystallization. Cryst. Growth Des. 2012, 12, 5247–5261. [Google Scholar] [CrossRef]
  38. Pitzer, K.S. Activity Coefficients in Electrolyte Solutions, 2nd ed.; Pitzer, K.S., Ed.; CRC Press Taylor & Francis Group: Berkeley, CA, USA, 2018. [Google Scholar] [CrossRef]
  39. Harvie, C.E.; Møller, N.; Weare, J.H. The Prediction of Mineral Solubilities in Natural Waters: The Na-K-Mg-Ca-H-Cl-SO4-OH-HCO3-CO3-CO2-H2O system to High Ionic Strengths at 25 °C. Geochim. Cosmochim. Acta 1984, 48, 723–751. [Google Scholar] [CrossRef]
  40. Møller, N. The Prediction of Mineral Solubilities in Natural Waters: A Chemical Equilibrium Model for the Na-Ca-Cl-SO4-H2O System, to High Temperature and Concentration. Geochim. Cosmochim. Acta 1988, 52, 821–837. [Google Scholar] [CrossRef]
  41. Marion, G.M.; Farren, R.E. Mineral Solubilities in the Na-K-Mg-Ca-Cl-SO4-H2O system: A re-evaluation of the Sulfate Chemistry in the Spencer-Moller-Weare Model. Geochim. Cosmochim. Acta 1999, 63, 1305–1318. [Google Scholar] [CrossRef]
  42. Holmes, H.F.; Baes, C.F.; Mesmer, R.E. Isopiestic Studies of Aqueous Solutions at Elevated Temperatures. J. Chem. Thermodyn. 1978, 10, 983–996. [Google Scholar] [CrossRef]
  43. De Lima, M.C.P.; Pitzer, K.S. Thermodynamics of Saturated Electrolyte Mixtures of NaCl with Na2SO4 and with MgCl2. J. Solut. Chem. 1983, 12, 187–199. [Google Scholar] [CrossRef] [Green Version]
  44. Phutela, R.C.; Pitzer, K.S. Heat Capacity and other Thermodynamic Properties of Aqueous Magnesium Sulfate to 473 K. J. Phys. Chem. 1986, 90, 895–901. [Google Scholar] [CrossRef]
  45. Linke, W.F.; Seidell, A. Solubilities of Inorganic and Metal Organic Compounds, 4th ed.; Van Nostrand: Washington, DC, USA, 1958. [Google Scholar]
  46. Jimenez, Y.P.; Taboada, M.E.; Galleguillos, H.R. Solid-Liquid Equilibrium of K2SO4 in Solvent Mixtures at Different Temperatures. Fluid Phase Equilib. 2009, 284, 114–117. [Google Scholar] [CrossRef]
  47. Tavare, N.S.; Gaikar, G.V. Precipitation of Salicylic Acid: Hydrotropy and Reaction. Ind. Eng. Chemisry Res. 1991, 30, 722–728. [Google Scholar] [CrossRef]
  48. Vollmer, U.; Raisch, J. Control of Batch Crystallization-A System Inversion Approach. Chem. Eng. Process. Process. Intensif. 2006, 45, 874–885. [Google Scholar] [CrossRef]
  49. Lu, Y.; Wang, X.; Ching, C.B. Application of Preferential Crystallization for Different Types of Racemic Compounds. Ind. Eng. Chem. Res. 2009, 48, 7266–7275. [Google Scholar] [CrossRef]
  50. Li, H.; Kawajiri, Y.; Grover, M.A.; Rousseau, R.W. Modeling of Nucleation and Growth Kinetics for Unseeded Batch Cooling Crystallization. Ind. Eng. Chem. Res. 2017, 56, 4060–4073. [Google Scholar] [CrossRef]
  51. Lyczko, N.; Espitalier, F.; Louisnard, O.; Schwartzentruber, J. Effect of Ultrasound on the Induction Time and the Metastable Zone Widths of Potassium Sulphate. Chem. Eng. J. 2002, 86, 233–241. [Google Scholar] [CrossRef] [Green Version]
  52. Garside, J.; Gibilaro, L.G.; Tavare, N.S. Evaluation of Crystal Growth Kinetics From a Desupersaturation Curve Using Initial Derivatives. Chem. Eng. Sci. 1982, 37, 1625–1628. [Google Scholar] [CrossRef]
  53. Garside, J.; Gaska, C.; Mullin, J.W. Crystal Growth Rate Studies with Potassium Sulphate in a Fluidized Bed Crystallizer. J. Cryst. Growth 1972, 13–14, 510–516. [Google Scholar] [CrossRef]
  54. Steyer, C.; Promotionskommission, M.; Lorenz, H.; Sundmacher, K.; Mangold, M. Precipitation of Barium Sulfate in a Semi-Batch Stirred Tank Reactor: Influence of Feeding Policy on Particle Size and Morphology; Universitätsbibl Otto von Guericke University Library: Magdeburg, Germany, 2012. [Google Scholar]
  55. Jones, A.G.; Budz, J.; Mullin, J.W. Batch Crystallization and Solid-Liquid Separation of Potassium Sulphate. Chem. Eng. Sci. 1987, 42, 619–629. [Google Scholar] [CrossRef]
  56. Jones, A.G.; Mullin, J.W. Programmed Cooling Crystallization of Potassium Sulphate Solutions. Chem. Eng. Sci. 1974, 29, 105–118. [Google Scholar] [CrossRef]
  57. Jones, A.G.; Chianese, A. Fines Destruction During Batch Crystallization. Chem. Eng. Commun. 1987, 62, 5–16. [Google Scholar] [CrossRef]
  58. Senaputra, A.; Jones, F.; Fawell, P.D.; Smith, P.G. Focused beam reflectance Measurement for Monitoring the Extent and Efficiency of Flocculation in Mineral Systems. AIChE J. 2014, 60, 251–265. [Google Scholar] [CrossRef]
  59. Song, X.; Zhang, L.; Zhao, J.; Xu, Y.; Sun, Z.; Li, P.; Yu, J. Preparation of Calcium Sulfate Whiskers Using Waste Calcium Chloride by Reactive Crystallization. Cryst. Res. Technol. 2011, 46, 166–172. [Google Scholar] [CrossRef]
Figure 1. Scheme of the experimental setup. 1 Temperature control system; 2 Universal stand; 3 250mL-Jacketed glass crystallizer; 4 Glass impeller; 5 Reservoir for saturated solution of KCl; 6 Vacuum pump; 7 Buchner flask; 8 Buchner funnel; 9 Pt-100 sensor; 10 Syringe needle; 11 FBRM probe; 12 Overhead stirrer; 13 ATR-FTIR probe; 14 Disposable syringe filter; 15 Syringe; 16 Data acquisition system.
Crystals 11 01558 g001
Figure 2. Supersaturation S, crystal/solution images and CLD for a reaction isotherm of 5 °C as a function of time at (a) 1.44 min, (b) 5 min, (c) 10 min, (d) 20 min, (e) 60 min and (f) CLD.
Crystals 11 01558 g002
Figure 3. Supersaturation S, crystal/solution images and CLD for a reaction isotherm of 25 °C as a function of time at (a) 1.20 min, (b) 10 min, (c) 30 min, (d) 60 min, and (e) CLD.
Crystals 11 01558 g003
Figure 4. CLDs obtained (a) at 5 min and (b) at 60 min, i.e., the final product, for different reaction isotherms.
Crystals 11 01558 g004
Figure 5. Correlation of the primary nucleation rate with So for reactive crystallization of K2SO4.
Crystals 11 01558 g005
Figure 6. Experimental and calculated nucleation rates Bexp [#/min·kg H2O] (symbols) and Bcal (line) as a function of time for different S0 obtained at 5, 15, 25, 35 and 45 °C.
Crystals 11 01558 g006
Figure 7. The growth rate of K2SO4 as a function of time at different S0 generated by reactive crystallization isotherms at 5, 15, 25, 35 and 45 °C.
Crystals 11 01558 g007
Figure 8. The fit of the empirical parameters g and kg.
Crystals 11 01558 g008
Figure 9. Suspension density of K2SO4 as a function of time at different S0 generated by reactive crystallization isotherms at 5, 15, 25, 35 and 45 °C.
Crystals 11 01558 g009
Figure 10. Dependence of the secondary nucleation rate constant K R on the reciprocal reaction temperature.
Crystals 11 01558 g010
Figure 11. X-ray powder patterns of K2SO4, MgSO4, picromerite and K2SO4 product obtained at reactive crystallization temperatures of 5, 15, 25, 35 and 45 °C (from bottom to top).
Crystals 11 01558 g011
Table 1. Pitzer ionic interaction parameters of electrolytes KCl, MgCl2 and MgSO4 at different temperatures.
Temperature [°C]Ionic Pair β i j ( 0 ) · 10 2 β i j ( 1 ) · 10 2 β i j ( 2 ) C i j · 10 4
5K+-Cl3.3818.31 8
Mg2+-Cl36.29157.02 87
Mg2+-SO42−19.49311.56−19.8823
15K+-Cl4.1620.35 −1
Mg2+-Cl35.69160.81 76
Mg2+-SO42−20.69324.94−28.6020
25K+-Cl4.8021.88 -8
Mg2+-Cl35.11165.12 65
Mg2+-SO42−21.51336.63−32.7717
35K+-Cl5.3323.18 −14
Mg2+-Cl34.54165.12 55
Mg2+-SO42−22.09347.10−32.9715
45K+-Cl5.7524.37 −18
Mg2+-Cl33.98175.30 45
Mg2+-SO42−22.55356.78−29.7113
Publisher’s Note: MDPI stays neutral with regard to jurisdictional claims in published maps and institutional affiliations.

