Abstract
Piezoelectric materials are used to harvest ambient mechanical energy from the environment and supply electrical energy via their electromechanical coupling property. Amongst many intensive activities of energy harvesting research, little attention has been paid to study the effect of the environmental factors on the performance of energy harvesting from laminated piezoelectric materials, especially when the temperature in the operating condition is different from the room temperature. In this work, thermomechanical effects on the electrical energy harvested from a type of laminated piezoelectric devices, known as thin layer unimorph ferroelectric driver (called THUNDER) were investigated. Three configurations of THUNDER devices were tested in a controlled temperature range of 30–80 °C. The THUNDER devices were pushed by using a cam mechanism in order to generate required displacements and frequencies. The experimental results exhibited a detrimental effect of the elevated temperature on the generated voltage and the harvested electrical power. It is due to changes in residual stress and geometry. These results are advantageous for many applications of the THUNDER devices and for future design of a new laminated piezoelectric sensor and energy harvester in an elevated temperature environment.
1. Introduction
Modern technological products, such as automobiles, need to respond to customer demands for improved safety and greater comfort and convenience. Complex sensor networks are employed to meet these requirements. The use of typical wired sensor networks has always been expensive because of installation and maintenance costs; so the use of wireless sensor networks (WSNs) has become ubiquitous. A WSN contains many of sensor nodes. These sensors have the ability to communicate either among each other or directly with an external base station [1]. However, the WSNs require their own power supply, which in most cases is conventional batteries. Disadvantageously, batteries have a limited lifetime, require frequent maintenance, and possibly contain hazardous chemicals leading to environmental concerns. Consequently, it is highly desirable for wireless devices to be operational and sustainable without requiring a battery or recharging process. The task of replacing a battery is tedious and often expensive, especially when sensors are located in a remote area.
These concerns can be potentially mitigated through the use of energy harvesting. Energy harvesting is the process of capturing ambient waste energy and converting it into usable energy for electrical devices to consume. Energy harvesting can be obtained from different energy sources such as solar, acoustic, human, thermal, and mechanical energy. Scavenging this type of energy to power wireless devices is a growing area of interest. Some of these waste energy can be harvested through the use of piezoelectric materials, which have the ability to convert mechanical energy into electrical energy or vice versa. These characteristics allow the materials to be used as an energy harvesting device.
Research in energy harvesting by employing piezoelectric materials has been initiated for quite some time. For examples, Antaki et al. proposed to extract useful energy from ambulation to provide supplemental power for operating artificial organs by using PZT-based piezoelectric stacks (made from lead zirconate titanate ceramic or PZT) in 1995 [2]. The piezoelectric transducer was mounted in a shoe. It consisted of a single cylindrical stack of 18 PZT ceramic slugs, each having a diameter of 0.32 inch and a thickness of 0.245 inch. The output power of 250–700 mW was extracted from a typical human weight of 75 kg during walking and over 2W from jogging. Umeda et al. in 1996 studied the mechanism of power generation from a piezoelectric vibrator. Mechanical energy is transformed into electrical energy with a steel ball impacting a piezoelectric vibrator [3]. The output of this generator over a resistive load was studied when a free steel ball was dropped onto it from various heights. The transformation efficiency at different heights and different resistive loads was in the range 5–9%. Although the efficiency obtained was rather low, this research indicated the potential of using a piezoelectric device to harvest energy.
Some other research dealt with optimizing the power harvesting configuration or improving circuitry to store the energy. In 2001, Park investigated the type of circuitry used to harvest the energy from piezoelectric devices [4]. Two different circuit models for a piezoceramic were analyzed theoretically and experimentally to study the electric impedance and phase angle of a piezoceramic. Kasyap et al. in 2002 used piezoelectric energy reclamation from mechanical vibrations. They also utilized the concept that the energy transfer from the piezoelectric to the load is maximum when the impedance of the two are matched and designed an appropriate circuit whose impedance could be modified. Vibration from a cantilever beam and a lumped element model was developed that resulted in 20% peak voltage efficiency [5]. Roundy et al. compared the power outputs of electrostatic and piezoelectric conversion mechanisms, obtained computationally and experimentally. The simulation results demonstrated that the potential power output of the PZT bimorph cantilever is significantly higher and showed that PZT prototype could generate a power density of 70 µW/cm3. Moreover, simulations by the same investigators indicated that an optimized device is able to generate 250 µW/cm3 from a vibration source with a frequency of 120 Hz and acceleration amplitude of 2.5 m/s2 [6,7].
In addition to traditional piezoelectric devices already mentioned, advanced piezoelectric transducers, such as curved multilayer piezoelectric composite transducers have a high potential for using as waste mechanical energy harvesters due to their reliability, durability, and flexibility. Early examples of this kind of devices are internally-biased oxide wafer (RAINBOW), which is a chemically reduced laminated piezoelectric [8,9], lightweight piezo-composite curved actuator (LIPCA), which is a thin layer assembly of a laminate of fiberglass, carbon and PZT [10], and thin layer unimorph ferroelectric driver (THUNDER), which is a laminated composite made of a ceramic active layer and other inactive elastic layers [11,12,13]. Some researchers recently investigated laminated piezoelectric devices composed of metamaterial-based substrates [14,15]. Auxetic structure having negative Poisson’s ratio were proposed as the passive elastic layers to improve the power output of the energy harvesters. The generated electrical power of the devices with the metamaterial substrates was several times as high as the power produced by an equivalent conventional harvester with a plain substrate. Evidently, the literature indicates the continuous research and development of the laminated devices and their variants as the auspicious energy harvesters.
The scope of this manuscript focuses on curved piezoelectric THUNDER devices produced by Face International Corporation [16]. THUNDER devices are selected for this study, since besides the advantages stated above, they are reported to exhibit high potential when they are used as energy generators, possess good compatibility with low frequency range applications, and have a steady commercial availability in various sizes and shapes; so a parametric study in the device geometry can be undertaken readily [13,16,17]. The devices are composed of piezoceramic (PZT5A) as the active layers, and aluminum and stainless steel as the inactive elastic layers. These layers are bonded together with LaRC-SI adhesive as illustrated in Figure 1. The hot-melt bonding process at 325 °C induces residual stresses in the THUNDER laminates when they are cooled down to room temperature due to the difference in the elastic moduli and thermal expansion coefficients between the layers. This results in curved-shape devices as shown in Figure 2. A variety of fundamental investigations of THHUNDER devices by experiments and computations by Mossi et al. [11] and Aimmanee et al. [12,18] showed the device characteristics of activated displacement under the application of electric field. Mossi et al. [19] also studied parameters that affect THUNDER actuation and energy harvesting. Parameters such as conductivity of the adhesive, composition, size, type and thickness of the layers were investigated. Wang et al. [13] investigated the energy harvesting performance of the THUNDER via experimental and analytical methods. The analytical results showed that the effect of radius of curvature on the output power was significant. However, according to the literature review, curved piezoelectric devices such as THUNDER have been studied as an actuator and energy harvester only at room temperature. To the best of authors’ knowledge, no research has been conducted about the influences of temperature on THUNDER devices in addition to variations of mechanical loading conditions, despite the fact that a temperature fluctuation could affect the performance of the device considerably. To address this, the purpose of the present work is to study the thermomechanical effects on the electrical energy harvested from THUNDER devices subjected to a variety of adjustable frequencies, pressing displacements, and temperatures.
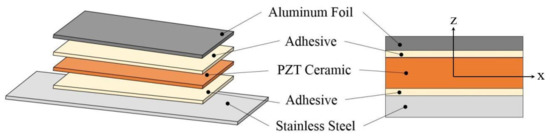
Figure 1.
Layout of a laminated piezoelectric device.
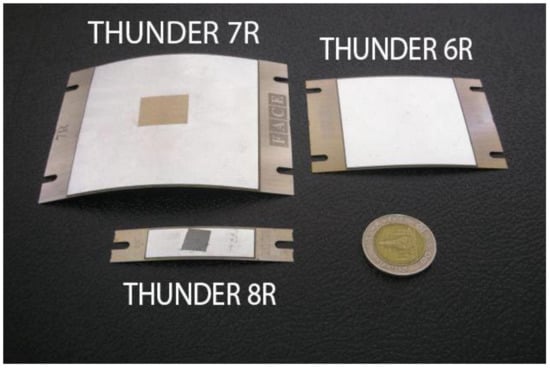
Figure 2.
Three types of THUNDER devices (6R, 7R and 8R).
2. Experimental Configuration
2.1. Characteristics of THUNDER Devices
In this research, a series of experiments was conducted to quantify the electrical signal and energy harvested from three types of THUNDER devices, i.e., 6R, 7R, and 8R, whose details are tabulated in Table 1. It is to be noted that 6R, 7R, and 8R are the model names of the THUNDER devices. The sets of THUNDER devices were manufactured from Face International Corporation [16]. The configurations are illustrated in Figure 2. Mechanical and electrical properties of materials used in the THUNDER devices are shown in Table 2.

Table 1.
Description of thin layer unimorph ferroelectric driver (THUNDER) devices.
Table 2.
Properties of THUNDER devices.
Before performing experiments on the THUNDER devices by varying the independent input parameters of displacement, excitation frequency, and surrounding temperature, the relevant characteristics of the THUNDER devices must be known. Hence, finite element analysis using the ABAQUS™ 6.14 (Dassault Systemes, France) was conducted to examine shapes at various temperatures as well as their natural frequencies and vibratory mode shapes (1st to 3rd mode shapes). Shell elements (S4R) were utilized with the laminate properties in the middle layup regions. Static and frequency analyses successively were selected in order to predict the deformed configurations of the THUNDER device at different temperatures and their corresponding dynamical Eigen systems. Vertical displacement constraint at four corners of the THUNDER devices was imposed in the static step to imitate the ambient-temperature configuration after cooled down from the elevated manufacturing temperature. In the frequency step, the shorter curved edges were restrained from moving in the vertical direction. This is because one of the shorter edges was restrained by duct tape and the other was pressed against the supporting floor in the experiments. The configuration provided the device with free in-plane motion except the tape restrained edge. The overall manufactured and mode shapes of the three types of THUNDER devices obtained from the finite-element simulations are shown in Figure 3. The numerical results of the central displacements (so called dome heights) at 30 °C, 55 °C, and 80 °C and the corresponding natural frequencies at these temperatures are presented in Table 3. It is clearly seen that geometrical nonlinearities play a crucial role in the manufactured shapes because the devices form cylindrical configurations with the associated dome heights several times as large as the devices’ total thicknesses. The residual stresses induced by the high-manufacturing temperature in all stacking layers of the THUNDER transducers at 30 °C and 80 °C are illustrated in Figure 4. The figure shows that the higher temperature is, the lower residual stresses are developed. The differences between the residual stresses developed in the x- and y-directions are also one of the indicators elaborating the level of geometry factor on the devices’ shapes [12]. The larger difference means the stronger geometrical nonlinearities introduced in the THUNDER transducers. Obviously, THUNDER 8R possesses the smallest difference in residual stresses along the two direction.
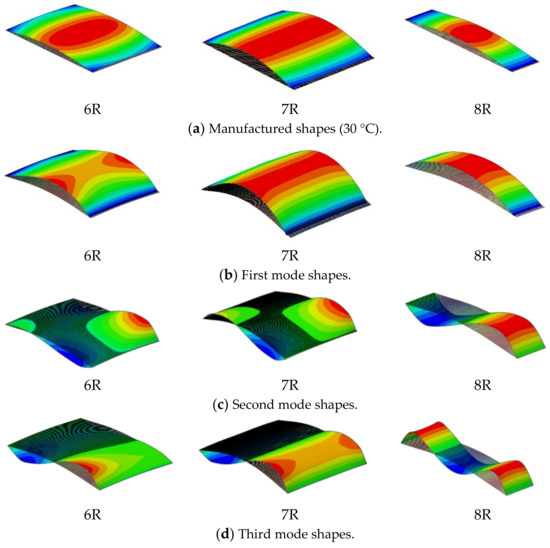
Figure 3.
Manufactured and mode shapes of different THUNDER devices (the color represents the deformation). (a) Manufactured shapes. (b) First natural frequency mode shape. (c) Second natural frequency mode shape. (d) Third natural frequency mode shape.
Table 3.
Characteristics of THUNDER devices at different temperatures.
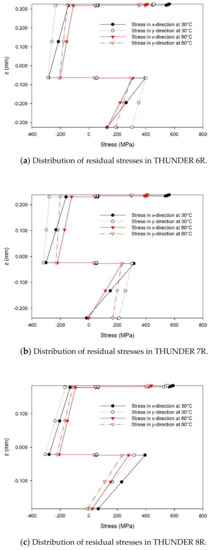
Figure 4.
Residual stresses in various THUNDER devices. (a) Distribution of the residual stresses in THUNDER 6R. (b) Distribution of residual stress of THUNDER 7R. (c) Distribution of residual stress of THUNDER 8R.
The numerical results in Table 3 show that the dome heights h of all three types of THUNDER devices are fairly reduced with an increase in the temperature due to the lower values of the residual stresses in the transducers stated above. The dome height of the THUNDER device decreases by 20%, 18% and 15% with 50 °C rise in temperature, for 6R, 7R and 8R, respectively. The lower dome heights additionally indicate smaller longitudinal curvatures and lower flexural stiffness when THUNDER devices are subjected to transverse loading. In regards to the dynamical behavior, amongst the variants considered, THUNDER 6R has the highest natural frequencies, more than 200 Hz for the first mode. The device with second highest fundamental frequency of around 150 Hz is THUNDER 8R. THUNDER 7R, albeit associated with the highest dome height, possesses the lowest 1st mode resonant frequency of about 100 Hz. These dynamical characteristics evidently signify the largest structural stiffness per unit mass of THUNDER 6R. In addition, the natural frequencies for the three types of the actuators are decreased slightly with the increases in temperature as listed in Table 3. This phenomenon also confirms higher bending compliance caused by the heating process. These characteristics obtained from the finite-element modelling will be used for setting-up the experiment.
2.2. Displacement and Frequency Measurement Setup
The experimental setup is illustrated in Figure 5. As stated previously, three different configurations of THUNDER devices, namely, 6R, 7R, and 8R, were investigated. Each device was placed on a thick glass plate and mounted at the two opposite tab edges on the plate with duct tape. This constraint was rigid enough to prevent the THUNDER device from hopping during the mechanical excitation, but it was sufficiently free to allow slight in-plane movements of the restrained edges. The tested piezoelectric device was installed in a specially designed chamber with a temperature controller. Through a small opening at the top of the chamber, a specified mechanical excitation was periodically applied to the device at its central point by using the overhead cam-rod mechanism. This setup was convenient to regulate pushing frequency and displacement without getting access to the chamber while the system was operating at a high temperature.
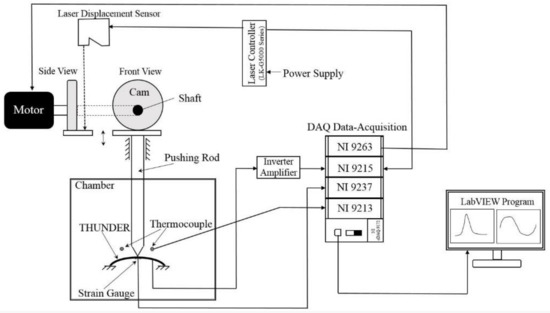
Figure 5.
Schematic diagram of the experimental setup.
Experiments were conducted to quantify the electrical energy harvested from the different types of thermally pre-stressed piezoelectric THUNDER devices. The range of pushing displacement is carefully specified by the dome-heights given in Table 3. Oscillating displacements were controlled by using an eccentric cam because of its simplicity and precision. The eccentric circular cam converted rotating motion generated from a motor to reciprocating movement thru a pushing rod and produced pure sinusoidal excitation to the THUNDER device. In this work, there were five different cams, of which axis offsets (e) were 0.2, 0.5, 0.8, 1.1, and 1.4 mm for five different pushing strokes (δ) of 0.4, 1.0, 1.6, 2.2, and 2.8 mm, respectively. Note that eccentric circular cam-rod mechanism always provides the geometric relation 2e = δ. The cams were made of steel with a solid cylindrical shape and a bore-hole for shaft mounting. The precise displacement of the THUNDER device was verified by a LK-H052 laser displacement sensor, which subsequently were utilized to detect the vertical motion of the rod and measured its displacement. Thus, the actual displacement of the THUNDER devices was monitored throughout the experiments. Continuous contact between the surfaces of the cam and the pushing rod was to be maintained at all time by a coil spring installed under the pushing rod head. According to rigid-body motion analysis, the minimum spring constant required was 11.46 kN/m.
The sinusoidal displacement function generated by the mechanism can be written in Equation (1), where d represents the pushing displacement, which depends on the motion of the cam. f is rotational frequency and t is time.
For signal management NI CompactRIO I/O Modules were utilized to provide the fundamental control, data acquisition, and monitoring experimental setup. Along with a computer command from LabVIEW software, NI 9263 digital to analog module was used to regulate the revolution per minute of an AC servo motor model MSMD042G1U manufactured by Panasonic Corporation. The analog to digital module NI 9215 was used to acquire signals from laser displacement sensor to monitor displacements of the rod in a computer.
Initially, the AC voltage generated from the THUNDER device for each displacement and frequency was measured at various temperatures. Since the voltage generated from the THUNDER devices was too high for NI 9215 to directly gain the signals, an inverter amplifier was needed to reduce the magnitude of voltage to an acceptable level. The circuit diagram and its associate equation of the inverter amplifier are shown in Figure 5 and Equation (2), respectively.
In Equation (2), R1 and R2 are resistance values of the resistors in the inverter circuit shown in Figure 6. They were chosen to be 100 Ω and 10 Ω, respectively. The negative sign in Equation (2) indicates phase changing of the signal by 180°. Thus, to convert the phase of the voltage signal back to the original, one more inverter amplifier with values of R1 and R2 equal to 10 Ω was connected in series with the former one. Furthermore, a thermocouple module NI 9213 was utilized to measure and control the temperature in the chamber during testing, whereas NI 9237, simultaneous bridge module for use with CompactDAQ, was employed for measuring strains on the bottom surface of the THUNDER device when being pressed by the eccentric circular cam-rod mechanism.
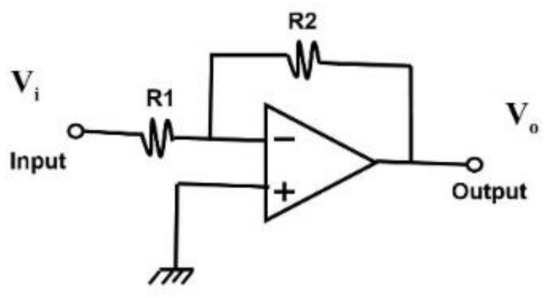
Figure 6.
Inverter amplifier circuit.
2.3. Temperature Setup
Temperature is one of the most crucial independent parameters in the experiment. A specially designed oven with a thermostat temperature controller shown in Figure 7 is chosen for keeping the temperature constant at the desired values. The temperature in the chamber was varied from 30 to 80 °C in an increment of 25 °C. This range was chosen due to the potential applications in typical environments, such as an engine compartment. The oven had a double walled insulation that reduced heat transfer from the system. The inner layer as a good insulator was made of ceramic, while the outer layer as a main structure was metallic. An air circulating fan inside the oven produced a uniform temperature distribution in the chamber including the THUNDER device inside. Two thermocouples were also installed in the oven and used to monitor the surrounding and top surface temperature of the THUNDER device. The experiments were conducted only when the temperature in the oven reached steady state for at least 30 min.
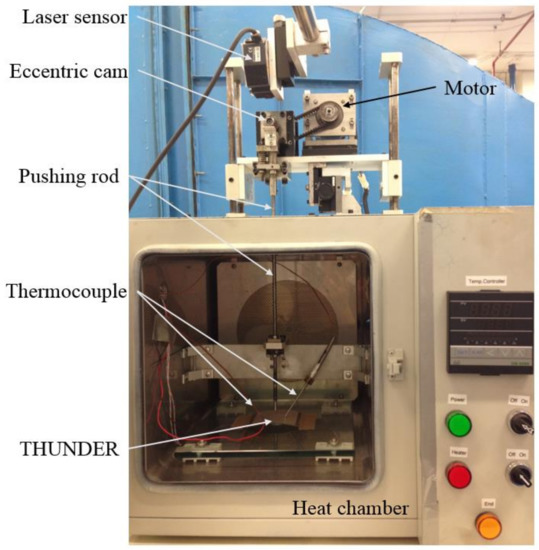
Figure 7.
Heat chamber with a THUNDER device.
2.4. Energy Harvesting Circuit
In the second experiment, the rectifier circuit was chosen as the energy harvesting circuit because of its simplicity and small power consumption. A schematic of this circuit is shown in Figure 8. This circuit consisted of a full wave bridge rectifier which was connected in parallel with the THUNDER device. A full wave bridge rectifier was used to convert AC to DC using a system of four diodes arranging in such a way that the polarity input was the same as the polarity output. The output voltage deviated from a constant DC voltage by a parameter called a ripple voltage. When a capacitor was added in parallel in Figure 8 ripples were smoothened and transients were filtered [20]. During the testing, a carefully selected capacitor and a load resistor were added to the rectifier circuit. The filtering capacitance which is much larger than the capacitance of the THUNDER device was selected in order to gain constant voltage outputs. The output DC voltage was measured by a LCD digital multimeter. The power output of the energy harvesting can be calculated from the Equation (3).
where P is the power, V is the output voltage, and R is the load resistor.
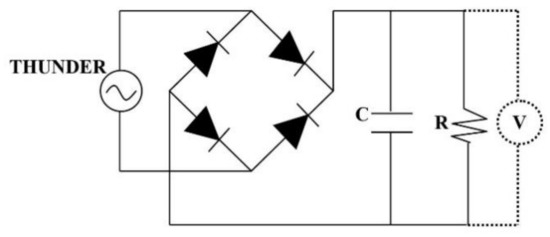
Figure 8.
Energy harvesting circuit.
According to Table 4, there are two stages of this experiment. In the first experiment, the peak-to-peak AC voltages generated from the THUNDER device for each displacement and frequency were measured at various temperatures. In the second experiment, the rectifying circuit shown in Figure 8 was connected in parallel with the THUNDER device.
Table 4.
Summary of the experimental setup.
3. Results and Discussion
The electrical energy generated from the THUNDER devices was measured as a function of the mechanical displacement and frequency during the temperature changes. The maximum displacement in this experiment was specified to be different from various types of devices owing to their structural limitation. The pushing displacements of THUNDER 6R device were 0.4, 1.0 and 1.6 mm. For THUNDER 7R device the displacements were 0.4, 1.0, 1.6, 2.2 and 2.6 mm. The displacement of THUNDER 8R was only 0.4 mm. The excitation frequencies, on the other hand, were varied from 10 Hz to 60 Hz for all types of THUNDER transducer. It must be noted that the experiment was deliberately carried out by applying a localized central displacement to the devices that were weakly taped on one of the shorter edges and letting the opposite edge move freely on the level surface. This arrangement was intended to minimize undesirable changes in the manufactured shapes and ensued stresses caused by an unnecessarily large loaded area or a rigidly fixed support. With the minimal constraints, the thermal effect on the harvested energy from the curved multilayer piezoelectric composite transducers could be unambiguously observed. In this particular setup, an application of displacement and frequency higher than the stated limitation up to the fundamental frequencies can trigger asynchronous and chaotic motion relative to the pushing rod and it is avoided to prevent physical damage to the THUNDER devices.
It should also be remarked that friction at the contact point between pushing rod and the piezoelectric device unavoidably occurred. However, heat generated and accumulated due to the friction at the local point is insignificant because of only a small number of cycles (usually less than 30 cycles) conducted in each round of experiment and discontinuity in testing between different conditions. In addition, the THUNDER devices were always carefully checked for irregularities or damages right after an experiment was performed and the temperature increment due to the friction was not detected.
3.1. Effect of Displacement and Frequency on Peak-to-Peak Voltage at Room-Temperature
Figure 9 shows the peak-to-peak voltage of the THUNDER actuators with pushing displacement at 30 °C. As anticipated, all THUNDER devices generated higher peak-to-peak voltages when the displacement is increased. For THUNDER 6R, the highest peak-to-peak voltage is generated around 90 volts at a displacement of 1.6 mm and a frequency of 60 Hz. On the contrary, because THUNDER 7R has a higher curved cylindrical shape and can be compressed more than that of THUNDER 6R, it can create peak-to-peak voltage about 120V at displacement of 2.8 mm. THUNDER 8R, the smallest among the three types of devices, has the least electrical field output of around 5 V peak-to-peak voltage at a displacement of 0.4 mm. By comparing the peak-to-peak voltages among the THUNDER 6R, 7R and 8R devices at δ = 0.4 mm and between THUNDER 6R and 7R devices at δ = 1.0 mm, THUNDER 7R generates the highest peak-to-peak voltage followed by the second-ranked THUNDER 6R, while THUNDER 8R created the lowest electrical voltages at every frequency.
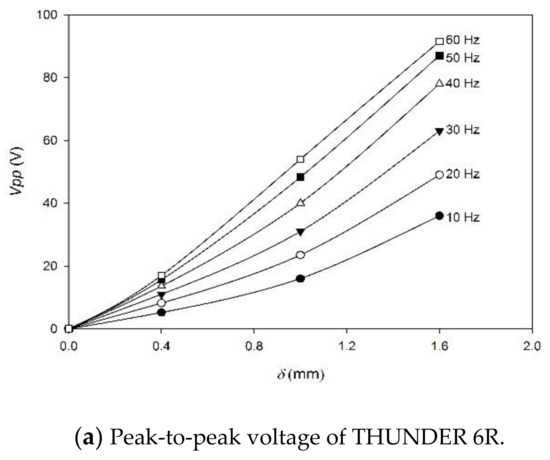
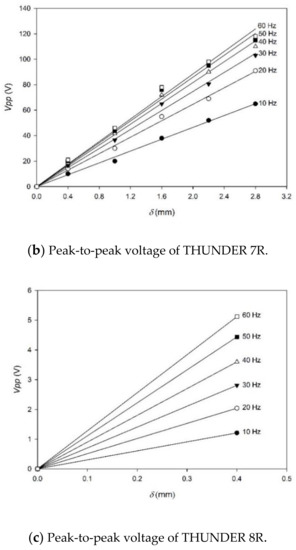
Figure 9.
Variation of the peak-to-peak voltage with displacement for different frequencies at 30 °C for the different THUNDER devices. (a) THUNDER 6R. (b) THUNDER 7R. (c) THUNDER 8R.
The overall electromechanical characteristics of the THUNDER devices should also be pointed out. The amplitude of the alternating voltage generated in Figure 9 typically shows linear trends with displacement over the range of frequencies tested. This phenomenon can be noted from the relationship of the peak-to-peak voltage (Vpp) with pushing central displacement (δ), expressed in Equation (4) with the underlined assumptions of linear material properties and small deflections. The derivation of the equation is given in Appendix A.
where d31 is piezoelectric strain coefficient, elastic compliance, and dielectric permittivity of the piezoceramic layer. ζ the damping ratio, and r the frequency ratio. However, for THUNDER 6R, the nonlinear relations can be clearly seen at the large pushing displacements and low frequencies. Such a behavior is due to the combined effects of geometrical nonlinearity and stiffness of the device, both associated with the first parentheses on the right side of Equation (4). The former effect is induced by the relatively large deflection compared to the dome height (δmax/h ≈ 0.41 for THUNDER 6R, 0.30 for 7R, and 0.13 for 8R), which instigates the higher power of δ, while the latter deals with the domination of the high structural stiffness in parameter of THUNDER 6R over the material and frictional damping contributed from the curly brackets at slow cyclic motions. This nonlinear behavior is gradually superseded by the damping terms at the higher frequencies. Macroscopically, the damping terms cause energy dissipation from the system, weakens the electrical responses, and provides disproportionate increasing peak-to-peak voltage with respect to frequency increment.
Figure 10 demonstrates the thermal effect on the electrical response of all the THUNDER devices. As can be seen, when the temperature rises, the peak-to-peak voltage of all the devices drops to a certain extent, giving the negative percentage changes in peak-to-peak voltage. The relationship in the figure indicates that temperature can have a detrimental impact on the generated voltage and in overall, the percentage changes in peak-to-peak voltage have the linear relationship with the temperature change. It should be remarked here that the Young’s moduli of aluminum, stainless steel, and PZT5A (or EC-65) are slightly affected by the temperature increment of 50 °C (around 4% [21], 2% [22], and 1% [23] reduction respectively). The properties of PZT5A, i.e., piezoelectric strain coefficient d31, and dielectric permittivity , in contrast, are increased moderately in magnitude with the temperature change by 9% and 17%, respectively [24]. Therefore, by employing Equation (4), the only alteration in the electromechanical properties can be estimated to reduce the peak-to-peak voltage by roughly 7%. This certainly indicates that the significant reduction in voltage up to almost 40% illustrated in Figure 10 does not merely result from the effect of temperature on the material properties, but it is predominantly contributed from the lower residual stresses and less curvatures in the THUNDER devices in the heated environment. The latter unfavorable phenomenon in the decreasing overall electromechanical coupling is evident at the low pushing displacements and frequencies, since the energy dissipation due to damping is not yet sufficiently high to dominate the influence of residual stress.
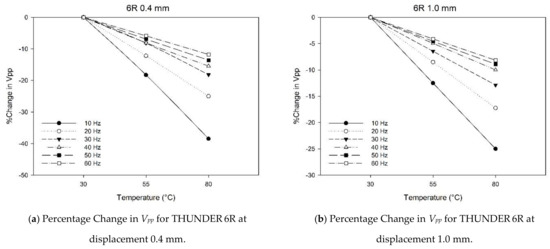
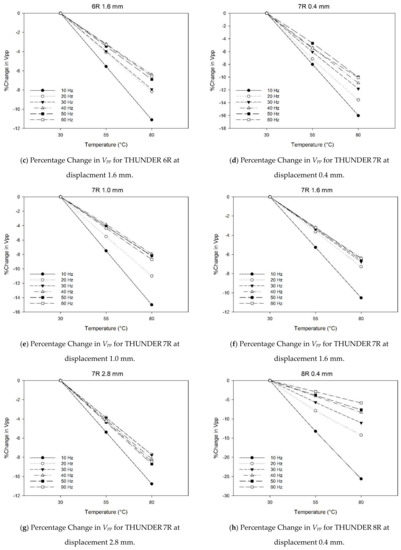
Figure 10.
Percentage Change in peak-to-peak voltage of THUNDER 6R, 7R and 8R versus temperature at various frequencies and pushing displacements. (a) THUNDER 6R–displacement 0.4 mm. (b) THUNDER 6R–displacement 1.0 mm. (c). THUNDER 6R–displacement 1.6 mm. (d) THUNDER 7R–displacement 0.4 mm. (e) THUNDER 7R–displacement 1.0 mm. (f) THUNDER 7R–displacement 1.6 mm. (g) THUNDER 7R–displacement 2.8 mm. (h) THUNDER 8R–displacement 0.4 mm.
It can also be observed from the figure that when the excitation frequency in THUNDER 6R and 7R increases, percentage changes in peak-to-peak voltage coalesces in particular for the larger central displacements. The behaviors are caused by the system damping subjected to a harmonic excitation below the fundamental frequency, since the reduction of the voltage mainly generated results from sliding friction of the moving THUNDER transducers relative to the stationary supporting plate when the THUNDER is mechanically activated faster.
3.2. Voltage Output with Resistive Load of the THUNDER Device at Different Temperatures and Frequencies
The second part of the work dealt with measuring voltage with the THUNDER device connected in parallel to a full wave rectifier, a resistive load and a capacitive load. The connected circuit converts the AC output to a DC voltage. A resistive load is used to test the capabilities of this system for power generation. The set of resistors considered here ranged from 10 to 5000 kΩ. Voltage generated was recorded at different loads and the tests were repeated at all temperature, displacement and frequency combinations. The range of temperature tested was from 30 °C to 80 °C with an increment of 25 °C.
Without loss of generality, the results of THUNDER 6R is presented merely in this section. The THUNDER 6R device was compressed with the frequencies ranging from 10–60 Hz. The peak-to-peak voltage at the displacement of 1.6 mm and the temperature of 30 °C is shown in Figure 11a. This displacement condition is chosen due to relatively strong nonlinearities observed in Figure 9a. As far as the fundamental vibration mode of this particular unimorph is concerned, the lowest resistance (R = 10 kΩ) used here provide virtually short-circuit conditions, whereas the larger loads (R > 1000 kΩ) are close to open-circuit conditions. From the nature of these plots, the output voltage increases with an increasing resistive load and then becomes saturated upon further increase in resistive loading. Moreover, as the applied frequency is increased from 10 to 60 Hz with an increment of 10 Hz, the output voltage increases monotonically with frequency. Specifically, the voltage output for the exact short-circuit condition with zero external resistance (R = 0) should be zero, which would not allow a voltage response to be defined. At the other extreme of the open-circuit condition (R→ ∞), the voltage output at every frequency approaches its maximum value. The highest voltage generated from THUNDER 6R is almost 50 volts at the resistance of 5000 kΩ, the displacement of 1.6 mm, the frequency of 60 Hz and temperature of 30 °C.
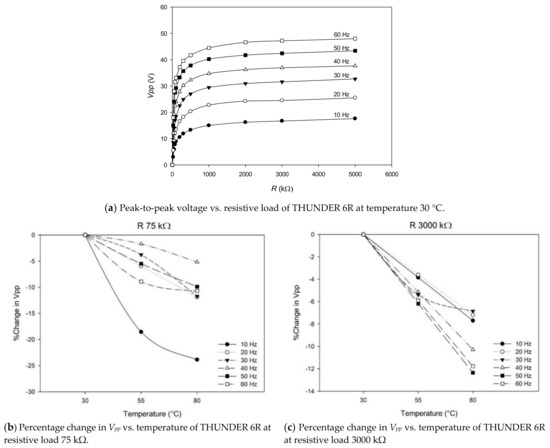
Figure 11.
Peak-to-peak voltage and its percentage changes of THUNDER 6R at δ = 1.6 mm. (a) Peak-to-peak voltage at 30 °C under resistive loads. (b) Percentage change in peak-to-peak voltage vs. temperature at R = 75 kΩ. (c) Percentage change in peak-to-peak voltage vs. temperature at R = 3000 kΩ.
Compared to the peak-to-peak voltage at 30 °C, the percentage reduction of Vpp due to the temperature increment in the cases of R = 75 kΩ and R = 3000 kΩ is illustrated in Figure 11b,c, respectively. The electrical load of 75 kΩ resistance is taken into consideration because it reveals the transition point between linear and nonlinear regions illustrated in Figure 11a, while R = 3000 kΩ is chosen to represent the high resistive load that makes Vpp virtually steady. As seen, the percentage change in the peak-to-peak voltage corresponding to the lower resistance shows marked nonlinearities in the relation with the increasing temperature, being in contrast to that presented in Figure 9. At the lowest frequency, the amplitude of generated voltage drops around 25% at the temperature of 80 °C. On the other hand, when the higher resistive load is considered, the relations between the percentage change in Vpp and temperature at the different frequencies become close to linear. The maximum reduction in the voltage amplitude is approximately 12.5% at the most elevated temperature, and it is slightly higher than the maximum decrement in the voltage amplitude in the case of open circuit in Figure 10c.
3.3. Maximum Power Output of the THUNDER Device
In this section, the nature of power output P for excitations at different frequencies and temperatures is given in Figure 12. It can be recalled from Figure 11a that the voltage outputs obtained tend to increase linearly with increasing load resistance for the low values of load resistance and become saturated at higher resistive load. Since the power output is simply the square of voltage divided by the resistive load as shown in Equation (3), the variation of power with load resistance in Figure 12a is, as a result, steeply amplified at the beginning and promptly lessened when R is higher than the optimal value. The power output is asymptotically approached zero at very large R. It is important to note that the power measured was of a rectified signal, not the sinusoidal output of the THUNDER device, so it directly presents the quantitative depiction of the useful power output of these devices for wireless sensor networks (WSNs) and other electronic applications.
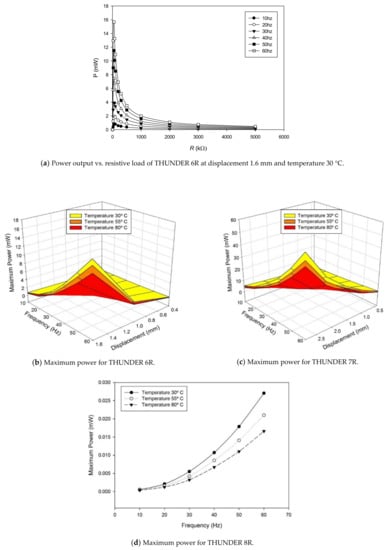
Figure 12.
Power output and maximum power variation with input displacement and frequency of the THUNDER devices at different temperatures. (a) Power output of THUNDER 6R at displacement 1.6 mm and temperature 30 °C under resistive loads. (b) Maximum power of THUNDER 6R. (c) Maximum power of the THUNDER 7R. (d) Maximum power of THUNDER 8R.
According to Figure 12a, the highest power outputs are achieved when the perfect impedance matching between THUNDER devices and the resistive load is established. P is maximized at the different optimal load resistance R for different frequencies. For example, in the case of the THUNDER 6R device at 1.6 mm displacement and 30 °C, the maximum power output of 0.8 mW is acquired at R = 75 kΩ and the frequencies of 10 Hz, whereas the power output of 15.7 mW is obtained at 50 kΩ and 60 Hz. Even though the shift in the optimal resistive load value is not so significant, it can be noticed that the higher the frequency the lower the optimal R. This shows the variation in the intrinsic electrical properties of the piezoceramic material in the device with the applied frequency.
The electrical energy harvesting performance diagrams of the maximum power output with the different pushing frequencies, displacements, and temperatures are shown in Figure 12b–d. The subfigures depict the variation of maximum power of the THUNDER 6R, THUNDER 7R and THUNDER 8R, respectively. It is important to note that the power measured was of a rectified signal, not the sinusoidal output of the THUNDER device, so it directly presents the quantitative depiction of the useful power output of these devices for wireless sensor networks (WSNs) and other electronic applications. As can be seem, when the applied displacements in Figure 12b,c are small, the maximum power is increased almost linearly when the frequency increases. Similarly, the linear relationships between the maximum power vs. displacement are also exhibited at small values of frequency. However, when the central deflection (or frequency) is comparatively large, the maximum power clearly becomes a function of the square of applied excitation frequency (or displacement) as illustrated in the last three subfigures.
The effect of the elevated temperatures on the maximum power can also be visualized in Figure 12. Overall, the maximum power reduces almost linearly with respect to the temperature increments. The amount of reduction is quite substantial, even though the decrease of peak-to-peak voltages due to the temperature changes plotted in Figure 10 seems to be not very high. The highest decrements in the power output for THUNDER 6R, THUNDER 7R, and THUNDER 8R are 30% at δ = 1 mm, f = 20 Hz, 32% at δ = 2.8 mm, f = 10 Hz, and 42% at δ = 0.4 mm, f = 30 Hz, respectively. The present experiments, therefore, corroborate the stress-dependency of electromechanical characteristics of the piezoelectric material in the devices [25,26]. The weakening of the power output is caused by the reduction of biaxial compressive residual stresses in the PZT layer, which can deteriorate its intrinsic properties. The higher operating temperatures also subside effect of geometrical nonlinearities produced during manufacturing process and reduce the overall stiffness of the THUNDER devices.
4. Conclusions
The effect of pushing frequency, displacement, and temperature on the energy harvesting performance of three types of the THUNDER devices, 6R, 7R and 8R, was studied. The laminated piezoelectric device was mechanically activated using a cam-rod mechanism. In the first part of this work, the AC voltage output generated by the THUNDER devices was measured, while in the second part the rectifier circuit was connected in parallel with the THUNDER device to covert AC voltage to DC signal. A load and a capacitor were also added to the circuit to study the power of the device. In both phases of the work, the temperature effects were investigated to quantify their impact on the performance of the THUNDER devices. The testing results can be summarized as follows:
- Amongst all types of the devices studied, the THUNDER 7R is capable of generating highest peak-to-peak voltage and maximum power output at the same pushing frequency and displacement due to being the biggest in overall size. It also can carry the highest applied central displacement because of possessing the largest dome height.
- The electrical outputs of THUNDER 6R show evident nonlinear behaviors with the mechanical excitations, because geometrical nonlinearities are strongly induced in the devices during the displacement loadings and the elevated-temperature manufacturing process
- A high temperature has an adverse effect on electric energy harvested from the curved laminated piezoelectric transducers and it has stronger influence on low frequency range. The maximum power of a THUNDER device can be reduced by 40% at the temperature of 80 degrees Celsius.
In conclusion, the results from the present studies can be used as a guideline for selecting a suitable THUNDER device as an energy harvester in an elevated-temperature environment in order to have the maximum output performance.
Author Contributions
Conceptualization, S.A. and P.L.; methodology, S.A. and P.T.; formal analysis, P.T., S.A., and R.D.; investigation, P.T.; writing—Original draft preparation, P.T.; writing—Review and editing, P.T., S.A., R.D.; supervision, S.A.; funding acquisition, S.A. and P.L. All authors have read and agreed to the published version of the manuscript.
Funding
This research was funded by Thailand Graduate Institute of Science and Technology (TGIST), National Science and Technology Development Agency, contract number TG-33-20-56-012M and Thailand Science Research and Innovation (TSRI) Basic Research Fund: Fiscal year 2021 under project number 64A306000054.
Institutional Review Board Statement
Not applicable.
Informed Consent Statement
Not applicable.
Data Availability Statement
The data presented in this study are available on request from the corresponding author.
Acknowledgments
The authors acknowledge National Science and Technology Development Agency and Thailand Science Research and Innovation (TSRI) for the research grants.
Conflicts of Interest
The authors declare no conflict of interest.
Appendix A
Consider the lump mass model shown below in Figure A1.

Figure A1.
Lump mass model for a THUNDER device.
From Newton’s law [27], the Equations of motion are
where m is lump mass of a THUNDER device. Quantities k1, k2 are equivalent spring constants, as well as c1 and c2 denote equivalent damping coefficients. Note that k1, k2, c1 and c2 are treated to be constant and independent of vertical displacements and for the linear model.
Rearranging Equation (A1) yields:
Defining
We obtain the Equation of motion in the form
We can assume that the mass undergoes harmonic motion with the same frequency as the pushing displacement. The solution is thus written as:
Substituting into Equation of motion (A3) yields
As and , substituting into Equation (A2) and rearranging yields
Comparing the coefficients of and cos; we will get:
Hence, it can be obtained that
From Equations (A7) and , we get
If we assume and rearrange terms
Analogous to the sensor Equation of a unimorph benders formulated in [28], X1 is the amplitude of input displacement δ. X2 can be correlated with the output voltage Vpp. Thus, the peak-to-peak output voltage can be approximately expressed as:
In Equation (A10), the quantities d31, , and are piezoelectric strain coefficient in 31 mode, elastic compliance in the longitudinal (x-) direction, and dielectric permittivity in the thickness (z-) direction of the piezoelectric material in the THUNDER transducer. K is a proportional parameter that is a function of the dimension of the device and elastic moduli of the constituent materials. The dimensionless term is absorbed into K.
References
- Kumar, M.S.; Gopinath, M. Routing Issues in Wireless Sensor Networks: A Survey. Int. J. Adv. Res. Comput. Sci. Softw. Eng. 2013, 3, 452–457. [Google Scholar]
- Antaki, J.; Bertocci, G.; Green, E.; Nadeem, A.; Rintoul, T.; Kormos, R.; Griffith, B. A Gait-Powered Autologous Battery Charging System for Artificial Organs. ASAIO J. 1995, 41, M588–M595. [Google Scholar] [CrossRef]
- Umeda, M.; Nakamura, K.; Ueha, S. Analysis of the Transformation of Mechanical Impact Energy to Electric Energy Using Piezoelectric Vibrator. Jpn. J. Appl. Phys. 1996, 35, 3267. [Google Scholar] [CrossRef]
- Park, C.H. On the Circuit Model of Piezoceramics. J. Intell. Mater. Syst. Struct. 2001, 12, 515–522. [Google Scholar] [CrossRef]
- Kasyap, A.; Lim, J.; Johnson, D.; Horowitz, S.; Nishida, T.; Ngo, K.; Sheplak, M.; Cattafesta, L. Energy Reclamation from a Vibrating Piezoceramic Composite Beam. In Proceedings of the 9th International Congress on Sound and Vibration, Orlando, FL, USA, 8–11 July 2002. [Google Scholar]
- Roundy, S.; Wright, P.K.; Rabaey, J. A Study of Low Level Vibrations as a Power Source for Wireless Sensor Nodes. Comput. Commun. 2003, 26, 1131–1144. [Google Scholar] [CrossRef]
- Roundy, S.S.; Wright, P.K.; Rabaey, J. Energy Scavenging for Wireless Sensor Networks; Kluwer Academic Publishers: Boston, MA, USA, 2004. [Google Scholar]
- Li, G.; Furman, E.; Haertling, G.H. Stress-Enhanced Displacements in PLZT Rainbow Actuators. J. Am. Ceram. Soc. 1997, 80, 1382–1388. [Google Scholar] [CrossRef]
- Aimmanee, S.; Chutima, S.; Hyer, M.W. Nonlinear Analysis of RAINBOW Actuator Characteristics. Smart Mater. Struct. 2009, 18, 045002. [Google Scholar]
- Goo, N.S.; Yoon, K.J. Analysis of Lipca-C Actuators. Int. J. Mod. Phys. B 2003, 17, 1959–1964. [Google Scholar] [CrossRef]
- Mossi, K.M.; Bishop, R.P. In Characterization of Different Types of High-Performance THUNDER Actuators. Smart Structures and Materials 1999: Smart Materials Technologies. Int. Soc. Opt. Photonics 1999, 3675, 43–52. [Google Scholar]
- Aimmanee, S.; Hyer, M.W. Analysis of the Manufactured Shape of Rectangular THUNDER-Type Actuators. Smart Mater. Struct. 2004, 13, 1389–1406. [Google Scholar] [CrossRef]
- Wang, F.; Wang, Z.; Soroush, M.; Abedini, A. Energy Harvesting Efficiency Optimization via Varying the Radius of Curvature of a Piezoelectric THUNDER. Smart Mater. Struct. 2016, 25, 095044. [Google Scholar]
- Farhangdoust, S.; Georgeson, G.; Ihn, J.; Chang, F. Kirigami Auxetic Structure for High Efficiency Power Harvesting in Self-Powered and Wireless Structural Health Monitoring Systems. Smart Mater. Struct. 2020, 30, 015037. [Google Scholar] [CrossRef]
- Farhangdoust, S. Auxetic Cantilever Beam Energy Harvester; Smart Structures and NDE for Industry 4.0, Smart Cities, and Energy Systems. Int. Soc. Opt. Photonics 2020, 11382, 113820V. [Google Scholar]
- Face International Corporation, 427 West 35th Street Norfolk, Virginia 23508. Available online: https://facecompanies.com (accessed on 28 January 2021).
- Yoon, H.; Washington, G.; Danak, A. Modeling, Optimization, and Design of Efficient Initially Curved Piezoceramic Unimorphs for Energy Harvesting Applications. J. Intell. Mater. Syst. Struct. 2005, 16, 877–888. [Google Scholar] [CrossRef]
- Aimmanee, S.; Hyer, M.W. A Comparison of the Deformations of Various Piezoceramic Actuators. J. Intell. Mater. Syst. Struct. 2006, 17, 167–186. [Google Scholar]
- Mossi, K.; Green, C.; Ounaies, Z.; Hughes, E. Harvesting Energy Using a Thin Unimorph Prestressed Bender: Geometrical Effects. J. Intell. Mater. Syst. Struct. 2005, 16, 249–261. [Google Scholar] [CrossRef]
- Horowitz, P.; Hill, W. The Art of Electronics; Cambridge University Press: Cambridge, MA, USA, 1989. [Google Scholar]
- Zhang, Y.; Yi, Y.; Huang, S.; He, H. Influence of Temperature-Dependent Properties of Aluminum Alloy on Evolution of Plastic Strain and Residual Stress during Quenching Process. Metals 2017, 7, 228. [Google Scholar] [CrossRef]
- Kim, B.G.; Rempe, J.L.; Knudson, D.L.; Condie, K.G.; Sencer, B.H. In-Situ Creep Testing Capability for the Advanced Test Reactor. Nucl. Technol. 2012, 179, 417–428. [Google Scholar] [CrossRef]
- Sabat, R.G.; Mukherjee, B.K.; Ren, W.; Yang, G. Temperature Dependence of the Complete Material Coefficients Matrix of Soft and Hard Doped Piezoelectric Lead Zirconate Titanate Ceramics. J. Appl. Phys. 2007, 101, 064111. [Google Scholar] [CrossRef]
- Zhang, Q.M.; Wang, H.; Zhao, J. Effect of Driving Field and Temperature on the Response Behavior of Ferroelectric Actuator and Sensor Materials. J. Intell. Mater. Syst. Struct. 1995, 6, 84–93. [Google Scholar] [CrossRef]
- Krueger, H.; Berlincourt, D. Effects of High Static Stress on the Piezoelectric Properties of Transducer Materials. J. Acoust. Soc. Am. 1961, 33, 1339–1344. [Google Scholar] [CrossRef]
- Mcksry, S.T.I. Stress-Dependent Piezoelectric Properties of Ferroelectric Lead Zirconate Titanate Films Studied by Atomic Force Microscopy. J. Korean Phys. Soc. 1998, 32, s1464–s1467. [Google Scholar]
- Rao, S.S. Mechanical Vibrations; Addison-Wesley Publishing Company: Boston, MA, USA, 1995. [Google Scholar]
- Wang, Q.; Du, X.; Xu, B.; Cross, L.E. Theoretical Analysis of the Sensor Effect of Cantilever Piezoelectric Benders. J. Appl. Phys. 1999, 85, 1702–1712. [Google Scholar] [CrossRef]
Publisher’s Note: MDPI stays neutral with regard to jurisdictional claims in published maps and institutional affiliations. |
© 2021 by the authors. Licensee MDPI, Basel, Switzerland. This article is an open access article distributed under the terms and conditions of the Creative Commons Attribution (CC BY) license (http://creativecommons.org/licenses/by/4.0/).