Fast-Response Liquid Crystal for Spatial Light Modulator and LiDAR Applications

 ,
, 
Abstract
:1. Introduction
2. Material Characterizations
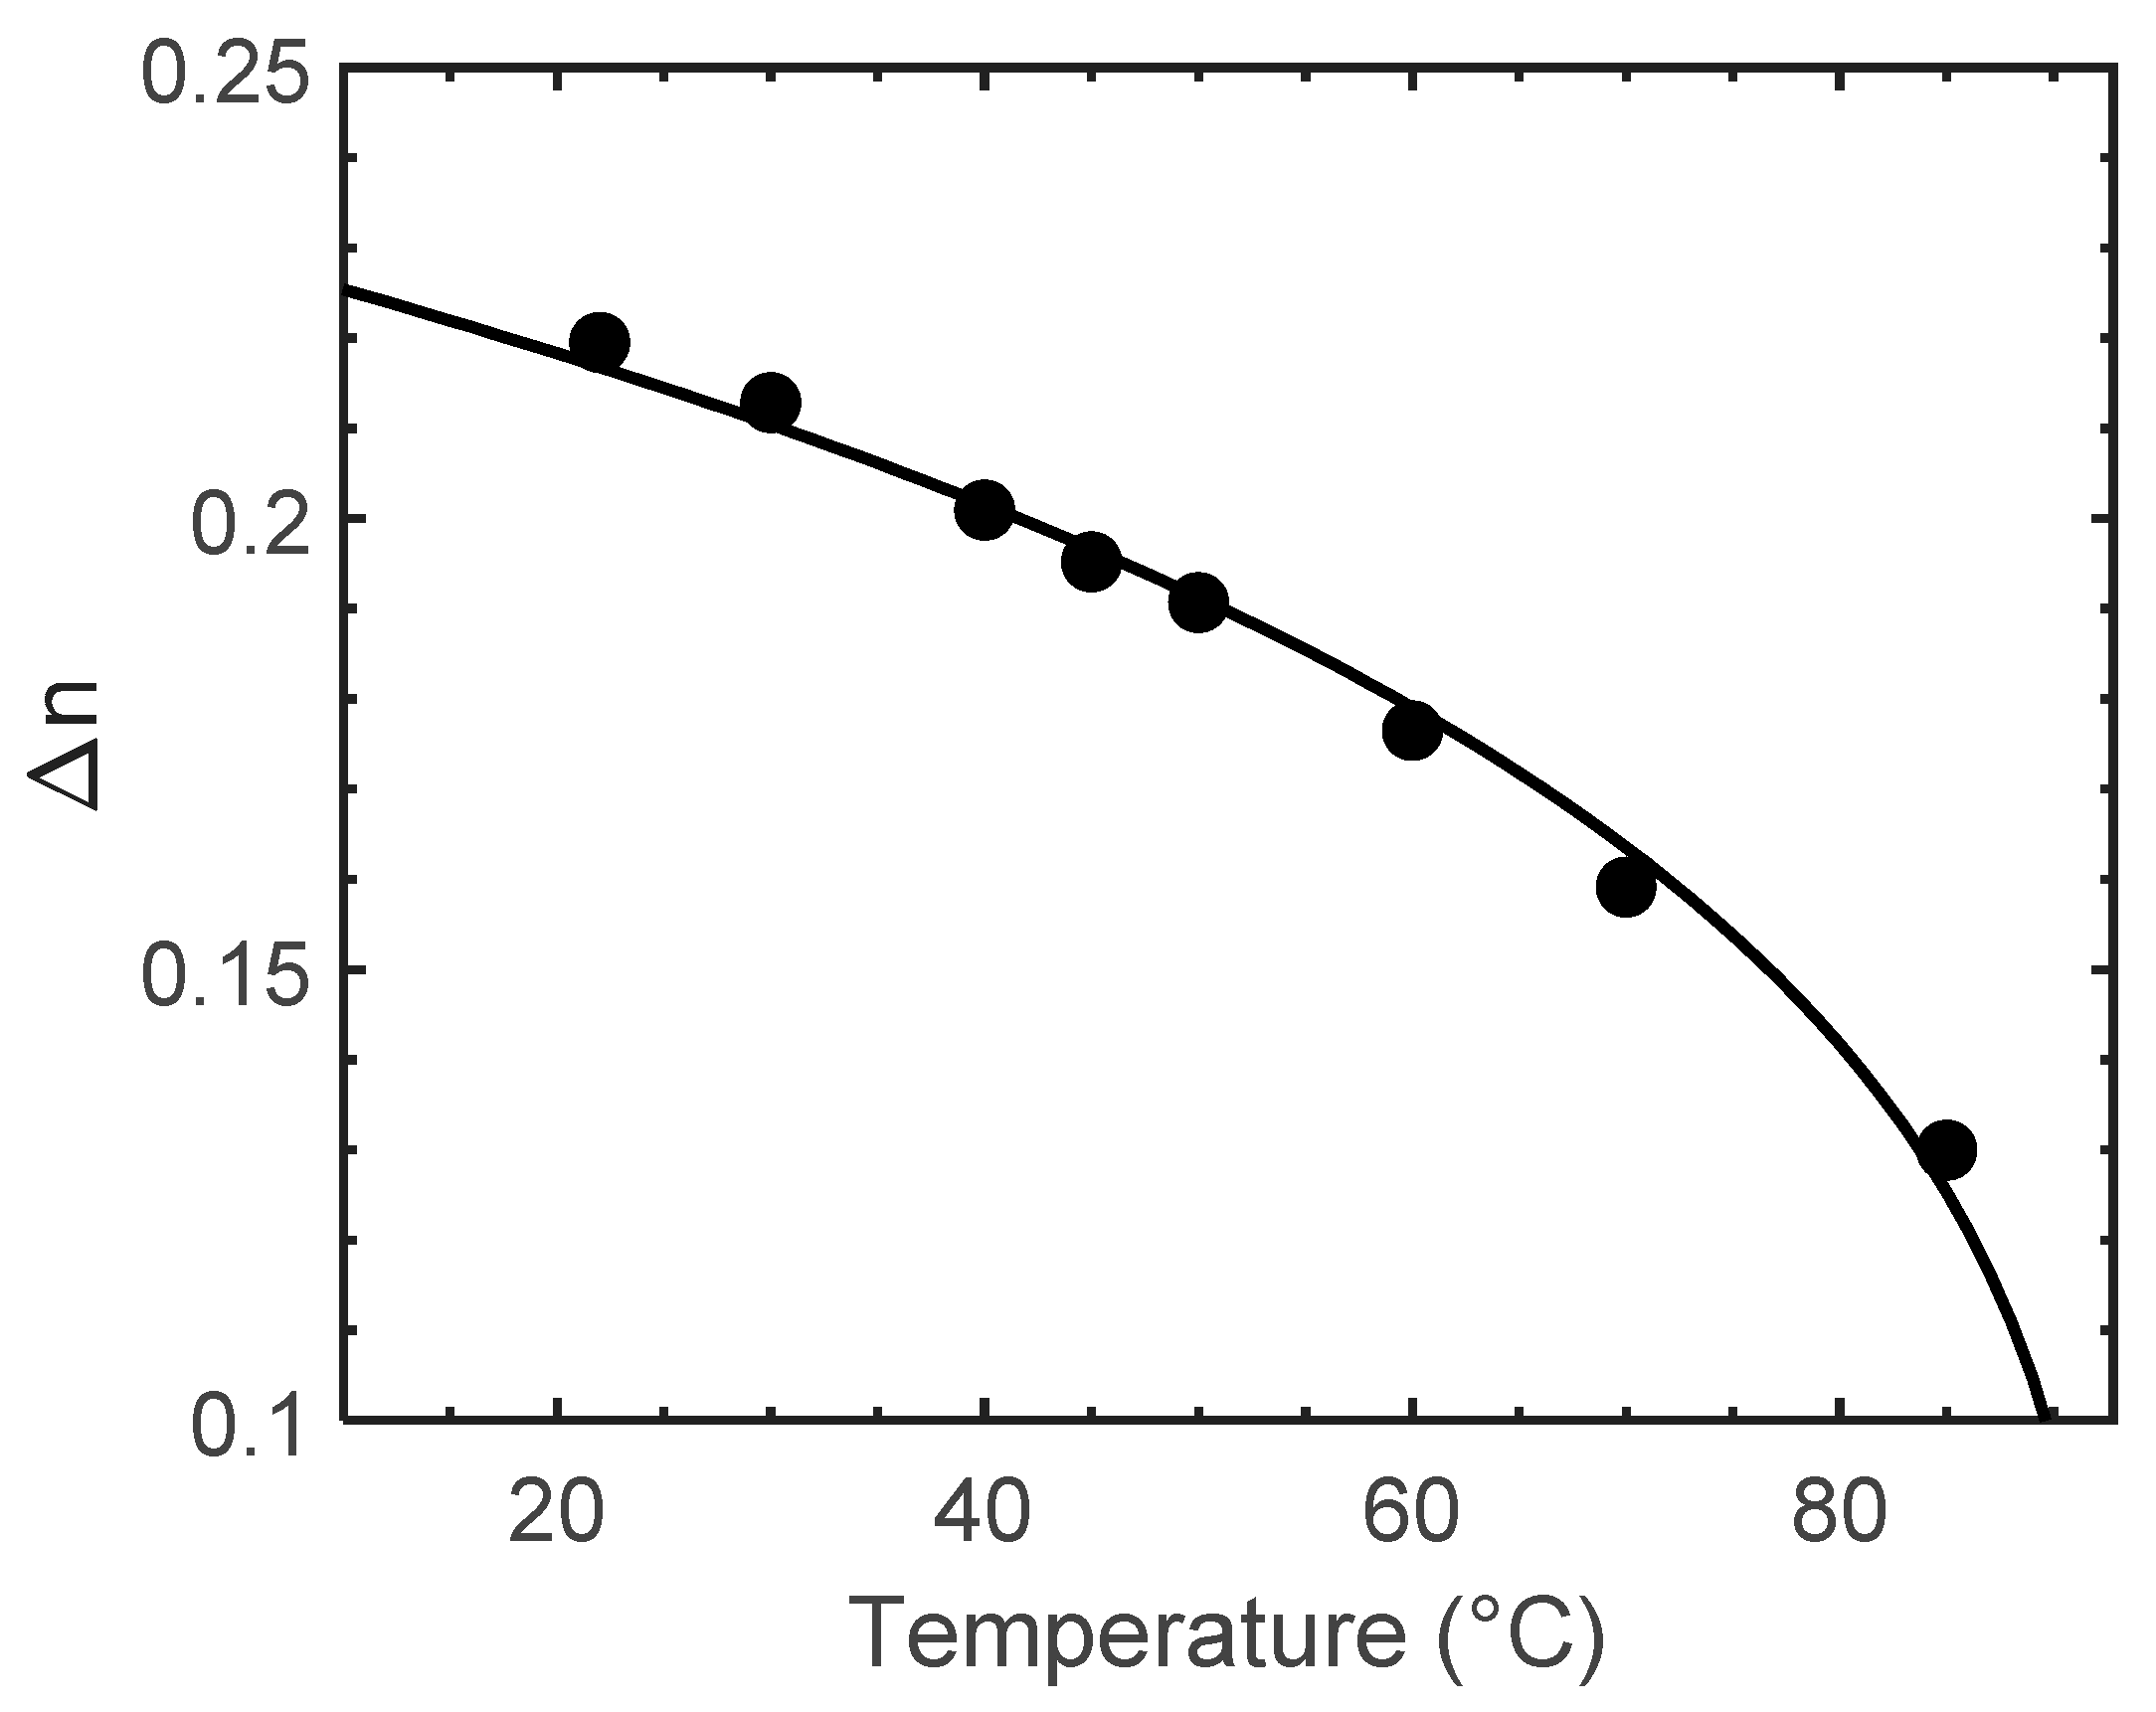
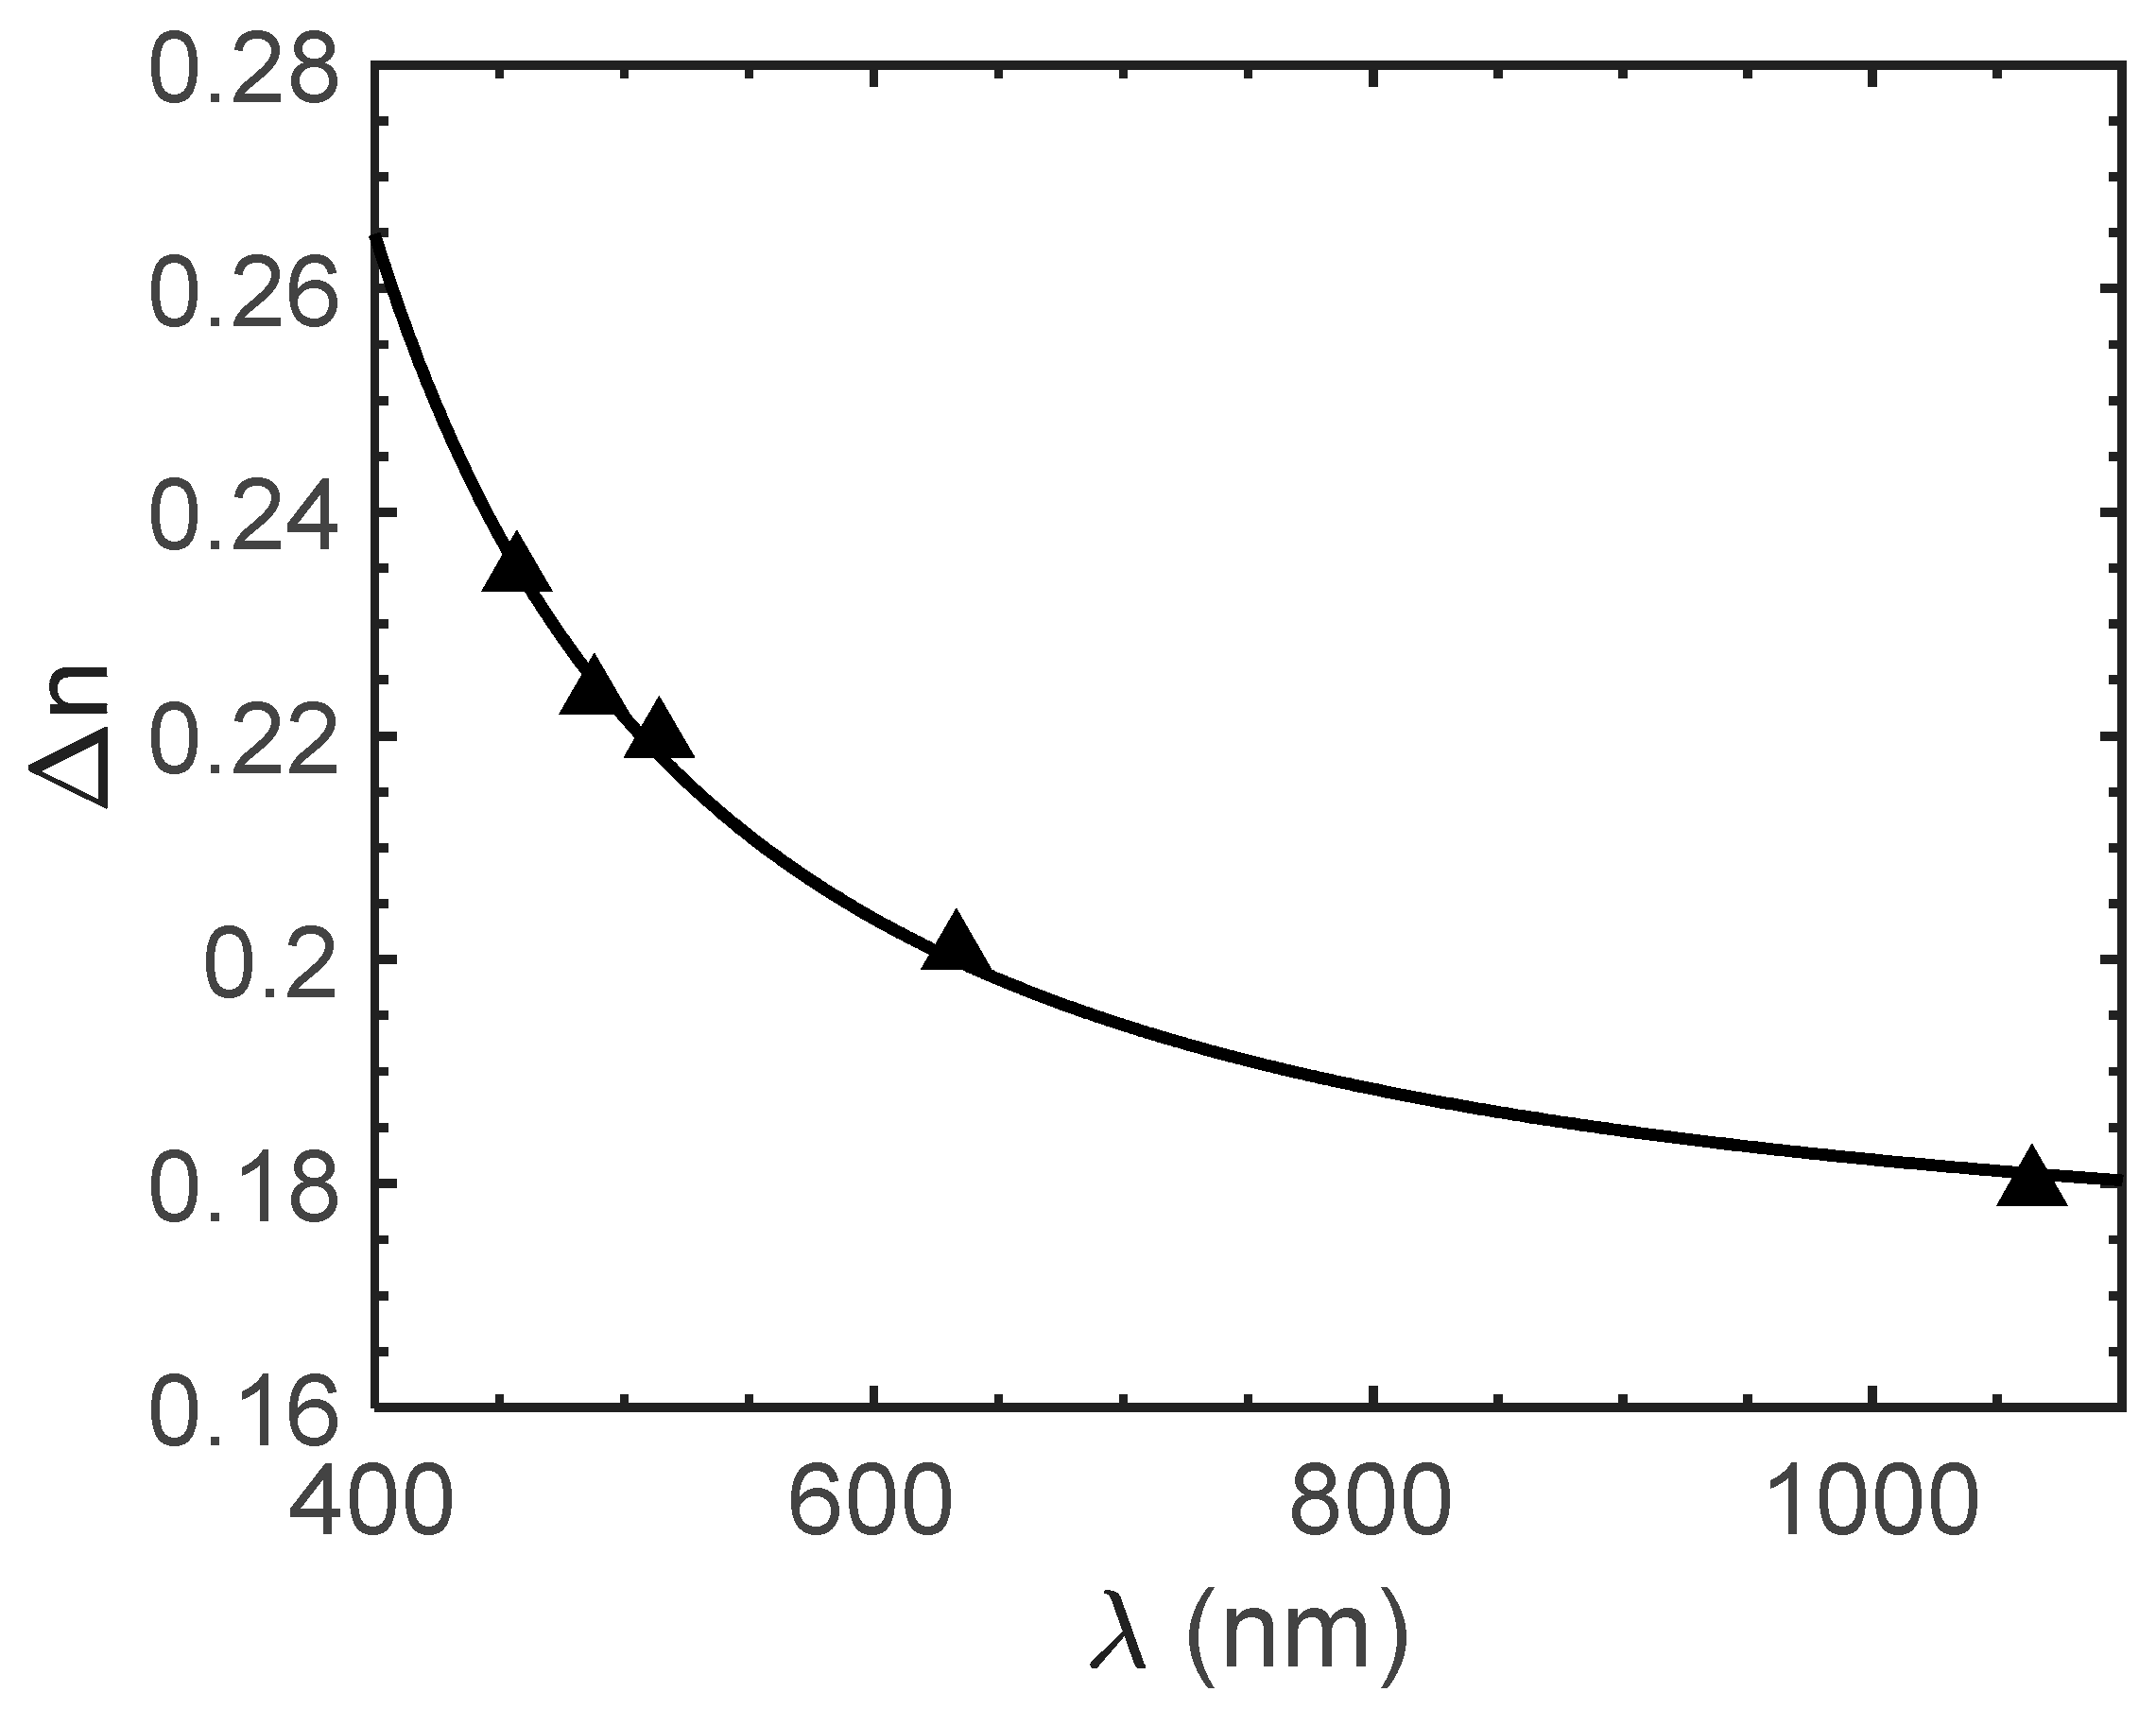
2.1. Birefringence
2.2. Viscoelastic Constant
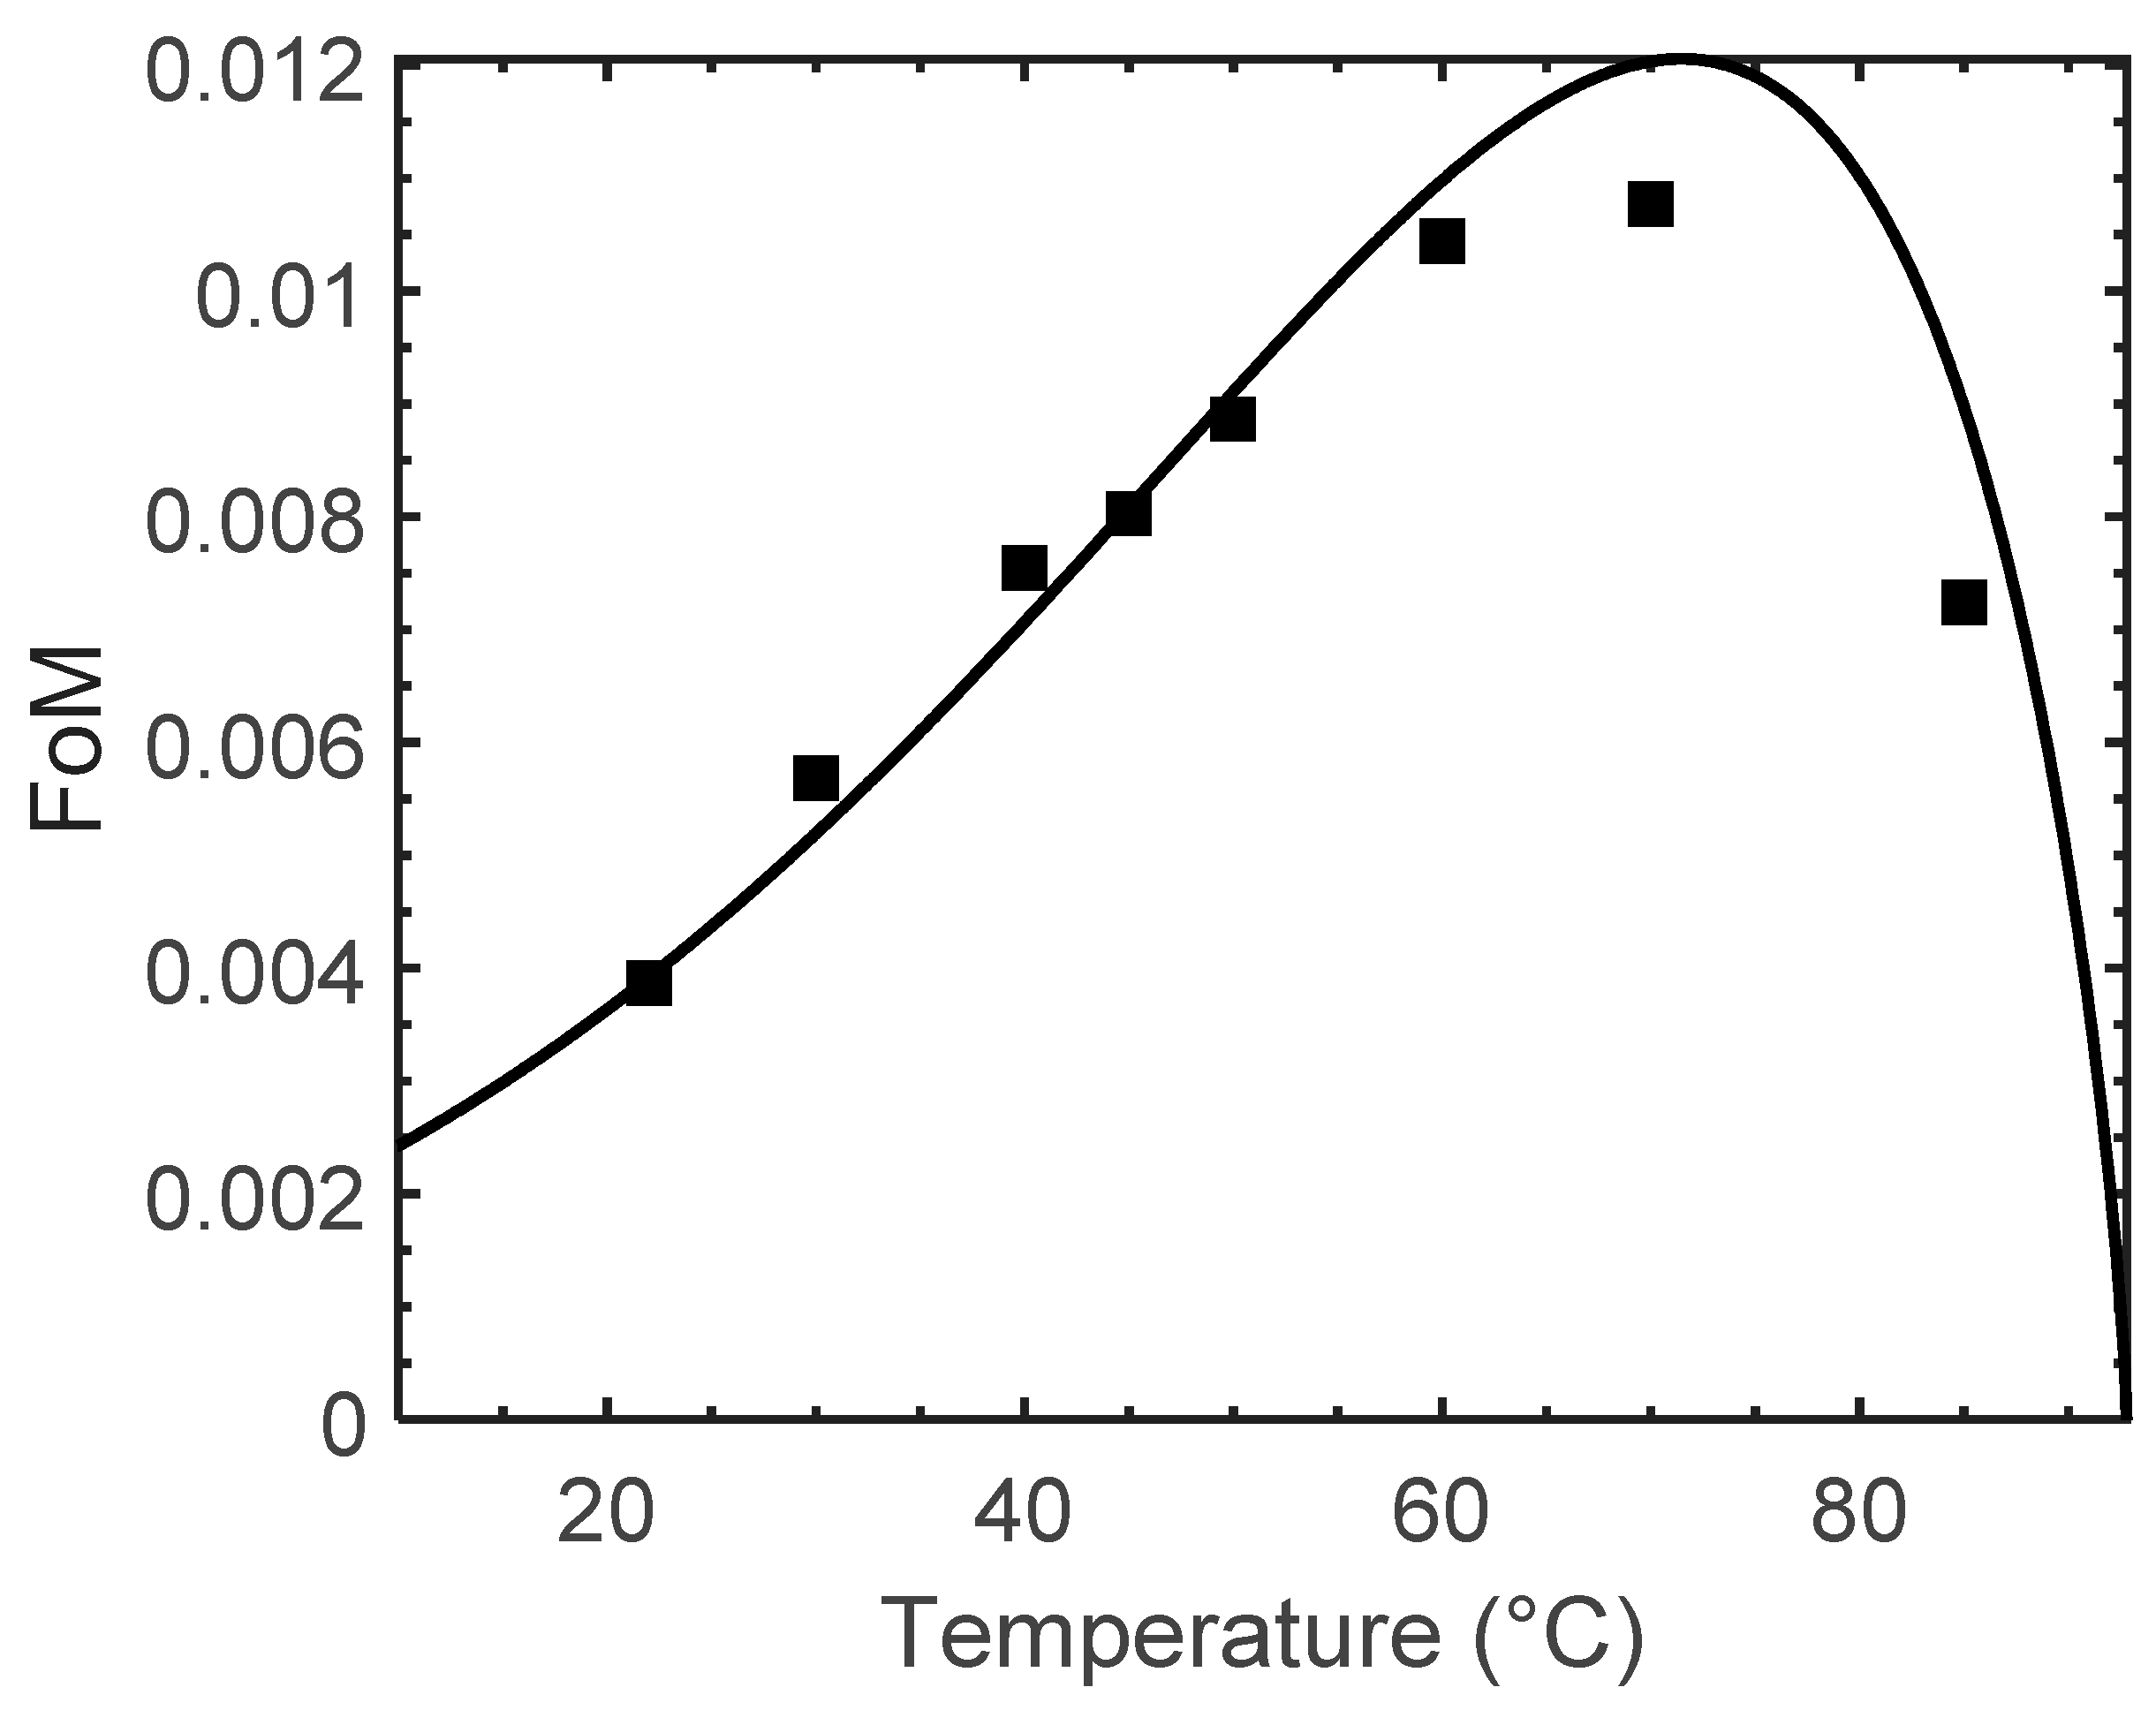
2.3. Figure of Merit
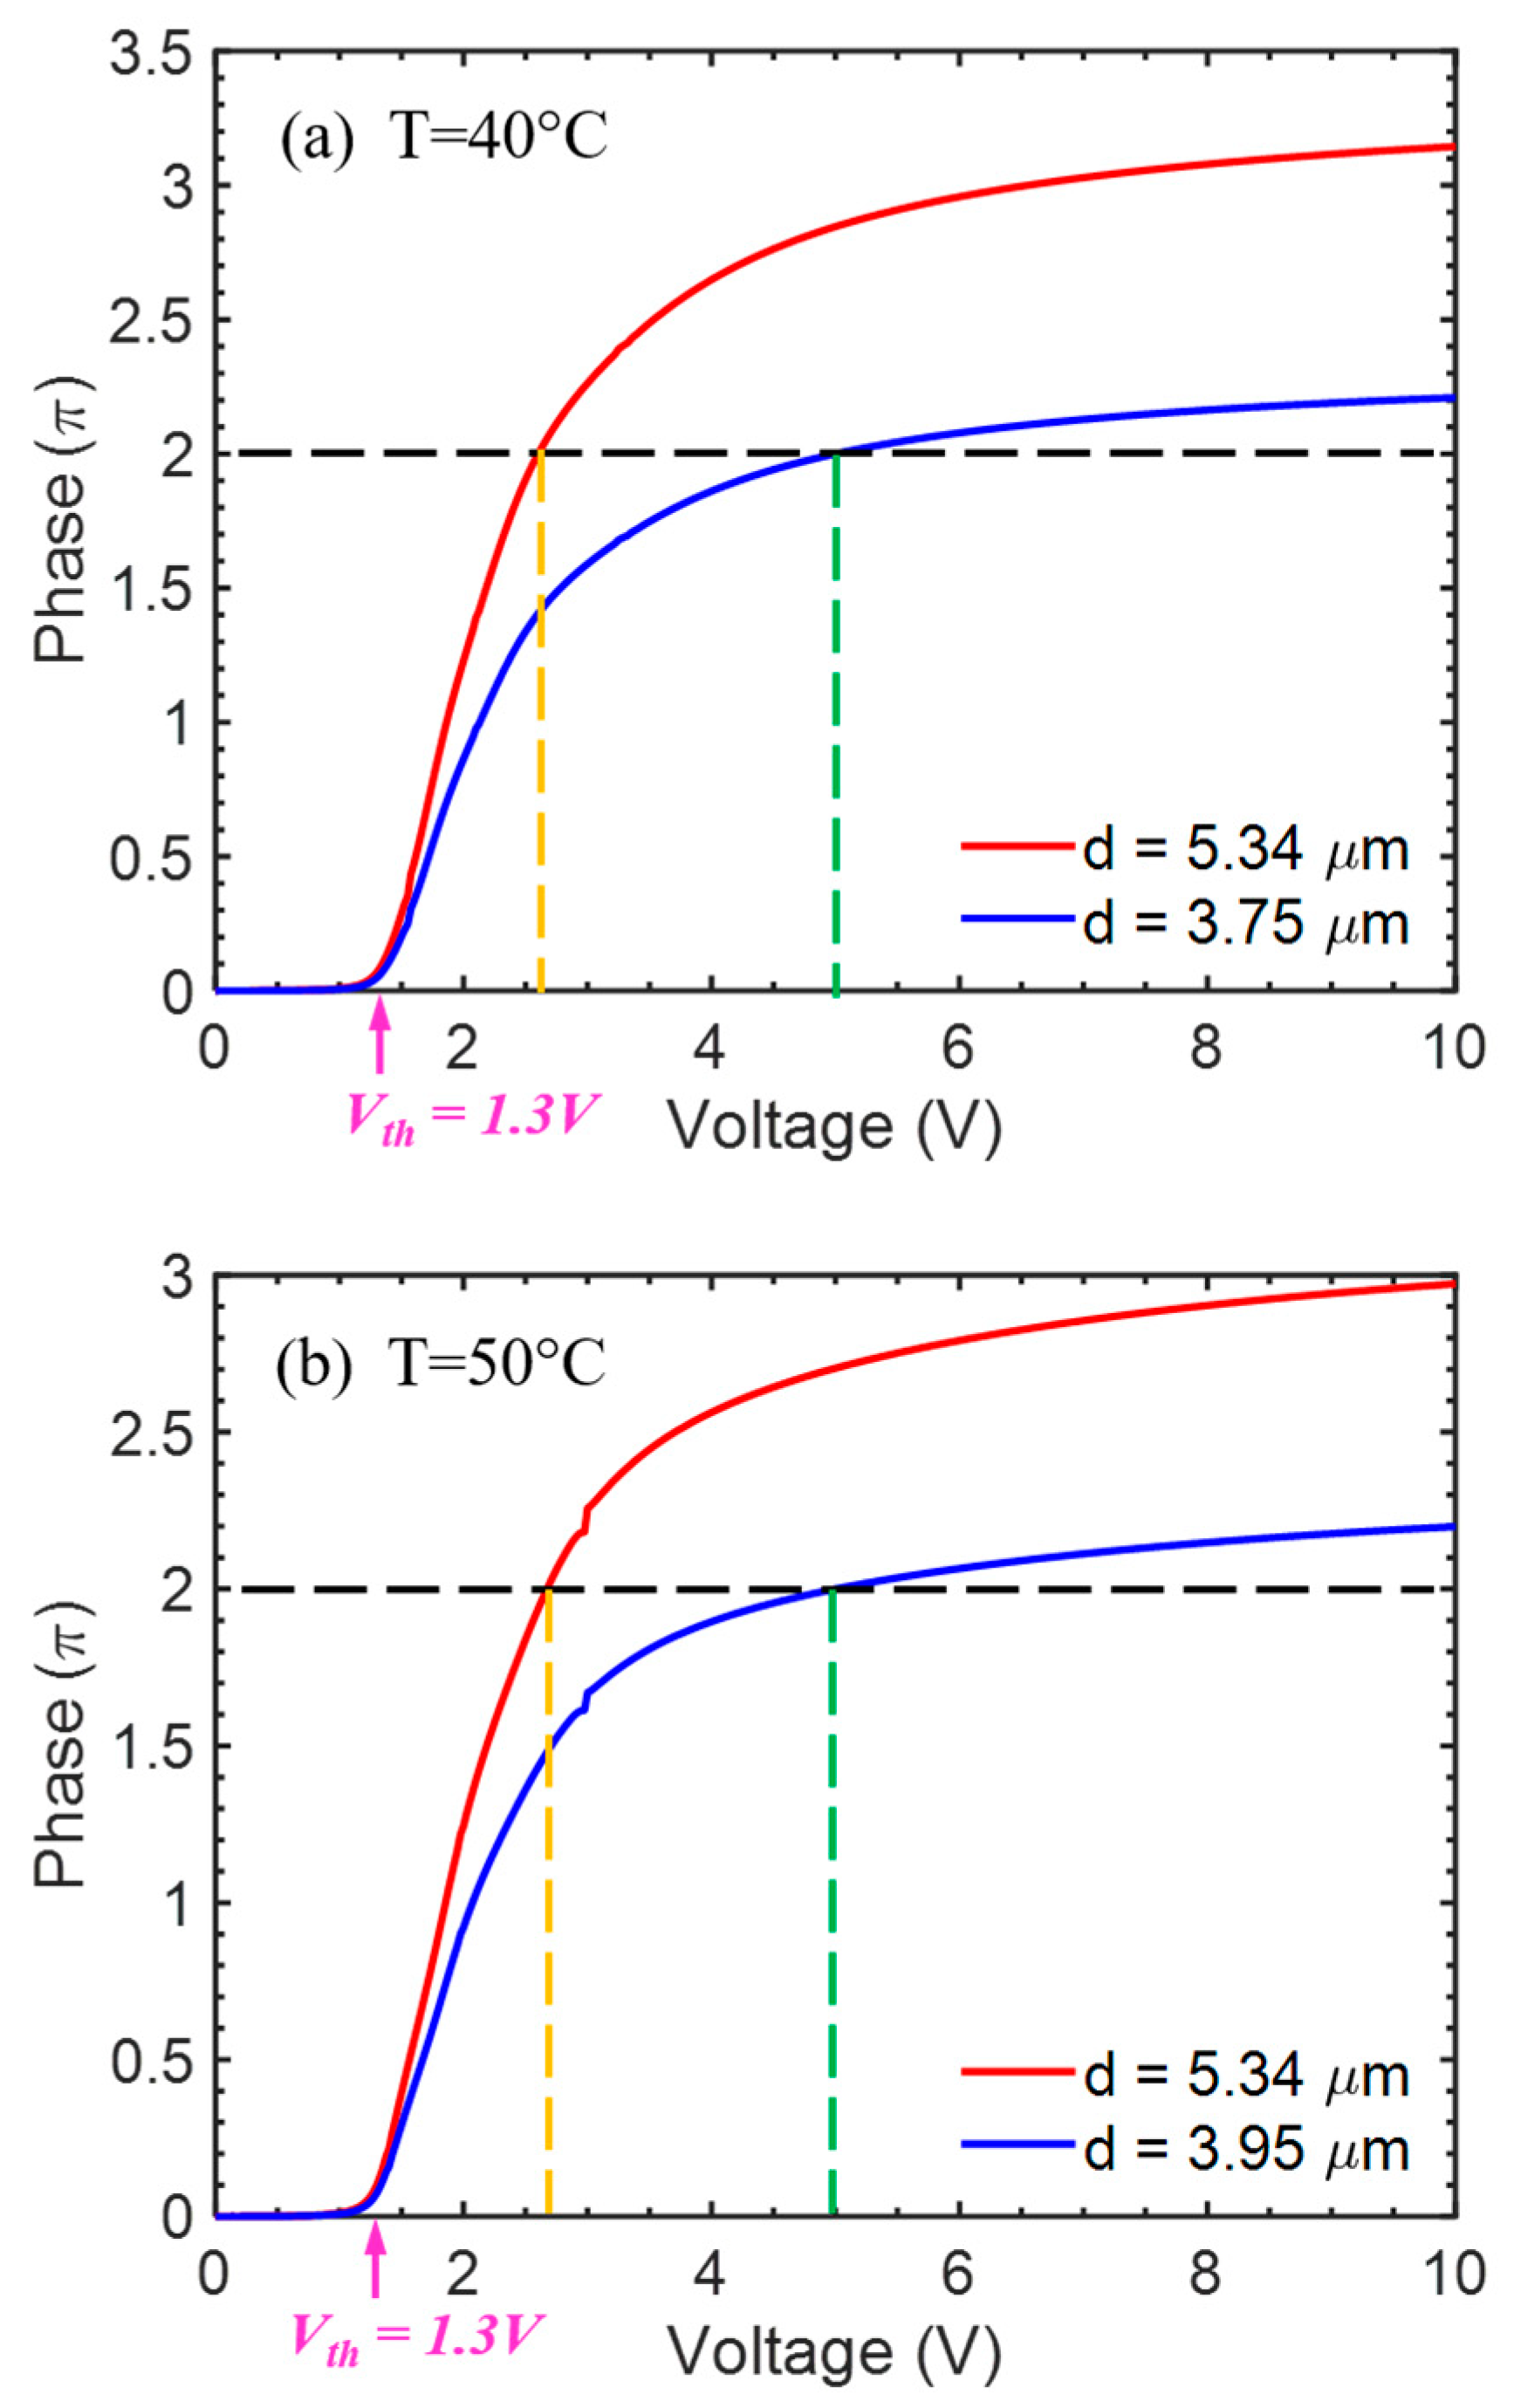
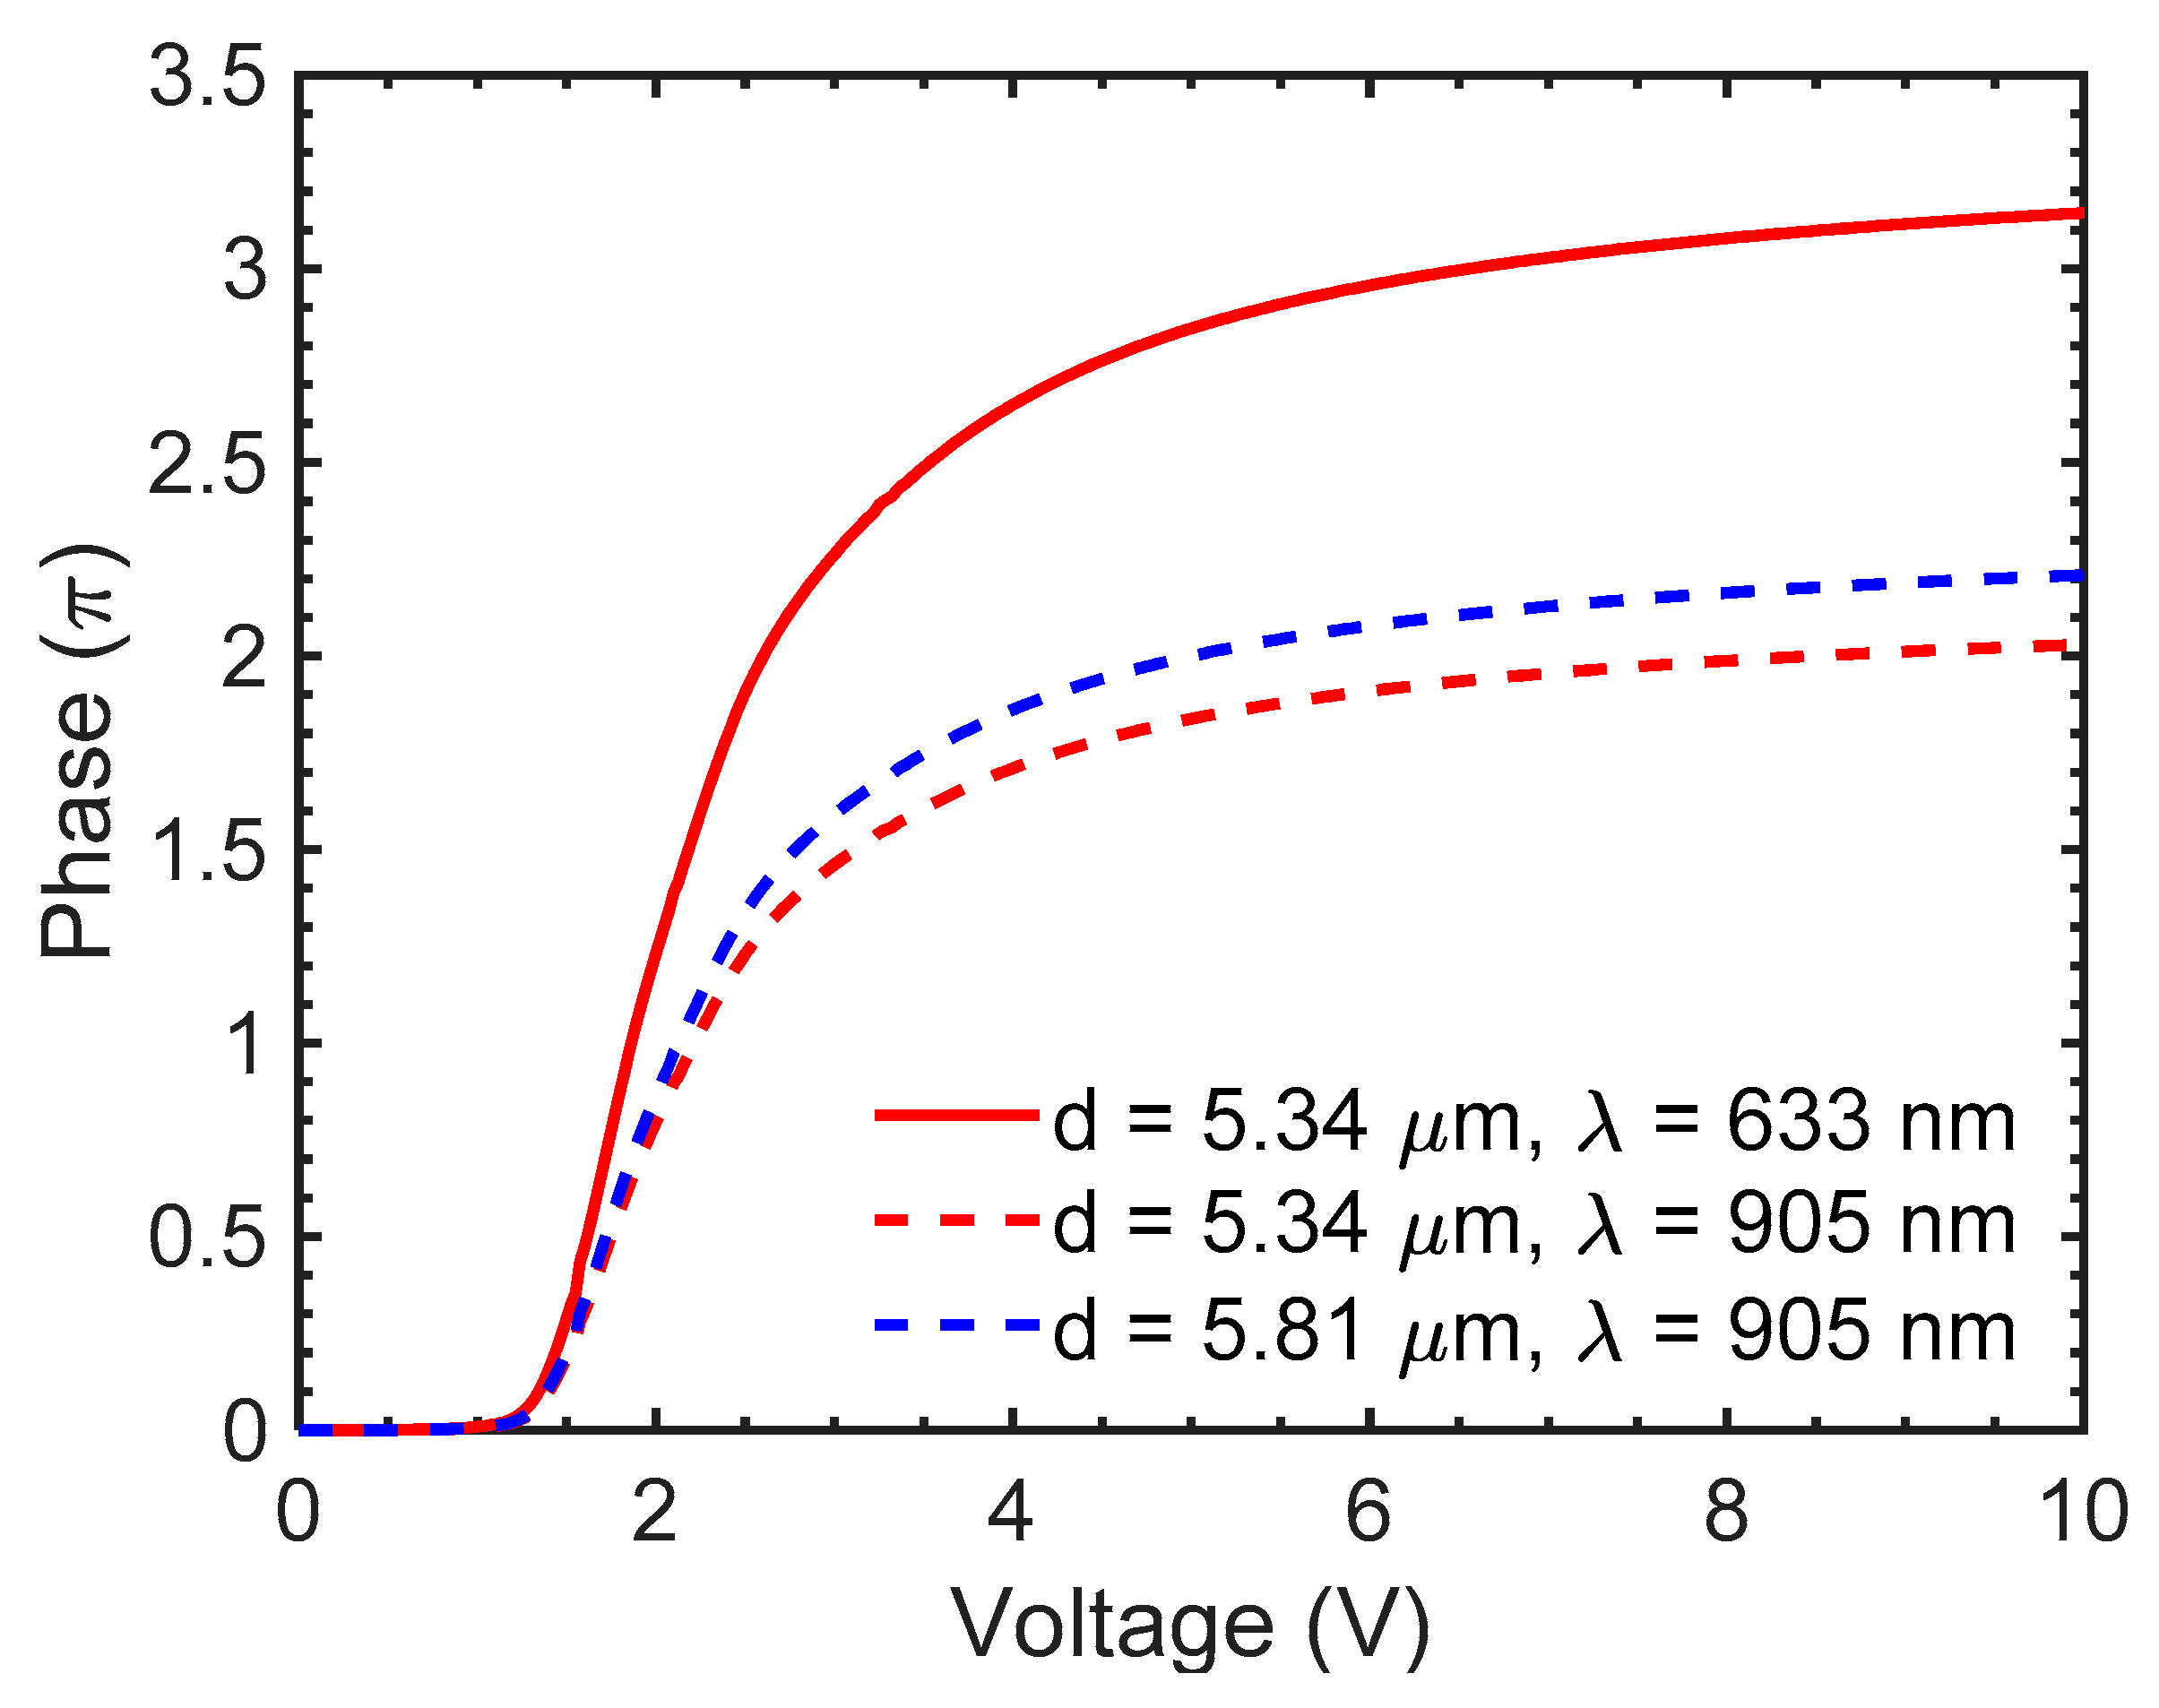
2.4. Voltage Dependent Phase Change
2.5. Response Time
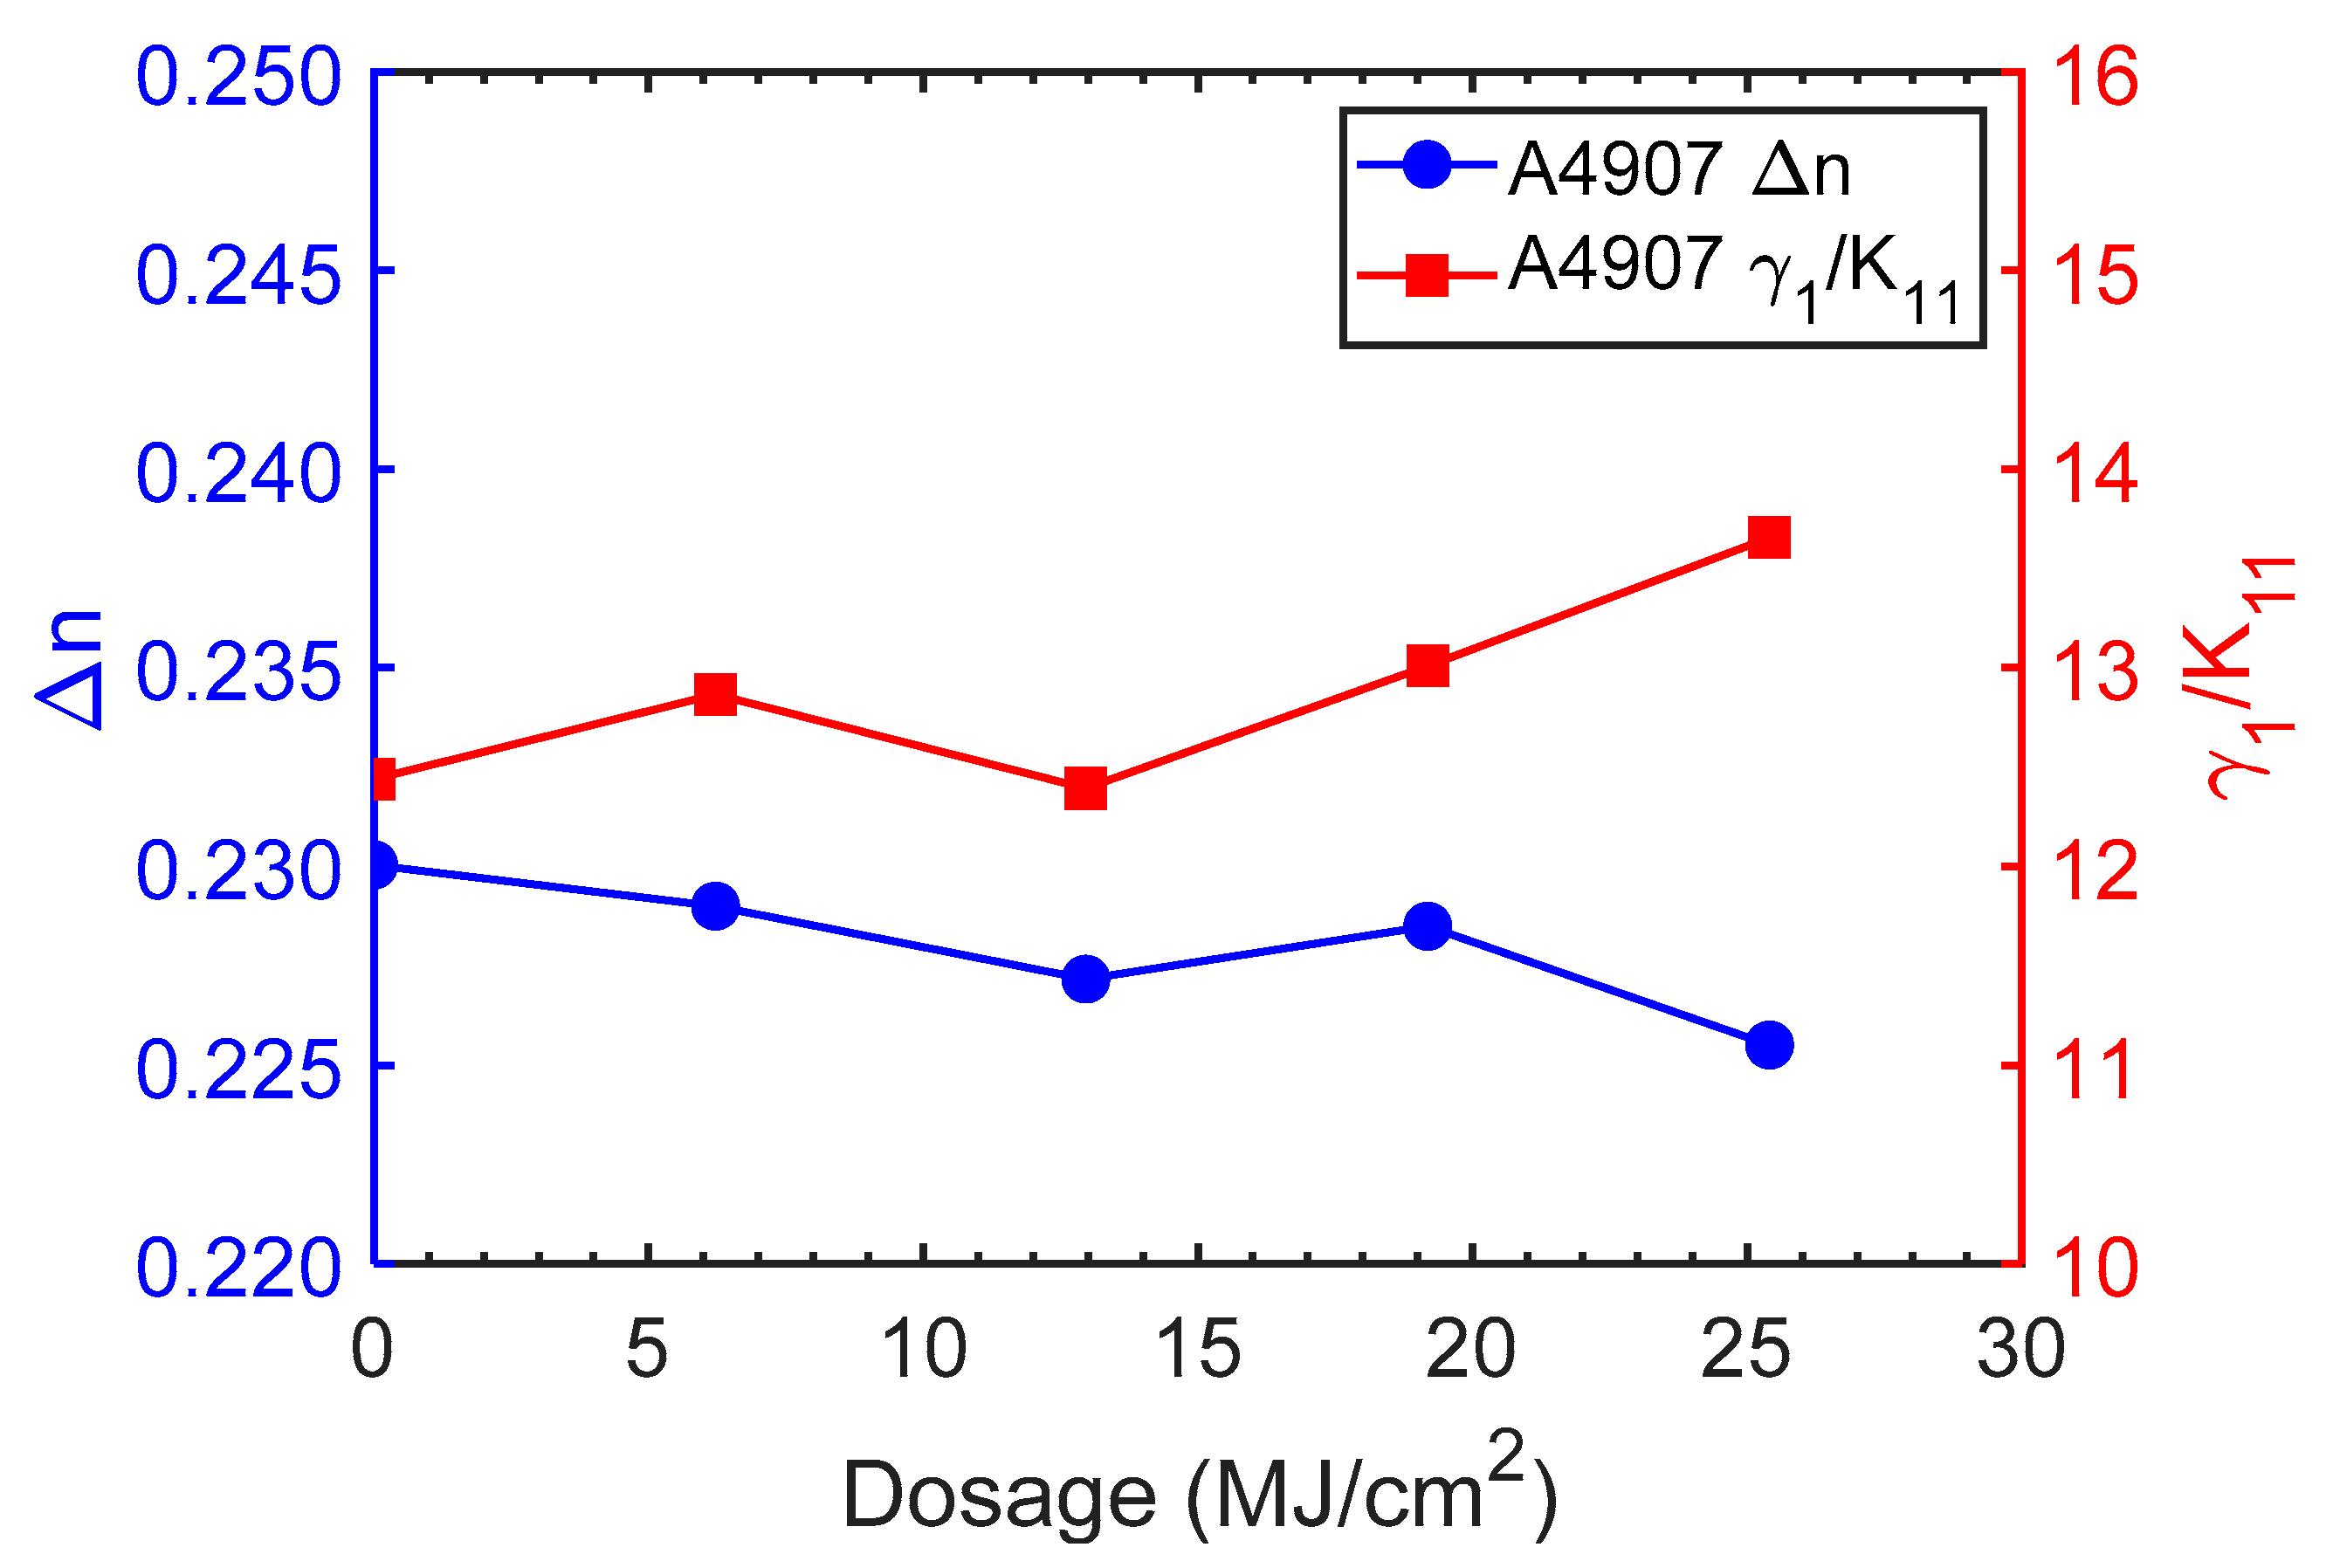
2.6. Photostability
3. Conclusions
Author Contributions
Funding
Institutional Review Board Statement
Informed Consent Statement
Data Availability Statement
Acknowledgments
Conflicts of Interest
References
- Schadt, M. Milestone in the history of field-effect liquid crystal displays and materials. Jpn. J. Appl. Phys. 2009, 48, 03B001. [Google Scholar] [CrossRef]
- Huang, Y.; Hsiang, E.L.; Deng, M.Y.; Wu, S.T. Mini-LED, micro-LED and OLED displays: Present status and future perspectives. Light Sci. Appl. 2020, 9, 105. [Google Scholar] [CrossRef]
- Zhan, T.; Yin, K.; Xiong, J.; He, Z.; Wu, S.T. Augmented reality and virtual reality: Perspectives and challenges. iScience 2020, 23, 101397. [Google Scholar] [CrossRef]
- Zhan, T.; Lee, Y.H.; Tan, G.; Xiong, J.; Yin, K.; Gou, F.; Zou, J.; Zhang, N.; Zhao, D.; Yang, J.; et al. Pancharatnam-Berry optical elements for head-up and near-eye displays. J. Opt. Soc. Am. B 2019, 36, D52–D65. [Google Scholar] [CrossRef]
- McManamon, P.F.; Dorschner, T.A.; Corkum, D.L.; Friedman, L.J.; Hobbs, D.S.; Holz, M.; Liberman, S.; Nguyen, H.Q.; Resler, D.P.; Sharp, R.C.; et al. Optical phased array technology. Proc. IEEE 1996, 84, 268–298. [Google Scholar] [CrossRef]
- Cuypers, D.; de Smet, H.; van Calster, A. VAN LCOS microdisplays: A decade of technological evolution. J. Disp. Technol. 2011, 7, 127–134. [Google Scholar] [CrossRef] [Green Version]
- Zhang, Z.; You, Z.; Chu, D. Fundamentals of phase-only liquid crystal on silicon (LCOS) devices. Light Sci. Appl. 2014, 3, e216. [Google Scholar] [CrossRef]
- Chen, H.M.; Yang, J.P.; Yen, H.T.; Hsu, Z.N.; Huang, Y.; Wu, S.T. Pursuing high quality phase-only liquid crystal on silicon (LCoS) devices. Appl. Sci. 2018, 8, 2323. [Google Scholar] [CrossRef] [Green Version]
- Zhan, T.; Xiong, J.; Zou, J.; Wu, S.T. Multifocal displays: Review and prospect. PhotoniX 2020, 1, 10. [Google Scholar] [CrossRef] [Green Version]
- Hua, H. Enabling focus cues in head-mounted displays. Proc. IEEE 2017, 105, 805–824. [Google Scholar] [CrossRef]
- Bahk, S.W.; Fess, E.; Kruschwitz, B.E.; Zuegel, J.D. A high-resolution, adaptive beam-shaping system for high-power lasers. Opt. Express 2010, 18, 9151–9163. [Google Scholar] [CrossRef] [PubMed]
- Hu, L.; Xuan, L.; Liu, Y.; Cao, Z.; Li, D.; Mu, Q. Phase-only liquid-crystal spatial light modulator for wave-front correction with high precision. Opt. Express 2004, 12, 6403–6409. [Google Scholar] [CrossRef] [PubMed]
- Crossland, W.A.; Wilkinson, T.D.; Manolis, I.G.; Redmond, M.M.; Davey, A.B. Telecommunications applications of LCOS devices. Mol. Cryst. Liq. Cryst. 2002, 375, 1–13. [Google Scholar] [CrossRef]
- Davis, S.R.; Sparks, A.W.; Fegely, L.; Gann, D.; Kemiao, J. Compact steering technologies for automotive lidar: A comparison between liquid crystal clad waveguides and optical mems. Appl. Lasers Sens. Free Space Commun. 2018, 3, STu2H-3. [Google Scholar]
- Li, S.Q.; Xu, X.; Veetil, R.M.; Valuckas, V.; Paniagua-Domínguez, R.; Kuznetsov, A.I. Phase-only transmissive spatial light modulator based on tunable dielectric metasurface. Science 2019, 364, 1087–1090. [Google Scholar] [CrossRef] [Green Version]
- Maimone, A.; Georgiou, A.; Kollin, J.S. Holographic near-eye displays for virtual and augmented reality. ACM Trans. Graph. 2017, 36, 85. [Google Scholar] [CrossRef]
- Matsuda, N.; Fix, A.; Lanman, D. Focal surface displays. ACM Trans. Graph. 2017, 36, 86. [Google Scholar] [CrossRef]
- Fan-Chiang, K.H.; Huang, S.H.; Shen, C.Y.; Wang, H.L.; Li, Y.W.; Tsai, H.C.; Huang, Y.P. Analog LCOS SLM devices for AR display applications. J. Soc. Inf. Disp. 2020, 28, 581–590. [Google Scholar] [CrossRef]
- Wu, S.T.; Lackner, A.M.; Efron, U. Optimal operation temperature of liquid crystal modulators. Appl. Opt. 1987, 26, 3441–3445. [Google Scholar] [CrossRef]
- Lackner, A.M.; Margerum, J.D.; Miller, L.J.; Smith, W.H., Jr. Near ultraviolet photostability of liquid-crystal mixtures. Mol. Cryst. Liq. Cryst. 1986, 141, 289–310. [Google Scholar] [CrossRef]
- Yakovenko, S.; Konovalov, V.; Brennesholtz, M. Lifetime of single panel LCOS imagers. SID Symp. Dig. Tech. Pap. 2004, 35, 64–67. [Google Scholar] [CrossRef]
- Janning, J.L. Thin film surface orientation for liquid crystals. Appl. Phys. Lett. 1972, 21, 173–174. [Google Scholar] [CrossRef]
- Wen, C.H.; Gauza, S.; Wu, S.T. Photostability of liquid crystals and alignment layers. J. Soc. Inf. Disp. 2005, 13, 805–811. [Google Scholar] [CrossRef]
- Yang, Q.; Zou, J.; Li, Y.; Wu, S.T. Fast-response liquid crystal phase modulators with an excellent photostability. Crystals 2020, 10, 765. [Google Scholar] [CrossRef]
- Wu, S.T.; Wu, C.S. Rotational viscosity of nematic liquid crystals A critical examination of existing models. Liq. Cryst. 1990, 8, 171–182. [Google Scholar] [CrossRef]
- Wu, S.T.; Efron, U.; Hess, L.D. Birefringence measurements of liquid crystals. Appl. Opt. 1984, 23, 3911–3915. [Google Scholar] [CrossRef]
- Wu, S.T. Birefringence dispersions of liquid crystals. Phys. Rev. A 1986, 33, 1270–1274. [Google Scholar] [CrossRef]
- Huang, Y.; He, Z.; Wu, S.T. Fast-response liquid crystal phase modulators for augmented reality displays. Opt. Express 2017, 25, 32757–32766. [Google Scholar] [CrossRef] [Green Version]
- Chen, H.; Gou, F.; Wu, S.T. Submillisecond-response nematic liquid crystals for augmented reality displays. Opt. Mater. Express 2017, 7, 195–201. [Google Scholar] [CrossRef] [Green Version]


| LC Mixture | A4907 | TL-216 | UCF-216 |
|---|---|---|---|
| Tc (°C) | 91.9 | 80.0 | 81.8 |
| Tm (°C) | −19 | −20 | −20 |
| Δn @ 633 nm | 0.220 | 0.205 | 0.215 |
| ∆ε @ 1 kHz | 7.3 | 5.5 | 7.6 |
| ε┴ @ 1 kHz | 3.8 | 4.2 | 4.2 |
| K11 (pN) | 13.3 | 14.4 | 14.6 |
| K33 (pN) | 16.3 | 19.6 | --- |
| γ1/K11 (ms/µm2) | 12.9 | 19.0 | 14.5 |
| LC Mixture | Δn0 | β | G @ 40 °C (µm−2) | λ* @ 40 °C (µm) | A (ms/µm2) | Ea (meV) |
|---|---|---|---|---|---|---|
| A4907 | 0.326 | 0.249 | 3.06 | 0.237 | 6.19 × 10⁻⁶ | 358 |
| T (°C) | λ (nm) | d (μm) | Vth (V) | V2π (V) | τon (ms) | τoff (ms) | τtotal (ms) Transmissive | τtotal (ms) Reflective |
|---|---|---|---|---|---|---|---|---|
| 40 | 633 | 5.34 | 1.3 | 2.6 | 16.6 | 16.4 | 33.0 | 8.3 |
| 40 | 633 | 3.75 | 1.3 | 5.0 | 1.8 | 8.1 | 10.0 | 2.5 |
| 40 | 905 | 5.81 | 1.3 | 5.0 | 4.3 | 19.4 | 23.6 | 5.9 |
| 50 | 633 | 5.34 | 1.3 | 2.7 | 11.6 | 13.3 | 24.9 | 6.2 |
| 50 | 633 | 3.95 | 1.3 | 5.0 | 1.5 | 7.3 | 8.8 | 2.2 |
Publisher’s Note: MDPI stays neutral with regard to jurisdictional claims in published maps and institutional affiliations. |
© 2021 by the authors. Licensee MDPI, Basel, Switzerland. This article is an open access article distributed under the terms and conditions of the Creative Commons Attribution (CC BY) license (http://creativecommons.org/licenses/by/4.0/).
Share and Cite
Zou, J.; Yang, Q.; Hsiang, E.-L.; Ooishi, H.; Yang, Z.; Yoshidaya, K.; Wu, S.-T. Fast-Response Liquid Crystal for Spatial Light Modulator and LiDAR Applications. Crystals 2021, 11, 93. https://doi.org/10.3390/cryst11020093
Zou J, Yang Q, Hsiang E-L, Ooishi H, Yang Z, Yoshidaya K, Wu S-T. Fast-Response Liquid Crystal for Spatial Light Modulator and LiDAR Applications. Crystals. 2021; 11(2):93. https://doi.org/10.3390/cryst11020093
Chicago/Turabian StyleZou, Junyu, Qian Yang, En-Lin Hsiang, Haruki Ooishi, Zhuo Yang, Kifumi Yoshidaya, and Shin-Tson Wu. 2021. "Fast-Response Liquid Crystal for Spatial Light Modulator and LiDAR Applications" Crystals 11, no. 2: 93. https://doi.org/10.3390/cryst11020093
APA StyleZou, J., Yang, Q., Hsiang, E.-L., Ooishi, H., Yang, Z., Yoshidaya, K., & Wu, S.-T. (2021). Fast-Response Liquid Crystal for Spatial Light Modulator and LiDAR Applications. Crystals, 11(2), 93. https://doi.org/10.3390/cryst11020093