
Prediction of Compressive Strength of Rice Husk Ash Concrete through Different Machine Learning Processes

 ,
,  , , , ,
Abstract
:1. Introduction
2. Data Collection
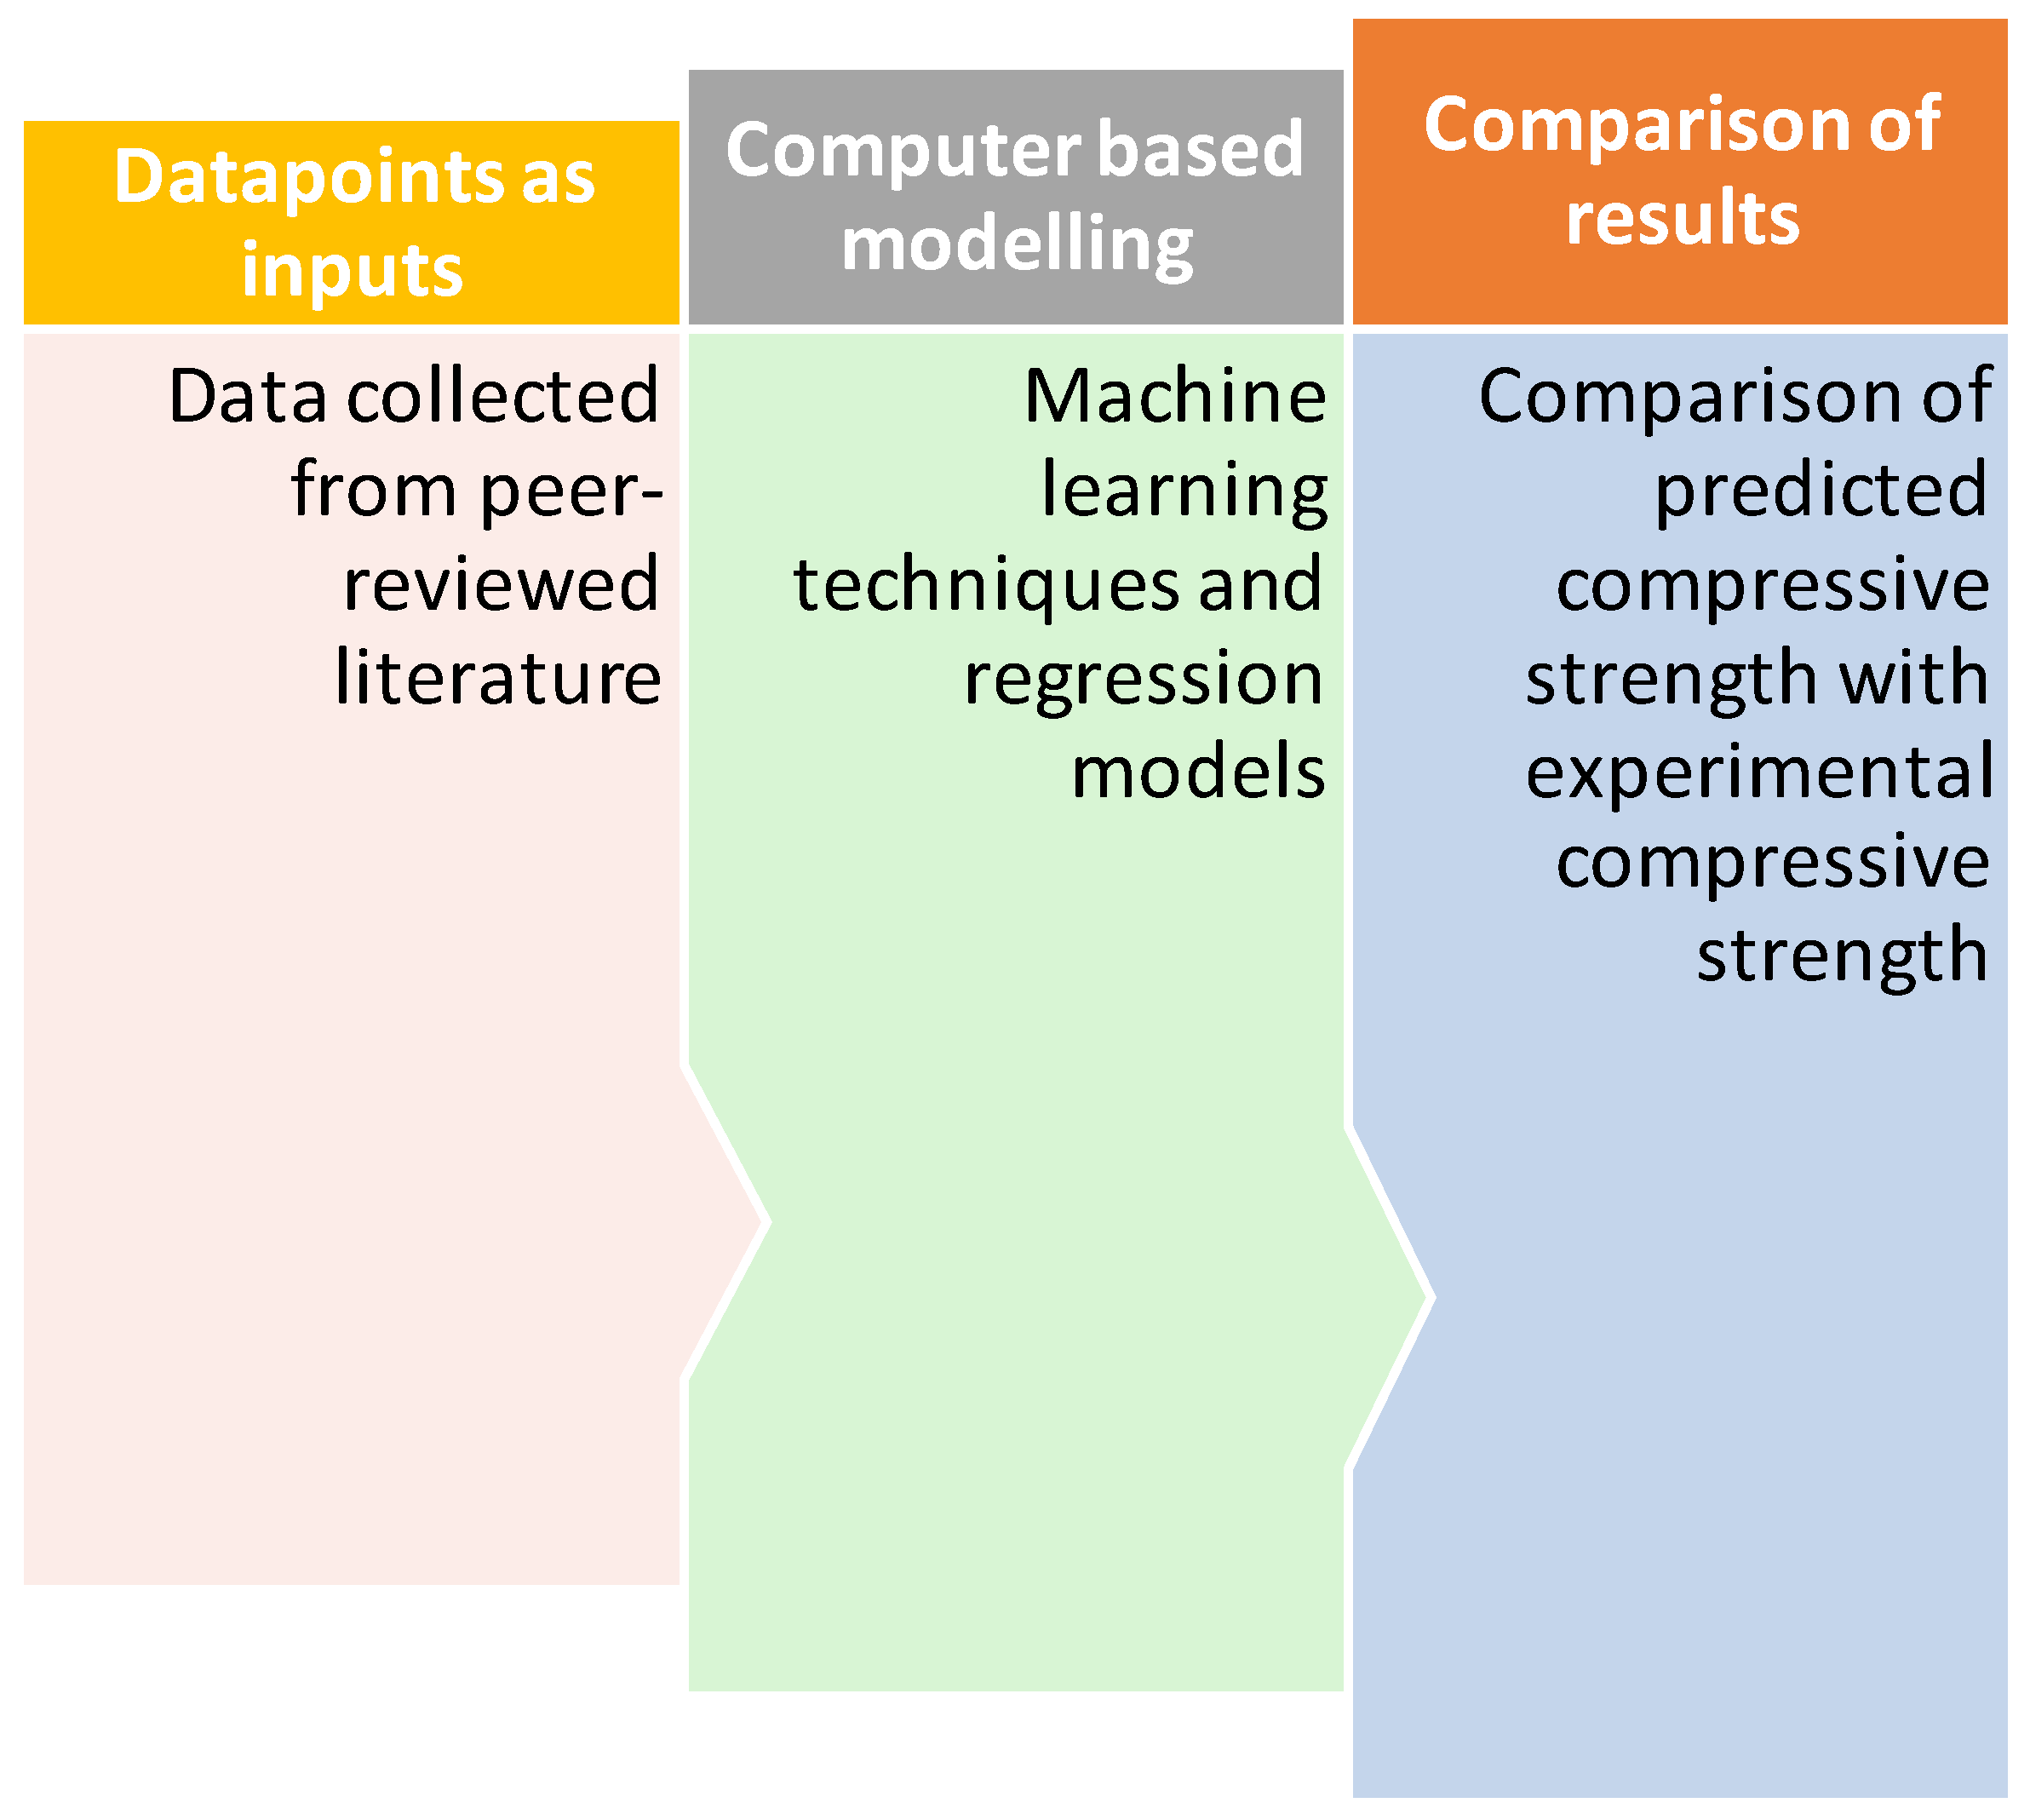
3. Methodology
3.1. Modeling Techniques
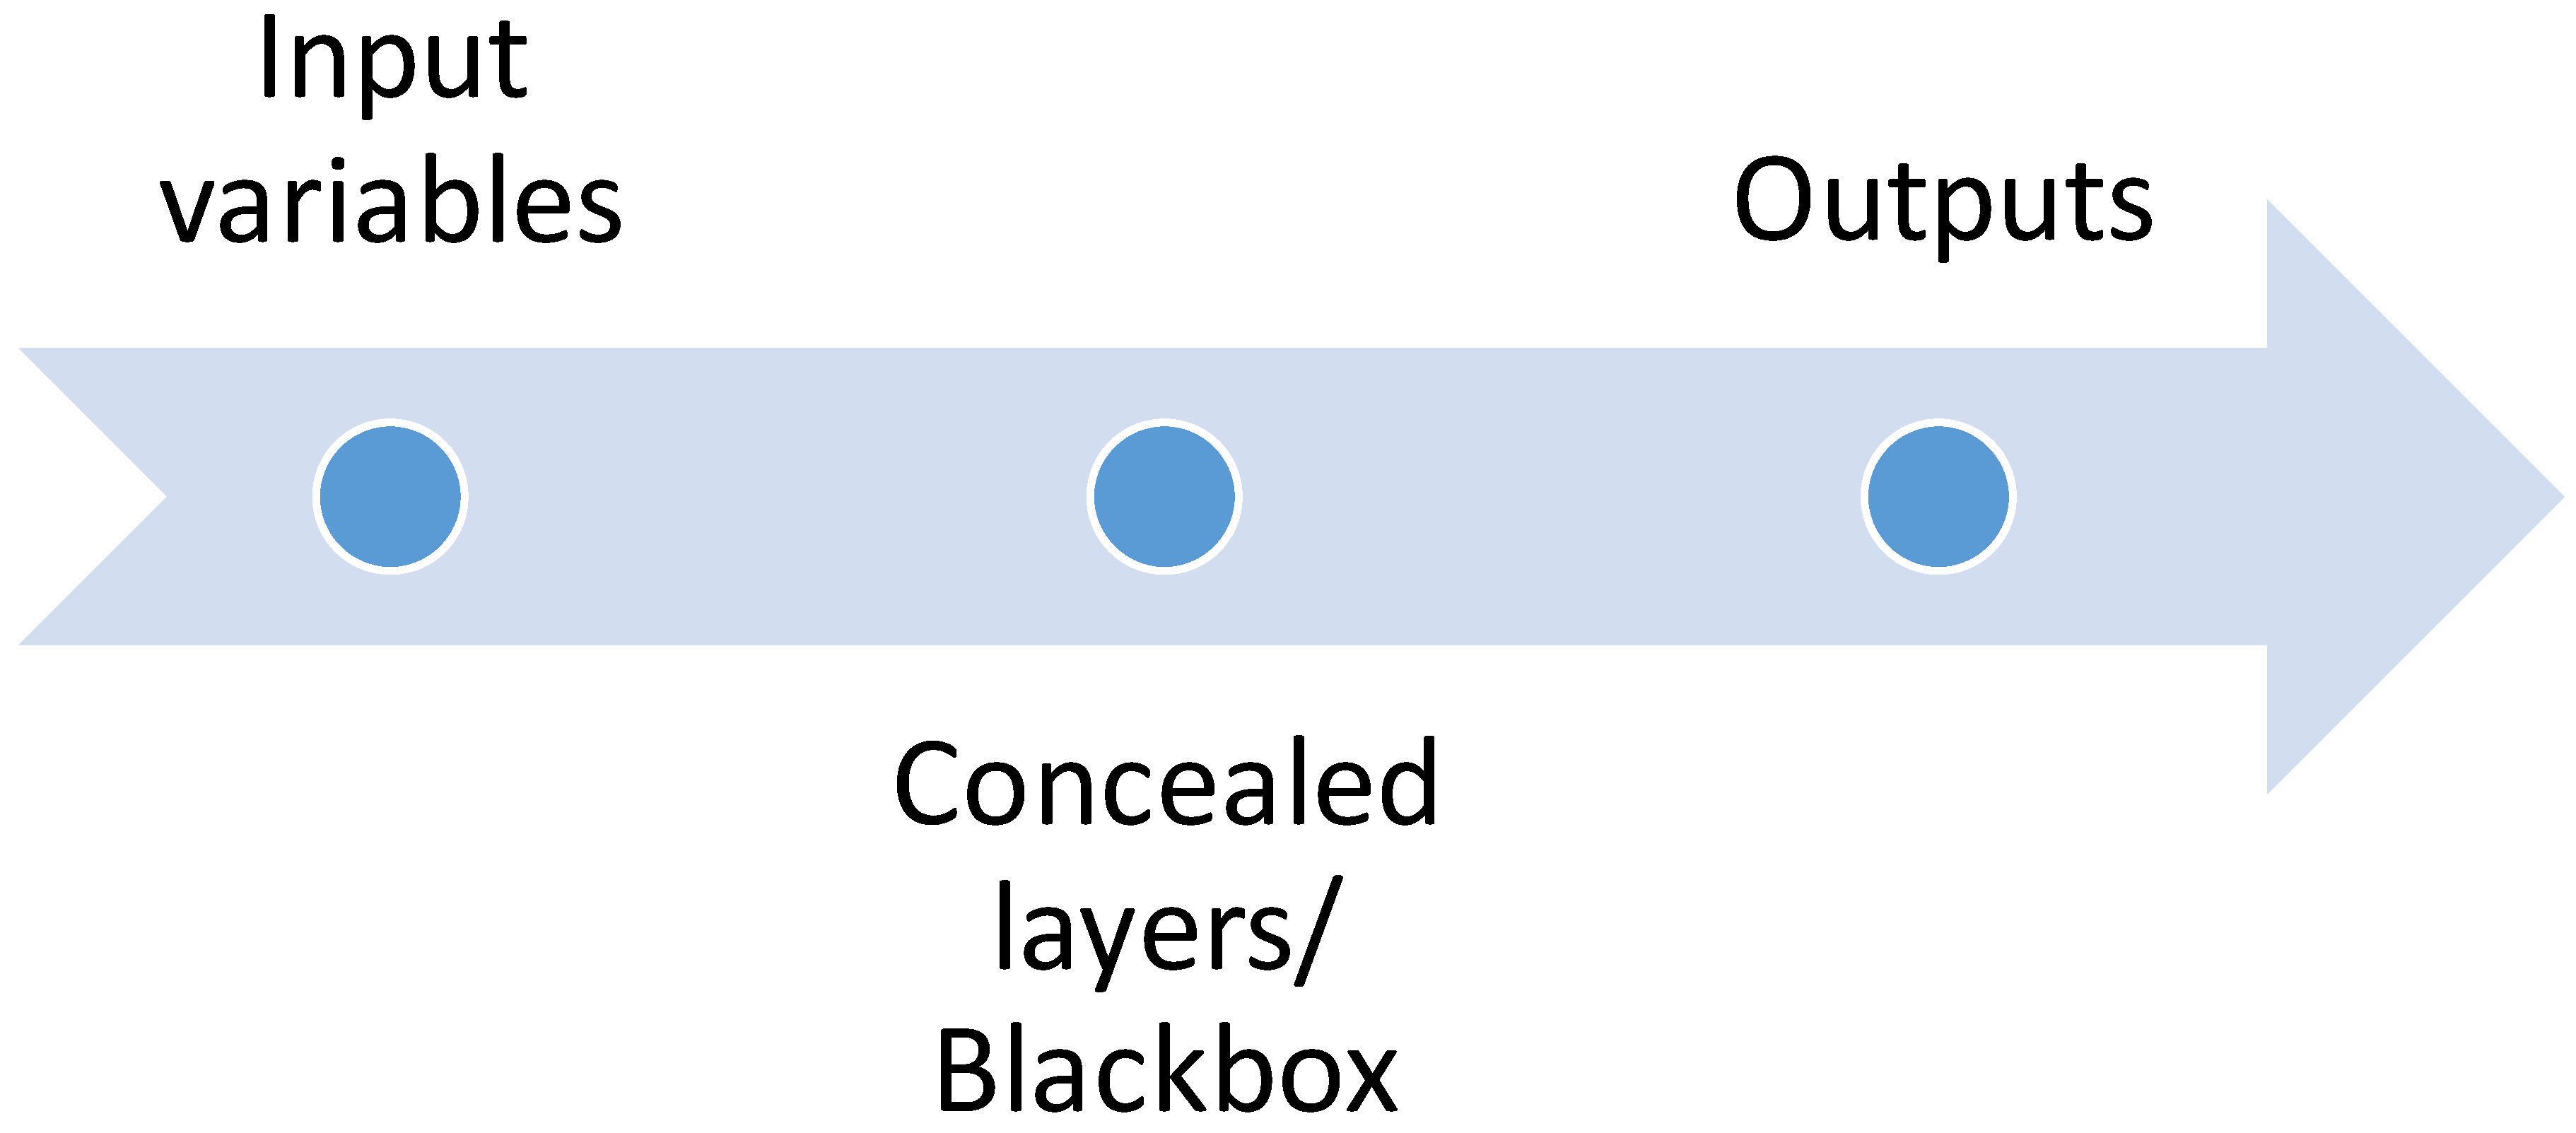
3.1.1. ANN
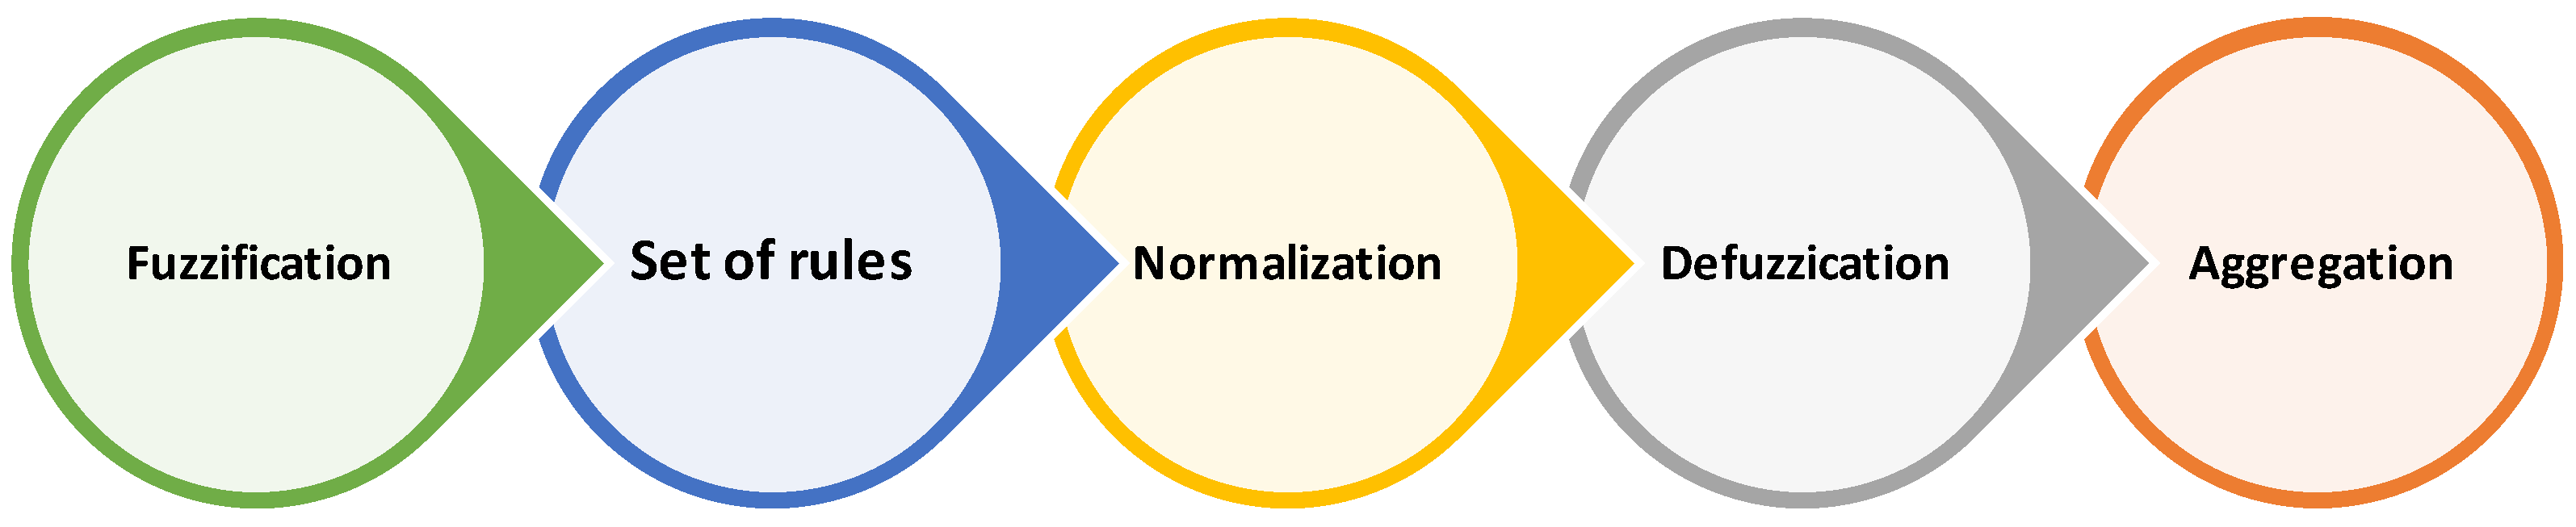
3.1.2. ANFIS
3.1.3. MNLR
3.1.4. LR
4. Results
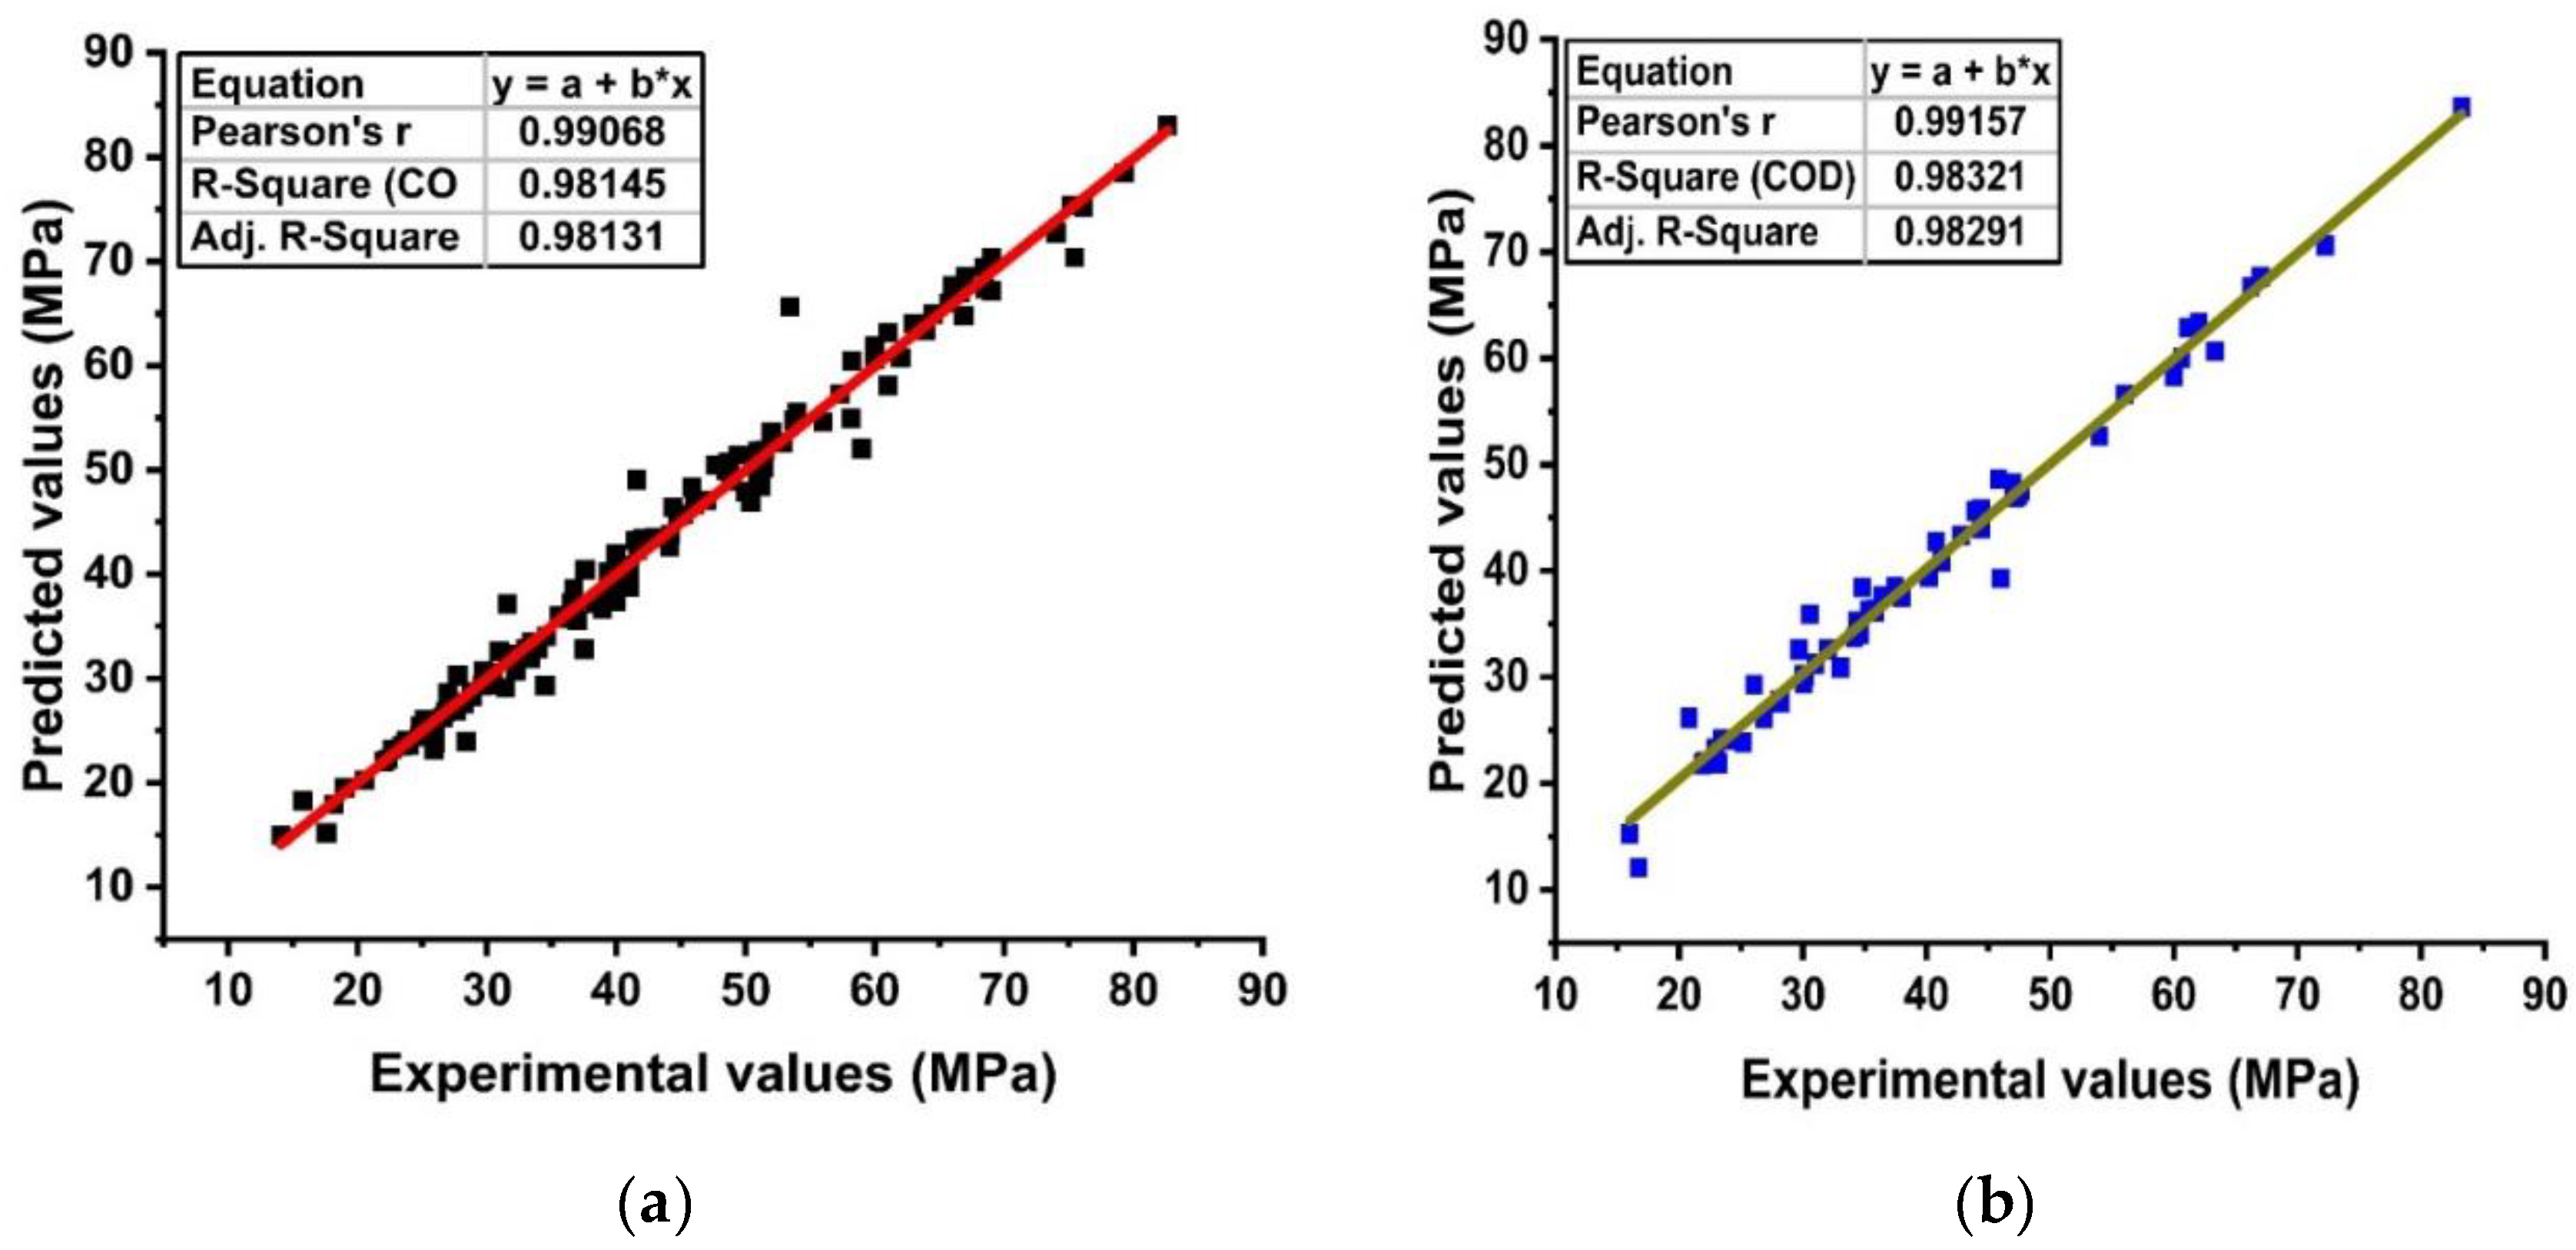
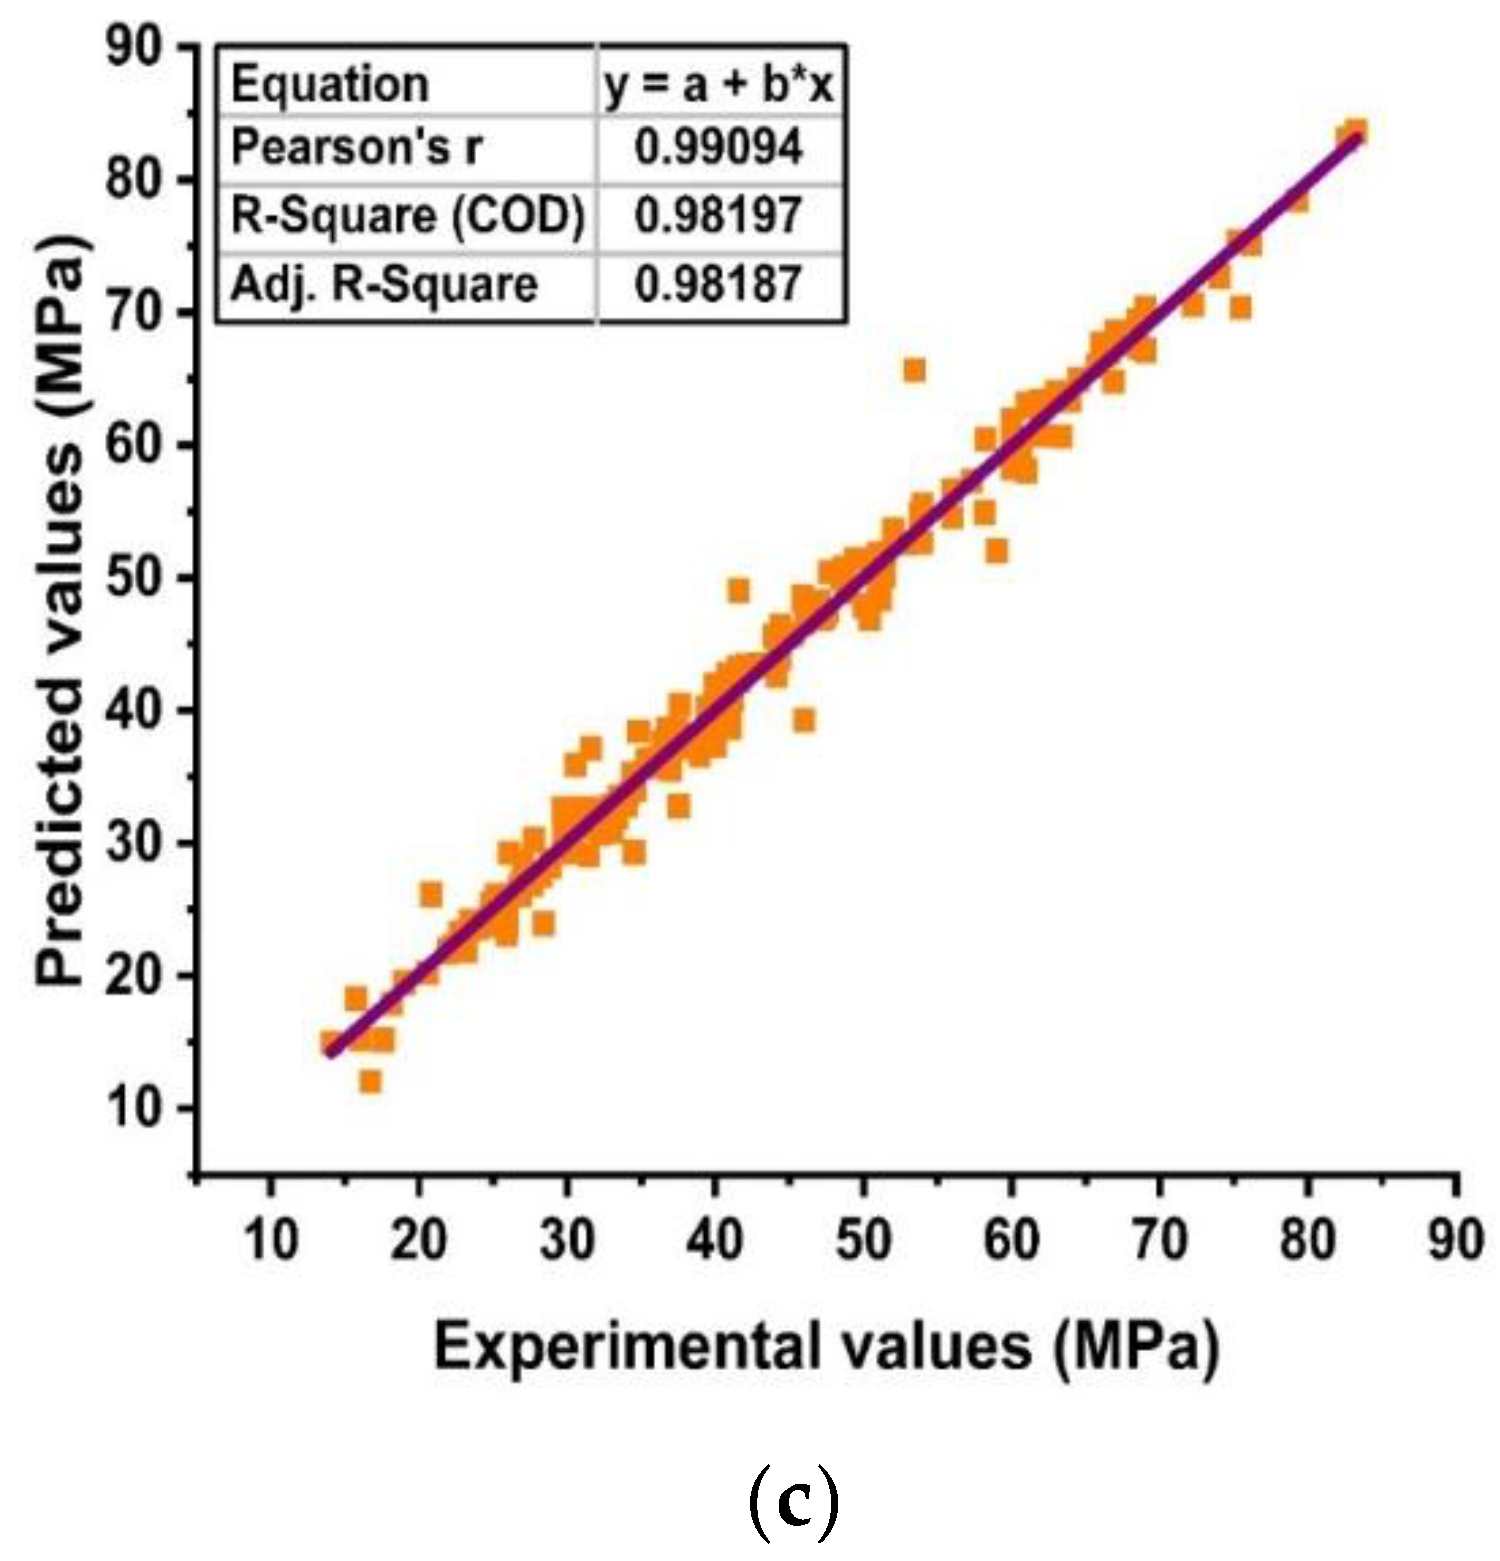
4.1. ANN
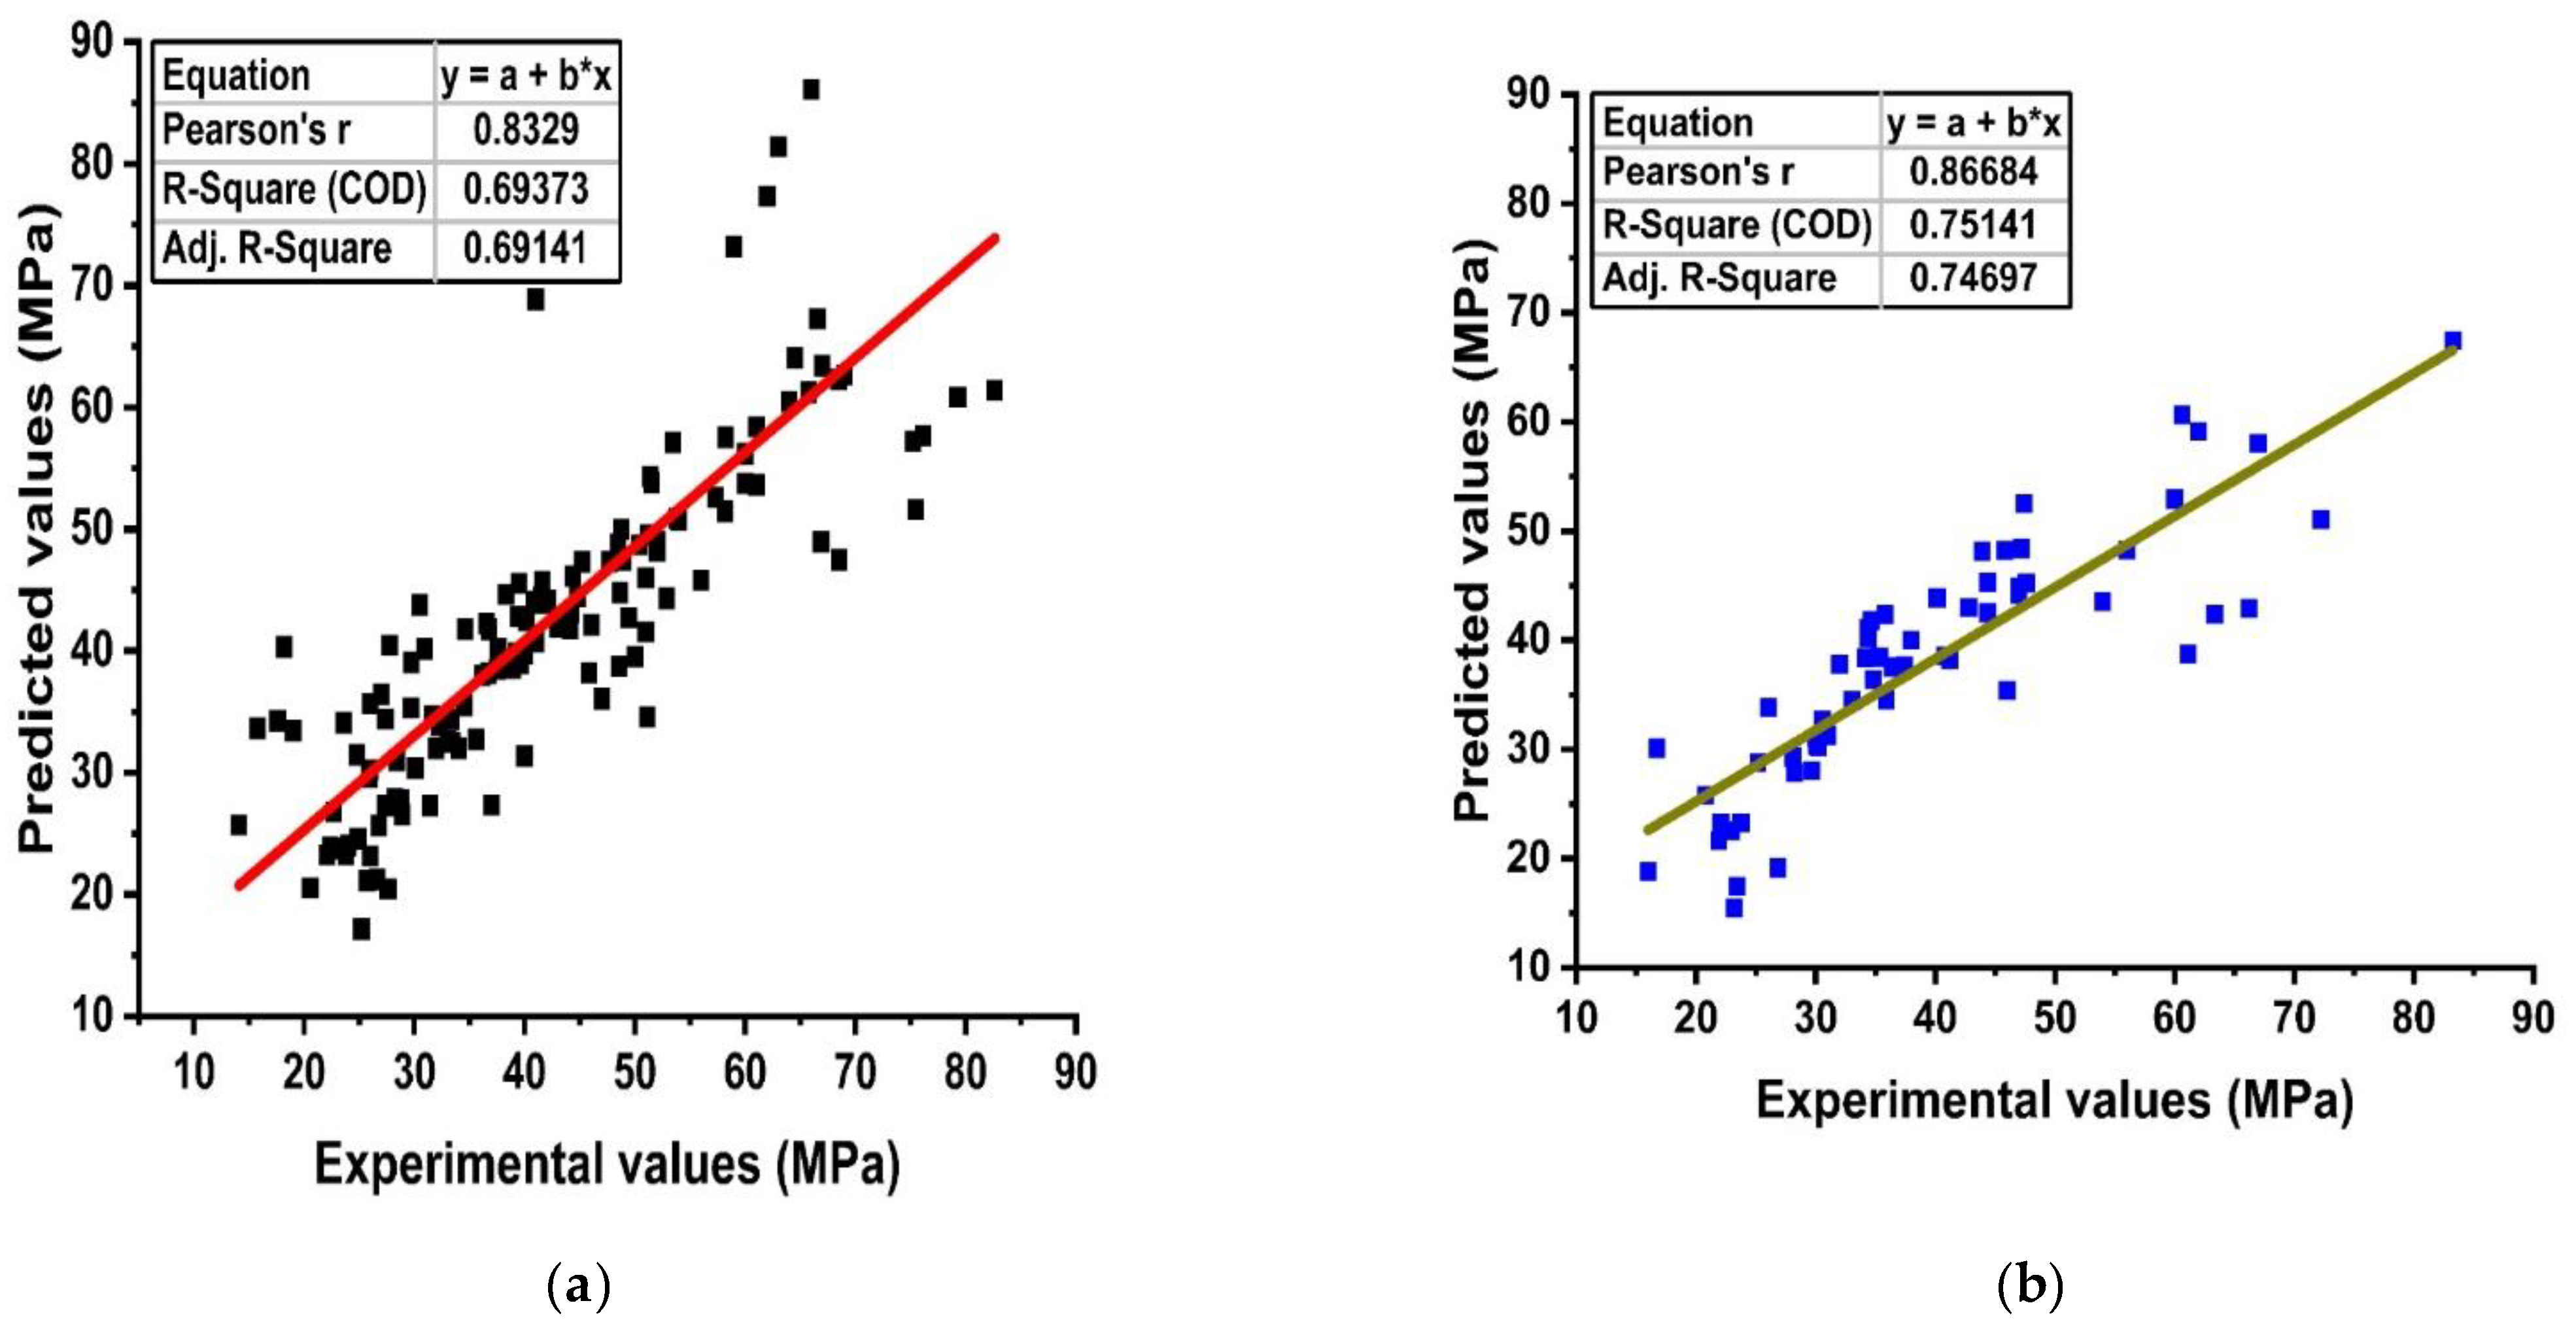
4.2. ANFIS
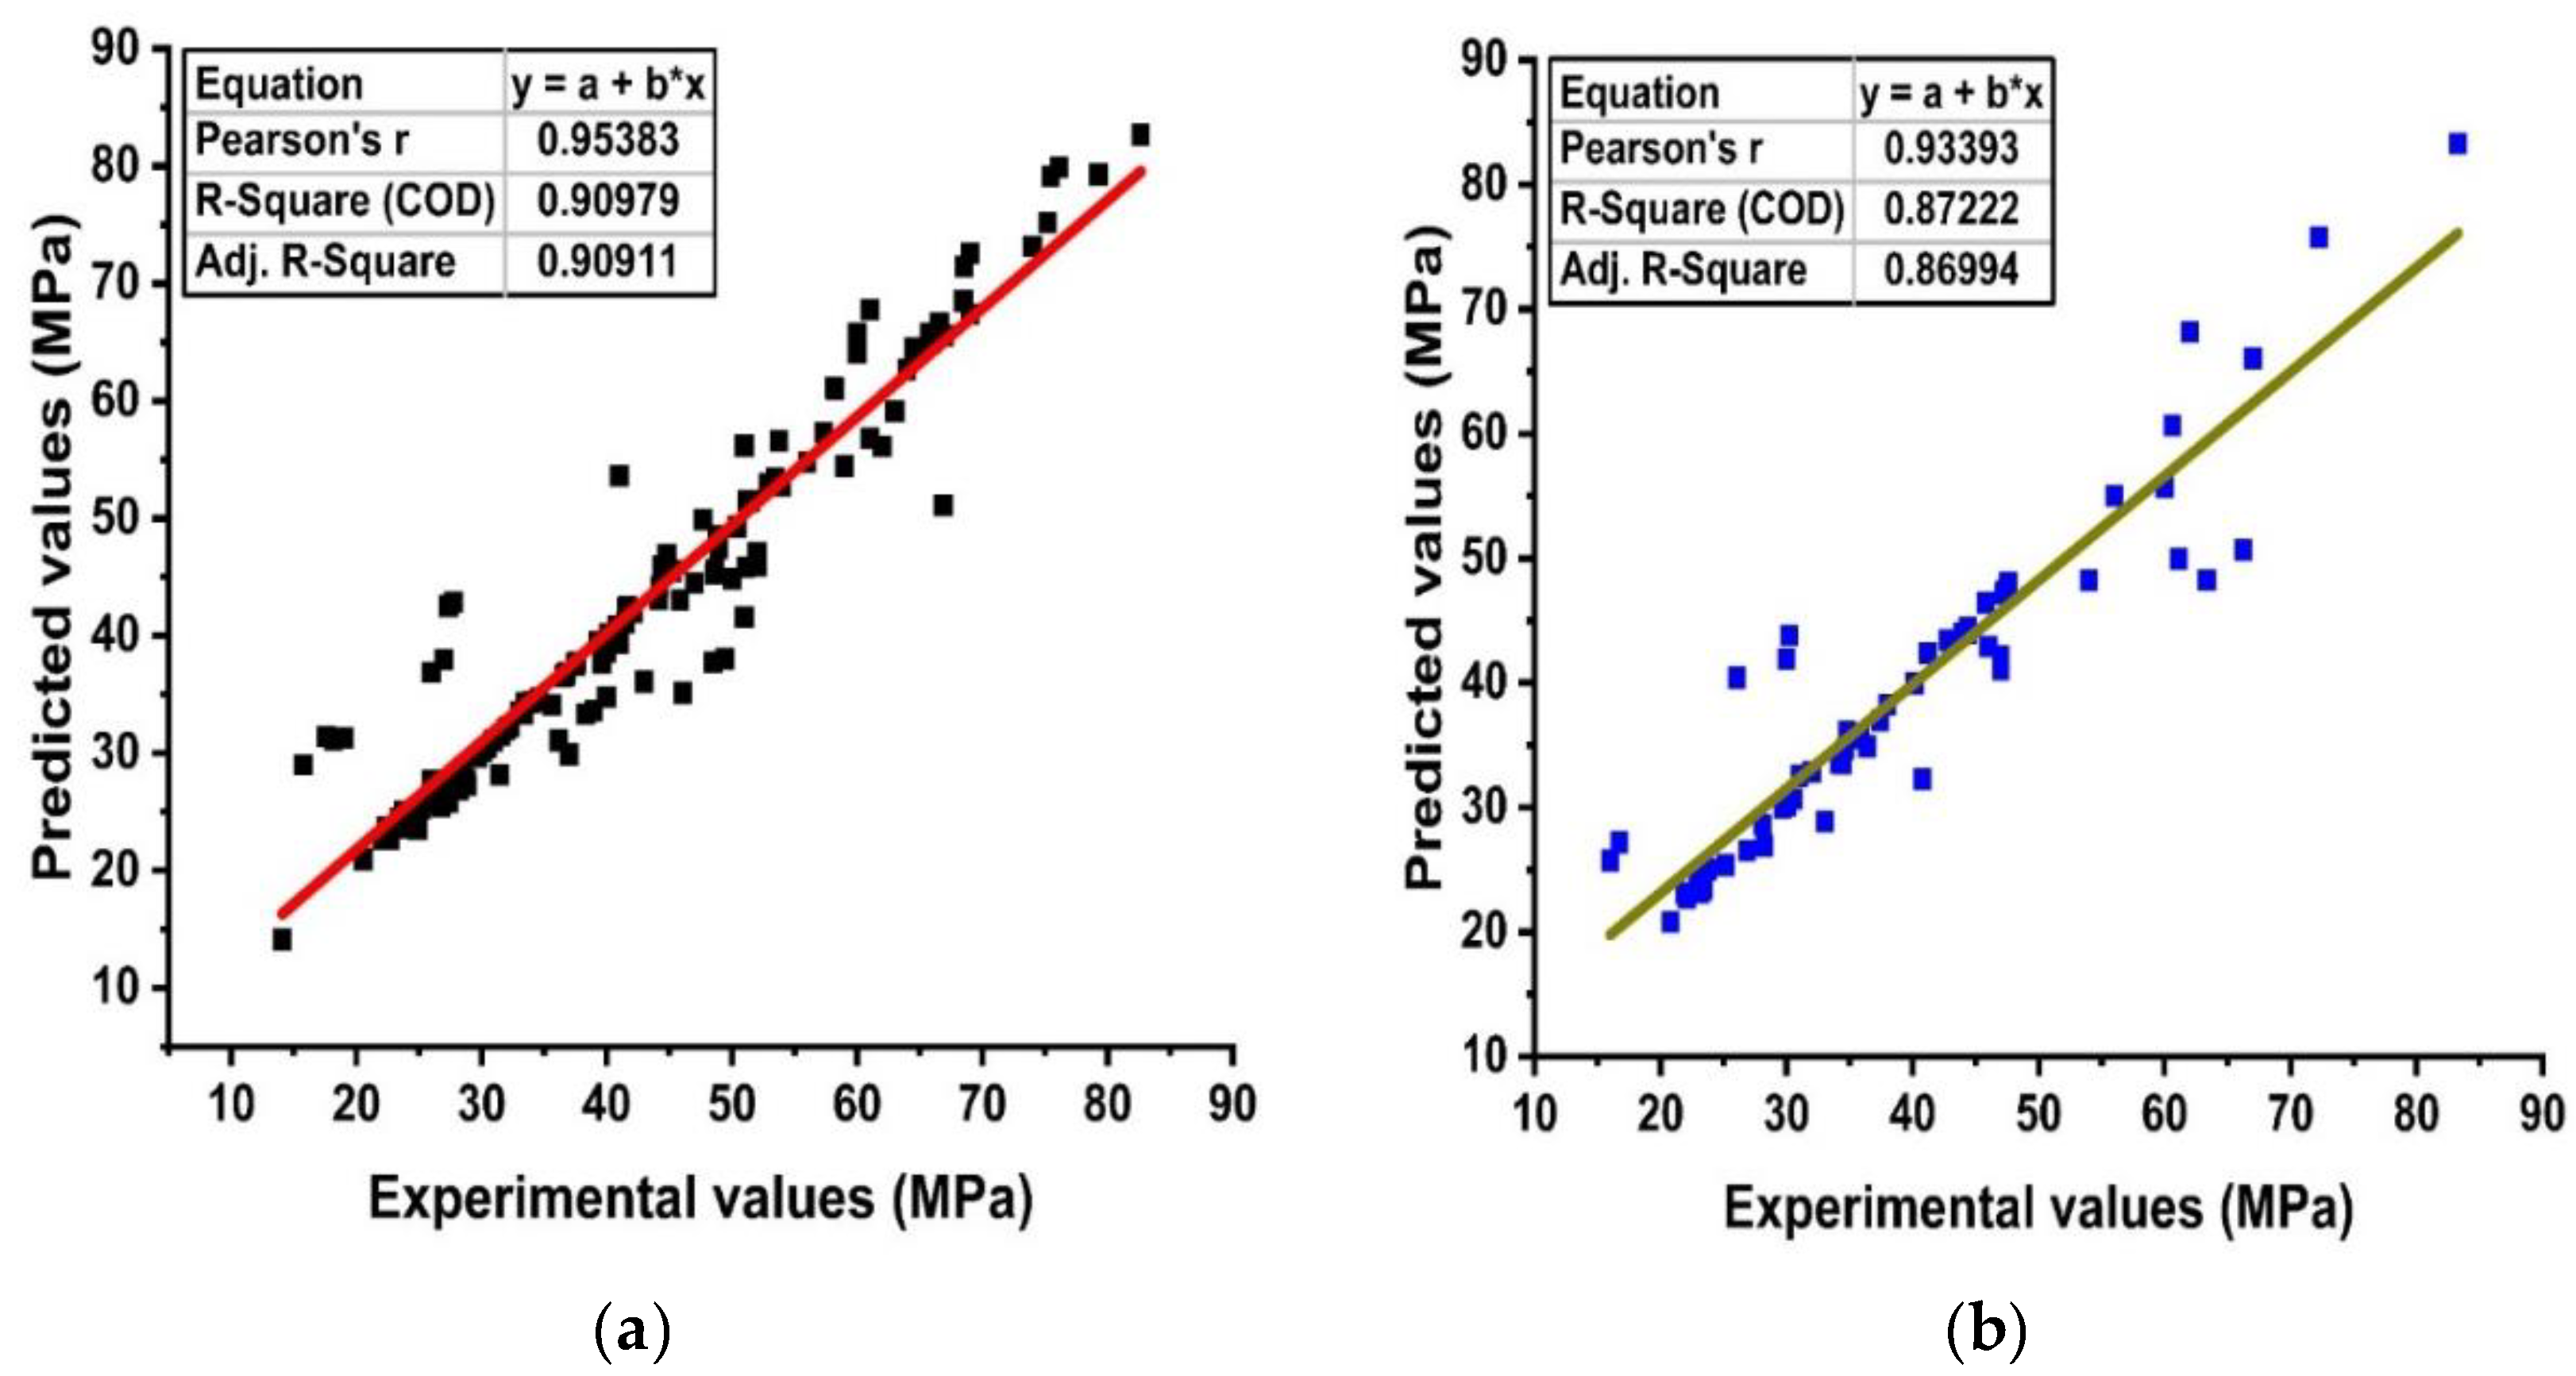
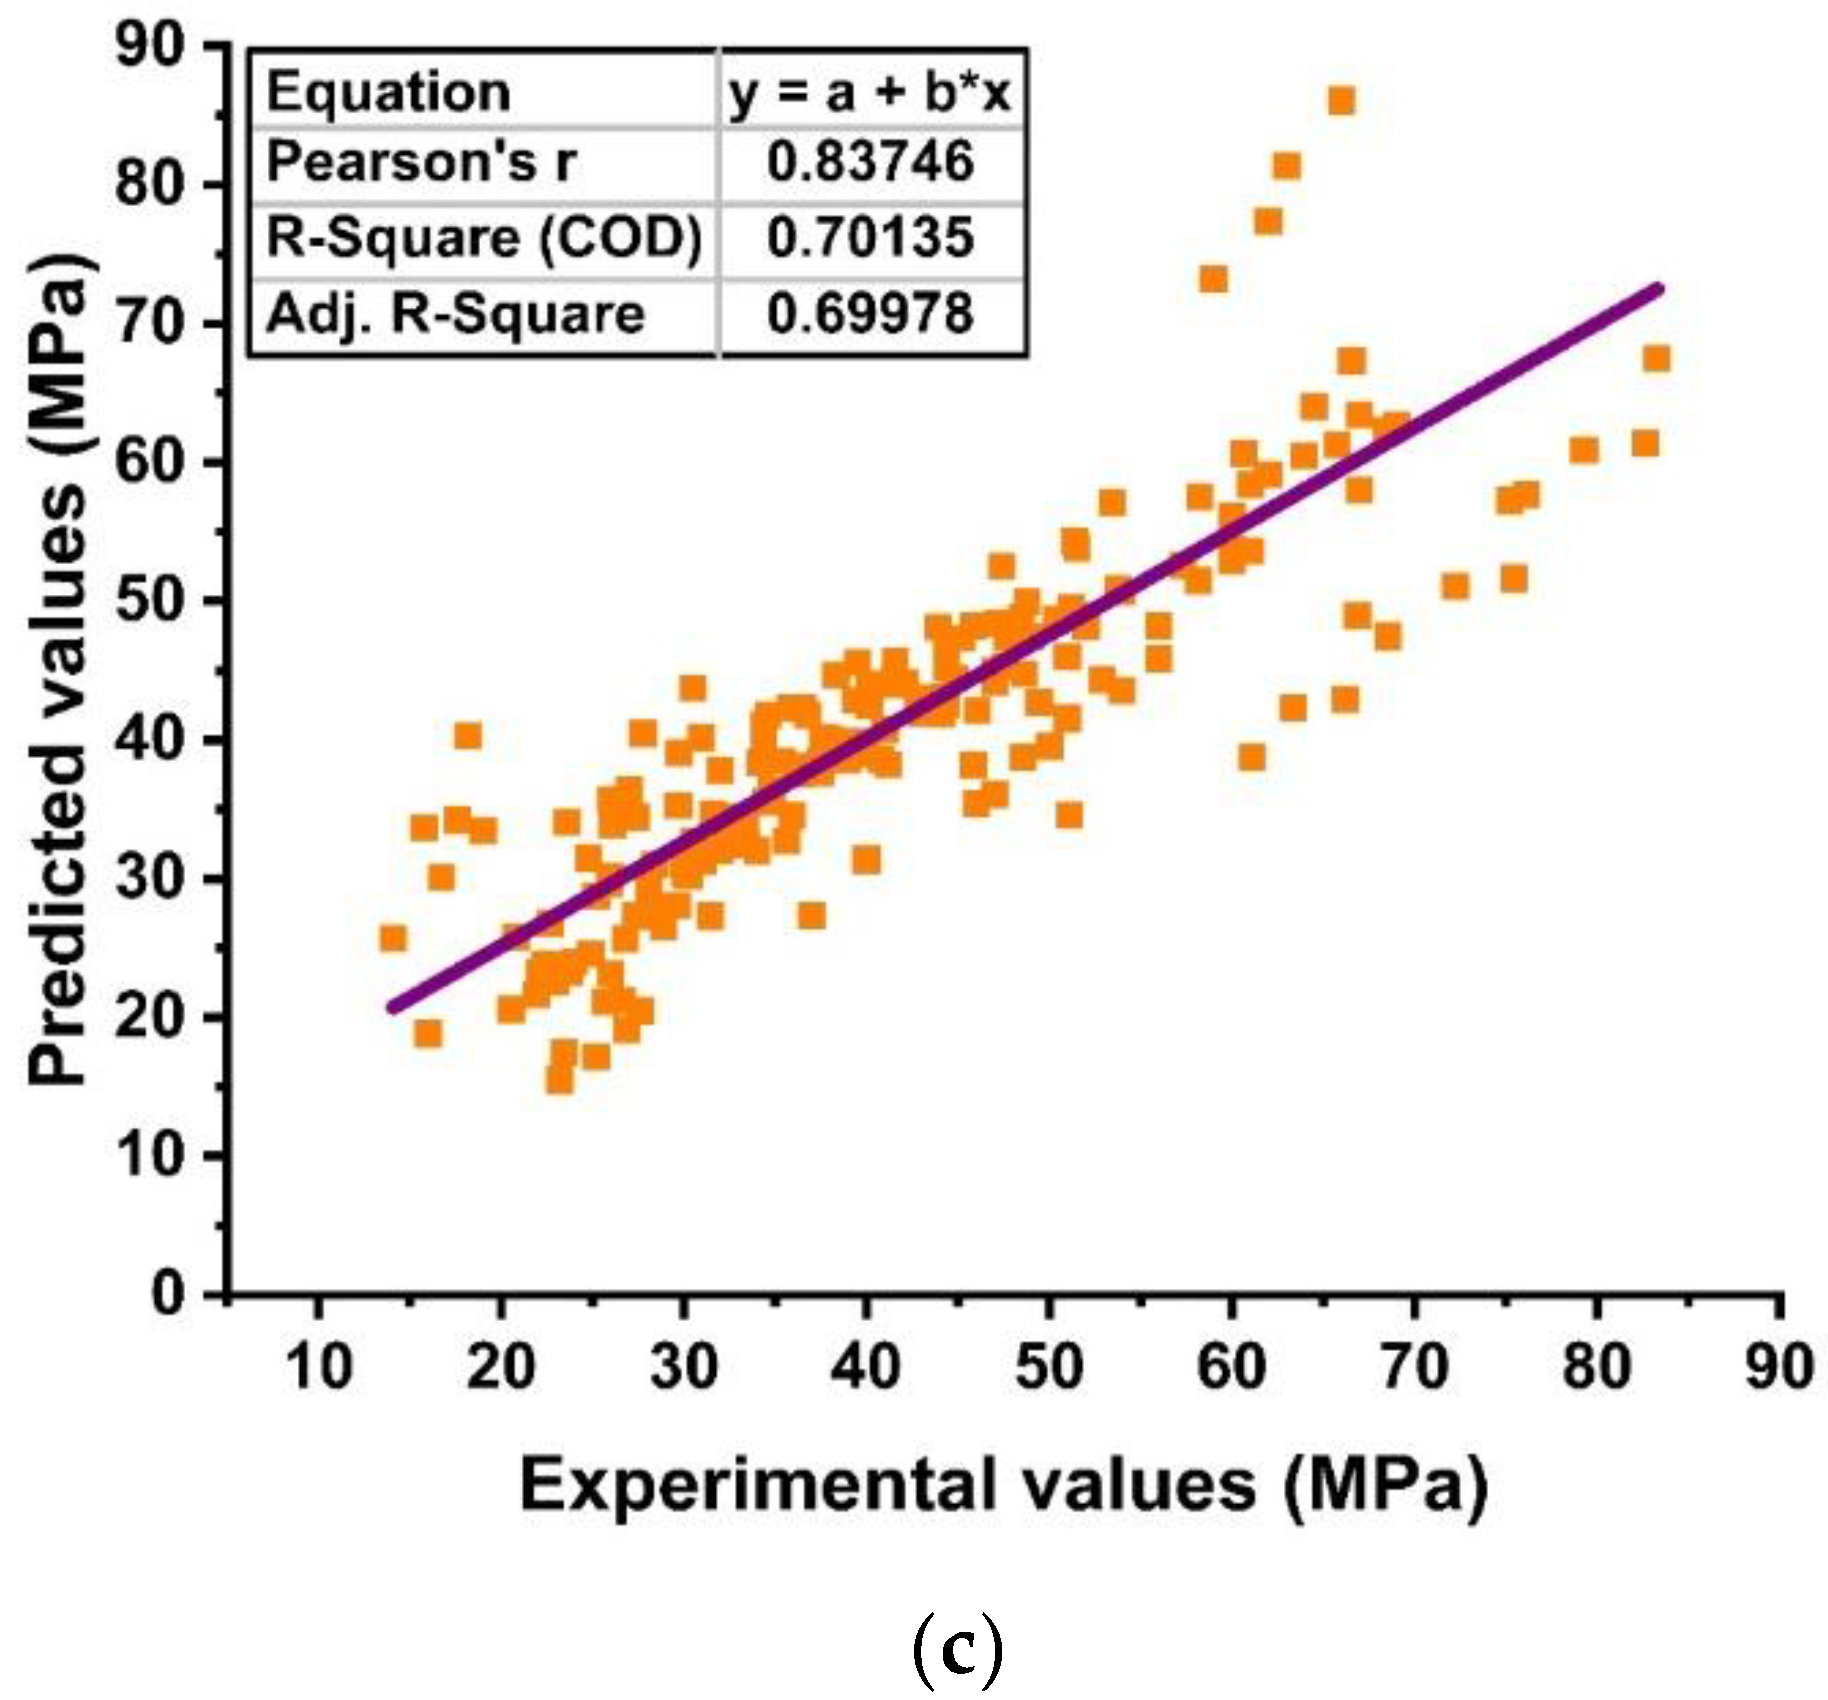
4.3. MNLR
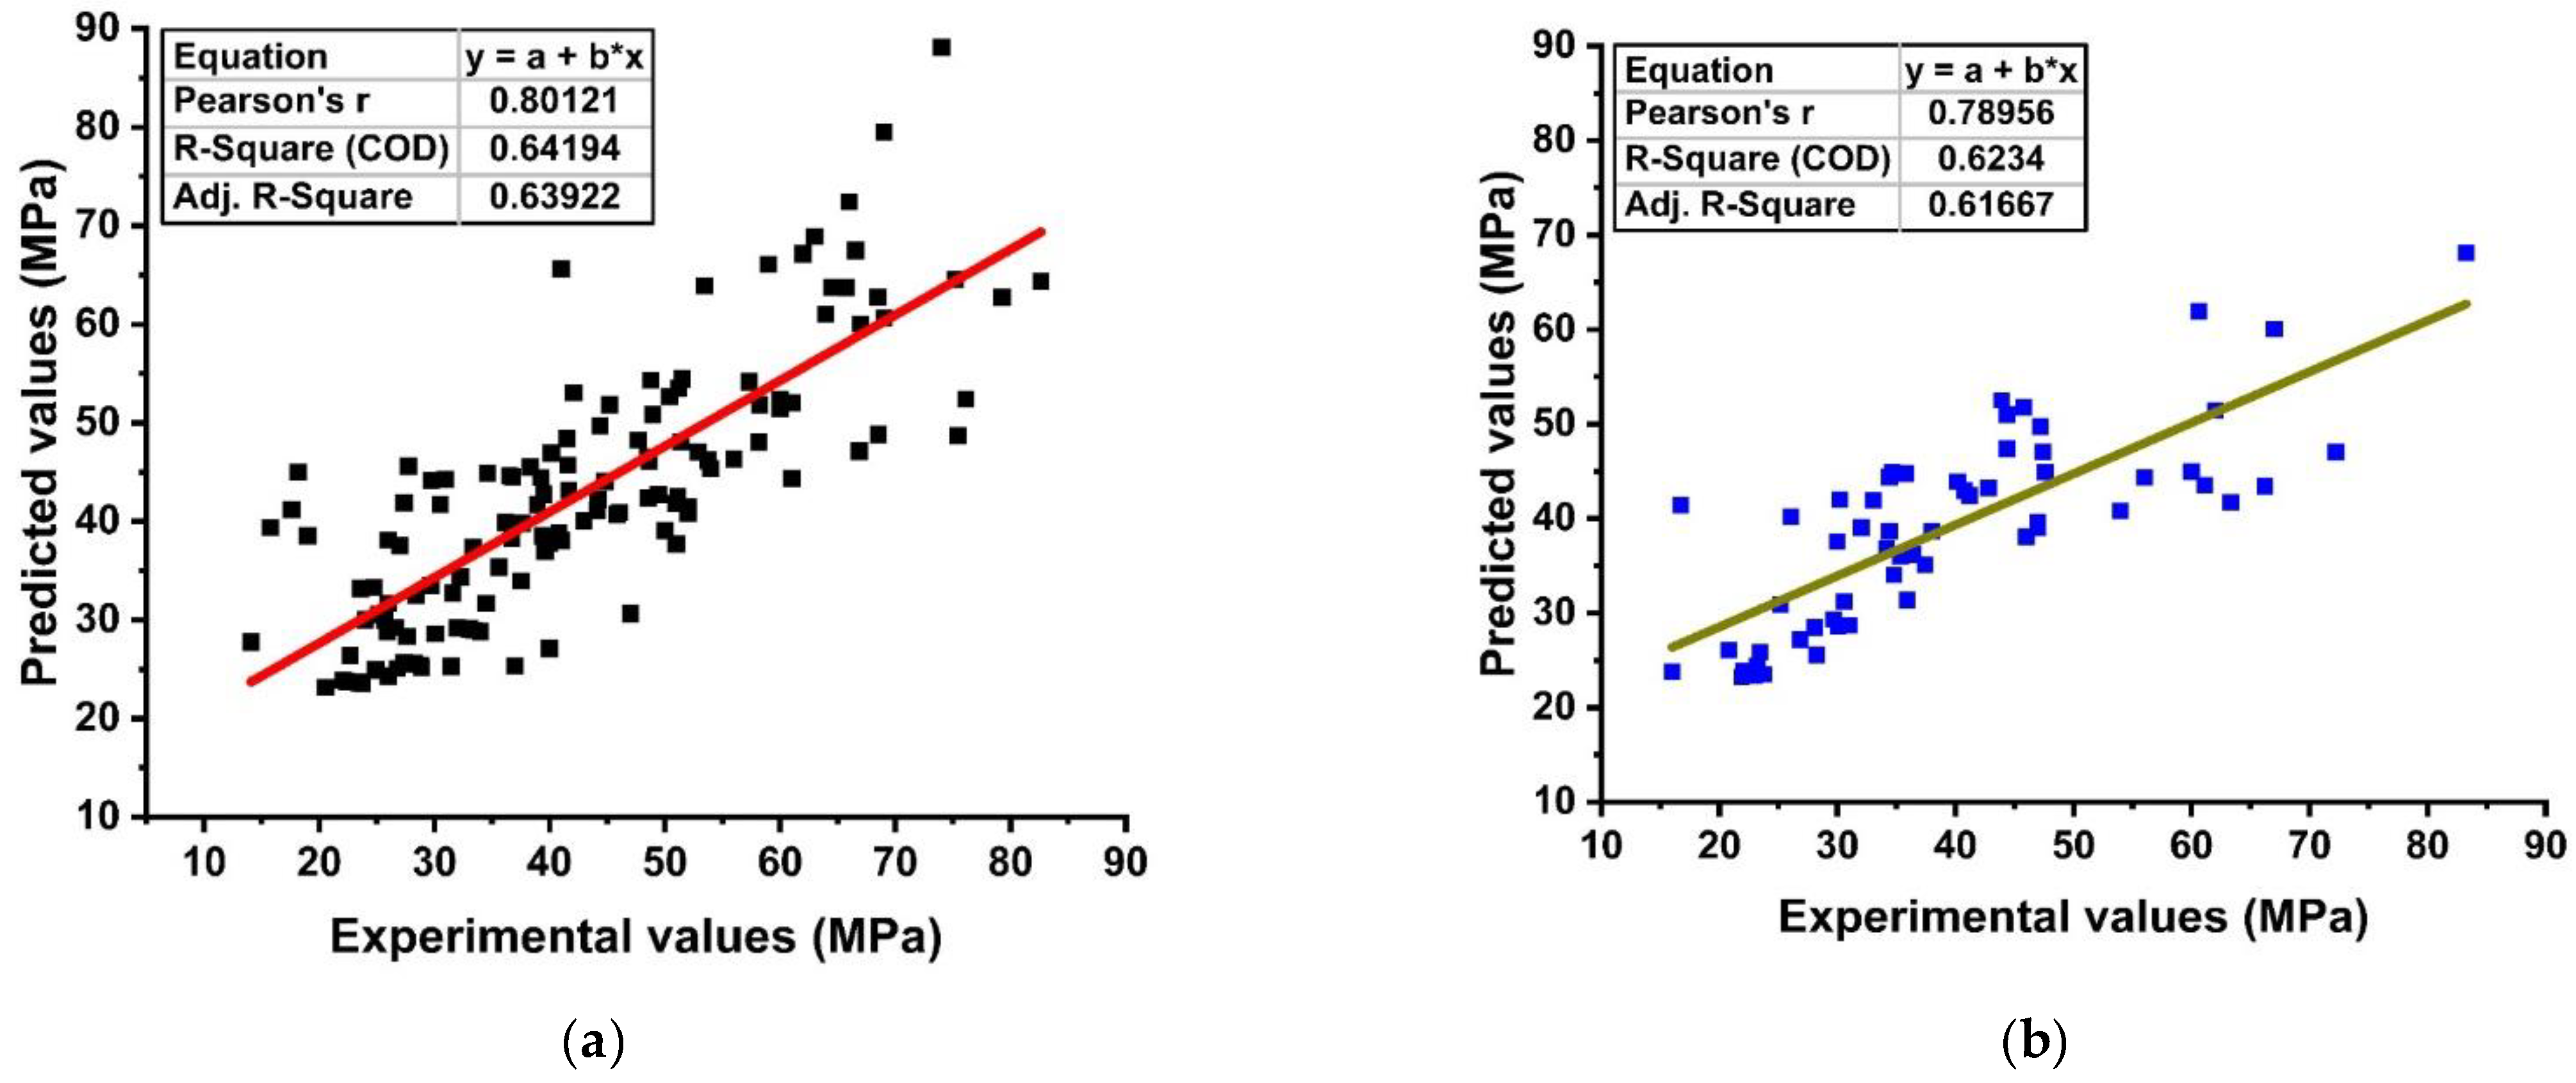
4.4. LR 40
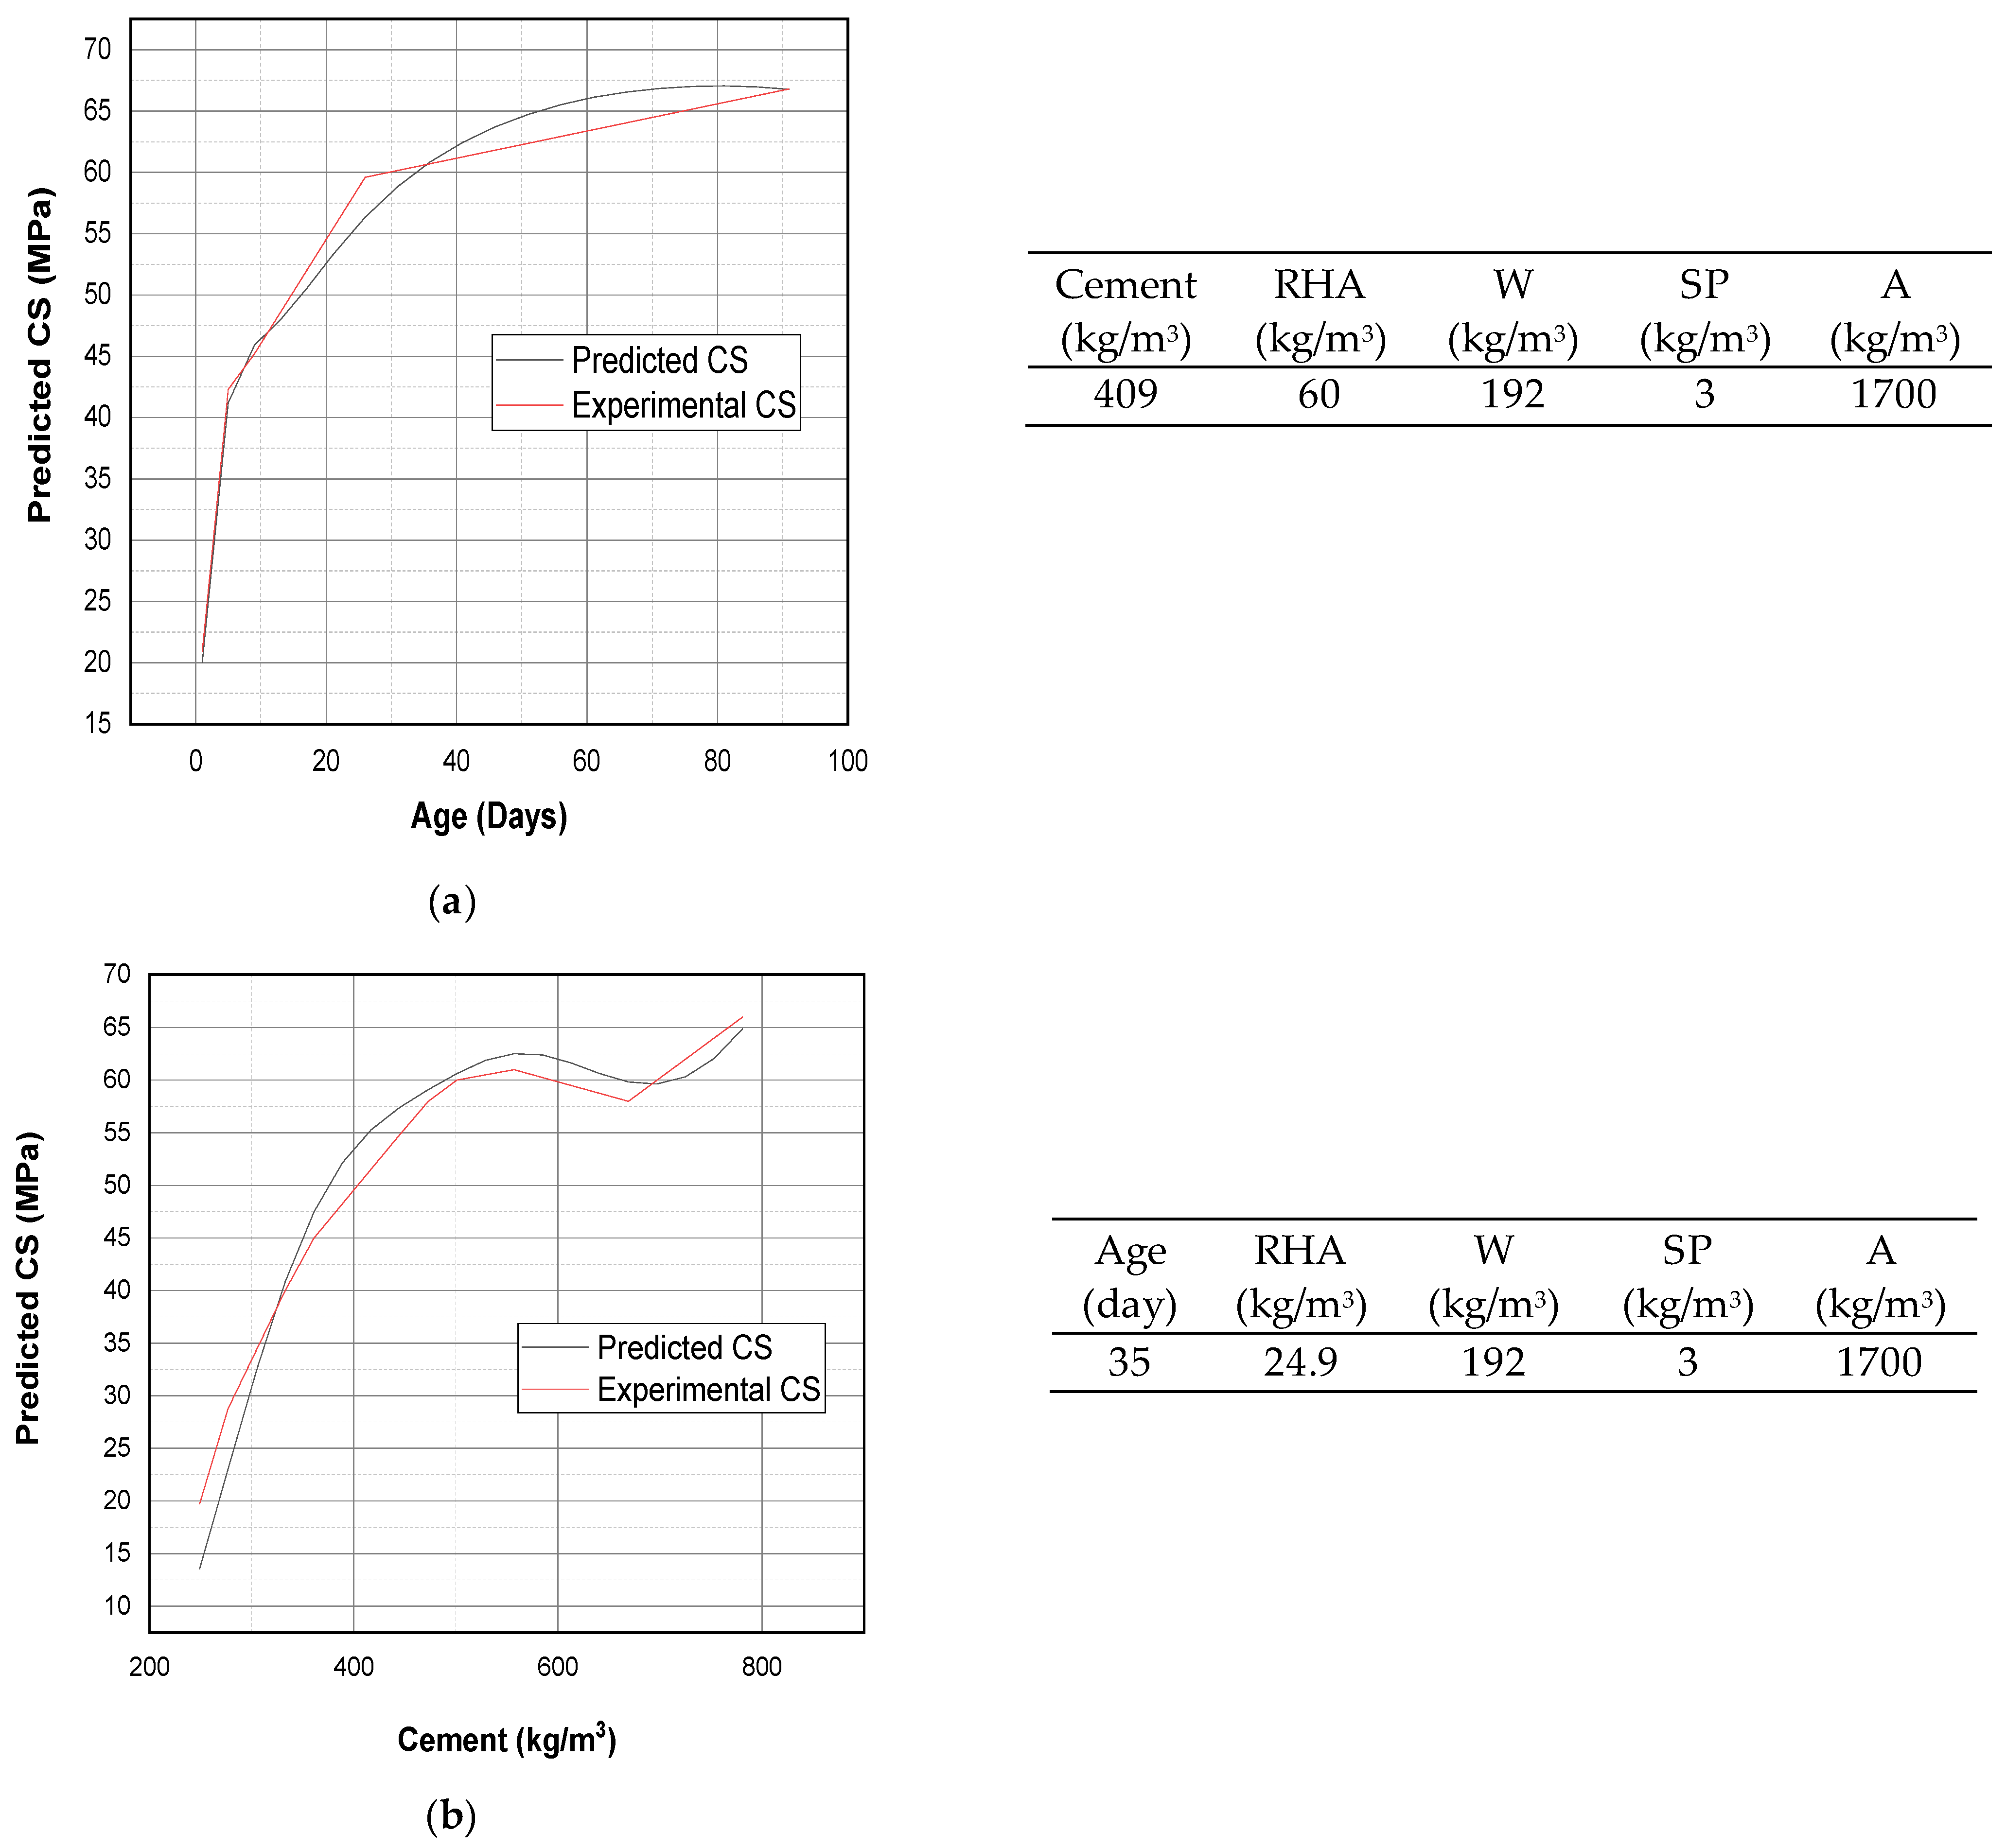
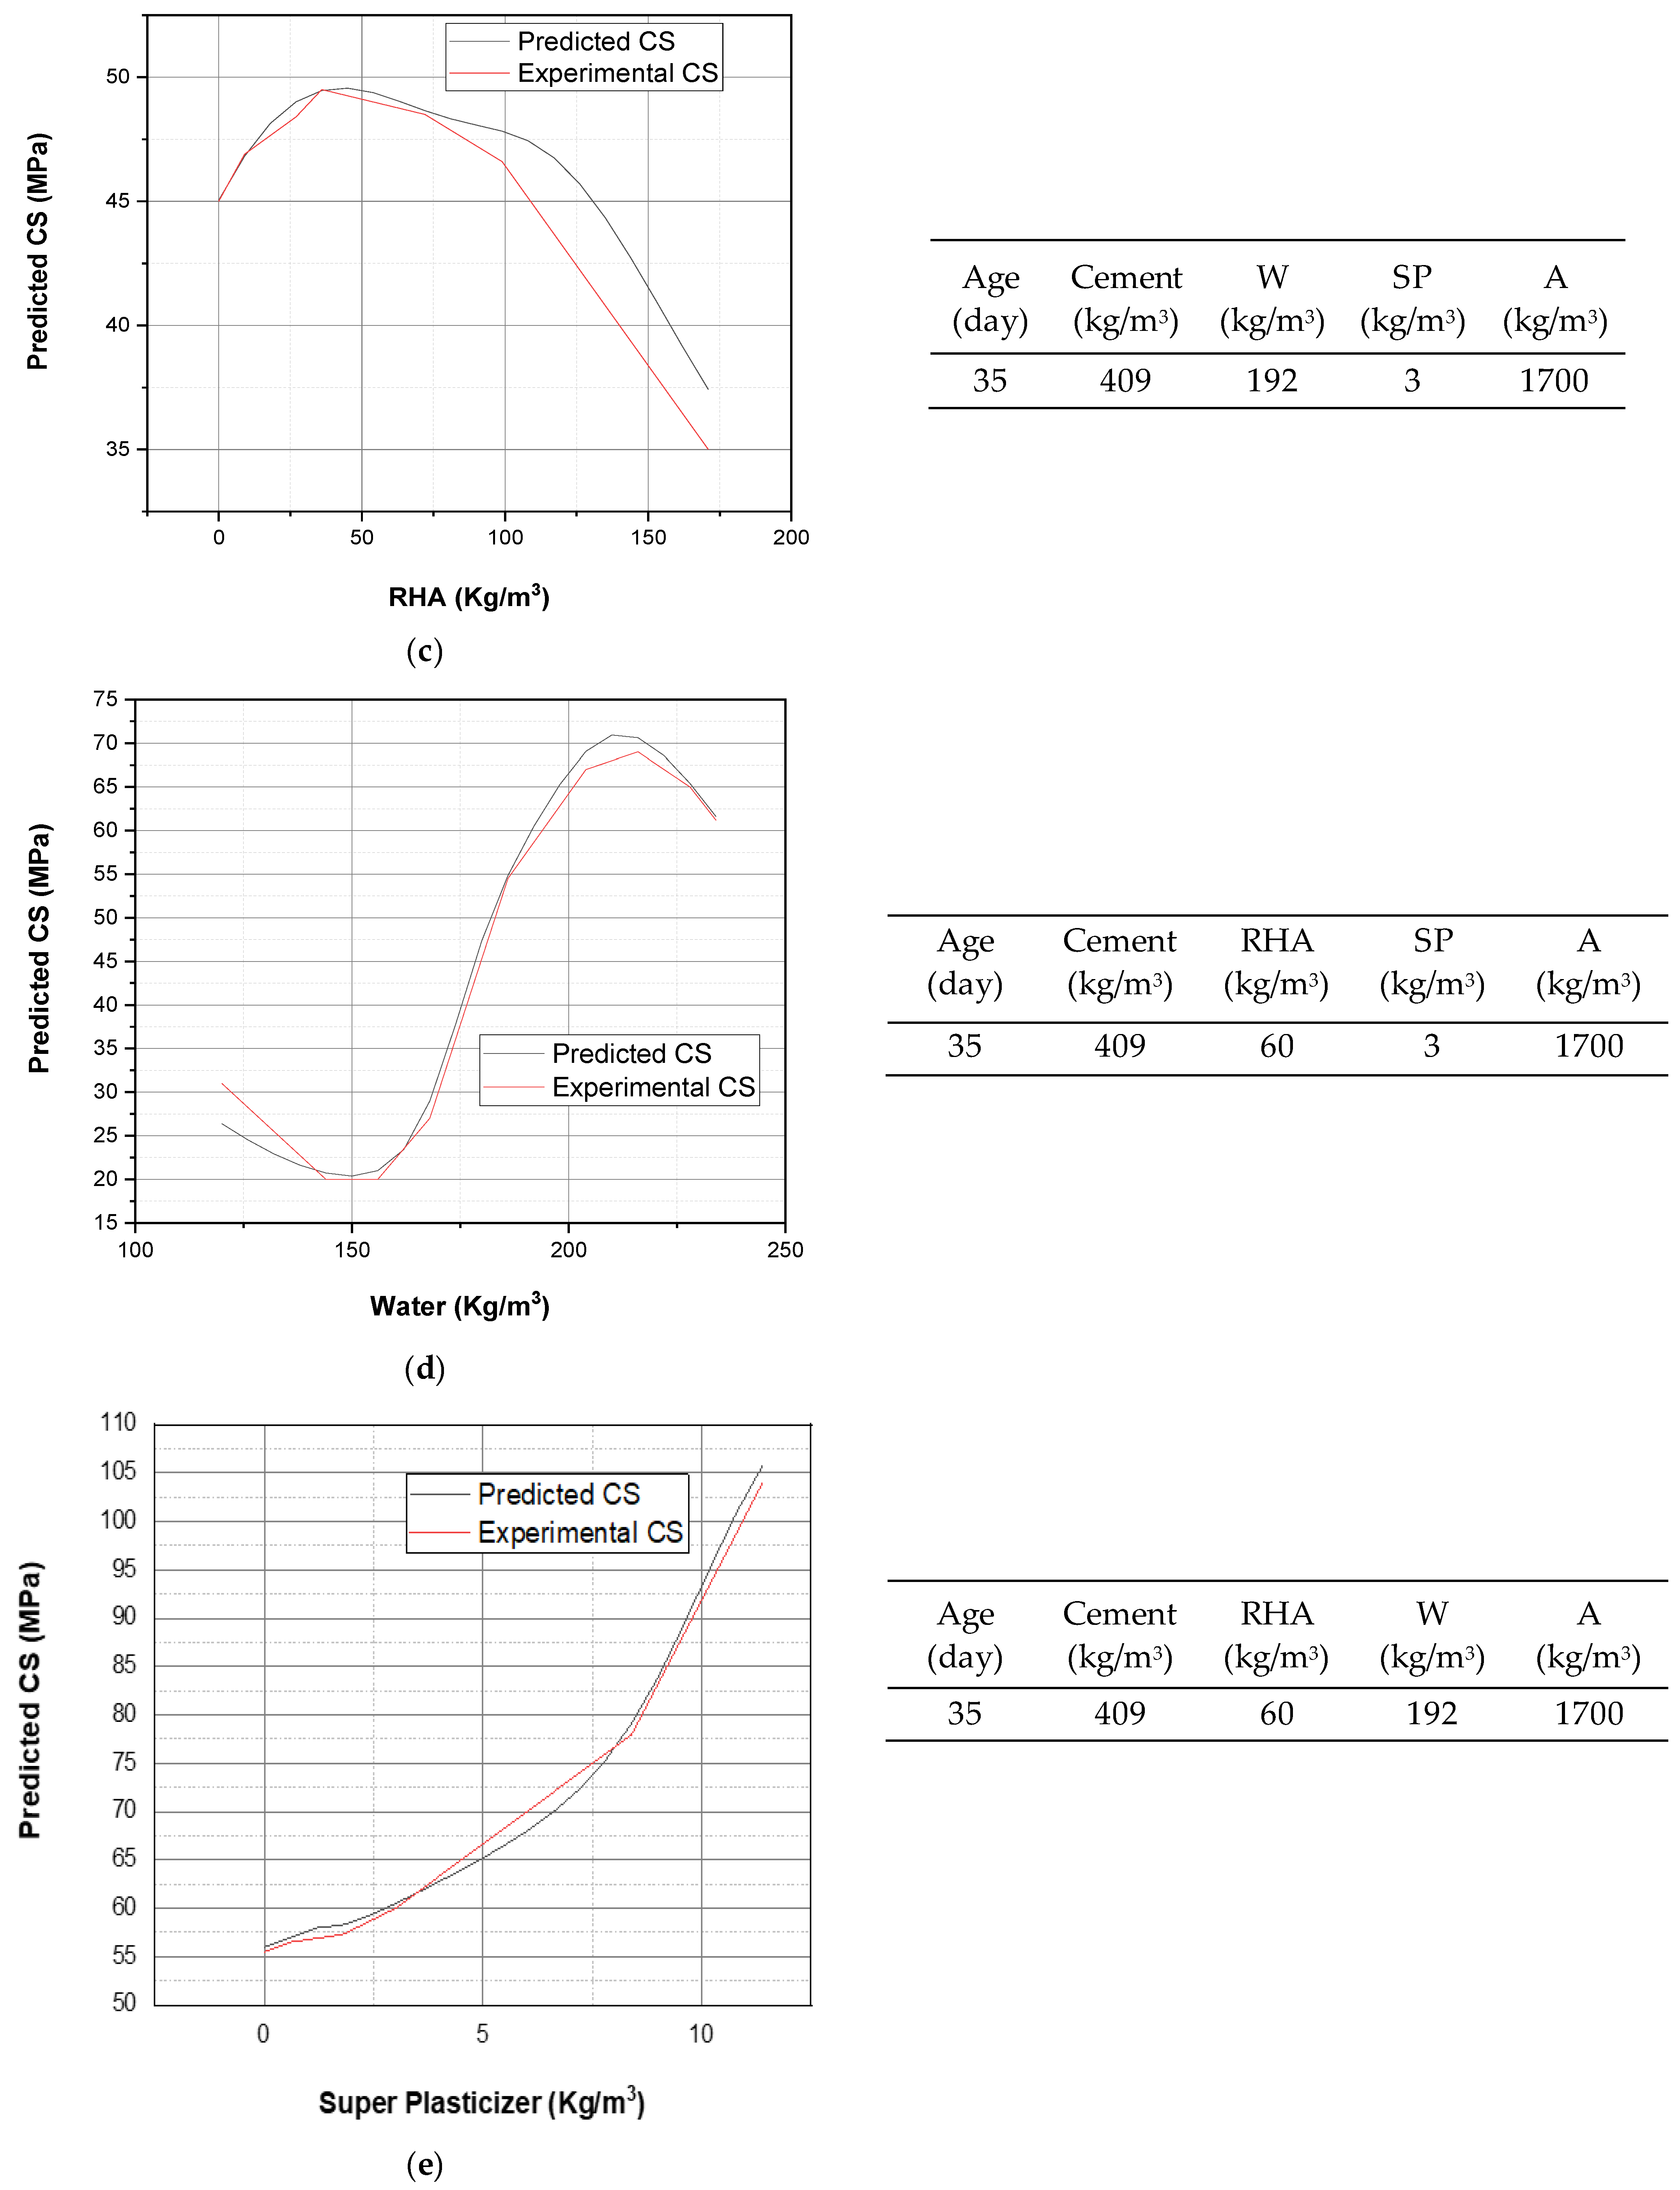
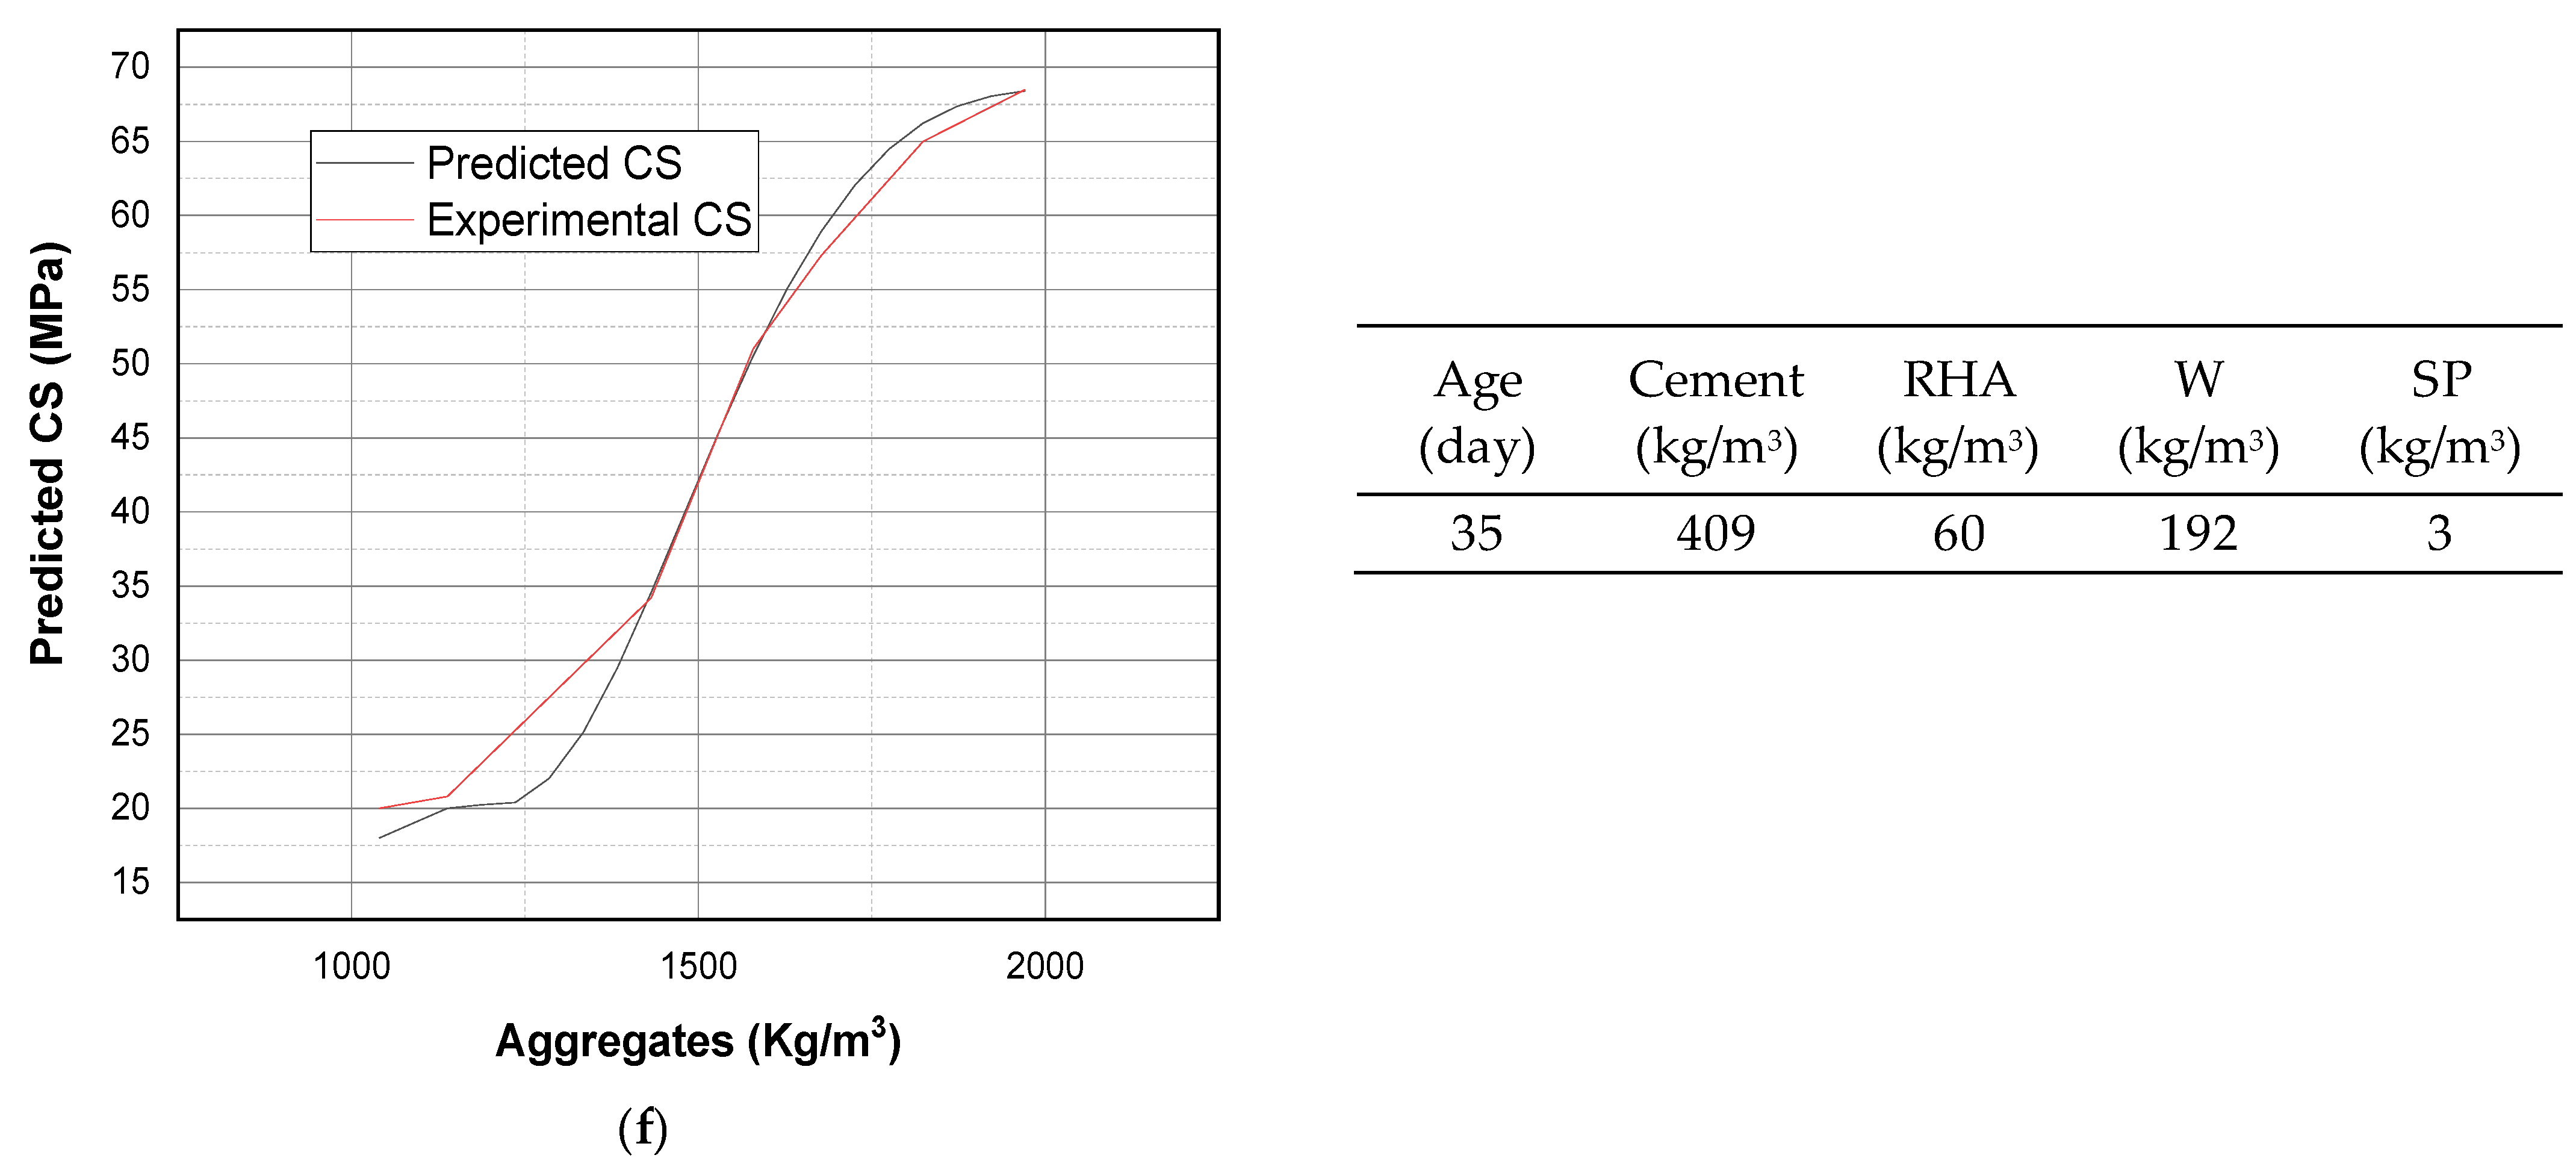
4.5. Sensitivity and Parametric Analysis
5. Conclusions
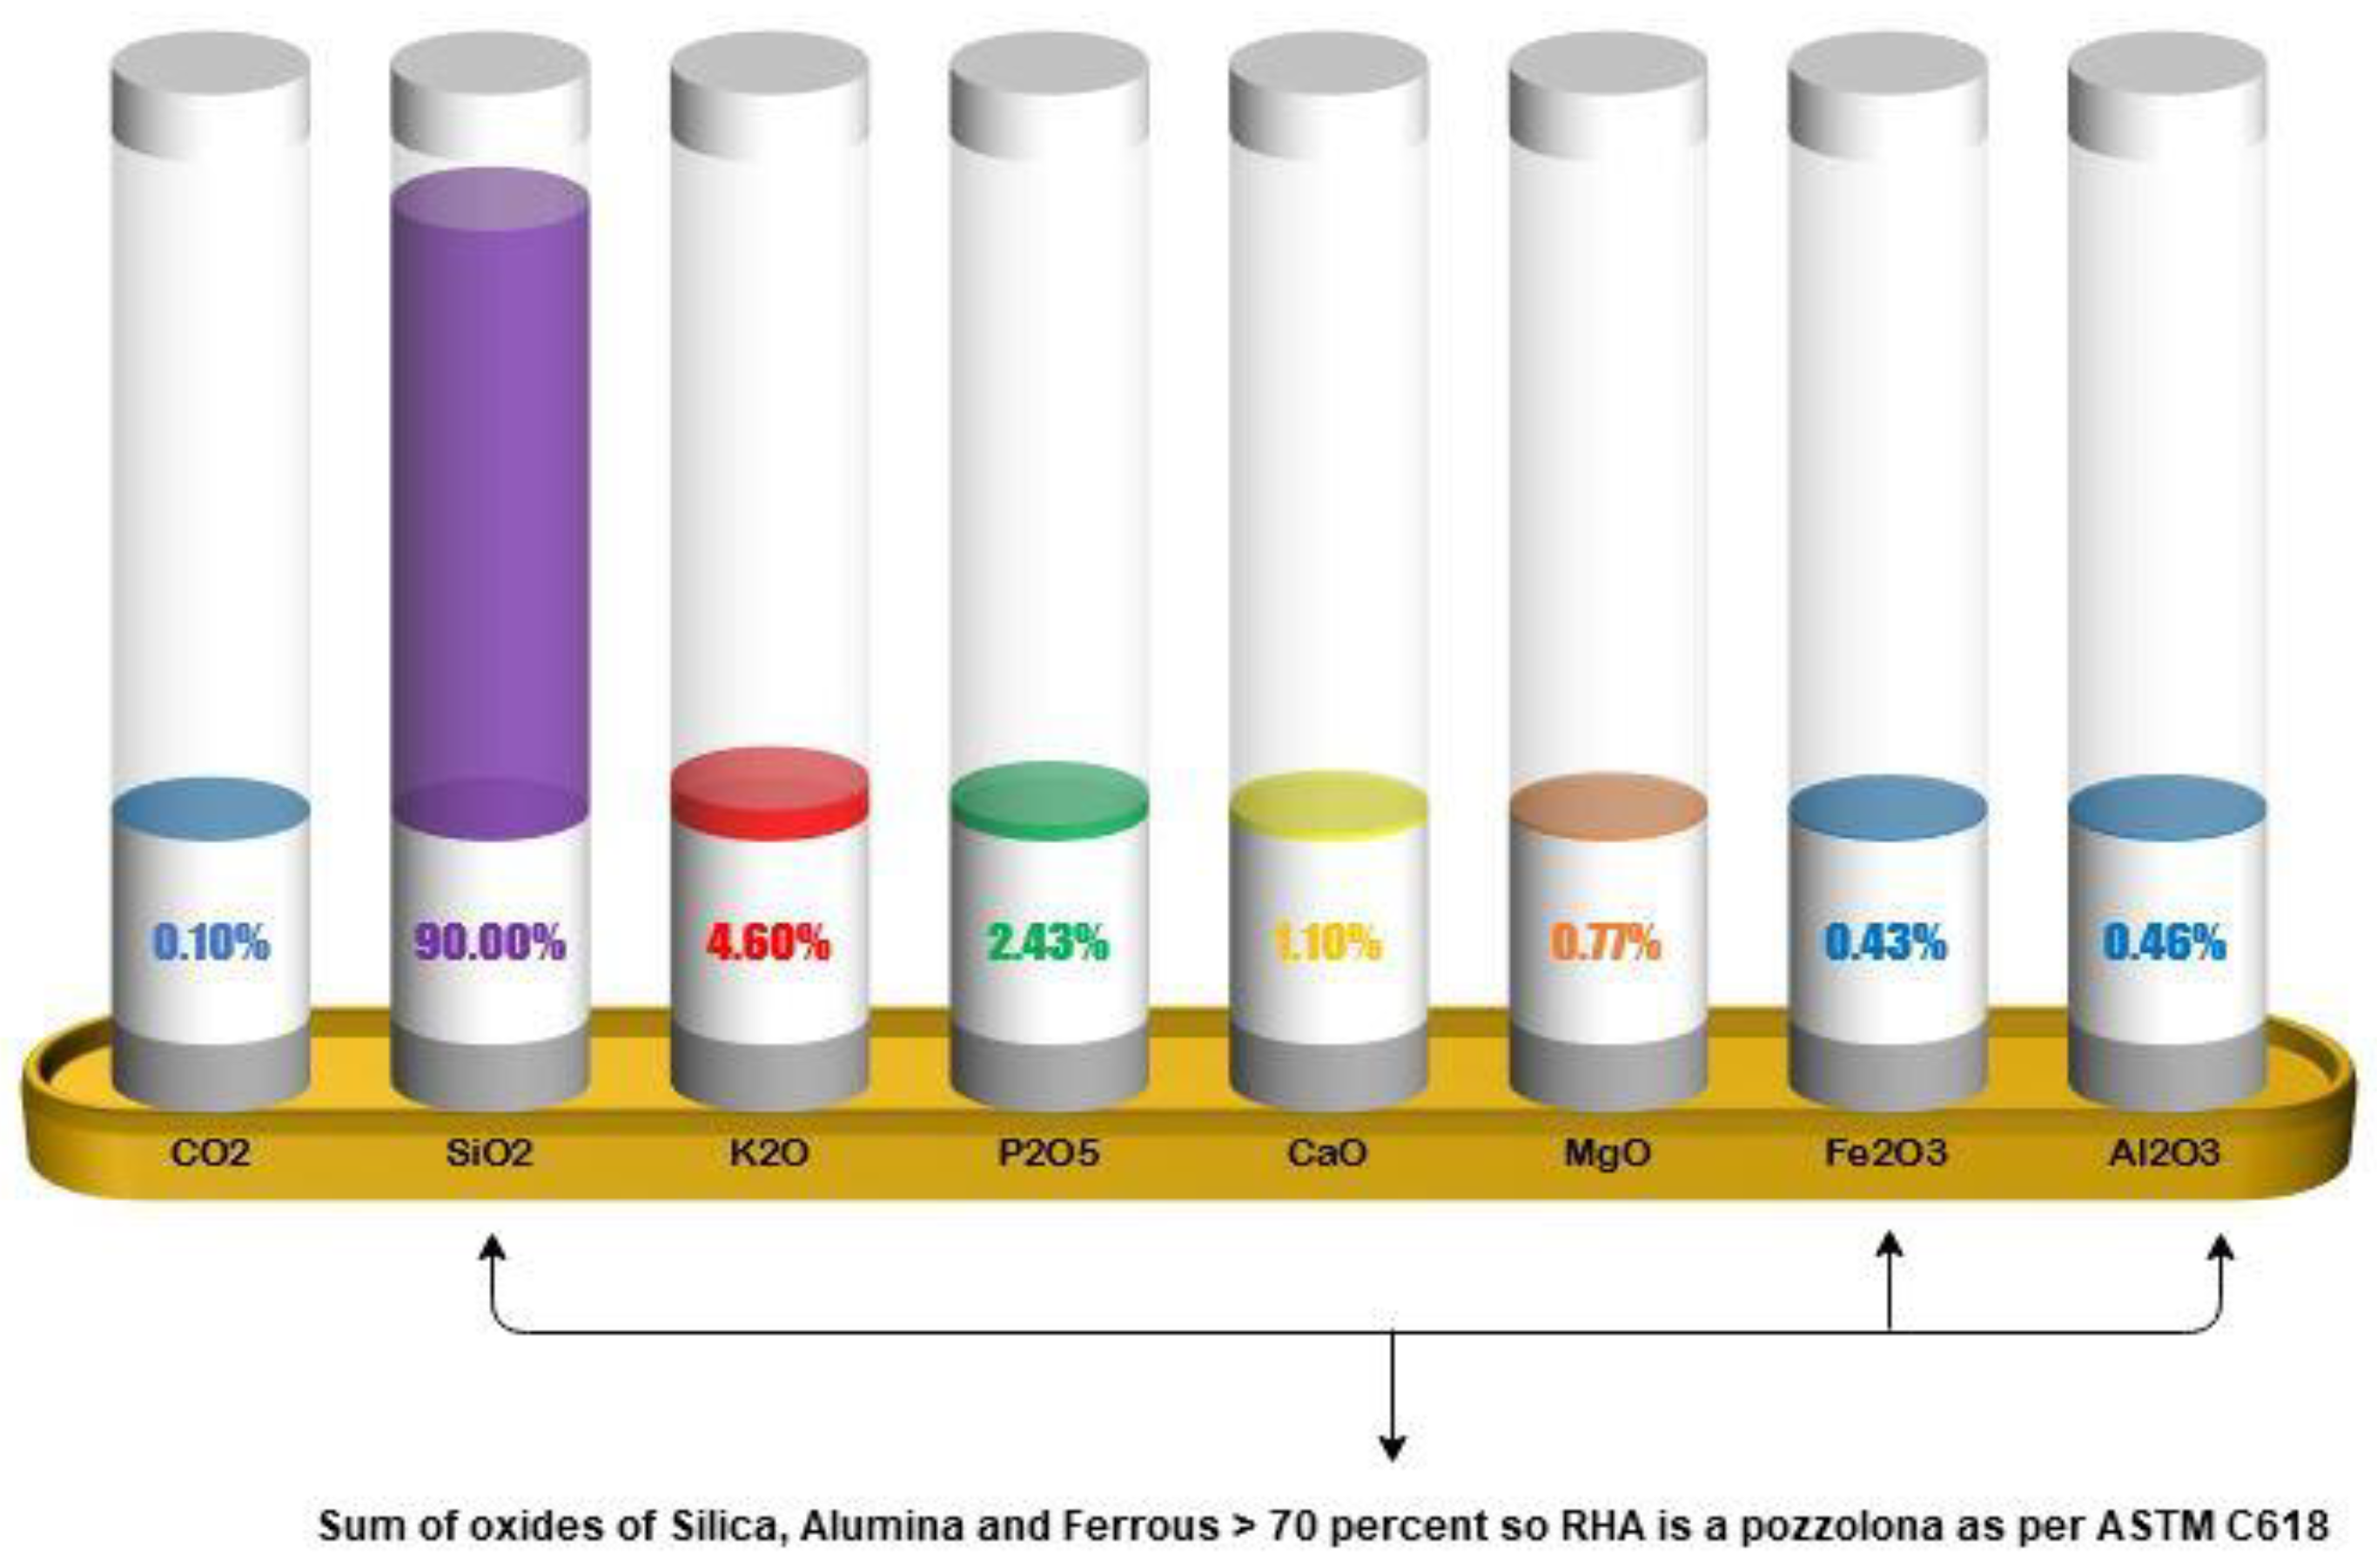
- The PA has shown that the input parameters used in this research are effectively utilized by the model to predict the CS. Moreover, the statistical parameter R2 shows the accuracy of the data used for the training and validation of different models.
- The R2 for the predicted strengths of ANN, ANFIS, MNLR, and LR is 0.98, 0.89, 0.70, and 0.63, respectively.
- It is evident by the comparison of ANN and ANFIS with the regression models that both ANN and ANFIS have a high command on prediction of CS of RBC. Therefore, they are suitable for the predesign of RBC.
- The proposed models can provide the basis for using RBC in different structures rather than discarding it.
Author Contributions
Funding
Data Availability Statement
Acknowledgments
Conflicts of Interest
Abbreviations
| Nomenclature | Definition |
| AGG | Amount of aggregates |
| AI | Artificial intelligence |
| ANFIS | Adaptive neuro-fuzzy inference system |
| ANN | Artificial neural network |
| CA | Curing age |
| CCA | Corn cob ash |
| CS | Compressive strength |
| FA | Fly ash |
| FFBP | Feed forward back propagation |
| GGBFS | Ground granulated blast furnace slag |
| GWP | Global warming potential |
| LR | Linear regression |
| MLP | Multi layer perceptron |
| MNLR | Multiple nonlinear regression |
| OPC | Ordinary Portland cement |
| OPCP | Amount of OPC |
| RBC | RHA blended concrete |
| RH | Rice Husks |
| RHA | Rice husk ash |
| RHAP | Amount of RHA |
| SCBA | Sugarcane baggase ash |
| SCM | Secondary cementitious material |
| SLP | Single layer perceptron |
| SP | Superplasticizer |
| W | Water used |
Appendix A

| Experimental | ANN Prediction | ANFIS Prediction | LR Prediction | MNLR |
|---|---|---|---|---|
| 18.16 | 17.91 | 31.12 | 45.00 | 40.31 |
| 16.72 | 12.06 | 27.21 | 41.43 | 30.10 |
| 17.6 | 15.19 | 31.43 | 41.21 | 34.24 |
| 15.76 | 18.26 | 29.00 | 39.39 | 33.65 |
| 27.76 | 30.28 | 42.86 | 45.59 | 40.46 |
| 30.24 | 30.12 | 43.81 | 42.02 | 30.25 |
| 27.36 | 27.30 | 42.54 | 41.88 | 34.41 |
| 26.08 | 29.29 | 40.42 | 40.21 | 33.86 |
| 38.32 | 37.24 | 33.33 | 45.51 | 44.64 |
| 33.04 | 30.89 | 28.89 | 41.93 | 34.44 |
| 38.96 | 36.67 | 33.62 | 41.71 | 38.58 |
| 36.16 | 35.72 | 31.05 | 39.89 | 37.99 |
| 14.08 | 14.95 | 14.11 | 27.75 | 25.72 |
| 48.64 | 50.77 | 45.60 | 46.09 | 44.79 |
| 51.12 | 49.99 | 45.85 | 42.52 | 34.58 |
| 48.56 | 50.10 | 45.25 | 42.38 | 38.75 |
| 45.84 | 48.30 | 43.04 | 40.71 | 38.20 |
| 48.48 | 49.97 | 37.76 | 46.52 | 48.79 |
| 40.8 | 42.73 | 32.25 | 42.95 | 38.59 |
| 49.44 | 51.43 | 38.02 | 42.72 | 42.73 |
| 24 | 23.64 | 24.81 | 30.02 | 24.01 |
| 25.2 | 23.86 | 25.39 | 30.85 | 28.80 |
| 26 | 23.83 | 27.60 | 31.67 | 30.22 |
| 28.4 | 23.95 | 28.54 | 32.50 | 31.01 |
| 24.8 | 24.43 | 25.31 | 33.33 | 31.46 |
| 22.08 | 22.04 | 22.70 | 23.90 | 23.28 |
| 23.76 | 24.07 | 25.01 | 23.52 | 23.27 |
| 20.56 | 20.25 | 20.97 | 23.16 | 20.56 |
| 46.08 | 46.67 | 35.13 | 40.90 | 42.14 |
| 66.88 | 64.77 | 51.09 | 47.10 | 48.94 |
| 25.92 | 23.20 | 25.88 | 28.85 | 29.66 |
| 61.12 | 62.83 | 49.95 | 43.53 | 38.73 |
| 66.24 | 66.69 | 50.67 | 43.39 | 42.90 |
| 63.36 | 60.64 | 48.28 | 41.73 | 42.35 |
| 28.24 | 27.61 | 26.93 | 25.55 | 27.87 |
| 28.88 | 28.21 | 27.26 | 25.17 | 26.58 |
| 58.24 | 60.42 | 60.99 | 51.83 | 57.53 |
| 47.68 | 50.46 | 49.89 | 48.25 | 47.32 |
| 58.16 | 54.92 | 61.09 | 48.03 | 51.46 |
| 35.6 | 36.04 | 34.11 | 35.33 | 32.74 |
| 36.4 | 37.66 | 34.88 | 36.16 | 37.53 |
| 39.6 | 38.16 | 37.72 | 36.98 | 38.95 |
| 40 | 37.39 | 38.61 | 37.81 | 39.75 |
| 34.4 | 35.20 | 33.55 | 38.64 | 40.19 |
| 29.68 | 32.60 | 29.98 | 29.33 | 28.05 |
| 33.44 | 33.46 | 34.23 | 28.96 | 32.49 |
| 30.08 | 29.41 | 30.17 | 28.59 | 30.37 |
| 53.76 | 54.72 | 56.59 | 46.21 | 50.87 |
| 76.16 | 75.21 | 79.90 | 52.41 | 57.68 |
| 68.56 | 67.37 | 71.43 | 48.84 | 47.47 |
| 75.44 | 70.38 | 79.14 | 48.70 | 51.63 |
| 32.24 | 30.73 | 32.25 | 34.34 | 33.92 |
| 37.52 | 32.79 | 37.51 | 33.94 | 38.46 |
| 72.24 | 70.61 | 75.79 | 47.04 | 51.08 |
| 41.2 | 40.88 | 42.37 | 42.41 | 38.23 |
| 42.8 | 43.35 | 43.43 | 43.24 | 43.02 |
| 44.8 | 45.59 | 46.88 | 44.06 | 44.44 |
| 47.6 | 47.49 | 48.07 | 44.89 | 45.24 |
| 41.6 | 49.06 | 42.34 | 45.72 | 45.68 |
| 66.56 | 66.98 | 66.55 | 67.50 | 67.30 |
| 53.44 | 65.68 | 53.44 | 63.93 | 57.09 |
| 65.76 | 66.02 | 65.76 | 63.71 | 61.23 |
| 60.64 | 60.01 | 60.65 | 61.89 | 60.64 |
| 34.64 | 34.06 | 34.65 | 44.88 | 41.78 |
| 36.8 | 36.36 | 36.85 | 44.51 | 41.77 |
| 29.76 | 30.66 | 29.74 | 44.14 | 39.06 |
| 44.4 | 45.77 | 44.01 | 51.01 | 42.51 |
| 45.2 | 45.74 | 45.49 | 51.83 | 47.30 |
| 50.4 | 46.92 | 49.25 | 52.66 | 48.72 |
| 51.2 | 48.40 | 51.52 | 53.49 | 49.52 |
| 48.8 | 49.83 | 48.52 | 54.31 | 49.96 |
| 47.2 | 46.94 | 47.20 | 49.75 | 48.38 |
| 83.28 | 83.60 | 83.29 | 68.09 | 67.45 |
| 75.2 | 75.35 | 75.20 | 64.52 | 57.24 |
| 82.64 | 83.02 | 82.64 | 64.38 | 61.40 |
| 79.28 | 78.48 | 79.27 | 62.71 | 60.85 |
| 39.5 | 39.69 | 39.50 | 42.75 | 45.55 |
| 30.5 | 30.47 | 30.50 | 41.75 | 43.76 |
| 29.7 | 29.35 | 29.70 | 33.47 | 35.31 |
| 23.6 | 23.61 | 23.60 | 33.19 | 34.09 |
| 22.7 | 23.21 | 22.70 | 26.39 | 26.79 |
| 20.8 | 26.18 | 20.80 | 26.05 | 25.81 |
| 51.4 | 50.15 | 51.40 | 48.06 | 54.28 |
| 47.4 | 47.08 | 47.40 | 47.06 | 52.50 |
| 40.8 | 40.61 | 40.80 | 38.78 | 44.04 |
| 39.4 | 40.25 | 39.40 | 38.50 | 42.82 |
| 34.5 | 29.33 | 34.50 | 31.70 | 35.53 |
| 35.9 | 36.13 | 35.90 | 31.36 | 34.54 |
| 64.5 | 64.94 | 64.50 | 63.74 | 64.05 |
| 68.5 | 69.42 | 68.50 | 62.74 | 62.27 |
| 51.5 | 51.89 | 51.50 | 54.46 | 53.81 |
| 57.3 | 57.27 | 57.30 | 54.17 | 52.59 |
| 44.4 | 43.98 | 44.40 | 47.38 | 45.30 |
| 52.9 | 52.55 | 52.90 | 47.04 | 44.31 |
| 25.2 | 26.10 | 25.23 | 30.56 | 17.15 |
| 25.68 | 25.92 | 25.73 | 30.00 | 21.15 |
| 26.64 | 26.24 | 26.88 | 29.25 | 21.23 |
| 27.6 | 26.90 | 27.46 | 28.31 | 20.45 |
| 26.88 | 26.18 | 26.53 | 27.20 | 19.16 |
| 23.44 | 24.15 | 23.45 | 25.90 | 17.47 |
| 23.2 | 21.95 | 23.16 | 24.42 | 15.46 |
| 33.36 | 31.93 | 33.37 | 37.39 | 34.36 |
| 34.16 | 33.71 | 33.61 | 36.82 | 38.37 |
| 35.36 | 36.30 | 35.56 | 36.07 | 38.45 |
| 37.44 | 38.46 | 36.98 | 35.14 | 37.67 |
| 34.8 | 38.45 | 36.07 | 34.03 | 36.38 |
| 31.6 | 37.15 | 31.50 | 32.73 | 34.69 |
| 30.56 | 35.91 | 30.67 | 31.25 | 32.68 |
| 39.28 | 37.51 | 39.44 | 44.47 | 39.86 |
| 40.16 | 39.41 | 39.95 | 43.90 | 43.86 |
| 41.68 | 42.31 | 42.42 | 43.15 | 43.94 |
| 44.24 | 43.81 | 44.16 | 42.22 | 43.16 |
| 44.16 | 42.63 | 43.10 | 41.10 | 41.87 |
| 37.6 | 40.41 | 37.76 | 39.81 | 40.18 |
| 36.72 | 38.56 | 36.63 | 38.33 | 38.17 |
| 42.08 | 43.41 | 41.98 | 53.07 | 44.13 |
| 43.92 | 45.62 | 43.95 | 52.50 | 48.14 |
| 45.84 | 48.62 | 46.40 | 51.75 | 48.21 |
| 48.96 | 48.95 | 47.45 | 50.82 | 47.44 |
| 44.4 | 46.41 | 45.86 | 49.70 | 46.15 |
| 41.52 | 43.25 | 41.14 | 48.40 | 44.46 |
| 40.16 | 40.79 | 40.18 | 46.92 | 42.45 |
| 41 | 40.43 | 53.59 | 65.61 | 68.86 |
| 30 | 30.26 | 41.92 | 37.55 | 31.04 |
| 27 | 28.62 | 37.95 | 37.54 | 36.42 |
| 26 | 26.13 | 36.87 | 38.13 | 35.68 |
| 19 | 19.53 | 31.29 | 38.54 | 33.46 |
| 16 | 15.26 | 25.75 | 23.81 | 18.84 |
| 59 | 52.03 | 54.44 | 66.11 | 73.19 |
| 46 | 39.32 | 42.89 | 38.05 | 35.37 |
| 41 | 38.71 | 39.35 | 38.05 | 40.75 |
| 38 | 37.54 | 38.27 | 38.64 | 40.02 |
| 32 | 32.63 | 32.88 | 39.04 | 37.80 |
| 26 | 25.29 | 27.13 | 24.32 | 23.18 |
| 62 | 60.76 | 56.13 | 67.12 | 77.34 |
| 50 | 47.89 | 44.83 | 39.06 | 39.53 |
| 47 | 48.19 | 42.14 | 39.06 | 44.90 |
| 47 | 47.53 | 41.06 | 39.65 | 44.17 |
| 43 | 43.50 | 36.06 | 40.05 | 41.95 |
| 37 | 35.53 | 29.91 | 25.33 | 27.33 |
| 63 | 64.01 | 59.09 | 68.89 | 81.37 |
| 54 | 52.69 | 48.22 | 40.83 | 43.56 |
| 52 | 53.58 | 47.03 | 40.83 | 48.93 |
| 52 | 52.95 | 45.93 | 41.42 | 48.20 |
| 51 | 48.99 | 41.63 | 41.82 | 45.98 |
| 40 | 41.96 | 34.77 | 27.10 | 31.36 |
| 66 | 67.67 | 65.01 | 72.43 | 86.08 |
| 56 | 56.63 | 55.01 | 44.37 | 48.26 |
| 61 | 58.11 | 56.80 | 44.37 | 53.64 |
| 60 | 58.28 | 55.69 | 44.96 | 52.90 |
| 54 | 55.56 | 52.77 | 45.36 | 50.68 |
| 47 | 47.06 | 44.48 | 30.64 | 36.06 |
| 69 | 70.31 | 72.59 | 79.51 | 91.57 |
| 60 | 61.89 | 64.09 | 51.45 | 53.75 |
| 62 | 63.30 | 68.19 | 51.45 | 59.13 |
| 61 | 63.18 | 67.77 | 52.04 | 58.39 |
| 60 | 60.58 | 65.74 | 52.44 | 56.17 |
| 51 | 51.74 | 56.18 | 37.72 | 41.55 |
| 74 | 72.72 | 73.15 | 88.11 | 95.85 |
| 67 | 67.64 | 66.03 | 60.05 | 58.03 |
| 67 | 68.51 | 65.54 | 60.04 | 63.41 |
| 69 | 67.15 | 67.40 | 60.63 | 62.67 |
| 64 | 63.34 | 62.65 | 61.04 | 60.45 |
| 56 | 54.59 | 54.77 | 46.32 | 45.83 |
| 22.08 | 22.04 | 22.70 | 23.90 | 23.28 |
| 22.4 | 22.26 | 23.66 | 23.78 | 23.84 |
| 23.44 | 23.49 | 24.42 | 23.65 | 23.75 |
| 23.76 | 24.07 | 25.01 | 23.52 | 23.27 |
| 22.96 | 23.29 | 24.63 | 23.40 | 22.55 |
| 21.92 | 21.81 | 23.13 | 23.28 | 21.64 |
| 20.56 | 20.25 | 20.97 | 23.16 | 20.56 |
| 27.36 | 27.33 | 25.81 | 25.67 | 27.31 |
| 28.24 | 27.61 | 26.93 | 25.55 | 27.87 |
| 28.8 | 28.72 | 27.69 | 25.42 | 27.78 |
| 31.44 | 29.08 | 28.12 | 25.29 | 27.30 |
| 28.88 | 28.21 | 27.26 | 25.17 | 26.58 |
| 26.8 | 26.79 | 25.47 | 25.05 | 25.67 |
| 24.88 | 25.41 | 23.52 | 24.93 | 24.59 |
| 32 | 32.36 | 32.04 | 29.21 | 32.01 |
| 33.04 | 32.86 | 33.46 | 29.09 | 32.58 |
| 33.44 | 33.46 | 34.23 | 28.96 | 32.49 |
| 34 | 32.88 | 34.33 | 28.83 | 32.00 |
| 31.04 | 31.26 | 32.52 | 28.71 | 31.28 |
| 30.08 | 29.41 | 30.17 | 28.59 | 30.37 |
| 28.08 | 27.85 | 28.61 | 28.47 | 29.29 |
| 34.64 | 34.06 | 34.65 | 44.88 | 41.78 |
| 35.84 | 36.36 | 35.81 | 44.76 | 42.35 |
| 36.56 | 37.27 | 36.54 | 44.64 | 42.26 |
| 36.8 | 36.36 | 36.85 | 44.51 | 41.77 |
| 34.4 | 34.58 | 34.26 | 44.39 | 41.05 |
| 30.96 | 32.60 | 31.06 | 44.26 | 40.14 |
| 29.76 | 30.66 | 29.74 | 44.14 | 39.06 |
References
- Chen, C.; Habert, G.; Bouzidi, Y.; Jullien, A. Environmental impact of cement production: Detail of the different processes and cement plant variability evaluation. J. Clean. Prod. 2010, 18, 478–485. [Google Scholar] [CrossRef]
- Farooq, F.; Ahmed, W.; Akbar, A.; Aslam, F.; Alyousef, R. Predictive modeling for sustainable high-performance concrete from industrial wastes: A comparison and optimization of models using ensemble learners. J. Clean. Prod. 2021, 292, 126032. [Google Scholar] [CrossRef]
- Mahlia, T.M.I. Emissions from electricity generation in Malaysia. Renew. Energy 2002, 27, 293–300. [Google Scholar] [CrossRef]
- Akbar, A.; Farooq, F.; Shafique, M.; Aslam, F.; Alyousef, R.; Alabduljabbar, H. Sugarcane bagasse ash-based engineered geopolymer mortar incorporating propylene fibers. J. Build. Eng. 2021, 33, 101492. [Google Scholar] [CrossRef]
- Mehta, A.; Siddique, R. An overview of geopolymers derived from industrial by-products. Constr. Build. Mater. 2016, 127, 183–198. [Google Scholar] [CrossRef]
- Tosti, L.; van Zomeren, A.; Pels, J.R.; Damgaard, A.; Comans, R.N.J. Life cycle assessment of the reuse of fly ash from biomass combustion as secondary cementitious material in cement products. J. Clean. Prod. 2020, 245, 118937. [Google Scholar] [CrossRef]
- Zain, M.F.M.; Islam, M.N.; Mahmud, F.; Jamil, M. Production of rice husk ash for use in concrete as a supplementary cementitious material. Constr. Build. Mater. 2011, 25, 798–805. [Google Scholar] [CrossRef]
- Adesanya, D.A.; Raheem, A.A. Development of corn cob ash blended cement. Constr. Build. Mater. 2009, 23, 347–352. [Google Scholar] [CrossRef]
- Crossin, E. The greenhouse gas implications of using ground granulated blast furnace slag as a cement substitute. J. Clean. Prod. 2015, 95, 101–108. [Google Scholar] [CrossRef]
- Khan, K.; Ullah, M.F.; Shahzada, K.; Amin, M.N.; Bibi, T.; Wahab, N.; Aljaafari, A. Effective use of micro-silica extracted from rice husk ash for the production of high-performance and sustainable cement mortar. Constr. Build. Mater. 2020, 258, 119589. [Google Scholar] [CrossRef]
- Parveen, S.; Pham, T.M. Enhanced properties of high-silica rice husk ash-based geopolymer paste by incorporating basalt fibers. Constr. Build. Mater. 2020, 245, 118422. [Google Scholar] [CrossRef]
- Ameri, F.; Shoaei, P.; Bahrami, N.; Vaezi, M.; Ozbakkaloglu, T. Optimum rice husk ash content and bacterial concentration in self-compacting concrete. Constr. Build. Mater. 2019, 222, 796–813. [Google Scholar] [CrossRef]
- Chao-Lung, H.; Anh-Tuan, B.L.; Chun-Tsun, C. Effect of rice husk ash on the strength and durability characteristics of concrete. Constr. Build. Mater. 2011, 25, 3768–3772. [Google Scholar] [CrossRef]
- Chindaprasirt, P.; Kanchanda, P.; Sathonsaowaphak, A.; Cao, H.T. Sulfate resistance of blended cements containing fly ash and rice husk ash. Constr. Build. Mater. 2007, 21, 1356–1361. [Google Scholar] [CrossRef]
- Thomas, B.S. Green concrete partially comprised of rice husk ash as a supplementary cementitious material—A comprehensive review. Renew. Sustain. Energy Rev. 2018, 82, 3913–3923. [Google Scholar] [CrossRef]
- Rattanachu, P.; Toolkasikorn, P.; Tangchirapat, W.; Chindaprasirt, P.; Jaturapitakkul, C. Performance of recycled aggregate concrete with rice husk ash as cement binder. Cem. Concr. Compos. 2020, 108, 103533. [Google Scholar] [CrossRef]
- Gursel, A.P.; Maryman, H.; Ostertag, C. A life-cycle approach to environmental, mechanical, and durability properties of ‘green’ concrete mixes with rice husk ash. J. Clean. Prod. 2016, 112, 823–836. [Google Scholar] [CrossRef]
- Moraes, C.A.M.; Kieling, A.G.; Caetano, M.O.; Gomes, L.P. Life cycle analysis (LCA) for the incorporation of rice husk ash in mortar coating. Resour. Conserv. Recycl. 2010, 54, 1170–1176. [Google Scholar] [CrossRef]
- Rahman, M.E.; Muntohar, A.S.; Pakrashi, V.; Nagaratnam, B.H.; Sujan, D. Self compacting concrete from uncontrolled burning of rice husk and blended fine aggregate. Mater. Des. 2014, 55, 410–415. [Google Scholar] [CrossRef]
- Prasara, J.-A.; Grant, T. Comparative life cycle assessment of uses of rice husk for energy purposes. Int. J. Life Cycle Assess. 2011, 16, 493–502. [Google Scholar] [CrossRef]
- Saraswathy, V.; Song, H.-W. Corrosion performance of rice husk ash blended concrete. Constr. Build. Mater. 2007, 21, 1779–1784. [Google Scholar] [CrossRef]
- Javed, M.F.; Amin, M.N.; Shah, M.I.; Khan, K.; Iftikhar, B.; Farooq, F.; Aslam, F. Applications of Gene Expression Programming and Regression Techniques for Estimating Compressive Strength of Bagasse Ash based Concrete. Crystals 2020, 10, 737. [Google Scholar] [CrossRef]
- Ahmad, A.; Farooq, F.; Niewiadomski, P.; Ostrowski, K.; Akbar, A.; Aslam, F.; Alyousef, R. Prediction of Compressive Strength of Fly Ash Based Concrete Using Individual and Ensemble Algorithm. Materials 2021, 14, 794. [Google Scholar] [CrossRef]
- Hammoudi, A.; Moussaceb, K.; Belebchouche, C.; Dahmoune, F. Comparison of artificial neural network (ANN) and response surface methodology (RSM) prediction in compressive strength of recycled concrete aggregates. Constr. Build. Mater. 2019, 209, 425–436. [Google Scholar] [CrossRef]
- Jalal, M.; Arabali, P.; Grasley, Z.; Bullard, J.W.; Jalal, H. Behavior assessment, regression analysis and support vector machine (SVM) modeling of waste tire rubberized concrete. J. Clean. Prod. 2020, 273, 122960. [Google Scholar] [CrossRef]
- Nehdi, Y.D.M.; Khan, A. Neural Network Model for Preformed-Foam Cellular Concrete. ACI Mater. J. 2001, 98, 5. [Google Scholar] [CrossRef]
- Atici, U. Prediction of the strength of mineral admixture concrete using multivariable regression analysis and an artificial neural network. Expert Syst. Appl. 2011, 38, 9609–9618. [Google Scholar] [CrossRef]
- Yaseen, Z.M.; Deo, R.C.; Hilal, A.; Abd, A.M.; Bueno, L.C.; Salcedo-Sanz, S.; Nehdi, M.L. Predicting compressive strength of lightweight foamed concrete using extreme learning machine model. Adv. Eng. Softw. 2018, 115, 112–125. [Google Scholar] [CrossRef]
- Deng, F.; He, Y.; Zhou, S.; Yu, Y.; Cheng, H.; Wu, X. Compressive strength prediction of recycled concrete based on deep learning. Constr. Build. Mater. 2018, 175, 562–569. [Google Scholar] [CrossRef]
- Bachir, R.; Mohammed, A.M.S.; Habib, T. Using Artificial Neural Networks Approach to Estimate Compressive Strength for Rubberized Concrete. Period. Polytech. Civ. Eng. 2018, 62, 858–865. [Google Scholar] [CrossRef] [Green Version]
- Altun, F.; Kişi, Ö.; Aydin, K. Predicting the compressive strength of steel fiber added lightweight concrete using neural network. Comput. Mater. Sci. 2008, 42, 259–265. [Google Scholar] [CrossRef]
- Perera, R.; Barchín, M.; Arteaga, A.; Diego, A.D. Prediction of the ultimate strength of reinforced concrete beams FRP-strengthened in shear using neural networks. Compos. Part B Eng. 2010, 41, 287–298. [Google Scholar] [CrossRef]
- Tanarslan, H.M.; Secer, M.; Kumanlioglu, A. An approach for estimating the capacity of RC beams strengthened in shear with FRP reinforcements using artificial neural networks. Constr. Build. Mater. 2012, 30, 556–568. [Google Scholar] [CrossRef]
- Öztaş, A.; Pala, M.; Özbay, E.; Kanca, E.; Caglar, N.; Bhatti, M.A. Predicting the compressive strength and slump of high strength concrete using neural network. Constr. Build. Mater. 2006, 20, 769–775. [Google Scholar] [CrossRef]
- Bui, D.D.; Hu, J.; Stroeven, P. Particle size effect on the strength of rice husk ash blended gap-graded Portland cement concrete. Cem. Concr. Compos. 2005, 27, 357–366. [Google Scholar] [CrossRef]
- Ganesan, K.; Rajagopal, K.; Thangavel, K. Rice husk ash blended cement: Assessment of optimal level of replacement for strength and permeability properties of concrete. Constr. Build. Mater. 2008, 22, 1675–1683. [Google Scholar] [CrossRef]
- Ramezanianpour, A.A.; Mahdikhani, M.; Ahmadibeni, G. The Effect of Rice Husk Ash on Mechanical Properties and Durability of Sustainable Concretes. Int. J. Civ. Eng. 2009, 7, 83–91. Available online: https://www.sid.ir/en/journal/ViewPaper.aspx?ID=140499 (accessed on 12 September 2020).
- Sakr, K. Effects of Silica Fume and Rice Husk Ash on the Properties of Heavy Weight Concrete. J. Mater. Civ. Eng. 2006, 18, 367–376. [Google Scholar] [CrossRef]
- De Sensale, G.R. Strength development of concrete with rice-husk ash. Cem. Concr. Compos. 2006, 28, 158–160. [Google Scholar] [CrossRef]
- Golafshani, E.M.; Behnood, A.; Arashpour, M. Predicting the compressive strength of normal and High-Performance Concretes using ANN and ANFIS hybridized with Grey Wolf Optimizer. Constr. Build. Mater. 2020, 232, 117266. [Google Scholar] [CrossRef]
- Golafshani, E.M.; Behnood, A. Automatic regression methods for formulation of elastic modulus of recycled aggregate concrete. Appl. Soft Comput. 2018, 64, 377–400. [Google Scholar] [CrossRef]
- Jaafari, A.; Panahi, M.; Pham, B.T.; Shahabi, H.; Rezaie, F.; Lee, S. Meta optimization of an adaptive neuro-fuzzy inference system with grey wolf optimizer and biogeography-based optimization algorithms for spatial prediction of landslide susceptibility. CATENA 2019, 175, 430–445. [Google Scholar] [CrossRef]
- Gandomi, A.H.; Roke, D.A. Assessment of artificial neural network and genetic programming as predictive tools. Adv. Eng. Softw. 2015, 88, 63–72. [Google Scholar] [CrossRef]
- Alavi, A.H.; Gandomi, A.H. Prediction of principal ground-motion parameters using a hybrid method coupling artificial neural networks and simulated annealing. Comput. Struct. 2011, 89, 2176–2194. [Google Scholar] [CrossRef]
- Çaydaş, U.; Hasçalık, A.; Ekici, S. An adaptive neuro-fuzzy inference system (ANFIS) model for wire-EDM. Expert Syst. Appl. 2009, 36 Pt 2, 6135–6139. [Google Scholar] [CrossRef]


| Material in Which RHA Is Used | Results | Reference |
|---|---|---|
| Concrete | Utilization of RHA results in reduction of global warming potential (GWP) | [17] |
| Mortar | Use of RHA results in reduction of harmful environmental impacts | [18] |
| Concrete | RHA aids in reducing carbon footprint of concrete | [19] |
| Concrete blocks | Utilization of RHA shows positive environmental results | [20] |
| Material Used | No. of Data Points | Property Predicted | Modelling Technique Used | Reference |
|---|---|---|---|---|
| SCBA | 65 | Compressive strength | GEP, Multiple Linear Regression (MLR), Multiple Nonlinear Regression (MNLR) | [22] |
| Silica fume (SF) and zeolite | 18 | Compressive Strength | ANN | [23] |
| Recycled concrete aggregate | 17 | Compressive strength | ANN, Response Surface Methodology (RSM) | [24] |
| Recycled rubber concrete | 72 | Compressive strength | ANN, MNLR, ANFIS, Support vector machine (SVM) | [25] |
| Cellular concrete | 99 | Compressive strength | Backpropagation Neural Network (BPNN) | [26] |
| Fly ash (FA) and blast furnace slag (BFS) | 135 | Compressive strength | ANN | [27] |
| Foamed concrete | 91 | Compressive strength | Extreme Learning Machine (ELM) | [28] |
| Recycled aggregates | 74 | Compressive strength | ANN Convolutional Neural Network | [29] |
| Rubberized concrete | 112 | Compressive strength | ANN | [30] |
| Steel fiber added lightweight concrete | 126 | Compressive strength | ANN | [31] |
| Fiber reinforced polymer concrete (FRP) | 98 | Shear strength | ANN | [32] |
| FRP | 84 | Shear strength | ANN | [33] |
| High strength concrete (HSC) | 187 | Compressive strength | ANN | [34] |
| Parameters | Mean | Standard Deviation | Kurtosis | Skewness | Minimum | Maximum |
|---|---|---|---|---|---|---|
| Input parameters | ||||||
| Age (days) | 34.57 | 33.52 | −1.02 | 0.75 | 1 | 90 |
| Plain cement (kg/m3) | 409.02 | 105.47 | 3.66 | 1.55 | 249 | 783 |
| RHA (kg/m3) | 62.33 | 41.55 | 0.07 | 0.44 | 0 | 171 |
| Water (kg/m3) | 193.54 | 31.93 | −0.74 | −0.42 | 120 | 238 |
| Super plasticizer (kg/m3) | 3.34 | 3.52 | −0.82 | 0.69 | 0 | 11.25 |
| Aggregates (kg/m3) | 1621.51 | 267.77 | −0.27 | −0.74 | 1040 | 1970 |
| Response | ||||||
| Experimental compressive strength (MPa) | 48.14 | 17.54 | 0.75 | 0.83 | 16 | 104.1 |
| Parameters | Description |
|---|---|
| Total number of hidden layers | 2 |
| Maximum number of neurons per hidden layer | 10 |
| Training function | Levenberg–Marquardt |
| Epochs | 3 |
| Training completed at epoch | 2 |
| Parameters | Description |
|---|---|
| Training function | trimf |
| Epochs | 6 |
| Training completed at epoch | 2 |
Publisher’s Note: MDPI stays neutral with regard to jurisdictional claims in published maps and institutional affiliations. |
© 2021 by the authors. Licensee MDPI, Basel, Switzerland. This article is an open access article distributed under the terms and conditions of the Creative Commons Attribution (CC BY) license (http://creativecommons.org/licenses/by/4.0/).
Share and Cite
Iqtidar, A.; Bahadur Khan, N.; Kashif-ur-Rehman, S.; Faisal Javed, M.; Aslam, F.; Alyousef, R.; Alabduljabbar, H.; Mosavi, A. Prediction of Compressive Strength of Rice Husk Ash Concrete through Different Machine Learning Processes. Crystals 2021, 11, 352. https://doi.org/10.3390/cryst11040352
Iqtidar A, Bahadur Khan N, Kashif-ur-Rehman S, Faisal Javed M, Aslam F, Alyousef R, Alabduljabbar H, Mosavi A. Prediction of Compressive Strength of Rice Husk Ash Concrete through Different Machine Learning Processes. Crystals. 2021; 11(4):352. https://doi.org/10.3390/cryst11040352
Chicago/Turabian StyleIqtidar, Ammar, Niaz Bahadur Khan, Sardar Kashif-ur-Rehman, Muhmmad Faisal Javed, Fahid Aslam, Rayed Alyousef, Hisham Alabduljabbar, and Amir Mosavi. 2021. "Prediction of Compressive Strength of Rice Husk Ash Concrete through Different Machine Learning Processes" Crystals 11, no. 4: 352. https://doi.org/10.3390/cryst11040352