Article

Extraction–Pyrolytic Method for TiO2 Polymorphs Production

1
Institute of Inorganic Chemistry, Faculty of Materials Science and Applied Chemistry, Riga Technical University, Paula Valdena 3/7, LV-1048 Riga, Latvia
2
Institute of Solid-State Physics, University of Latvia, Kengaraga 8, LV-1063 Riga, Latvia
3
Institute of Biomedical Engineering and Nanotechnologies, Riga Technical University, Viskalu 36A, LV-1006 Riga, Latvia
*
Author to whom correspondence should be addressed.
Crystals 2021, 11(4), 431; https://doi.org/10.3390/cryst11040431
Submission received: 17 February 2021 / Revised: 12 April 2021 / Accepted: 14 April 2021 / Published: 16 April 2021

Abstract

:
The unique properties and numerous applications of nanocrystalline titanium dioxide (TiO2) are stimulating research on improving the existing and developing new titanium dioxide synthesis methods. In this work, we demonstrate for the first time the possibilities of the extraction–pyrolytic method (EPM) for the production of nanocrystalline TiO2 powders. A titanium-containing precursor (extract) was prepared by liquid–liquid extraction using valeric acid C4H9COOH without diluent as an extractant. Simultaneous thermogravimetric analysis and differential scanning calorimetry (TGA–DSC), as well as the Fourier-transform infrared (FTIR) spectroscopy were used to determine the temperature conditions to fabricate TiO2 powders free of organic impurities. The produced materials were also characterized by X-ray diffraction (XRD) analysis and transmission electron microscopy (TEM). The results showed the possibility of the fabrication of storage-stable liquid titanium (IV)-containing precursor, which provided nanocrystalline TiO2 powders. It was established that the EPM permits the production of both monophase (anatase polymorph or rutile polymorph) and biphase (mixed anatase–rutile polymorphs), impurity-free nanocrystalline TiO2 powders. For comparison, TiO2 powders were also produced by the precipitation method. The results presented in this study could serve as a solid basis for further developing the EPM for the cheap and simple production of nanocrystalline TiO2-based materials in the form of doped nanocrystalline powders, thin films, and composite materials.

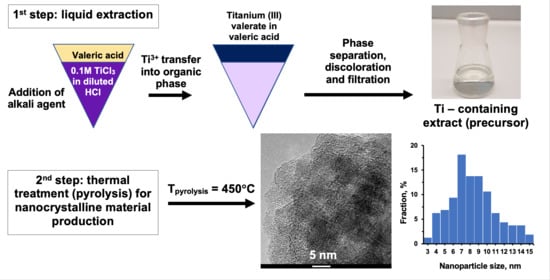
Graphical Abstract

1. Introduction

Among many functional nanomaterials, nanocrystalline titanium dioxide (TiO2) powders are of great interest due to their unique properties and numerous practical applications [1,2,3,4,5,6,7,8,9,10,11].
The current interest in titanium dioxide-based nanostructured materials is primarily associated with their high-tech applications: solar cells (dye-sensitized, quantum dots-sensitized and perovskite), lithium-ion batteries, supercapacitors, gas sensors and, etc. [1,2,3,4,5,12]. Moreover, active investigations are related to the photocatalytic activity of TiO2-based materials, including nanopowders and thin films. Due to chemical stability, non-toxicity, low cost, and high availability, titanium dioxide is considered the most promising photocatalyst for the degradation of organic pollutants in water and air, as well as for water splitting and hydrogen production [1,2,3,7,8,13,14,15,16,17,18,19]. However, TiO2 is a wide bandgap semiconductor (3.2 and 3.02 eV for the anatase and rutile phases, respectively [20]) that requires UV light (5% in the solar spectrum) for its activation. To reduce the bandgap, TiO2 should be either doped (e.g., with N, Ta) or used in the form of nanotubes [13,21,22,23,24,25,26]. Other important studies are related to the applications of TiO2 as protective coatings in microelectronic and optical devices and as luminescent compounds [27,28,29,30,31,32].
TiO2 forms three naturally occurring polymorphic crystalline modifications in the form of the corresponding minerals: brookite with rhombic, anatase and rutile with a tetragonal crystal lattice [1,4,33]. Rutile is the most thermodynamically stable modification. During heating, anatase and brookite irreversibly transform into rutile, and the stability of the crystalline modification depends on the size of its constituent crystallites [34,35]. Both the temperature of phase transformation and the properties of the produced nanostructured materials are largely determined by their manufacturing technology [36].
Highly dispersed titanium dioxide-based materials for various applications on a laboratory scale are produced by such well-known wet chemistry methods as sol–gel, microemulsion, precipitation, hydrothermal, solvothermal, electrochemical, sonochemical and microwave [2,3,4,5,9,10,11,21,22,25,26,37,38,39,40,41,42]. These methods allow fabricating TiO2 nanostructures with different phase compositions and morphology, in particular as nanoparticles, nanorods, nanowires, nanotubes and mesoporous structures. The most promising and widely used method for producing TiO2 is the sol–gel method [3,4,5,8,9,22,37,41,43], allowing obtaining TiO2 powders with well-defined particle size and shape, excellent purity and homogeneity [37,43]. In the framework of the mentioned methods, inorganic salts (e.g., titanium tetrachloride TiCl4) or organometallic compounds, such as metal alkoxides (e.g., titanium (IV) isopropoxide Ti[OCH(CH3)2]4) are usually used as titanium-containing precursors. However, these compounds have high reactivity with water, which must be taken into account both during the material synthesis to ensure good reproducibility and during the follow-up storage. It should be mentioned that titanium alkoxides are expensive and not environmentally friendly.
Thus, to date, there is a huge number of publications presenting various methods for synthesizing highly dispersed titanium dioxide-based materials with a wide range of functional properties. Nevertheless, the current pace of technological development requires new synthesis approaches characterized by simplicity, ease of scaling, good reproducibility, use of inexpensive raw materials, and allowing the production of materials with the required characteristics. The extraction–pyrolytic method (EPM) could be considered as one of these new developments.
The EPM is used to fabricate homogeneous nanocrystalline powders and films of oxide materials for various purposes [44,45,46,47,48]. The EPM belongs to wet chemistry methods. Using the EPM, the following steps are required: fabrication of extract (metal-containing precursor) via the method of exchange extraction by fatty (aliphatic monocarboxylic straight- or branched-chain) acids with the addition of alkali [49] and following thermal treatment—pyrolysis. This technique is quite simple, inexpensive and does not require complex equipment. One of the important advantages of the EPM is using organic extracts (solutions of metal carboxylates in a carboxylic acid or solvent) as metal-containing precursors. Such precursors are resistant to humidity and do not crystallize during long-term storage. In addition, high-purity inorganic metal salts are not required for their preparation. During liquid extraction, the target component is purified from impurities. The liquid extraction of metal ions by monocarboxylic acid (HR) proceeds via a cation exchange mechanism and can be generally represented by Equation (1):
Men+(w) + nHR(o) ↔ MeRn(o) + nH+(w)
where the subscripts w and o denote the aqueous and organic phases, respectively.
Alkali is added to the extraction system to increase the efficiency of target metal extraction since monocarboxylic acids themselves (with or without a diluent) are usually ineffective extractants [49].
To date, the EPM has already been applied for producing photoactive titanium dioxide films [45]. As the initial components for preparing the Ti-containing extract, the authors used an aqueous solution of titanium (IV) oxysulfate TiOSO4 and α-branched monocarboxylic acids of C5–C9 fractions as an extractant.
The aim of this work is to develop the EPM for the production of nanocrystalline TiO2 powders using valeric acid-based extracts; and to study the effect of pyrolysis conditions on the phase composition, the mean crystallite size, and morphology of the fabricated materials. In addition, the results acquired by the EPM are compared with those related to the simplest and widely known production method—precipitation. In both approaches, the initial components are a freshly prepared aqueous solution of titanium (III) chloride as a titanium source and an aqueous solution of sodium hydroxide as an alkaline agent.

2. Materials and Methods

2.1. Preparation of the Precursors

2.1.1. Preparation of Aqueous Solution of Titanium (III) Chloride TiCl3

An aqueous solution of TiCl3 in diluted hydrochloric acid HCl with a metal concentration of 0.1 M was used as a titanium source. It was prepared immediately before both extraction and precipitation. For this, 1.200 g of titanium powder (particle size d = 63–100 µm) was dissolved in 60 mL of HCl solution (1:1) during heating until the metal was completely dissolved. Thereafter, the solution was cooled down and diluted with distilled water to a volume of 250 mL.

2.1.2. Preparation of Titanium-Containing Precursors (E) via Liquid–Liquid Extraction

Valeric acid C4H9COOH without diluent was used as an extractant. During preparing the precursor E1, the initial ratio of the volumes of the aqueous (Vw) and organic (Vo) phases in the extraction system was 3:1. For the extraction, the extractant and TiCl3 solution (pH ~0.65) were placed in a separatory funnel, and 1 M NaOH solution was added step-by-step. When the organic phase (extract) turned deep blue, the addition of alkali was stopped. After a clear phase separation (~10 min), the aqueous phase was removed from the funnel, and its pH value was around 1.15. The organic phase was filtered through a cotton filter to remove water droplets.
To increase the titanium content in the organic phase for preparing the precursor E2, the initial Vw:Vo ratio was taken as 5:1. The metal was extracted from TiCl3 solution with a pH value of ~0.74. Moreover, the addition of an alkaline solution was continued until a saturated solution of titanium valerate Ti(C4H9COO)3 in valeric acid was obtained, i.e., a finely dispersed precipitate appeared in the organic phase. As a result, the achieved pH value of the aqueous phase after extraction was about 1.23. To separate a small amount of the formed precipitate and to obtain a true solution, the organic phase was filtered through a double thick paper filter.

2.1.3. Preparation of Titanium-Containing Precursor (P) via Precipitation

As the first step, alkaline hydrolysis of TiCl3 solution was carried out at room temperature. 0.5 M NaOH solution was added dropwise (at a rate of ~ 3 mL/min) under vigorous stirring until the pH of the aqueous phase reached ~6.0. Then, the mixture was left to stay for a day. This was followed by filtration, multiply washing of the resulting precipitate with distilled water (the presence of chloride ions in the decanted solution was controlled with an AgNO3 solution) and, after all, with ethanol. The precipitate was dried at room temperature for 36 hours, ground in an agate mortar and used as a precursor (P).

2.2. Thermal Treatment of Precursors

The resulting precursors E1 and E2, as solutions, and precursor P as powder were heated from room temperature to 350–750 °C at a heating rate of 10°/min, annealed for an hour and rapidly cooled down under ambient conditions. Such thermal treatment was performed in laboratory furnace SNOL 8.2/1100. Thereafter, the produced samples were ground by pestle in an agate mortar and collected. For further investigations, only as-prepared powders without any additional posttreatment were used.

2.3. Characterization Methods

The metal concentration in the resulting precursors E was determined by the gravimetric method [50].
The thermal behavior of all the produced precursors was studied by simultaneous thermogravimetric analysis and differential scanning calorimetry (TGA–DSC) using the STA PT1600 (LINSEIS). The samples under test were heated from room temperature to 700 °C or 1000 °C at a rate of 10°/min in the static air atmosphere.
The phase composition of the produced materials was investigated by the X-ray diffraction (XRD) method (diffractometer D8 Advance, Bruker Corporation) with CuKα radiation (λ = 1.5418 Å). The XRD patterns were referenced to the PDF ICDD 00-021-1272 for anatase phase of TiO2, PDF ICDD 00-021-1276 for rutile phase of TiO2, and PDF ICDD 00-014-0277 for sodium polytitanate (Na2Ti6O13) identification. The mean crystallite size (d) of the titanium dioxide was defined from the half-width of the diffraction peaks (101) of anatase (dA) and (110) one of rutile (dR) by the Scherrer method (EVA software). The weight fraction of the rutile phase (WR) was determined by Gribb and Banfield [34] using integrated intensities A (areas) of the most intense diffractions peaks as follows (Equation (2)).
W R = A R 0.884 A A + A R · 100 %
IR spectra were recorded at room temperature using Bruker Tensor II FTIR spectrometer at a resolution of 4 cm−1 and 36 scans for each spectrum. TiO2 powder was mixed with KBr, and the pellets with a 7 mm diameter were prepared using Specac Mini-Pellet press under a load of 2000 kg. The morphology of the samples was examined by transmission electron microscopy (TEM) (FEI Tecnai G2 F20 operating at 200 kV).

3. Results

3.1. Precursors Characterization

Titanium-containing precursors (E) During extraction, Ti3+ cations are transferred from the aqueous phase into the organic phase as Ti(C4H9COO)3, and the organic solution gradually turns deep blue. As a result of the storage of the produced titanium-containing extract E1 in a glass flask, the organic solution underwent discoloration, first, gradually and after ~60 minutes complete. The process was likely associated with the oxidation of Ti (III) to Ti (IV) by atmospheric oxygen. To our knowledge, there is no data on the composition of the final titanium (IV) carboxylate formed this way in an organic solution. However, it can be assumed that this compound may have the following composition: Ti(C4H9COO)4 and/or (C4H9COO)3TiOTi(OOCC4H9)3.
Note that the discoloration of the organic titanium-containing extract E2 was observed already during filtration. According to the results of the gravimetric analysis, the titanium concentration in the precursors E1 and E2 was 0.14 M and 0.50 M, respectively.
Thus, colorless transparent organic solutions with different titanium concentrations were prepared. Upon storage of E1 and E2 precursors in glass flasks with ground-glass stoppers at room temperature, no changes in color and transparency (homogeneity) were observed.
Titanium-containing precursor (P) As a result of the produced precipitate (gel) storage during the day, its color changed from deep gray-blue to white because of the oxidation of titanium (III) hydroxide by atmospheric oxygen and the formation of hydrated titanium dioxide (titanium oxyhydrate) TiO2⸱nH2O [51].

3.2. Thermal Behavior of Precursors E1, E2, and P

The main thermal decomposition products of the salts of many carboxylic acids are ketones and the corresponding metal oxides, while the temperature of their decomposition is characteristic for each certain compound [52]. This is why the study of the thermal behavior of the extracts produced during the EPM (solutions of metal carboxylates in carboxylic acid or diluent) is rather important and necessary for determining the minimal pyrolysis temperature for the production of organic impurity-free oxide materials.
The results of TG-DSC analysis of liquid precursors E1 and E2 with different titanium concentrations are shown in Figure 1. According to the data presented, studied precursors demonstrate similar thermal behavior during the heating process. At the same time, the thermal effects are more pronounced for the precursor with higher titanium concentration (E2) and just these results (see Figure 1B) will be discussed in detail.
The precursor E2 is thermally stable up to a temperature of ~30 °C. The first endothermic peak on the DSC curve at ~153 °C is accompanied by active sample weight loss. In the temperature range from ~30 °C to ~153 °C (fragment I), this weight loss is mainly associated with the removal of free extractant (valeric acid) and co-extracted water, while at a further temperature increase (fragment II)—with the decomposition of the titanium (IV) carboxylate. The second broad asymmetric endothermic peak is observed at ~180–306 °C (fragment III). In the region of this peak, the decomposition of titanium carboxylate still continues and is followed by active evaporation of the organic decomposition product (probably, dibutyl ketone C4H9COC4H9 with Tboiling = 182–187 °C). According to the TG curve, the weight loss reaches ~82% at ~210 °C and stops. A further temperature rise to 700 °C is accompanied by a gradual increase in the sample weight by ~4%. That is most likely associated with the gradual oxidation of titanium monoxide TiO to TiO2 using the proposed in Ref. [53] decomposition mechanism of the metal (IV) carboxylate via the formation of metal monoxide as intermediate. Moreover, at ~210–300 °C, this process occurs simultaneously with the removal of volatile organic decomposition products. The increase in sample weight observed on the TG curve (Figure 1B, curve 2) shows that TiO oxidation is the dominant process. At the same time, the predominance of the endothermic evaporation process is observed as well (see curve 1 in Figure 1B). A weak exothermic peak at ~318 °C (fragment IV) on the DSC curve is caused by the combustion of gaseous organic residue. In the temperature range, ~433–561 °C (fragment V), an intense asymmetric exothermic peak assumes the superposition of several thermal effects: crystallization of an amorphous phase, anatase-to-rutile polymorphic transformation and pyrocarbon burnout. Thus, according to the analysis of the obtained results, it could be assumed that upon heating, the organic decomposition product (most likely, ketone) is removed after forming TiO and its oxidation to TiO2.
For comparison, the thermal behavior of a solid precursor P (titanium oxyhydrate sample) was also studied. The presented thermogram (Figure 2, curve 1) shows two endothermic and one exothermic peak. The endothermic effect observed at ~56–150 °C (fragment I) is accompanied by active weight loss (~20%) of the dried precipitate due to the removal of adsorbed water. With a further increase in temperature, the sample loses crystallization water. This process is accompanied by a wide endothermic peak at ~208–308 °C (fragment II) and a small weight loss (~5%). The intense exothermic peak at ~776 °C (fragment III) is associated with the crystallization of titanium dioxide and polymorphic anatase-to-rutile transformation. Ongoing slight loss of sample weight is probably due to the continuation of the dehydration process.
According to Figure 1 and Figure 2, due to the different chemical compositions, the thermal behavior of the studied precursors differs significantly. Thus, the observed weight loss of the precursor P upon heating is associated with successive dehydration processes. At the same time, thermal transformations in precursors E are associated with the complex decomposition of titanium carboxylate, which is preceded by the evaporation processes of the solvent (valeric acid) and co-extracted water being the parts of the extracts.

3.3. XRD Analysis

To obtain a solid final product from precursors E1 and E2, based on the TG-DSC results (see Figure 1), the minimal temperature of pyrolysis was chosen as 350 °C. To study the effect of the precursor preparation method on the phase composition, anatase-to-rutile transformation temperature, and the mean crystallite size of TiO2, heat treatment of precursors E and P was carried out in the range from 450 °C to 750 °C with a temperature step of 100 °C. Table 1 summarizes the results of the XRD analysis of all the produced materials.
The study of the regularities of phase formation during the pyrolysis of the precursor E1 testifies (Figure 3, Table 1, samples E1-1–E1-6) that amorphous powders are produced at temperatures of 350 °C and 400 °C. The crystallization of anatase polymorph begins at 450 °C, while the polymorphic anatase-to-rutile transformation starts at 650 °C. TiO2 powder produced at 750 °C contains rutile polymorph with only a small anatase admixture (WA = 1.1%).
According to the XRD analysis (Figure 4, Table 1, samples E2-1–E2-6), the heat treatment of a more concentrated precursor E2 at 400 °C corresponds to the beginning of the anatase phase crystallization. Pyrolysis of the precursor at 550 °C and 650 °C leads to the gradual polymorphic transformation of anatase to rutile with a simultaneous increase in the mean crystallite size of anatase from ~20 nm to ~35 nm and of rutile from ~30 nm to ~45 nm, respectively. As a result of heat treatment at 750 °C, a monophase product consisting of a rutile polymorph with dR ~53 nm is formed.
Thus, an increase in titanium concentration in the precursor solution from 0.14 M to 0.50 M decreases the temperature of anatase-to-rutile transformation by ~100 °C (see Figure 3 and Figure 4, Table 1).
According to XRD analysis, precursor P is amorphous (Figure 5, Table 1). The anatase phase, produced as a result of the heat treatment of precursor P, is similar to these at the precursor E1 treatment at 450 °C and 550 °C. The increase of the processing temperature to 650 °C or 750 °C leads to the formation of two phases of TiO2. Moreover, depending on the heat treatment temperature, either anatase or rutile is a dominating phase (Figure 5, samples P-3 and P-4). It was also found two processes occur simultaneously at 750 °C: the polymorphic transformation of anatase into rutile and the crystallization of the admixture phase, Na2Ti6O13. This phase is a product of the interaction of NaOH with TiO2 at high temperatures, i.e., during the preparation of a precursor P, it is impossible to completely remove the residual amounts of NaOH by washing the precipitate (gel). In the case of the EPM, a system of two immiscible liquids is used, and the target product (titanium carboxylate) is dissolved in the organic phase, while water-soluble reaction components, in the aqueous phase. Hence, the presence of impurity phases in the TiO2 samples was not established (see Figure 3 and Figure 4).

3.4. FTIR Spectroscopy

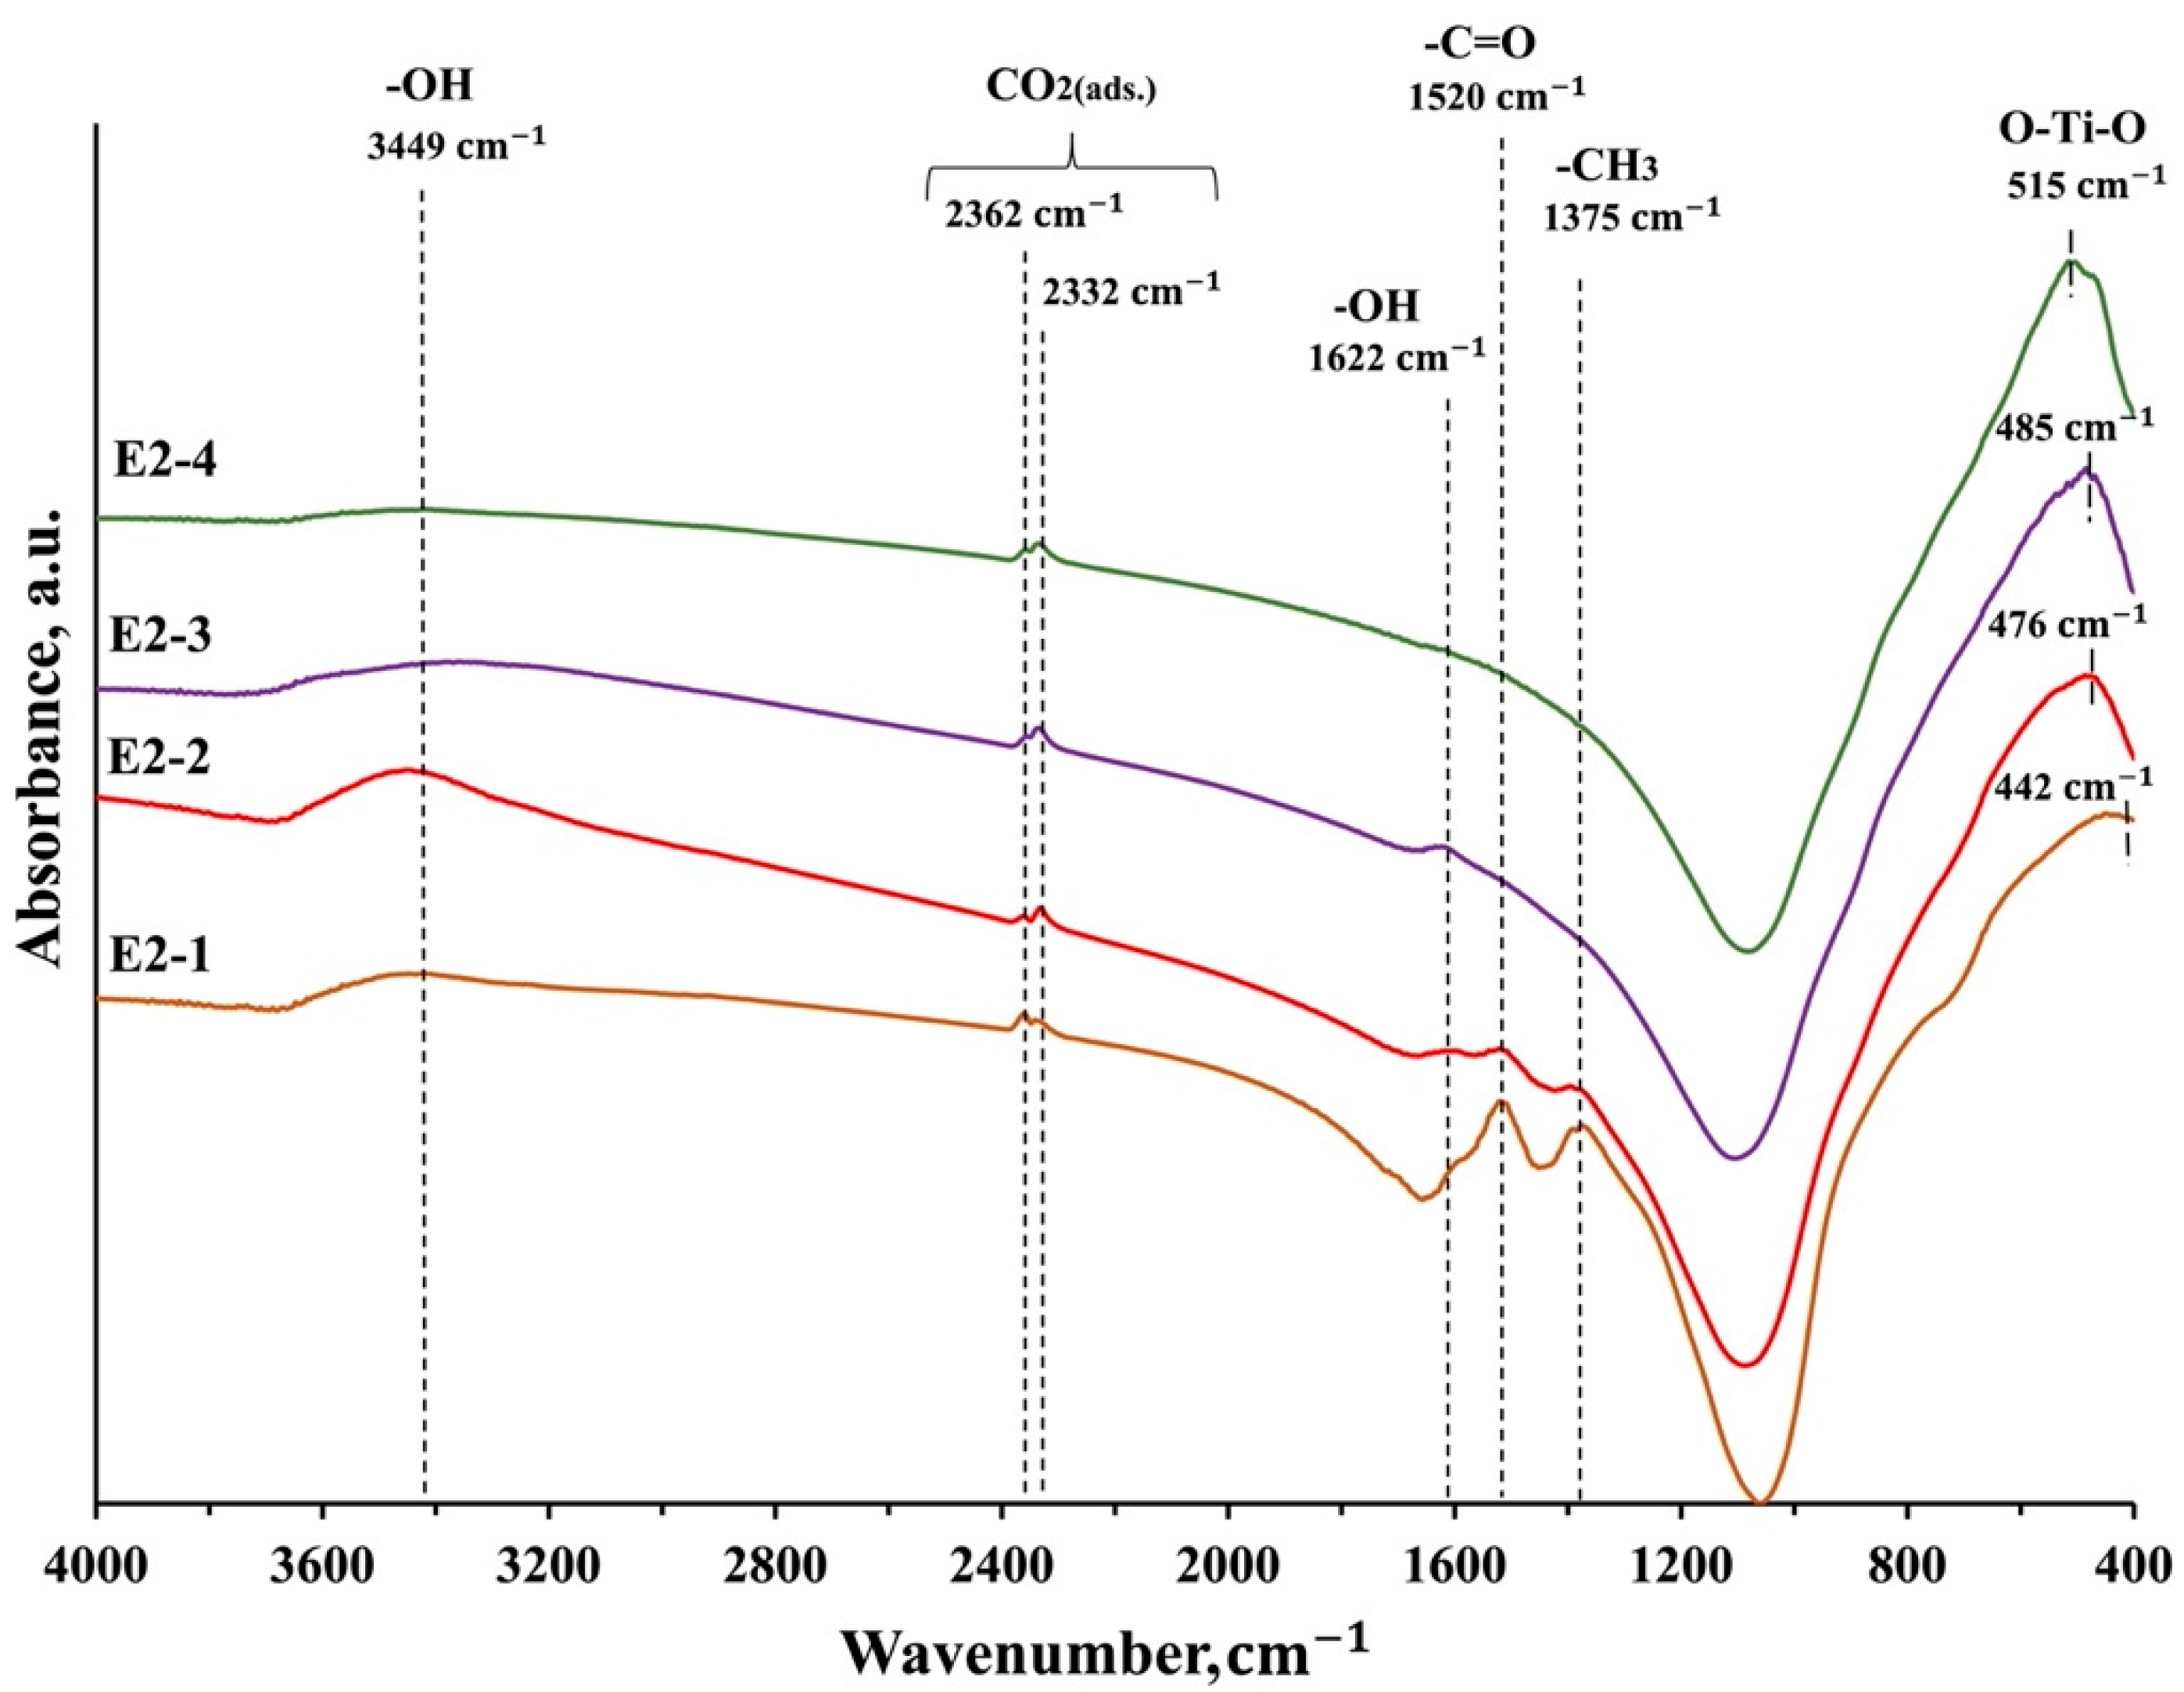
FTIR spectroscopy was used to determine the conditions for the thermal treatment of the precursor E2 that ensure complete removal of the organic component during TiO2 production.
The FTIR spectra (see Figure 6) contain the peaks at 3449 cm−1 and 1622 cm−1, which correspond to the stretching and bending vibrations of–OH groups. Weak absorption bands at 2362 cm−1 and 2332 cm−1 in the samples are associated with the presence of carbon dioxide CO2 absorbed from the atmosphere [54]. In the case of the samples produced at 350 °C or 400 °C (Figure 6, samples E2-1 and E2-2), the spectra contain the absorption bands peaked at 1520 cm−1 and 1375 cm−1, which indicate the presence of undecomposed organic residue in these materials [55,56]. The presence of TiO2 in the studied materials is confirmed by a wide absorption band at ~1000 cm−1–400 cm−1 associated with the vibrations of Ti–O–Ti bonds in the TiO2 lattice [57,58]. In the mentioned spectral region, a shift of the maximum from 515 cm−1 to 442 cm−1 is observed upon the decrease in the precursor pyrolysis temperature from 550 °C to 350 °C (Figure 6, samples E2-4–E2-1). This fact may be related to the changes in the size of the produced TiO2 particles, as described earlier in [41,59]. This is also consistent with the results of our XRD analysis (Table 1), under which a decrease in the pyrolysis temperature of the precursor E2 in this temperature range leads to a decrease in the mean crystallite size of anatase from 20 nm to 5 nm, and, finally, to amorphization. Thus, according to our results, to produce organic impurity-free TiO2 powders via the EPM, the minimal pyrolysis temperature of the extracts (precursors E) should be 450 °C. The data obtained do not contradict the results of the TG-DSC analysis (Figure 1) presented above. A similar picture was observed at the comparison of the infrared spectra for bulk and nanosized AlN and LaPO4 [60,61,62].

3.5. Transmission Electron Microscopy

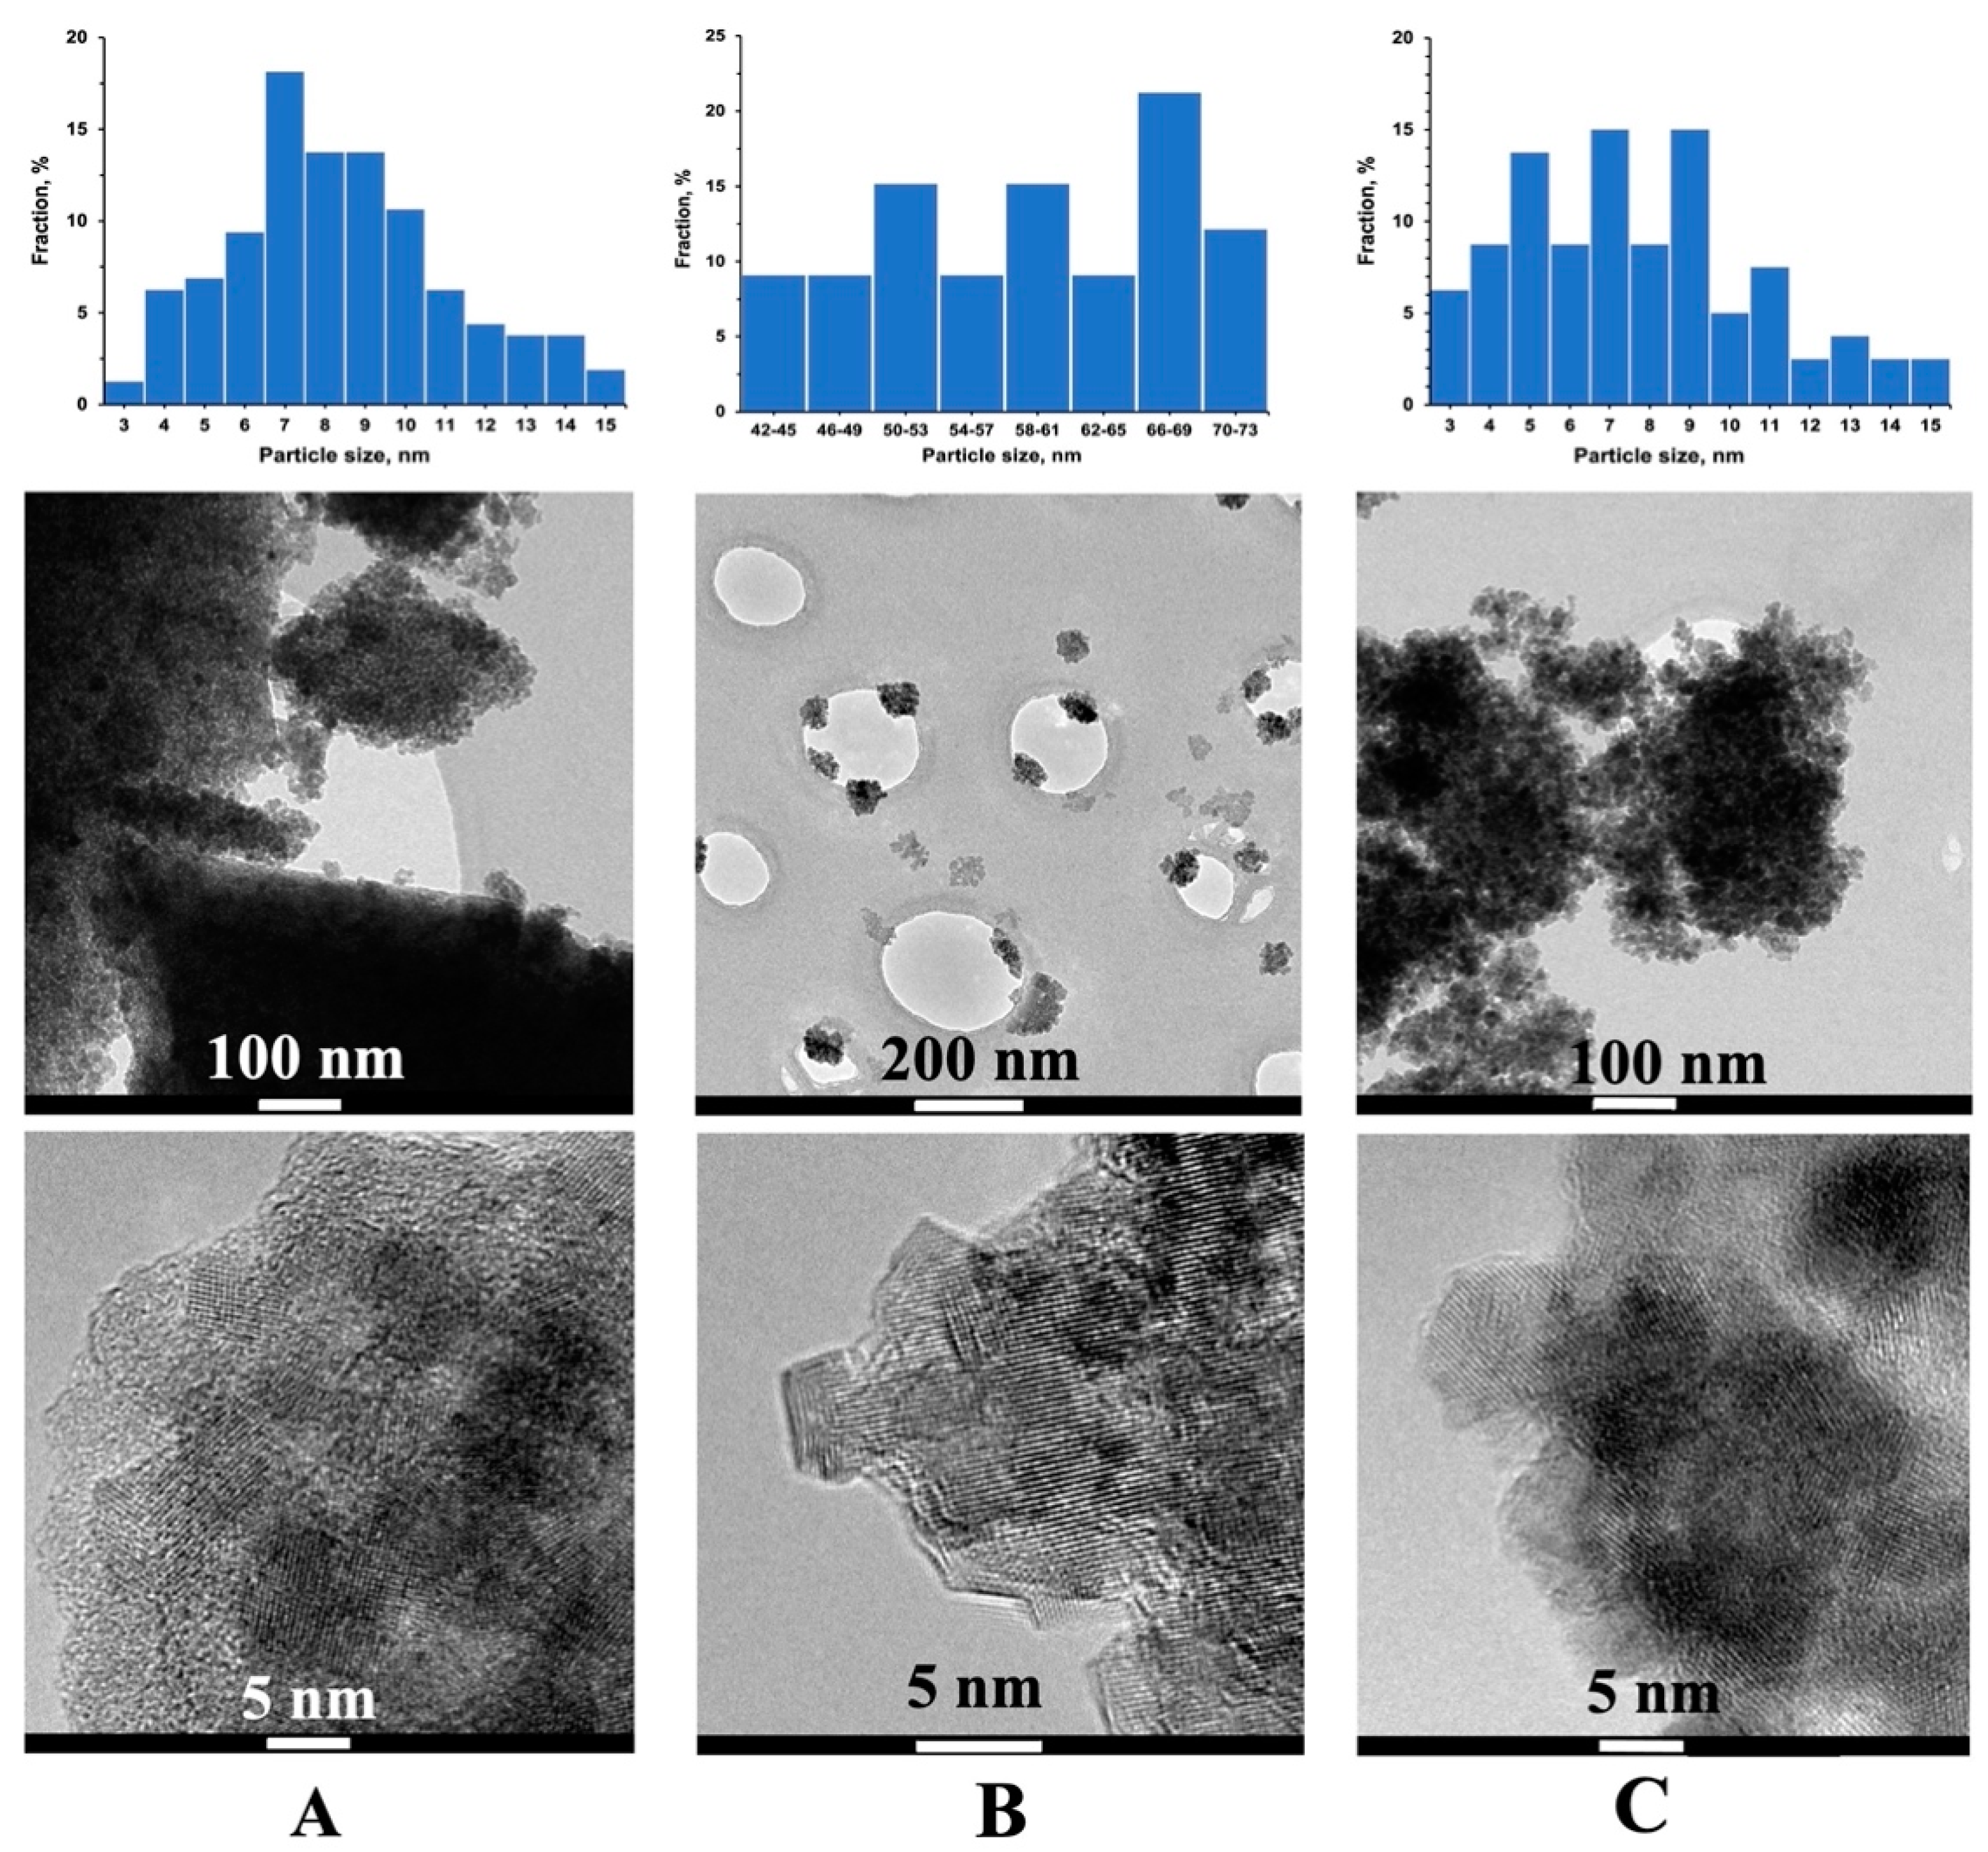
Figure 7 demonstrates TEM results for the anatase and rutile powders produced by the EPM and, for comparison, for the anatase sample produced by the precipitation method. According to the results obtained, the particles with irregular rounded shapes are formed as a result of the low-temperature treatment (450°C) of both precursors (Figure 7A,C). Nanoparticles with a mean size of ∼8 nm can be observed that is in line with the XRD results (dA = 9 nm, Table 1).
In the case of the EPM, the increase in the pyrolysis temperature up to 750 °C leads to the formation of layered aggregates consisting of the faceted particles with a mean size of ~11 nm (Figure 7B). It is possible that the formation of such structures is associated with the thermal behavior of the precursor upon heating (see Section 3.2), in particular, with the effect of the pyrolysis products of the organic precursor on the nanoparticle surface. The average size of the aggregates is about 58 nm that is consistent with the XRD data (dR = 53 nm, Table 1).

4. Conclusions

This study suggests an original two-stage approach for synthesizing nanocrystalline TiO2 powders—the extraction–pyrolytic method (EPM).
The conditions for preparing titanium-containing extracts (precursors) using valeric acid without a diluent as an extractant were determined. The minimum temperature of pyrolysis (450 °C) of the precursors for organic impurity-free nanocrystalline TiO2 production was established. We have shown that the phase composition of the resulting powders is affected by the pyrolysis temperature and titanium concentration in the precursor solution. According to the XRD results, depending on pyrolysis conditions, the produced TiO2 samples contain anatase (dA ~8–15 nm), mixed anatase-rutile or rutile (dR ~53 nm) polymorphs. We have shown that the decrease in titanium concentration in the precursor solution from 0.50 to 0.14 M leads to the increase of the temperature of anatase-to-rutile polymorphic transformation by ~100 °C. Comparative analysis of the results for the materials produced by two methods—the EPM and the precipitation, revealed some differences. According to the XRD data, as a result of the heat treatment at 750 °C, impurity phases were not detected in the EPM-produced materials, while the Na2Ti6O13 impurity phase was identified in the material produced by the precipitation method.
The results presented in this study could serve as a solid basis for further developing the EPM for the cheap and simple production of nanocrystalline TiO2-based materials in the form of doped nanocrystalline powders, thin films and composite materials.

Author Contributions

Conceptualization, V.S. and A.I.P.; methodology, V.S. and R.B.; software, A.K. and M.R.; formal analysis, R.B., A.K. and M.R.; investigation, V.S. and R.B.; resources, E.A.K. and A.I.P.; data curation, E.A.K.; writing—original draft preparation, V.S., R.B. and A.I.P.; writing—review and editing, E.A.K. and A.I.P.; visualization, A.K. and M.R.; supervision, V.S. and A.I.P.; project administration, E.A.K.; funding acquisition, E.A.K. All authors have read and agreed to the published version of the manuscript.

Funding

This study was partly supported by the M-ERA.NET project SunToChem.

Institutional Review Board Statement

Not applicable.

Informed Consent Statement

Not applicable.

Data Availability Statement

Not applicable.

Acknowledgments

The authors thank V. Kuzovkov, A. Lushchik and M. Lushchik for many useful discussions. The research was (partly) performed in the Institute of Solid State Physics, University of Latvia ISSP UL. ISSP UL as the Center of Excellence is supported through the Framework Program for European universities Union Horizon 2020, H2020-WIDESPREAD-01–2016–2017-TeamingPhase2 under Grant Agreement No. 739508, CAMART2 project.

Conflicts of Interest

The authors declare no conflict of interest.

References

  1. Gupta, S.M.; Tripathi, M. A review of TiO2 nanoparticles. Sci. Bull. 2011, 56, 1639–1657. [Google Scholar] [CrossRef] [Green Version]
  2. Ge, M.; Cao, C.; Huang, J.; Li, S.; Chen, Z.; Zhang, K.-Q.; Al-Deyab, S.S.; Lai, Y. A review of one-dimensional TiO2 nanostructured materials for environmental and energy applications. J. Mater. Chem. A 2016, 4, 6772–6801. [Google Scholar] [CrossRef]
  3. Macwan, D.P.; Dave, P.N.; Chaturvedi, S. A review on nano-TiO2 sol-gel type synthesis and its applications. J. Mater. Sci. 2011, 46, 3669–3686. [Google Scholar] [CrossRef]
  4. Dubey, R.S.; Krishnamurthy, K.V.; Singh, S. Experimental studies of TiO2 nanoparticles synthesized by sol-gel and solvothermal routes for DSSCs application. Results Phys. 2019, 14, 102390. [Google Scholar] [CrossRef]
  5. Singh, R.; Ryu, I.; Yadav, H.; Park, J.; Jo, J.W.; Yim, S.; Lee, J.-J. Non-hydrolytic sol-gel route to synthesize TiO2 nanoparticles under ambient condition for highly efficient and stable perovskite solar cells. Sol. Energy 2019, 185, 307–314. [Google Scholar] [CrossRef]
  6. Lingaraju, K.; Basavaraj, R.B.; Jayanna, K.; Bhavana, S.; Devaraja, S.; Kumar Swamy, H.M.; Nagaraju, G.; Nagabhushan, H.; Raja Naika, H. Biocompatible fabrication of TiO2 nanoparticles: Antimicrobial, anticoagulant, antiplatelet, direct hemolytic and cytotoxicity properties. Inorg. Chem. Commun. 2021, 127, 10850. [Google Scholar] [CrossRef]
  7. Chen, D.; Cheng, Y.; Zhou, N.; Chen, P.; Wang, Y.; Li, K.; Huo, S.; Cheng, P.; Peng, P.; Zhang, R.; et al. Photocatalytic degradation of organic pollutants using TiO2-based photocatalysts: A review. J. Clean. Prod. 2020, 268, 121725. [Google Scholar] [CrossRef]
  8. Haider, A.J.; AL-Anbari, R.H.; Kadhim, G.R.; Salame, C.T. Exploring potential environmental applications of TiO2 nanoparticles. Energy Procedia 2017, 119, 332–345. [Google Scholar] [CrossRef]
  9. Lusvardi, G.; Barani, C.; Giubertoni, F.; Paganelli, G. Synthesis and characterization of TiO2 nanoparticles for the reduction of water pollutants. Materials 2017, 10, 1208. [Google Scholar] [CrossRef] [PubMed] [Green Version]
  10. Chen, P.C.; Chen, C.C.; Chen, S.H. A review on production, characterization, and photocatalytic applications of TiO2 nanoparticles and nanotubes. Curr. Nanosci. 2017, 13, 373–393. [Google Scholar] [CrossRef]
  11. Wang, S.; Yu, H.; Yuan, S.; Zhao, Y.; Wang, Z.; Fang, J.; Zhang, M.; Shi, L. Synthesis of triphasic, biphasic, and monophasic TiO2 nanocrystals and their photocatalytic degradation mechanisms. Res. Chem. Intermed. 2016, 42, 3775–3788. [Google Scholar] [CrossRef]
  12. Ramanavicius, S.; Ramanavicius, A. Insights in the application of stoichiometric and non-stoichiometric titanium oxides for the design of sensors for the determination of gases and VOCs (TiO2−x and TinO2n−1 vs. TiO2). Sensors 2020, 20, 6833. [Google Scholar] [CrossRef] [PubMed]
  13. Zhukovskii, Y.F.; Piskunov, S.; Lisovski, O.; Bocharov, D.; Evarestov, R.A. Doped 1D nanostructures of transition-metal oxides: First-principles evaluation of photocatalytic suitability. Isr. J. Chem. 2017, 57, 461–476. [Google Scholar] [CrossRef]
  14. Sidaraviciute, R.; Kavaliunas, V.; Puodziukynas, L.; Guobiene, A.; Martuzevicius, D.; Andrulevicius, M. Enhancement of photocatalytic pollutant decomposition efficiency of surface mounted TiO2 via lithographic surface patterning. Environ. Technol. Innov. 2020, 19, 100983. [Google Scholar] [CrossRef]
  15. Nosaka, Y.; Nosaka, A.Y. Generation and detection of reactive oxygen species in photocatalysis. Chem. Rev. 2017, 117, 11302–11336. [Google Scholar] [CrossRef] [PubMed]
  16. Tamm, A.; Seinberg, L.; Kozlova, J.; Link, J.; Pikma, P.; Stern, R.; Kukli, K. Quasicubic α-Fe2O3 nanoparticles embedded in TiO2 thin films grown by atomic layer deposition. Thin Solid Films 2016, 612, 445–449. [Google Scholar] [CrossRef]
  17. Rempel, A.A.; Kuznetsova, Y.V.; Dorosheva, I.B.; Valeeva, A.A.; Weinstein, I.A.; Kozlova, E.A.; Saraev, A.A.; Selishchev, D.S. High Photocatalytic Activity Under Visible Light of Sandwich Structures Based on Anodic TiO2/CdS Nanoparticles/Sol–Gel TiO2. Top. Catal. 2020, 63, 130–138. [Google Scholar] [CrossRef]
  18. Tuckute, S.; Varnagiris, S.; Urbonavicius, M.; Lelis, M.; Sakalauskaite, S. Tailoring of TiO2 film crystal texture for higher photocatalysis efficiency. Appl. Surf. Sci. 2019, 489, 576–583. [Google Scholar] [CrossRef]
  19. Kenmoe, S.; Lisovski, O.; Piskunov, S.; Bocharov, D.; Zhukovskii, Y.F.; Spohr, E. Water adsorption on clean and defective anatase TiO2 (001) nanotube surfaces: A surface science approach. J. Phys. Chem. B 2018, 122, 5432–5440. [Google Scholar] [CrossRef]
  20. Wunderlich, W.; Oekermann, T.; Miao, L.; Hue, N.T.; Tanemura, S.; Tanemura, M. Electronic properties of Nano-porous TiO2- and ZnO- thin films—Comparison of simulations and experiments. J. Ceram. Process. Res. 2004, 5, 343–354. [Google Scholar]
  21. Knoks, A.; Kleperis, J.; Grinberga, L. Raman spectral identification of phase distribution in anodic titanium dioxide coating. Proc. Estonian Acad. Sci. 2017, 66, 422–429. [Google Scholar] [CrossRef]
  22. Brik, M.G.; Antic, Ž.M.; Vukovic, K.; Dramicanin, M.D. Judd-Ofelt analysis of Eu3+ emission in TiO2 anatase nanoparticles. Mater. Trans. 2015, 56, 1416–1418. [Google Scholar] [CrossRef] [Green Version]
  23. Nishioka, S.; Yanagisawa, K.; Lu, D.; Vequizo, J.J.M.; Yamakata, A.; Kimoto, K.; Inada, M.; Maeda, K. Enhanced water splitting through two-step photoexcitation by sunlight using tantalum/nitrogen-codoped rutile titania as a water oxidation photocatalyst. Sustain. Energy Fuels 2019, 3, 2337–2346. [Google Scholar] [CrossRef] [Green Version]
  24. Kavaliunas, V.; Krugly, E.; Sriubas, M.; Mimura, H.; Laukaitis, G.; Hatanaka, Y. Influence of Mg, Cu, and Ni dopants on amorphous TiO2 thin films photocatalytic activity. Materials 2020, 13, 886. [Google Scholar] [CrossRef] [PubMed] [Green Version]
  25. Wu, F.; Hu, X.; Fan, J.; Sun, T.; Kang, L.; Hou, W.; Zhu, C.; Liu, H. Photocatalytic activity of Ag/TiO2 nanotube arrays enhanced by surface plasmon resonance and application in hydrogen evolution by water splitting. Plasmonics 2013, 8, 501–508. [Google Scholar] [CrossRef]
  26. Linitis, J.; Kalis, A.; Grinberga, L.; Kleperis, J. Photo-activity research of nano-structured TiO2 layers. IOP Conf. Ser. Mater. Sci. Eng. 2011, 23, 012010. [Google Scholar] [CrossRef] [Green Version]
  27. Kozlovskiy, A.; Shlimas, D.; Kenzhina, I.; Boretskiy, O.; Zdorovets, M. Study of the effect of low-energy irradiation with O2+ ions on radiation hardening and modification of the properties of thin TiO2 films. J. Inorg. Organomet. Polym. Mater. 2021, 31, 790–801. [Google Scholar] [CrossRef]
  28. Mattsson, M.S.M.; Azens, A.; Niklasson, G.A.; Granqvist, C.G.; Purans, J. Li intercalation in transparent Ti-Ce oxide films: Energetics and ion dynamics. J. Appl. Phys. 1997, 81, 6432–6437. [Google Scholar] [CrossRef]
  29. Dukenbayev, K.; Kozlovskiy, A.; Kenzhina, I.; Berguzinov, A.; Zdorovets, M. Study of the effect of irradiation with Fe7+ ions on the structural properties of thin TiO2 foils. Mater. Res. Express 2019, 6, 046309. [Google Scholar] [CrossRef]
  30. Kiisk, V.; Akulitš, K.; Kodu, M.; Avarmaa, T.; Mändar, H.; Kozlova, J.; Eltermann, M.; Puust, L.; Jaaniso, R. Oxygen-sensitive photoluminescence of rare earth ions in TiO2 thin films. J. Phys. Chem. C 2019, 123, 17908–17914. [Google Scholar] [CrossRef]
  31. Milovanov, Y.S.; Gavrilchenko, I.V.; Gayvoronsky, V.Y.; Kuznetsov, G.V.; Skryshevsky, V.A. Impact of Nanoporous Metal Oxide Morphology on Electron Transfer Processes in Ti–TiO2–Si Heterostructures. J. Nanoelectron. Optoelectron. 2014, 9, 432–436. [Google Scholar] [CrossRef]
  32. Reklaitis, I.; Radiunas, E.; Malinauskas, T.; Stanionytė, S.; Juška, G.; Ritasalo, R.; Pilvi, T.; Taeger, S.; Strassburg, M.; Tomašiūnas, R. A comparative study on atomic layer deposited oxide film morphology and their electrical breakdown. Surf. Coat. Technol. 2020, 399, 126123. [Google Scholar] [CrossRef]
  33. Luchinsky, G.P. Chemistry of the Titanium; Khimija: Moskow, Russia, 1971. (In Russian) [Google Scholar]
  34. Gribb, A.A.; Banfield, J.F. Particle size effects on transformation kinetics and phase stability in nanocrystalline TiO2. Amer. Miner. 1997, 82, 717–728. [Google Scholar] [CrossRef]
  35. Zhang, H.; Banfield, J.F. Thermodynamic analysis of phase stability of nanocrystalline titania. J. Mater. Chem. 1998, 8, 2073–2076. [Google Scholar] [CrossRef]
  36. Hanaor, D.A.H.; Sorell, C.C. Review of the anatase to rutile phase transformation. J. Mater. Sci. 2011, 46, 855–874. [Google Scholar] [CrossRef] [Green Version]
  37. Gupta, S.M.; Tripathi, M. A review on the synthesis of TiO2 nanoparticles by solution route. Cent. Eur. J. Chem. 2012, 10, 279–294. [Google Scholar] [CrossRef]
  38. Byranvand, M.M.; Kharat, A.N.; Fatholahi, L.; Beiranvand, Z.M. A review on synthesis of nano-TiO2 via different methods. J. Nanostruct. 2013, 3, 1–9. [Google Scholar] [CrossRef]
  39. Wang, Z.; Liu, S.; Cao, X.; Wu, S.; Liu, C.; Li, G.; Jiang, W.; Wang, H.; Wang, N.; Ding, W. Preparation and characterization of TiO2 nanoparticles by two different precipitation methods. Ceram. Int. 2020, 46, 15333–15341. [Google Scholar] [CrossRef]
  40. Wategaonkar, S.B.; Pawar, R.P.; Parale, V.G.; Nade, D.P.; Sargar, B.M.; Mane, R.K. Synthesis of rutile TiO2 nanostructures by single step hydrothermal route and its characterization. Mater. Today Proc. 2020, 23, 444–451. [Google Scholar] [CrossRef]
  41. Kusior, A.; Banas, J.; Trenczek-Zajac, A.; Zubrzycka, P.; Micek-Ilnicka, A.; Radecka, M. Structural properties of TiO2 nanomaterials. J. Mol. Struct. 2018, 1157, 327–336. [Google Scholar] [CrossRef]
  42. Sharma, A.; Karn, R.K.; Pandiyan, S.K. Synthesis of TiO2 nanoparticles by sol-gel method and their characterization. J. Basic Appl. Eng. Res. 2014, 1, 1–5. [Google Scholar]
  43. Toygun, S.; Konecoglu, G.; Kalpakli, Y. General principles of sol-gel. J. Eng. Nat. Sci. 2013, 31, 456–476. [Google Scholar]
  44. Khol’kin, A.I.; Patrusheva, T.N. Extraction-Pyrolytic Method: Fabrication of Functional Oxide Materials; KomKniga: Moskow, Russian, 2006; ISBN 548-400-582-5. (In Russian) [Google Scholar]
  45. Patrusheva, T.N.; Popov, V.S.; Prabhu, G.; Popov, A.V.; Ryzhenkov, A.V.; Snezhko, N.Y.; Morozchenko, D.A.; Zaikovskii, V.D.; Khol’kin, A.I. Preparation of a photoanode with a multilayer structure for solar cells by extraction pyrolysis. Theor. Found. Chem. Eng. 2014, 48, 454–460. [Google Scholar] [CrossRef]
  46. Popov, A.I.; Shirmane, L.; Pankratov, V.; Lushchik, A.; Kotlov, A.; Serga, V.E.; Kulikova, L.D.; Chikvaidze, G.; Zimmermann, J. Comparative study of the luminescence properties of macro- and nanocrystalline MgO using synchrotron radiation. Nucl. Instrum. Methods Phys. Res. B 2013, 310, 23–26. [Google Scholar] [CrossRef]
  47. Serga, V.; Burve, R.; Maiorov, M.; Krumina, A.; Skaudzius, R.; Zarkov, A.; Kareiva, A.; Popov, A. Impact of gadolinium on the structure and magnetic properties of nanocrystalline powders of iron oxides produced by the extraction-pyrolytic method. Materials 2020, 13, 4147. [Google Scholar] [CrossRef] [PubMed]
  48. Burve, R.; Serga, V.; Krumina, A.; Poplausks, R. Preparation and characterization of nanocrystalline gadolinium oxide powders and films. Key Eng. Mater. 2020, 850, 267–272. [Google Scholar] [CrossRef]
  49. Gindin, L.M. Extraction Processes and Its Application; Nauka: Moskow, Russia, 1984. (In Russian) [Google Scholar]
  50. Sharlo, G. Quantitative Analysis of the Inorganic Compounds. In Methods of the Analytical Chemistry; Lur’e, Y.Y., Ed.; Himija: Moskow, Russia, 1969; Volume 2, ISBN 978-544-584-821-9. (In Russian) [Google Scholar]
  51. Drozdov, A.A.; Zlomanov, G.N.; Mazo, G.N.; Spiridinov, F.M. Chemistry of the Transition Elements. In Inorganic Chemistry; Tretyakov, Y.D., Ed.; Akademija: Moskow, Russia, 2008; Volume 3, Part 1; pp. 56–99. ISBN 576-952-532-0. (In Russian) [Google Scholar]
  52. Mehrotra, R.C.; Bohra, R. Metal Carboxylates; Academic Press: London, UK, 1983; ISBN 978-012-488-160-0. [Google Scholar]
  53. Patil, K.C.; Chandrashekhar, G.V.; George, M.V.; Rao, C.N.R. Infrared spectra and thermal decompositions of metal acetates and dicarboxylates. Can. J. Chem. 1968, 46, 257–265. [Google Scholar] [CrossRef] [Green Version]
  54. Smith, B.C. A process for successful infrared spectral interpretation. Spectroscopy 2016, 31, 14–21. [Google Scholar]
  55. Stuart, B. Analytical techniques in the sciences. In Infrared Spectroscopy: Fundamentals and Applications; Ando, D.J., Ed.; John Wiley&Sons: Chichester, UK, 2004; ISBN 978-047-085-427-3. [Google Scholar]
  56. Smith, B.C. The carbonyl group, part V: Carboxylates-coming clean. Spectroscopy 2018, 33, 20–23. [Google Scholar]
  57. Nyquist, R.A.; Kagel, R.O. Infrared spectra of inorganic compounds. In Handbook of Infrared and Raman Spectra of Inorganic Compounds and Organic Salts, 1st ed.; Acad. Press: London, UK, 1971; pp. 1–18. ISBN 978-008-087-852-2. [Google Scholar]
  58. NIST Chemistry WebBook. Available online: http://webbook.nist.gov/chemistry/ (accessed on 2 November 2020).
  59. Ocana, M.; Fornés, V.; García Ramos, J.V.; Serna, C.J. Factors affecting the infrared and raman spectra of rutile powders. J. Solid State Chem. 1988, 75, 364–372. [Google Scholar] [CrossRef] [Green Version]
  60. Savchyn, P.; Karbovnyk, I.; Vistovskyy, V.; Voloshinovskii, A.; Pankratov, V.; Cestelli Guidi, M.; Mirri, C.; Myahkota, O.; Riabtseva, A.; Mitina, N. Vibrational properties of LaPO4 nanoparticles in mid-and far-infrared domain. J. Appl. Phys. 2012, 112, 124309. [Google Scholar] [CrossRef]
  61. Balasubramanian, C.; Bellucci, S.; Cinque, G.; Marcelli, A.; Guidi, M.C.; Piccinini, M.; Popov, A.; Soldatov, A.; Onorato, P. Characterization of aluminium nitride nanostructures by XANES and FTIR spectroscopies with synchrotron radiation. J. Phys. Condens. Matter 2006, 18, S2095–S2104. [Google Scholar] [CrossRef]
  62. Bellucci, S.; Popov, A.I.; Balasubramanian, C.; Cinque, G.; Marcelli, A.; Karbovnyk, I.; Savchyn, V.; Krutyak, N. Luminescence, vibrational and XANES studies of AlN nanomaterials. Radiat. Meas. 2007, 42, 708–711. [Google Scholar] [CrossRef]
Figure 1. DSC (1) and TGA (2) curves of the precursors produced by extraction–pyrolytic method (EPM): (A) E1; (B) E2.
Crystals 11 00431 g001
Figure 2. DSC (1) and TG (2) curves of the precursor (P).
Crystals 11 00431 g002
Figure 3. XRD patterns of nanocrystalline TiO2 powders produced from the precursor E1 at different pyrolysis temperatures. * Signal of a silicon substrate from the measuring cuvette.
Crystals 11 00431 g003
Figure 4. X-ray diffraction patterns of nanocrystalline TiO2 powders produced from the precursor E2 at different pyrolysis temperatures.
Crystals 11 00431 g004
Figure 5. XRD patterns of nanocrystalline TiO2 powders produced from the precursor P at different processing temperatures.
Crystals 11 00431 g005
Figure 6. FTIR spectra of the samples produced from the precursor E2 at different pyrolysis temperatures: E2-1—350 °C, E2-2—400 °C, E2-3—450 °C, E2-4—550 °C.
Crystals 11 00431 g006
Figure 7. HR-TEM (a bottom raw), TEM (a medium raw) images and histograms of the particle size distribution (a top raw) of samples produced by the EPM (A,B) and precipitation method (C) at temperatures: (A)—450 °C (sample E2-3); (B)—750 °C (sample E2-6); (C)—450 °C (sample P-1).
Crystals 11 00431 g007
Table 1. Impact of the heat treatment conditions of titanium-containing precursors on the phase composition and mean crystallite size of the final products.
Sample Nr.Production ConditionsXRD Analysis Results
PrecursorPyrolysis Temperature T, °CPhase
Composition
d, nmW, %
E1-1E1350Amorphous--
E2-1E2
E1-2E1400Amorphous--
E2-2E2Anatase5100
E1-3E1450Anatase8100
E2-3E2Anatase9100
P-1PAnatase9100
E1-4E1550Anatase15100
E2-4E2Anatase
Rutile
20
~30
87.7
12.3
P2PAnatase10100
E1-5E1650Anatase
Rutile
30
~40
80.9
19.1
E2-5E2Anatase
Rutile
~35
45
20.6
79.4
P3PAnatase
Rutile
14
Discerned
96.4
3.6
E1-6E1750Anatase
Rutile
Discerned 651.1
98.9
E2-6E2Rutile53100
P-4PRutile
Na2Ti6O13
68
-
100
-
Publisher’s Note: MDPI stays neutral with regard to jurisdictional claims in published maps and institutional affiliations.