1. Introduction
Huge efforts into the investigation of group III nitrides have been made because of their wide application in electronic devices, such as light-emitting diodes and lasers [
1]. The wide variety in the band gaps of the binary nitrides AlN (6.2 eV) [
2], GaN (3.4 eV) [
3], and InN (0.7–1.9 eV) [
4,
5,
6], as well as solid solutions thereof, predestines these materials for such applications, although the synthesis of high quality material remains challenging. The ammonothermal synthesis route is especially useful for the synthesis of high-quality free-standing crystals of group III nitrides [
7,
8,
9,
10]. These materials can be employed, for instance, as substrates in hydride vapor phase epitaxy (HVPE), which enables fast growth rates and high purity coupled with high structural quality [
11].
The crystal growth of indium nitride is especially challenging due to its labile In–N bond, which is expressed in the low enthalpy of formation [
12]. With the ammonothermal synthesis, it was demonstrated that it is possible to synthesize InN crystals with sizes in the micrometer range [
13]. During such reactions, so-called mineralizers are used in order to enhance the solubility of the starting materials. In ammonoacidic crystal growth, typically ammonium or metal halides are utilized as mineralizers, while in ammonobasic crystal growth, alkali metals, their amides, or azides come into use. Since InN is highly corrosive against nickel-based alloys, which are typically used for ammonothermal syntheses, ceramic liners from Si
3N
4 or BN are employed to protect the autoclave [
14].
Since the chemistry of ammonothermal crystal growth of InN is only scarcely understood, we are particularly interested in the soluble intermediates that occur during the process. For instance, the dissolved intermediates can lead to the crystallization of solid amides or ammoniates, if appropriate conditions are chosen. Only a handful indium ammoniates and amides are known. Purdy synthesized In(NH
3)
3, along with other indium amides and nitrides [
15]. Ketchum et al. were successful in synthesizing InF
2(NH
2)(NH
3) [
16]. Bremm et al. published the crystal structure of InCl
3(NH
3)
3 = [In(NH
3)
4Cl
2][In(NH
3)
2Cl
4] [
17]. Recently, we were able to characterize the compounds [In(NH
3)
5Cl]Cl
2 and InF
2(NH
2) [
18]. With the synthesis and characterization of InAlF
6(NH
3)
2, [In(NH
3)
6][AlF
6], and [In
2F(NH
3)
10]
2[SiF
6]
5 ∙ 2 NH
3, we expand the scarce state of knowledge on indium ammoniates formed under near-ammononeutral conditions involving fluoride ions in the mineralizer system. Furthermore, we demonstrate how corrosion products stemming from the liner material can take part in the transport mechanisms of ammonothermal InN synthesis. Finally, knowledge on simultaneously dissolved group III metals in ammonothermal systems may lead the way towards the crystallization of solid solutions of their nitrides as well as intentionally doped nitride semiconductors.
2. Materials and Methods
The general approach of synthesizing intermediates in near-ammononeutral InN synthesis has already been discussed in the literature [
18]. We chose reaction conditions similar to the ammonothermal InN crystal growth [
13], thus using custom-made 97 mL autoclaves from nickel-based alloy with an internal Si
3N
4 liner, which prevents the autoclave from corrosion [
19,
20]. As reactants, InF
3 and KNH
2 were used in a molar ratio of 1:3. In order to avoid solid-state reactions of these starting materials, we used small crucibles from Si
3N
4, which fit into the Si
3N
4 liners (air-pressure sintered silicon nitride, Ingenieurkeramik, a QSIL company, Frankenblick, Germany). The InF
3 was placed within the Si
3N
4 liner, and the KNH
2 in the crucible. The crucible was equipped with a cap with a small hole, which reduced the diffusion rate of the well-soluble mineralizer (KNH
2) into the solution.
All preparative work was done in an argon-filled glovebox with
p(O
2) < 0.1 ppm (MBRAUN Inertgas-Systeme, Garching, Germany) because of moisture sensitivity of the products and reactants. The ammonia was condensed into the autoclave by cooling in an ethanol/dry ice bath. The amount of condensed ammonia was monitored with a self-made Tensi-Eudiometer, which was designed as described by Hüttig [
21]. The reactions were carried out in a vertical tubular furnace, LOBA 1200-60-400-1 OW (HTM Reetz, Berlin, Germany). The use of a one-heating zone furnace results in a temperature gradient from the bottom part of the autoclave within the furnace (hot zone) to its top part poking out (cold zone). The chemical transport reaction was therefore dominated by convection [
22,
23]. The pressures were monitored with a pressure transmitter HBM P2VA2 and a digital indicator DA 2510 (Hottinger Brüel & Kjaer, Darmstadt, Germany).
InAlF6(NH3)2 was synthesized in a slightly ammonobasic milieu, starting from 1.46 mmol InF3 and KNH2 in a molar ratio of n(InF3)/n(KNH2) = 1:3.12. The autoclave was filled with 19.1 g ammonia. The pressure was not monitored in this experiment. [In(NH3)6][AlF6] was synthesized in an ammononeutral milieu, starting from 0.73 mmol InF3 together with Al, NH4F, and KNH2 in a molar ratio of n(InF3)/n(Al)/ n(NH4F)/n(KNH2) = 1:1:3:6. The InF3, Al, and NH4F were placed in the liner, and the KNH2 was placed in the crucible. The autoclave was filled with 20.8 g ammonia. It reached a maximum pressure of 307.3 MPa. [In2F(NH3)10]2[SiF6]5 ∙ 2 NH3 was synthesized in a near ammononeutral milieu, starting from 0.73 mmol InF3 together with Ga, NH4F, and KNH2 in a molar ratio of n(InF3)/n(Ga)/n(NH4F)/n(KNH2) = 1:1:3:6. The InF3, Ga, and NH4F were placed in the liner, and the KNH2 in the crucible. The autoclave was filled with 19.7 g ammonia. The pressure was not monitored in this experiment. For all syntheses, the autoclaves were heated to 753 K with a heating rate of 90.8 K ∙ h–1. The autoclaves remained at this temperature for 60 h and were subsequently cooled to room temperature with a cooling rate of 90.8 K ∙ h−1.
InF3 (Alfa Aesar, Thermo Fisher, Kandel, Germany, 99.95% metal basis, anhydrous), Al (Alfa Aesar, 99.97% metal basis), Ga (Sigma Aldrich, Merck, Darmstadt, Germany, 99.99999% metals basis), and NH4F (Sigma Aldrich, >99.99%) were used. The KNH2 was self-made, synthesized from potassium (Sigma Aldrich, 98 %) reacting with ammonia at 373 K for 24 h.
Single crystal X-ray diffraction of InAlF
6(NH
3)
2 and [In
2F(NH
3)
10]
2[SiF
6]
5 ∙ 2 NH
3 was performed on a Stoe & Cie Stadivari (Darmstadt, Germany) four-circle diffractometer, and the diffraction experiment on [In(NH
3)
6][AlF
6] on a
κ-CCD (Bruker Cooperation, Billerica, MA, USA). All crystal structures were solved and refined with the SHELX-2013 software package [
24,
25]. Powder X-ray diffraction experiments (PXRD) were carried out on a Stoe & Cie Stadi-P equipped with a Dectris Mythen 1K detector, using Mo-
Kα1 radiation.
Single crystal Raman spectra were obtained on a XploRa Raman spectrometer (Horiba Europe, Oberursel, Germany) with a confocal polarization microscope (Olympus BX51, Olympus Europa, Hamburg, Germany). For data collection of both single crystal X-ray diffraction and Raman spectroscopy, selected crystals were sealed in glass capillaries under argon atmosphere. Infrared spectroscopy measuring on powder samples was performed under nitrogen atmosphere on a Nicolet iS5 FTIR (Thermo Fisher Scientific, Waltham, MA, USA).
Wavelength dispersive X-ray spectroscopy was performed on a Cameca SX-100 microprobe analyzer (CAMECA, Société par Actions Simplifiée (SAS), Gennevilliers, France) equipped with 5 wavelength dispersive X-ray spectrometers. The samples were placed on an adhesive carbon plate and sputtered with gold. The presence of all constituting elements heavier than nitrogen in the respective product crystals was proven via microprobe analysis. The silicon nitride liner material was investigated particularly with the presence of aluminum employing the Al-Kα line with an accelerating voltage of 15 kV and a beam current of 20 nA.
3. Results
Intermediates, which form during near-ammononeutral InN synthesis can be obtained by reacting indium trihalides together with three molar equivalents of an alkali metal amide (typically KNH
2). Since indium forms intermetallic phases with many metals and alloy constituents, it is necessary to protect the autoclave material from direct contact with the reactants. To protect the autoclave material from corrosion, we typically use liners made from Si
3N
4 [
14]. Additionally, we spatially separated the reactants in order to prevent solid-state reactions, rather than reactions of dissolved materials. This synthetic approach was already successful for the synthesis of [In(NH
3)
5Cl]Cl
2 and InF
2(NH
2) [
18]. If the reaction media is sufficiently aggressive, which is the case with the use of fluorides as a constituent of the mineralizer system, we have frequently observed attacks on the ceramic liner and crucible materials. Within the presented work, this equally concerns the formation of silicon compounds by the partial dissolution of the used Si
3N
4 and further components of this material, such as small amounts of aluminum used as a sintering aid during production. According to the producer, the material contains about 4 wt.% aluminum oxide. The presence of aluminum in the Si
3N
4 material was proven by wavelength dispersive X-ray spectroscopy (WDS).
InAlF
6(NH
3)
2 forms as a corrosion product from the liner material when indium trifluoride is used as the starting material, alongside the dominating compound InF
2(NH
2) [
18]. These two products were isolated from the bottom of the liner, which represents the hotter zone of the reaction container, implying a retrograde solubility, that is, lower solubility at higher temperatures. For a targeted synthesis of InAlF
6(NH
3)
2 we used InF
3 together with Al, NH
4F, and KNH
2 in a molar ratio of
n(InF
3)/
n(Al)/
n(NH
4F)/
n(KNH
2) = 1:1:3:6. However, instead of InAlF
6(NH
3)
2, we isolated [In(NH
3)
6][AlF
6] from the hot temperature zone of the reaction vessel, forming as colorless crystals with a cubic habitus. A PXRD measurement revealed the presence of this title compound next to indium metal, KF, and small amounts of further unknown impurities. The powder pattern can be found in
Figure S1 in the
Supplementary Materials. Furthermore, [In
2F(NH
3)
10]
2[SiF
6]
5 ∙ 2 NH
3, as a further corrosion product of the liner material, was observed in an experiment employing InF
3 together with Ga, NH
4F, and KNH
2 in a molar ratio of
n(InF
3)/
n(Ga)/
n(NH
4F)/
n(KNH
2) = 1:1:3:6. The synthesis aimed at a possible bimetallic intermediate in the system In/Ga. Presumably due to the low solubility of Ga within the applied reaction conditions and mineralizer system, the title compound formed as a corrosion product of the liner material instead. Colorless crystals of this title compound were isolated from the hot temperature zone of the reaction vessel. The presence of all constituting elements heavier than nitrogen was proven via microprobe analysis on the respective crystals. Selected crystallographic parameters and refinement data of all three compounds are presented in
Table 1 and
Table 2.
3.1. InAlF6(NH3)2
3.1.1. Crystal Structure
InAlF
6(NH
3)
2 crystallizes in the monoclinic space group C2/m. For selected crystal structure parameters and refinement data, see
Table 1. The atomic parameters and isotropic displacement parameters are presented in
Table 3; for the anisotropic displacement parameters, check
Table S1 in the
Supplementary Materials. For the interatomic distances and angles, see
Table 4.
The crystal structure of InAlF
6(NH
3)
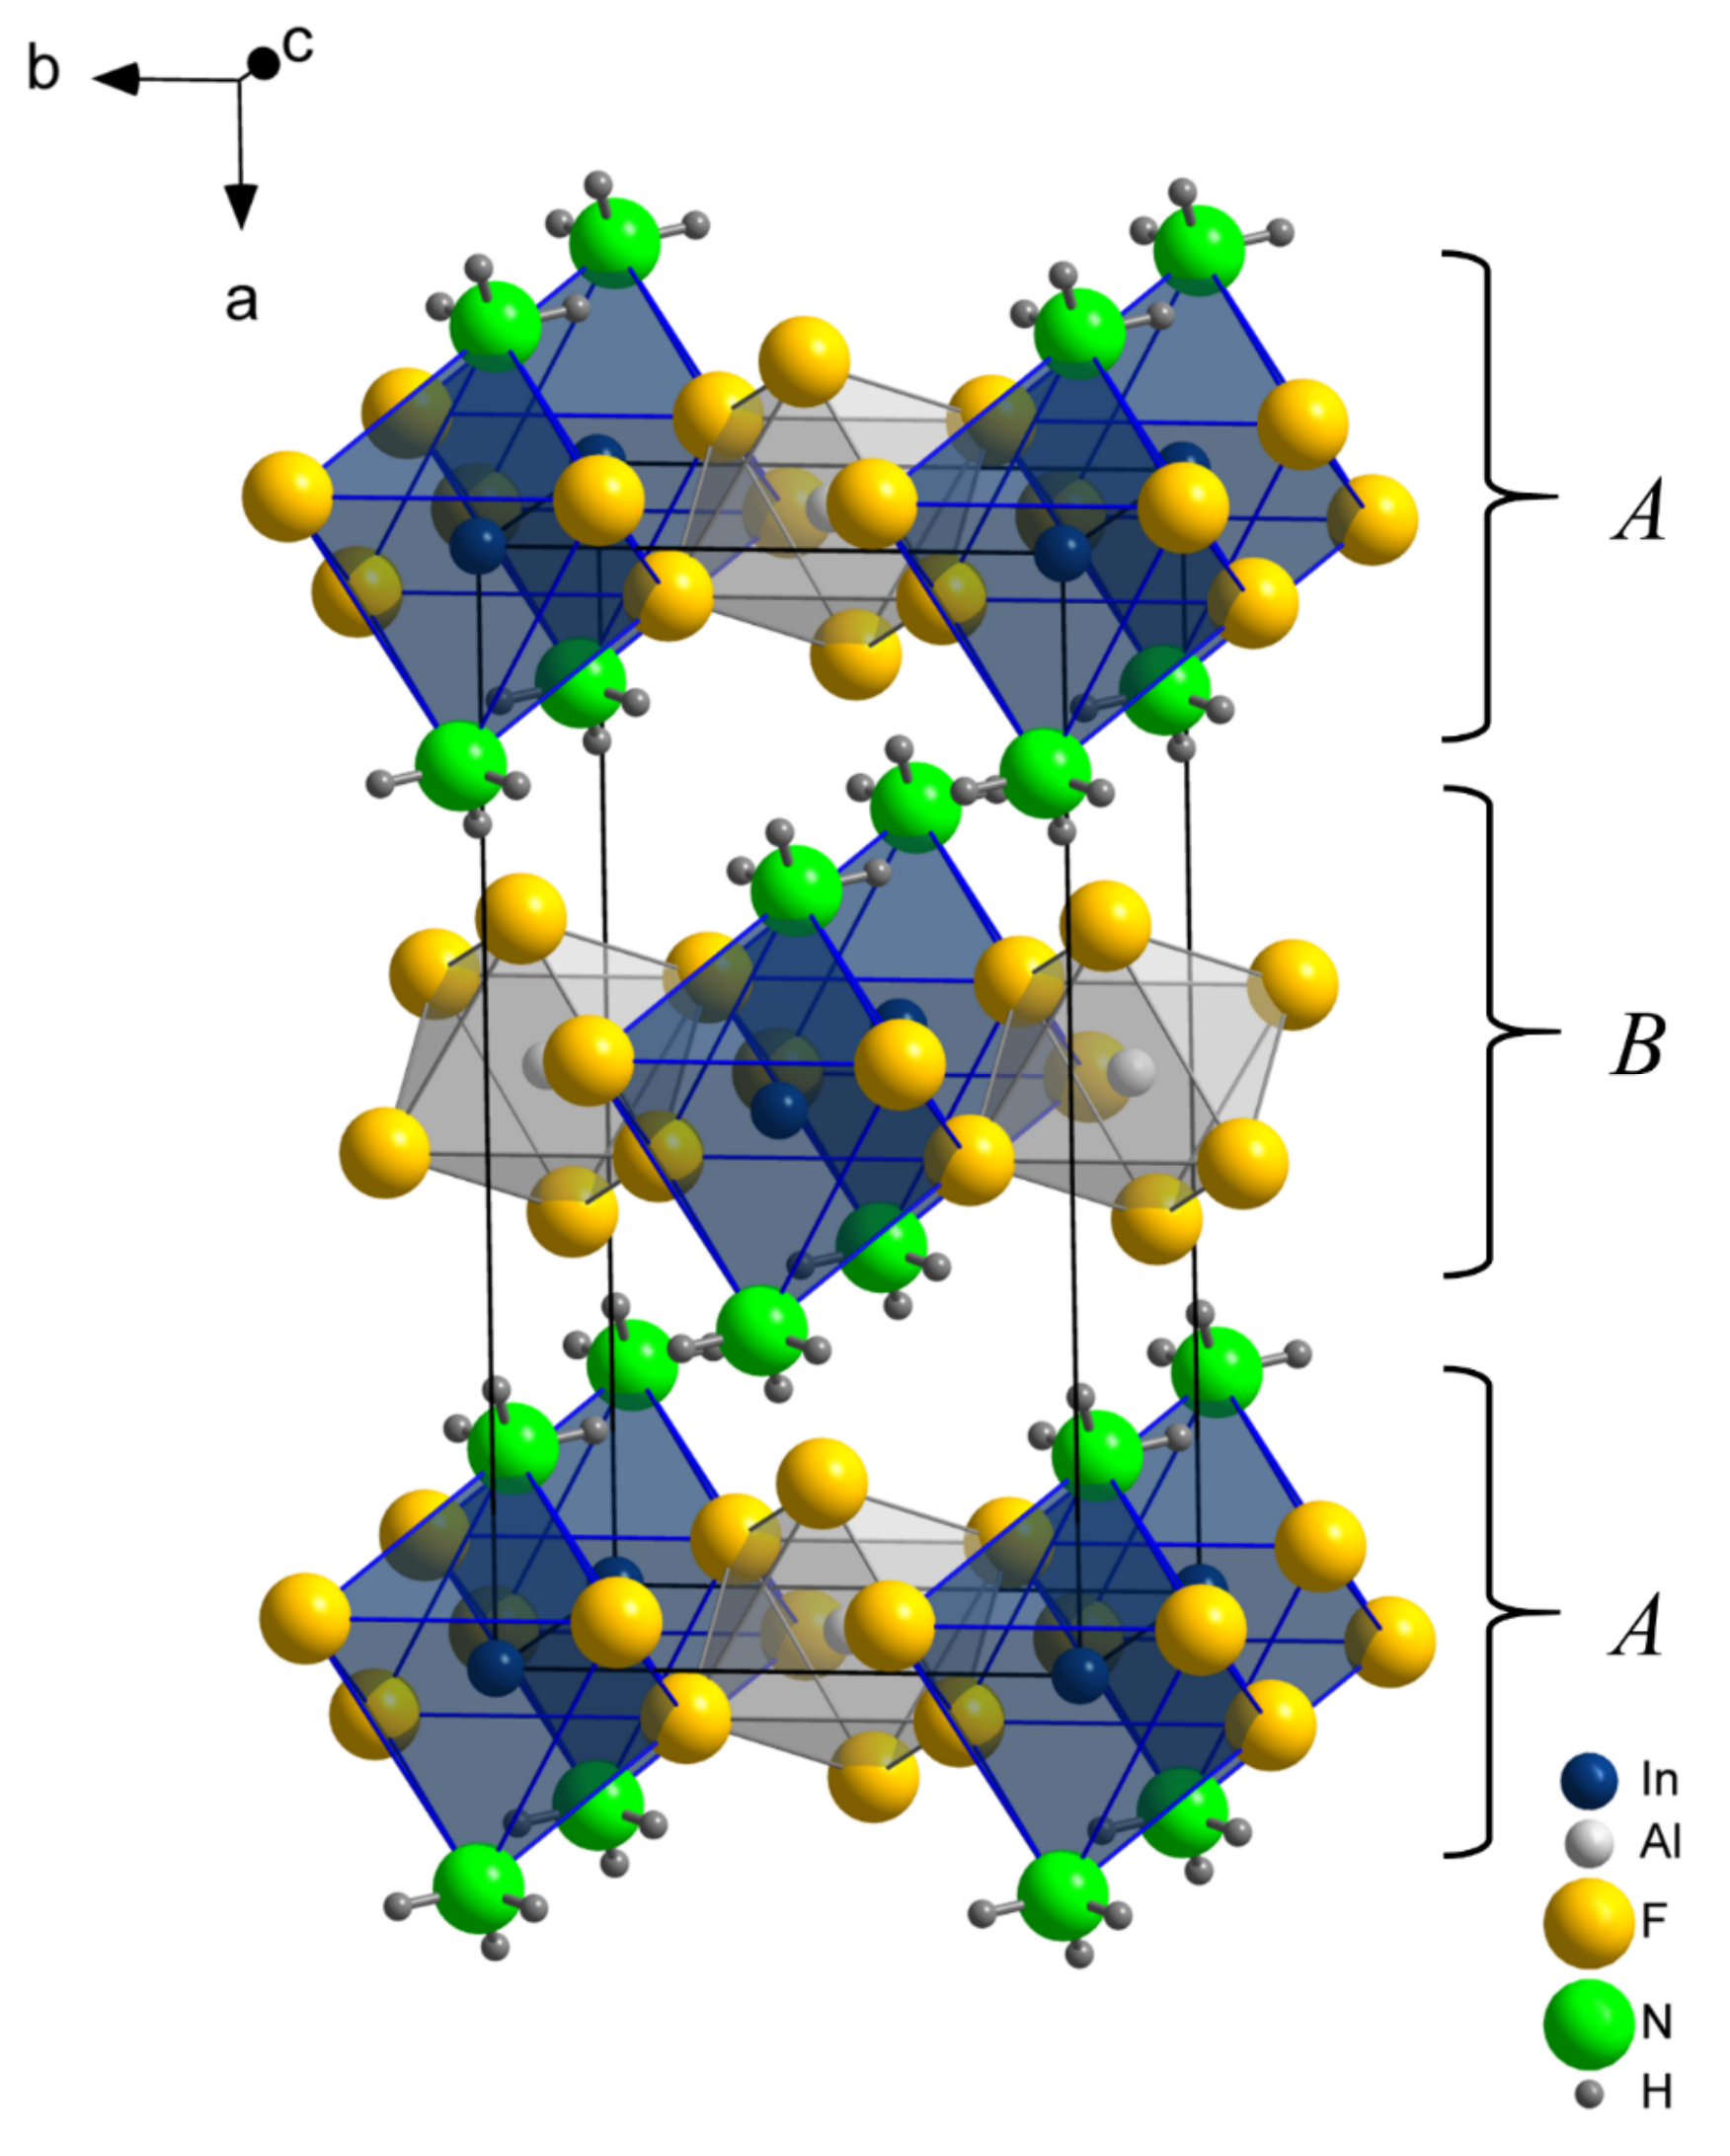
2 features one crystallographic site for indium, one for aluminum, two for fluorine, and one for nitrogen. The positions of the two crystallographically distinct hydrogen sites were taken from the difference Fourier map and refined without application of any constraints or restraints. The crystal structure can be understood as the stacking of layers of octahedrally coordinated indium and aluminum, as depicted in in
Figure 1. Within these layers, vertex-sharing InF
4(NH
3)
2 and AlF
6 octahedra are alternatingly arranged in a checkerboard manner (
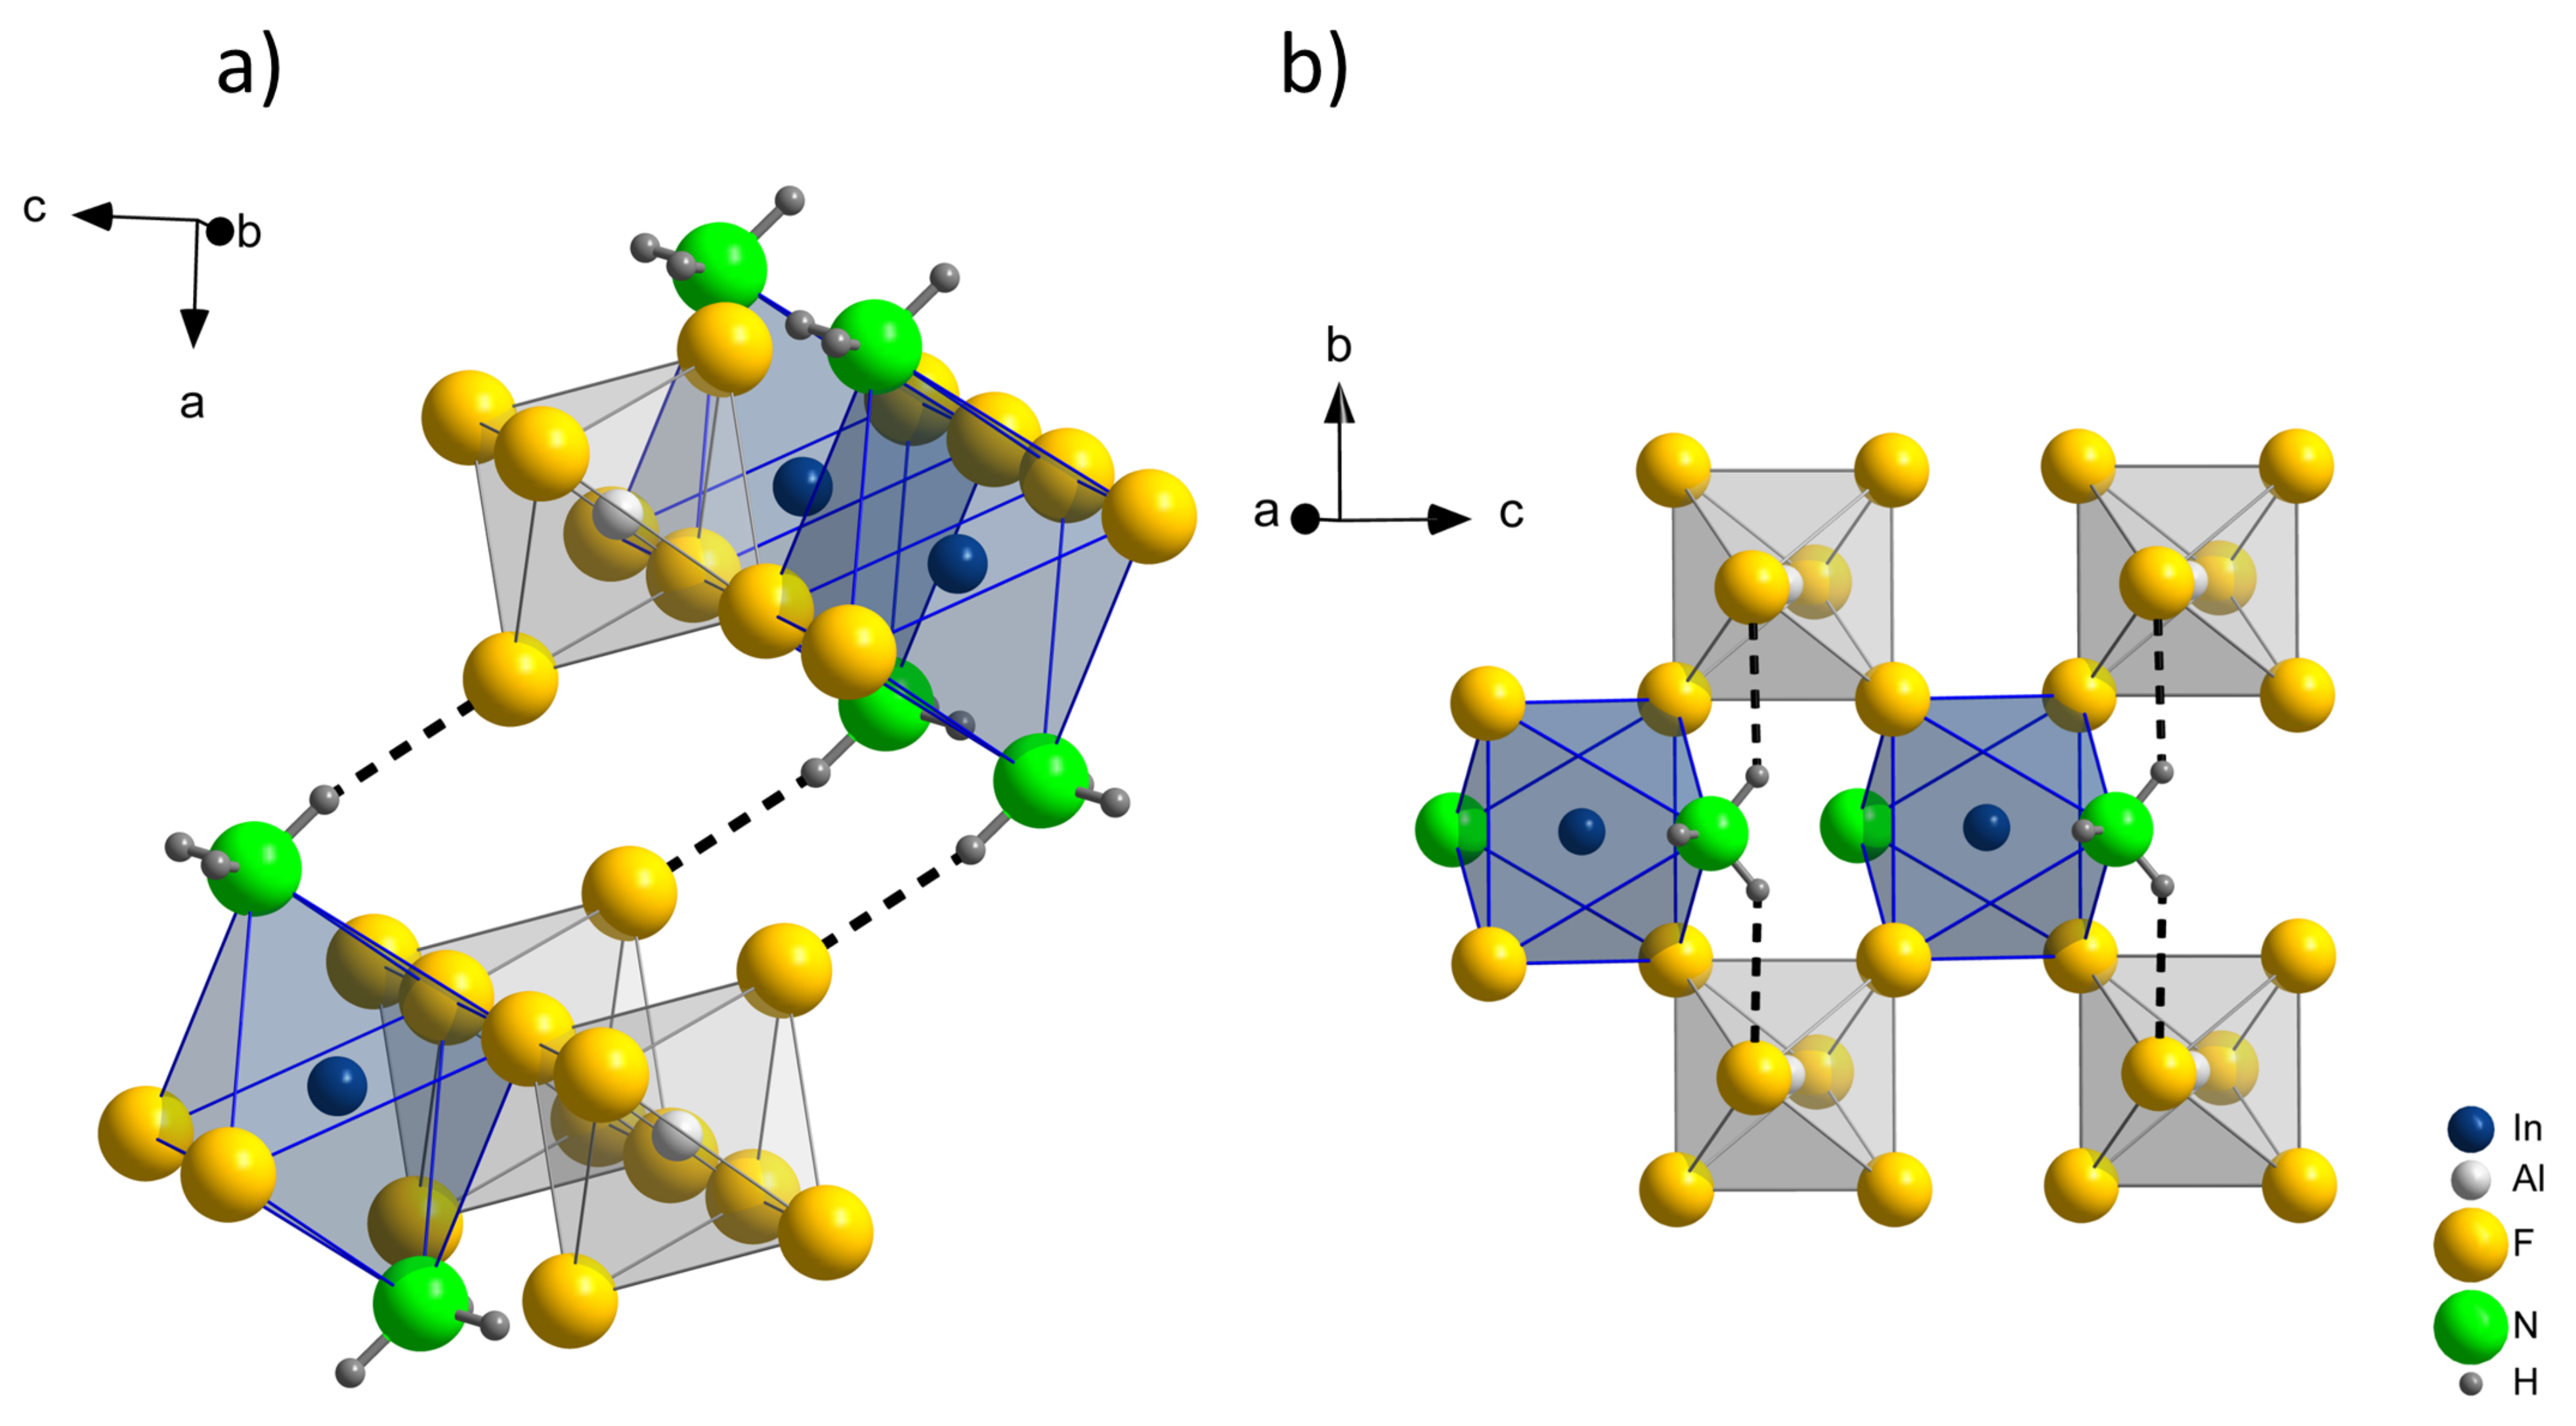
Figure 2). The interconnection of these octahedra is realized via the ligand F(1), while ammonia and F(2) terminate the layers at indium and aluminum atoms, respectively. This arrangement can be conveniently described with the Niggli formula
. These layers of vertex-sharing octahedra are stacked along the
a-axis in the sequence
AB, such that the terminal ligands are pointing into empty spaces of the neighboring layers. Interconnection between the layers is realized by N–H⋯F(2) hydrogen bonds (compare
Figure 3a).
The interatomic distance In–F(1) with 212 pm is slightly shorter than the In–N distance with 214 pm. The Al−F(2) distance of 177 pm is noticeably shorter than the Al–F(1) distance with 183 pm, which is due to the lower coordination number of the terminal ligands F(2) compared to the ligands F(1) realizing the corner-sharing. For InF
2(NH
2)(NH
3), Ketchum et al. reported an In–F distance of 219–220 pm for edged-sharing fluoride ligands [
16], expectedly longer than the In–F distance in InAlF
6(NH
3)
2. However, the In−(NH
3) distance in InF
2(NH
2)(NH
3) with 223 pm is noticeably longer than the In–N distance in InAlF
6(NH
3)
2. For comparison, in InF
2(NH
2), the In–F distance of the corner-sharing fluoride ligand is found to be 212 pm, and the In–N distances around 214–216 pm, quite similar to the respective distances in InAlF
6(NH
3)
2 [
18]. The In–F(1)–Al angle in the title compound with 140° indicates the octahedra being tilted with respect to each other.
The compound InAlF
6(NH
3)
2 features two different hydrogen bonds: N–H(1)⋯F(2) and
(2)⋯F(2). While
(2)⋯F(2) is responsible for the interconnection between the above discussed layers,
(1)⋯F(2) strengthens the interactions within these layers. Both hydrogen bonds are illustrated in
Figure 3. The distances and angles of these hydrogen bonds are presented in
Table 5. Strong D–H⋯A hydrogen bonds are expected, if the donor–acceptor distance is shorter than the sum of the van der Waals radii, which is 302 pm for nitrogen and fluorine [
26,
27]. Furthermore, the angle ∡(DHA) should be close to 180°. Both hydrogen bonds,
(1)⋯F(2) and
(1)⋯F(2), feature N⋯F(2) distances shorter than the sum of the van der Waals radii of N and F, and can be classified as strong in this regard. However, with ∡(
(1)⋯F(2)) = 139° and ∡(
(2)⋯F(2)) = 168°, the ∡(DHA) angles differ significantly, which indicates a stronger hydrogen bonding between rather than within the layers, possibly due to geometric restrictions. This is also supported by the single crystal Raman spectrum (compare
Figure 4), where strong hydrogen bonds are expected to shift the N–H stretching vibrations to lower frequencies [
28].
The compound Ga(NH
3)(NH
2)F
2 crystallizes isostructural to InAlF
6(NH
3)
2 with very similar cell parameters [
29]. In the crystal structure of this compound, gallium replaces indium and aluminum in InAlF
6(NH
3)
2, while ammonia and amide ions occupy the positions of F(2) and NH
3 in the title compound, respectively. Merely the F(1) site of InAlF
6(NH
3)
2 is occupied by an equivalent fluoride ion in Ga(NH
3)(NH
2)F
2. The interatomic distances of the coordinating ligands in Ga(NH
3)(NH
2)F
2 are
d(Ga–F) = 194 and 195 pm,
d(Ga–NH
2) and
d(Ga–NH
3) = 190 pm. Roos et al. identified the positions of the hydrogen atoms from the difference Fourier map and argued that the presence of amide can be confirmed by Raman spectroscopy. An observed weak signal at 1541 cm
−1 was assigned to a N–H deformation vibration mode of the amide ligand. An arrangement of the ligands in InAlF
6(NH
3)
2 with analogous location of ammonia molecules, amide, and fluoride ions, that is, replacing NH
3 by NH
2− in the surroundings of In and NH
3 by F
– in the environment of Al, which would mean,
is unlikely according to the following arguments. Firstly, according to the Hard and Soft Acids and Bases (HSAB) concept, the harder fluoride ligand is expected to preferentially bind to the harder aluminum cation. Secondly, the Al–F(2) distance with 183 pm appears to be too short for an Al–NH
3 bond, which is typically in the range of 192–205 pm [
16,
30,
31,
32,
33]. Furthermore, we find no indication from the crystal structure refinement or spectroscopy for this alternative arrangement.
3.1.2. Raman Spectroscopy
Raman spectroscopy was performed on the identical crystal, which was used for the X-ray diffraction experiment for structure determination. Vibrational spectroscopy is especially helpful to identify stretching and deformation vibrations of the ammine and fluoride ligands
ν(NH
3),
ν(In–N,F),
ν(Al–F) and
δ(NH
3),
δ(N,F–In–N,F),
δ(F–Al–F), and thus, gives helpful information about the constitution of the compound. Due to the limited size of the crystal, the spectrum shows only weak signals. Multiple signals of the
ν(N–H) stretching vibrations can be observed in the range of 3207–3303 cm
−1. In gaseous ammonia, only two signals for the symmetric and antisymmetric stretching vibrations can be observed at 3337 cm
−1 and 3450 cm
−1. The occurrence of multiple signals indicates the presence of at least two crystallographically distinct hydrogen atoms, while the shift to lower frequencies is an effect of different involvement into hydrogen bonding, which weakens the N–H bonds [
28]. Signals for N–H stretching vibrations in the above-mentioned energy range are typical for indium and gallium ammoniates. [In(NH
3)
5Cl]Cl
2 shows signals at 3151–3311 cm
−1 [
18]. In Ga(NH
3)
3F
3, they can be observed at 3182–3315 cm
−1 [
34], in Ga(NH
3)(NH
2)F
2 at 2961–3373 cm
−1 [
29].
δ(NH3) deformation modes would be expected to occur in the range of 1300–1700 cm−1, but are not observed because of the low intensities of these signals. The signals in the range of 100–500 cm−1 can be assigned to the ν(In–N), ν(In–F), ν(Al–F) and δ(N,F–In–N,F), δ(F–Al–F) stretching and deformation vibrations.
3.2. [In(NH3)6][AlF6]
3.2.1. Crystal Structure
Hexaammineindium (III) aluminum hexafluoride [In(NH
3)
6][AlF
6] crystallizes in the cubic space group
Pa with a lattice parameter of
a = 1012.55(3) pm. Selected crystallographic data and refinement parameters are summarized in
Table 1, and the fractional atomic coordinates and isotropic displacement parameters can be found in
Table 6. For anisotropic displacement parameters, compare
Table S2 in the
Supplementary Materials. The crystal structure features one crystallographic site for indium, aluminum, nitrogen, and fluorine each, and three symmetry-independent hydrogen atoms. The positions of the hydrogen atoms were taken and refined from the difference Fourier map without application of any constraints or restraints. It consists of isolated [In(NH
3)
6]
3+ and [AlF
6]
3− octahedra, which are interconnected via a N–H⋯F hydrogen bonding network. The In–N and Al–F distances refine to 224.1(2) pm and 181.3(1) pm, respectively. Focusing on the centers of gravity of the octahedra, the crystal structure can be described as a hierarchical variant of the NaCl structure type. A section of the crystal structure and a reduced variant, only showing aluminum and indium, is depicted in
Figure 5.
Isotypes with the compositions [
M(NH
3)
6][
M’F
6],
M = Co, Cr and
M’ = Al, Ga, In, Sc, Ti, V, Cr, Mn, and Fe, as well as [Rh(NH
3)
6][GaF
6], [Rh(NH
3)
6][MnF
6], and [Rh(NH
3)
6][ScF
6] have been previously synthesized by Weighardt et al. by adding a hot, aqueous solution of [
M(NH
3)
6]Cl
3 to a hot solution of
M’ in hydrofluoric acid [
35,
36,
37]. Furthermore, Subramanian et al. were able to synthesize [Ru(NH
3)
6][
M’F
6] (
M’ = Al, Ga, In, Sc, V, Cr, and Fe) by adding HF to an aqueous solution of [Ru(NH
3)
6]Cl
3 and an
M’ metal salt [
38]. [Ru(NH
3)
6][AlF
6] is the only hexafluoridoaluminate of this type, of which comprehensive crystal structure data have been published. Compared to [In(NH
3)
6][AlF
6], the interatomic distances of aluminum and fluorine, 183 pm in [Ru(NH
3)
6][AlF
6], are quite similar. The Ru–N distance with 208 pm is noticeably shorter than the In–N distance, which is probably due to the smaller ionic radius of Ru
3+ compared to In
3+ in a six-fold coordination [
39].
All hydrogen atoms and fluoride ions in [In(NH
3)
6][AlF
6] are involved in hydrogen bonds. Each hydrogen atom of the ammonia ligand connects to a fluoride ligand of a different [AlF
6]
3− octahedron. In turn, each fluoride ligand functions as acceptor for three hydrogen bonds from ammonia ligands of three different [In(NH
3)
6]
3+ octahedra. The resulting three-dimensional hydrogen bonding system is visualized in
Figure 6. The three distinguishable hydrogen bonds feature N⋯F distances in the narrow range of 296–304 pm (sum of van der Waals radii 302 pm [
27]) with ∡(NHF) angles of 160–163°, indicating them quite similar and rather strong. For detailed information on the hydrogen bonds in [In(NH
3)
6][AlF
6], see
Table 7.
3.2.2. Vibrational Spectroscopy
Raman and IR spectra of [In(NH
3)
6][AlF
6] are depicted in
Figure 7 and the results are summarized in
Table 8. The
ν(NH
3) stretching vibrations appear in the range of 3200–3250 cm
−1 in the Raman spectrum, quite similar to the energy range for these modes in InAlF
6(NH
3)
2. Because of the strong hydrogen bonds in [In(NH
3)
6][AlF
6], the stretching vibrations
ν(NH
3) are shifted to lower energies compared to gaseous NH
3 [
28]. In the IR spectrum, additional signals for
ν(NH
3) stretching vibrations at 3310 and 3164 cm
−1 can be observed. In the Raman spectrum, two signals with low intensity are present at 2911 and 2972 cm
−1 due to Fermi resonance, as has been previously described for similar compounds [
35,
36]. The
δd(NH
3) deformation vibrations can be observed at 1675 cm
−1 in the Raman spectrum and at 1641 cm
−1 in the IR spectrum, respectively, in a rather typical energy range. The
δs(NH
3) deformation modes present at 1244 cm
−1 (Raman) and at 1278 and 1255 cm
−1 (IR). In [
M(NH
3)
6][AlF
6] (
M = Co, Cr, and Rh), these vibrations are observed at 1312–1346 cm
−1 [
35]. The rocking vibrations can be observed in the IR spectrum at 777 and 685 cm
−1, which is at a higher energy compared to those for [
M(NH
3)
6][AlF
6] (
M = Co, Cr, and Rh). In the Raman spectrum of [In(NH
3)
6][AlF
6] below 550 cm
−1, stretching and deformation modes of the complex ions can be observed.
3.3. [In2F(NH3)10]2[SiF6]5 ∙ 2 NH3
3.3.1. Crystal Structure
Bis[decaammine-
μ-fluoridodiindium (III)] pentakis(hexafluoridosilicate) diammoniate, [In
2F(NH
3)
10]
2[SiF
6]
5 ∙ 2 NH
3, crystallizes in the orthorhombic space group
Pnma. Selected crystallographic data and structure refinement parameters at 100 and 293 K are presented in
Table 2, and the fractional atomic coordinates and displacement parameters are given in
Tables S3 and S4 in the
Supplementary Materials. The crystal structure features 3 crystallographic positions for indium, 3 for silicon, 22 for nitrogen, 32 for fluorine, and 34 for hydrogen. The positions of all hydrogen atoms were taken from the difference Fourier map and refined with isotropic displacement parameters fixed to 1.2 times the isotropic displacement parameter of the adjacent nitrogen atom. For the ammonia molecule not attached to indium (site N(14)), it was not possible to determine the positions of the hydrogen atoms, probably due to rotational disorder. The In–N, In–F, and Si–F distances are presented in
Table 9. The In–N distances are in the range of 215–225 pm, which is similar to the In–N distances observed in the other title compounds InAlF
6(NH
3)
2 and [In(NH
3)
6][AlF
6], with 214 pm and 224 pm, respectively (see above). Correspondingly, the In–F distances with 213 and 214 pm are similar to those found for InAlF
6(NH
3)
2 (212 pm). The Si–F distances are within the range of 160–169 pm. For comparison, Stanko et al. described [Co(NH
3)
5Cl][SiF
6] with Si–F distances of 166–168 pm.
The crystal structure of [In
2F(NH
3)
10]
2[SiF
6]
5 ∙ 2 NH
3 features two crystallographic distinguishable octahedra doubles [(NH
3)
5In(1)–F–In(2)(NH
3)
5]
5+ and [(NH
3)
5In(3)–F–In(3)(NH
3)
5]
5+ next to three distinct [SiF
6]
2− octahedra and the ammonia molecule. The complex ions are depicted in
Figure 8.
The interconnection of all constituting ions and the ammoniate molecule is realized by hydrogen bonds (
Figure 9). The octahedra double [(NH
3)
5In(1)–F–In(2)(NH
3)
5]
5+ is surrounded by 12 [SiF
6]
2− octahedra, arranged as two face-sharing tetragonal antiprisms centered by In. In contrast, only 10 [SiF
6]
2− octahedra constitute the environment of the octahedra double [(NH
3)
5In(3)–F–In(3)(NH
3)
5]
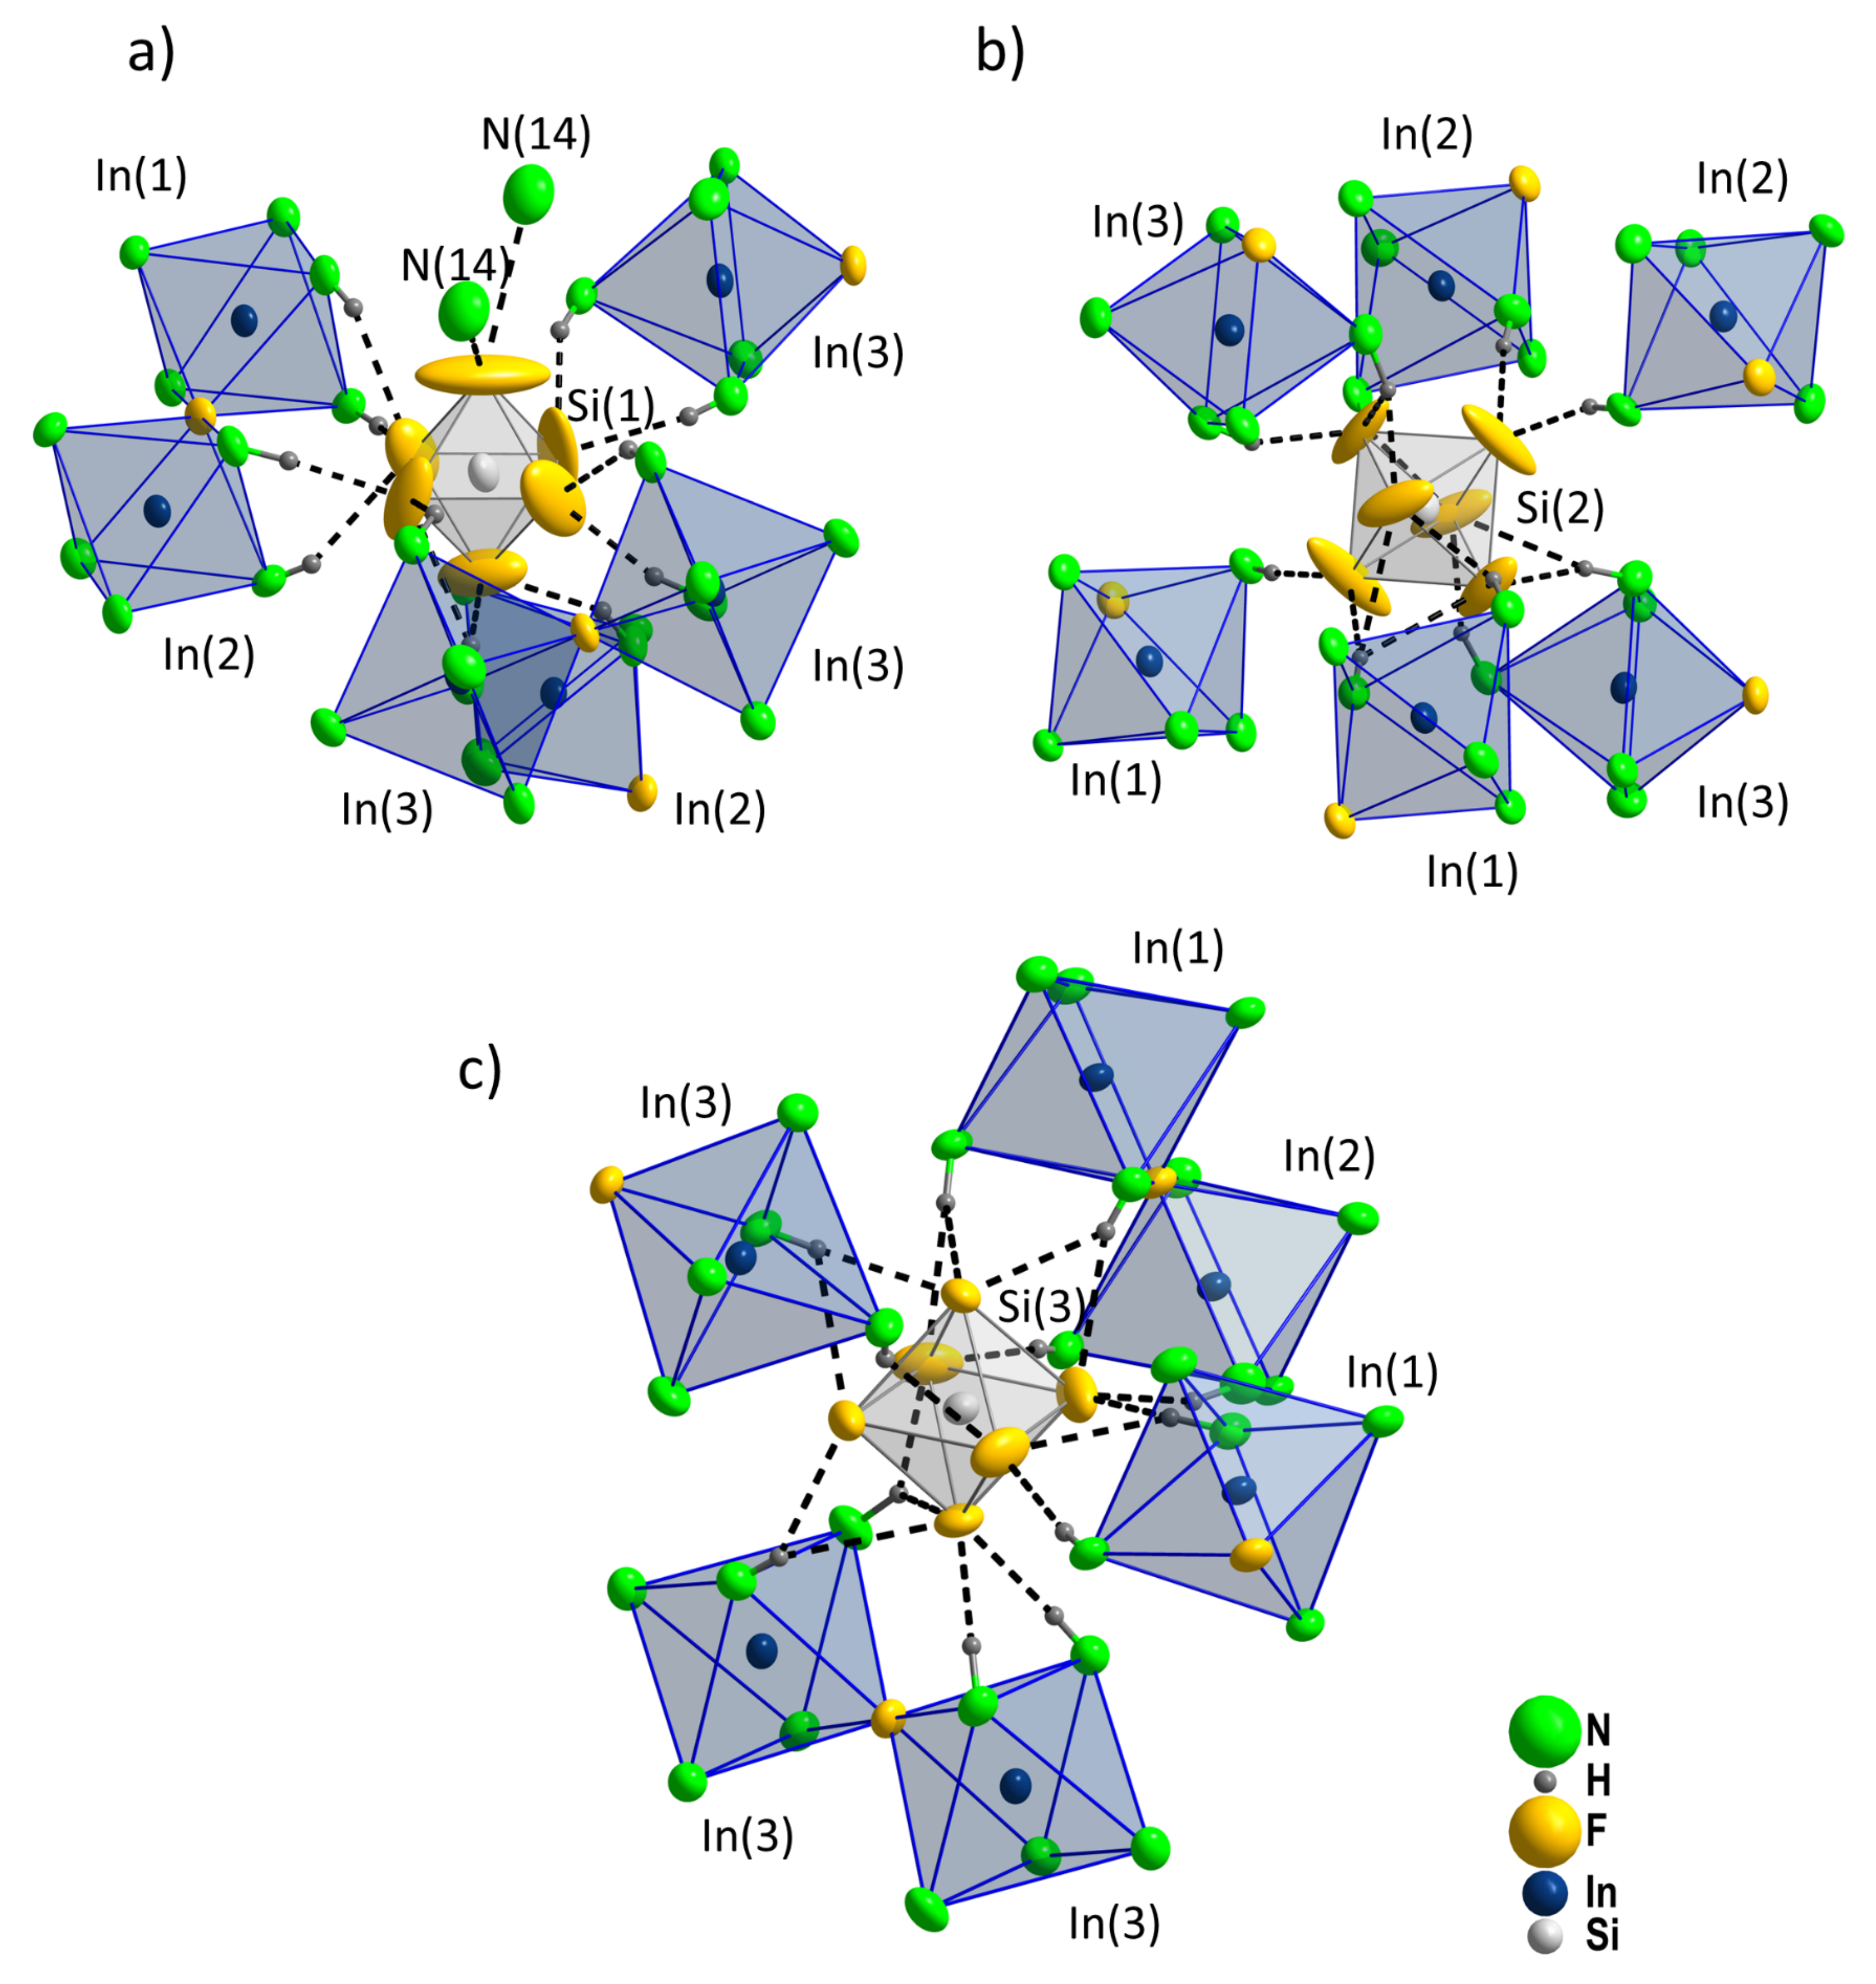
5+. The environment of the [Si(1)F
6]
2− octahedra is fundamentally different from the other two distinct [SiF
6]
2− ions, since it carries the ammoniate molecules (
Figure 10).
[In
2F(NH
3)
10]
2[SiF
6]
5 ∙ 2 NH
3 features numerous N–H⋯F hydrogen bonds. A total of 46 different hydrogen contacts with N⋯F distances of 276–329 pm and ∡(NHF) angles of 119 to 176° can be observed, which are listed in
Table S5 in the
Supplementary Materials, together with the relevant distances and angles corresponding to variously strong interactions. Since no hydrogen atoms of the N(14)H
3 molecule could be refined, the data for N(14)–H⋯F hydrogen bonds are incomplete and no statement on their strength can be made. As it can be taken from
Figure 11, the ammonia molecule has short distances to fluoride ions of three [SiF
6]
2− octahedra with one N(14)⋯F(3) distance shorter than 302 pm.
With respect to the structure refinement data, especially conspicuous are the large and elongated thermal ellipsoids of the fluorine atoms F(3–12) bound to Si(1) and Si(2) (compare
Figure 10). Yet, from the diffraction data, we see no evidence for additional reflections or diffuse scattering, which may point to a superstructure, modulation, or static disorder. However, due to the comparably low scattering power of the affected fluorine atoms, such effects might be hard to observe. Introducing split positions for those fluorine atoms with large thermal ellipsoids failed to improve the crystal structure model. In order to scrutinize thermal oscillation, we have performed a second single crystal diffraction experiment at lower temperature of 100 K using the identical crystal in addition to the initial measurement at 293 K. The averaged displacement parameters
U11,
U22,
U33, and
Ueq, respectively, for distinct atom groups (In, Si, N(1–13), ammoniate N(14), F(1) and F(2) bridging In, and F(3–8), F(9–12), F(13–18) of the three distinct [SiF
6]
2− octahedra) were plotted against the temperature and extrapolated to 0 K. As it can be taken from
Figure 12, nearly all extrapolated lines meet closely at a low common residual displacement parameter at 0 K, except for those for F(3–8) and, particularly, F(9–12), deviating to much larger values. This might indicate a static disorder rather than a thermal displacement as reason for the observed enlarged displacement parameters. An analysis of the main tensor elements
Uii is given in
Figure S2 and
Table S6 in the
Supplementary Materials.
3.3.2. Raman Spectroscopy
The Raman spectrum of [In
2F(NH
3)
10]
2[SiF
6]
5 ∙ 2 NH
3 recorded on a single crystal is shown in
Figure 13, the energies of the vibration modes are gathered in
Table 10. The
ν(NH
3) stretching vibrations can be observed as one intense, broadened signal at 3231 cm
−1. The broadening of this signal arises probably as an overlap of multiple signals combined with the presence of multiple hydrogen bonds differing in their strength and thus, shifted to different wavenumbers. The energy of the signal maximum presents quite similar to stretching vibrations observed in [In(NH
3)
5Cl]Cl
2, [In(NH
3)
6]I
3 ∙ NH
3, InAlF
6(NH
3)
2, and [In(NH
3)
6][AlF
6] [
18,
20].
The symmetric and antisymmetric deformation vibration can be observed at higher wavenumbers (
δd(NH
3) = 1684 cm
−1,
δs(NH
3) = 1411 cm
−1) compared to other metal ammine complexes (
δd(NH
3) = 1570–1650 cm
−1,
δs(NH
3) = 1158–1355 cm
−1) and the above discussed indium ammoniates [
41], however they are quite similar to those observed for (NH
4)
2[SiF
6] (compare
Table 10) [
40]. The
ρ(NH
3) rocking vibrations would be expected around 750 cm
−1, but are too low in intensity for a reliable assignment. The Si–F, In–F, and In–N stretching vibrations, as well as the F−Si−F and F–In–F,N deformation modes are found in the range of 156 to 629 cm
−1.


