
New Perspective on Thermally Stimulated Luminescence and Crystallization of Barium Borate Oxyfluoride Glasses

 , , and
Abstract
:1. Introduction
2. Materials and Methods
2.1. Glass Samples Preparation
2.2. Characterization
3. Results
4. Discussion
5. Conclusions
Supplementary Materials
Author Contributions
Funding
Institutional Review Board Statement
Informed Consent Statement
Data Availability Statement
Acknowledgments
Conflicts of Interest
References
- Azorin, J. Preparation methods of thermoluminescent materials for dosimetric applications: An overview. Appl. Radiat. Isot. 2014, 83, 187–191. [Google Scholar] [CrossRef]
- Bos, A.J.J. Thermoluminescence as a Research Tool to Investigate Luminescence Mechanisms. Material 2017, 10, 1357. [Google Scholar] [CrossRef] [PubMed] [Green Version]
- Jain, M.; Kumar, R.; Won, S.O.; Chae, K.H.; Vij, A.; Thakur, A. Manju Defect states and kinetic parameter analysis of ZnAl2O4 nanocrystals by X-ray photoelectron spectroscopy and thermoluminescence. Sci. Rep. 2020, 10, 1–14. [Google Scholar] [CrossRef] [PubMed]
- Murthy, K. Thermoluminescence and its Applications: A Review. Defect Diffus. Forum 2013, 347, 35–73. [Google Scholar] [CrossRef]
- Nieto, J.A. Present status and future trends in the development of thermoluminescent materials. Appl. Radiat. Isot. 2016, 117, 135–142. [Google Scholar] [CrossRef] [PubMed]
- Kumar, D.; Rao, S.; Singh, S.P. Structural, optical and thermoluminescence study of Dy3+ ion doped sodium strontium borate glass. J. Non. Cryst. Solids 2017, 464, 51–55. [Google Scholar] [CrossRef]
- Elkholy, M. Thermoluminescence of B2O3–Li2O glass System Doped with MgO. J. Lumin. 2010, 130, 1880–1892. [Google Scholar] [CrossRef]
- Ekdal, E.T.; Ege, A.; Karali, T.; Townsend, P.; Prokić, M. Thermoluminescence studies of thermally treated CaB4O7:Dy. Radiat. Meas. 2010, 45, 764–767. [Google Scholar] [CrossRef]
- Pimentel, N.; Mastelaro, V.; M’Peko, J.-C.; Martin, S.; Rojas, S.; De Souza, J. Structural and electrical characterization of glasses in the Li2O–CaO–B2O3 system. J. Non. Cryst. Solids 2018, 499, 272–277. [Google Scholar] [CrossRef]
- Isokawa, Y.; Hirano, S.; Kawano, N.; Okada, G.; Kawaguchi, N.; Yanagida, T. Dosimetric and scintillation properties of Ce-doped Li3PO4-B2O3 glasses. J. Non. Cryst. Solids 2018, 487, 1–6. [Google Scholar] [CrossRef]
- Chialanza, M.R.; Castiglioni, J.; Fornaro, L. Crystallization as a way for inducing thermoluminescence in a lead borate glass. J. Mater. Sci. 2012, 47, 2339–2344. [Google Scholar] [CrossRef]
- Tikhomirov, V.; Rodríguez, V.; Méndez-Ramos, J.; Del-Castillo, J.; Kirilenko, D.; Van Tendeloo, G.; Moshchalkov, V. Optimizing Er/Yb ratio and content in Er–Yb co-doped glass-ceramics for enhancement of the up- and down-conversion luminescence. Sol. Energy Mater. Sol. Cells 2012, 100, 209–215. [Google Scholar] [CrossRef]
- Fedorov, P.; Luginina, A.; Popov, A. Transparent oxyfluoride glass ceramics. J. Fluor. Chem. 2015, 172, 22–50. [Google Scholar] [CrossRef]
- Martin, A.D.P.; Durán, A.; Pascual, M.J. Nanocrystallisation in oxyfluoride systems: Mechanisms of crystallisation and photonic properties. Int. Mater. Rev. 2012, 57, 165–186. [Google Scholar] [CrossRef]
- Bocker, C.; Avramov, I.; Rüssel, C. Viscosity and diffusion of barium and fluoride in Na2O/K2O/Al2O3/SiO2/BaF2 glasses. Chem. Phys. 2010, 369, 96–100. [Google Scholar] [CrossRef]
- Martin, A.D.P.; Méndez-Ramos, J.; Del-Castillo, J.; Durán, A.; Rodríguez, V.; Pascual, M. Crystallization and up-conversion luminescence properties of Er3+/Yb3+-doped NaYF4-based nano-glass-ceramics. J. Eur. Ceram. Soc. 2015, 35, 1831–1840. [Google Scholar] [CrossRef]
- Pisarski, W.A.; Pisarska, J.; Dorosz, D.; Dorosz, J. Rare earths in lead-free oxyfluoride germanate glasses. Spectrochim. Acta Part A Mol. Biomol. Spectrosc. 2015, 134, 587–591. [Google Scholar] [CrossRef]
- Ledemi, Y.; El Amraoui, M.; Ferrari, J.L.; Fortin, P.-L.; Ribeiro, S.; Messaddeq, Y. Infrared to Visible Up-Conversion Emission in Er3+/Yb3+ Codoped Fluoro-Phosphate Glass-Ceramics. J. Am. Ceram. Soc. 2013, 96, 825–832. [Google Scholar] [CrossRef]
- Pisarski, W.A.; Pisarska, J.; Mączka, M.; Lisiecki, R.; Goryczka, T.; Dominiak-Dzik, G.; Ryba-Romanowski, W. Rare earth-doped lead borate glasses and transparent glass–ceramics: Structure–property relationship. Spectrochim. Acta Part. A Mol. Biomol. Spectrosc. 2011, 79, 696–700. [Google Scholar] [CrossRef]
- Shinozaki, K.; Konaka, R.; Akai, T. Synthesis of new transparent borate-based BaF2 nanocrystallized glass by formation of nucleation sites induced by rare earth ions. J. Eur. Ceram. Soc. 2019, 39, 1735–1739. [Google Scholar] [CrossRef]
- Chialanza, M.R.; Keuchkerian, R.; Cárdenas, A.; Olivera, A.; Vazquez, S.; Faccio, R.; Castiglioni, J.; Schneider, J.; Fornaro, L. Correlation between structure, crystallization and thermally stimulated luminescence response of some borate glass and glass-ceramics. J. Non. Cryst. Solids 2015, 427, 191–198. [Google Scholar] [CrossRef]
- Kissinger, H.E. Variation of peak temperature with heating rate in differential thermal analysis. J. Res. Natl. Inst. Stand. Technol. 1956, 57, 217. [Google Scholar] [CrossRef]
- Koga, N.; Sestak, J. Crystal Nucleation and Growth in Lithium Diborate Glass by Thermal Analysis. J. Am. Ceram. Soc. 2004, 83, 1753–1760. [Google Scholar] [CrossRef]
- Gražulis, S.; Chateigner, D.; Downs, R.T.; Yokochi, A.; Quirós, M.; Lutterotti, L.; Manakova, E.; Butkus, J.; Moeck, P.; Le Bail, A. Crystallography Open Database—An open-access collection of crystal structures. J. Appl. Crystallogr. 2009, 42, 726–729. [Google Scholar] [CrossRef] [PubMed]
- Chialanza, M.R.; Azcune, G.; Pereira, H.B.; Gasparotto, G.; De Santana, R.C.; Maia, L.J.Q.; Carvalho, J.F. Continuous trap distribution and variation of optical properties with concentration in oxi-fluoroborate glass doped with Nd3+. J. Non. Cryst. Solids 2021, 559, 120683. [Google Scholar] [CrossRef]
- Chen, R.; McKeever, S.W.S. Theory of Thermoluminescence and Related Phenomena; World Scientific: Singapore, 1997. [Google Scholar]
- McKeever, S.W.S. Thermoluminescence of Solids; Cambridge University Press: Cambridge, UK, 1985. [Google Scholar]
- Pisarski, W.A.; Pisarska, J.; Ryba-Romanowski, W. Structural role of rare earth ions in lead borate glasses evidenced by infrared spectroscopy: BO3↔BO4 conversion. J. Mol. Struct. 2005, 744–747, 515–520. [Google Scholar] [CrossRef]
- Yiannopoulos, Y.D.; Chryssikos, G.D.; Kamitsos, E.I. Structure and properties of alkaline earth borate glasses. Phys. Chem. Glas. 2001, 42, 164–172. Available online: http://www.ingentaconnect.com/content/sgt/pcg/2001/00000042/00000003/4203164 (accessed on 30 April 2021).
- Kamitsos, E.I.; Patsis, A.; Chryssikos, G.D. Infrared reflectance investigation of alkali diborate glasses. J. Non. Cryst. Solids 1993, 152, 246–257. [Google Scholar] [CrossRef]
- Bos, A. Theory of thermoluminescence. Radiat. Meas. 2006, 41, S45–S56. [Google Scholar] [CrossRef]
- Pagonis, V.; Kitis, G.; Furetta, C. Numerical and Practical Exercises in Thermoluminescence; Springer: New York, NY, USA, 2006. [Google Scholar]
- McKeever, S.W.S. On the analysis of complex thermoluminescence. Glow-curves: Resolution into individual peaks. Phys. Status Solidi 1980, 62, 331–340. [Google Scholar] [CrossRef]
- Block, S.; Perloff, A. The crystal structure of barium tetraborate, BaO·2B2O3. Acta Crystallogr. 1965, 19, 297–300. [Google Scholar] [CrossRef]
- Pernice, P.; Esposito, S.; Aronne, A.; Sigaev, V.N. Structure and crystallization behavior of glasses in the BaO–B2O3–Al2O3 system. J. Non. Cryst. Solids 1999, 258, 1–10. [Google Scholar] [CrossRef]
- Block, S.; Perloff, A.; Weir, C.E. The crystallography of some M2+ borates. Acta Crystallogr. 1964, 17, 314–315. [Google Scholar] [CrossRef]
- Wright, A.C. Borate structures: Crystalline and vitreous. Phys. Chem. Glas. Eur. J. Glas. Sci. Technol. Part B 2010, 51, 1–39. Available online: http://www.ingentaconnect.com/content/sgt/pcg/2010/00000051/00000001/art00001 (accessed on 30 April 2021).
- Kamitsos, E.I.; Patsis, A.; Karakassides, M.; Chryssikos, G.D. Infrared reflectance spectra of lithium borate glasses. J. Non. Cryst. Solids 1990, 126, 52–67. [Google Scholar] [CrossRef]
- El-Egili, K.; Doweidar, H.; Ramadan, R.; Altawaf, A. Role of F− ions in the structure and properties of BaF2B2O3 glasses. J. Non. Cryst. Solids 2016, 449, 83–93. [Google Scholar] [CrossRef]
- Kamitsos, E.I.; Karakassides, M.A. A spectroscopic study of fluoride containing sodium borate glasses. Solid State Ion. 1988, 28–30, 783–787. [Google Scholar] [CrossRef]
- Fan, H.; Hu, L.; Yang, K.; Fang, Y. Role of F− ions in the structure and properties of BaF2-B2O3 glasses. J. Non. Cryst. Solids 2010, 356, 1814–1818. [Google Scholar] [CrossRef]
- Maya, L. Crystalline Compounds and Glasses in the System B2O3-NaF-NaBF4. J. Am. Ceram. Soc. 1977, 60, 323–328. [Google Scholar] [CrossRef]
- Doweidar, H.; El-Damrawi, G.; Abdelghany, M. Structure and properties of CaF2–B2O3 glasses. J. Mater. Sci. 2012, 47, 4028–4035. [Google Scholar] [CrossRef]
- Doweidar, H.; El-Egili, K.; Altawaf, A. Structural units and properties of BaF2–PbF2–B2O3 glasses. J. Non. Cryst. Solids 2017, 464, 73–80. [Google Scholar] [CrossRef]
- Chialanza, M.R.; Schneider, J.F.; Keuchkerian, R.; Romero, M.; Faccio, R.; Olivera, A.; Pereira, H.B. Structural analysis of oxyfluoride borate glass and BaF2 crystallization from phase separation. J. Am. Ceram. Soc. 2020, 103, 3126–3137. [Google Scholar] [CrossRef]
- Meera, B.; Ramakrishna, J. Raman spectral studies of borate glasses. J. Non. Cryst. Solids 1993, 159, 1–21. [Google Scholar] [CrossRef]
- Osipov, A.A.; Osipova, L.M. Raman scattering study of barium borate glasses and melts. J. Phys. Chem. Solids 2013, 74, 971–978. [Google Scholar] [CrossRef]
- Babushkina, O.; Voyiatzis, G.; Østvold, T.; Pakkanen, T.A.; Ahlgrén, M.; Pursiainen, J.; Wang, H.-G.; Yao, X.-K.; Tuchagues, J.-P.; Ogren, M. Raman and Infrared Spectroscopic Studies of (NaF–KF)–K2MoO4–B2O3 Melts and the Mechanism of Electrodeposition of Molybdenum. Acta Chem. Scand. 1999, 53, 320–328. [Google Scholar] [CrossRef] [Green Version]
- Shartsis, L.; Shermer, H.F. Surface Tension, Density, Viscosity, and Electrical Resistivity of Molten Binary Al kaline-Earth Borates. J. Am. Ceram. Soc. 1954, 37, 545. [Google Scholar] [CrossRef]
- Bergeron, C.G. Crystal growth kinetics in binary borate melts. In Materials Science Research; Pye, L.D., Fréchette, V.D., Kreidl, N.J., Eds.; Plenum Press: New York, NY, USA, 1978; Volume 12, pp. 445–462. [Google Scholar]
- Doweidar, H.; El-Damrawi, G.; Moustafa, Y.; Ramadan, R. Density of mixed alkali borate glasses: A structural analysis. Phys. B Condens. Matter 2005, 362, 123–132. [Google Scholar] [CrossRef]
- Karki, A.; Feller, S.; Lim, H.P.; Stark, J.; Sanchez, C.; Shibata, M. The density of sodium-borate glasses related to atomic arrangements. J. Non. Cryst. Solids 1987, 92, 11–19. [Google Scholar] [CrossRef]
- Ravangvong, S.; Chanthima, N.; Rajaramakrishna, R.; Kim, H.; Kaewkhao, J. Effect of sodium oxide and sodium fluoride in gadolinium phosphate glasses doped with Eu2O3 content. J. Lumin. 2020, 219, 116950. [Google Scholar] [CrossRef]
- Polyakova, I.G.; Pevzner, B.Z. Crystallization of barium diborate glass. Glas. Phys. Chem. 2005, 31, 138–144. [Google Scholar] [CrossRef]
- Fokin, V.M.; Cabral, A.; Reis, R.M.; Nascimento, M.L.; Zanotto, E.D. Critical assessment of DTA–DSC methods for the study of nucleation kinetics in glasses. J. Non. Cryst. Solids 2010, 356, 358–367. [Google Scholar] [CrossRef] [Green Version]
- Chang, C.-R.; Jean, J.-H. Crystallization Kinetics and Mechanism of CaO–B2O3–SiO2 Glass-Ceramics. J. Am. Ceram. Soc. 1999, 82, 1725–1732. [Google Scholar] [CrossRef]
- Chialanza, M.R.; Keuchkerian, R.; Gonçalves, T.S.; De Camargo, A.S.; Fornaro, L. The effect of cation modifier on improving the luminescent properties of borate glasses doped with Yb3+ and Er3+. J. Non. Cryst. Solids 2018, 483, 79–85. [Google Scholar] [CrossRef]
- Yinnon, H.; Uhlmann, D. Applications of thermoanalytical techniques to the study of crystallization kinetics in glass-forming liquids, part I: Theory. J. Non. Cryst. Solids 1983, 54, 253–275. [Google Scholar] [CrossRef]
- Vyazovkin, S.; Burnham, A.K.; Criado, J.M.; Perez-Maqueda, L.A.; Popescu, C.; Sbirrazzuoli, N. ICTAC Kinetics Committee recommendations for performing kinetic computations on thermal analysis data. Thermochim. Acta 2011, 520, 1–19. [Google Scholar] [CrossRef]
- Bocker, C.; Wiemert, J.; Rüssel, C. The effect of viscosity on nanocrystallization of strontium fluoride from a silicate glass. Solid State Sci. 2014, 30, 55–60. [Google Scholar] [CrossRef]
- Hoell, A.; Raghuwanshi, V.S.; Bocker, C.; Herrmann, A.; Rüssel, C.; Höche, T. Crystallization of BaF2 from droplets of phase separated glass–evidence of a core–shell structure by ASAXS. Cryst. Eng. Comm. 2020, 22, 5031–5039. [Google Scholar] [CrossRef]
- Roth, M.; Perlov, D. Growth of barium borate crystals from sodium fluoride solutions. J. Cryst. Growth 1996, 169, 734–740. [Google Scholar] [CrossRef]
- Sung, Y.-M. Crystallization kinetics of fluoride nanocrystals in oxyfluoride glasses. J. Non. Cryst. Solids 2012, 358, 36–39. [Google Scholar] [CrossRef]
- Karmakar, P.; Subudhi, A.K.; Biswas, K.; Annapurna, K. Crystallization kinetics analysis of BaF2 and BaGdF5 nanocrystals precipitated from oxyfluoride glass systems: A comparative study. Thermochim. Acta 2015, 610, 1–9. [Google Scholar] [CrossRef]
- John, A. Dean. In Lange’s Handbook of Chemistry, 16th ed.; McGraw Hill Education: New York, NY, USA, 2017. [Google Scholar]
- Yazici, A.N.; Dogan, M.; Kafadar, V.E.; Toktamiş, H. Thermoluminescence of undoped and Ce-doped BaB4O7. Nucl. Instrum. Methods Phys. Res. Sect. B Beam Interact. Mater. At. 2006, 246, 402–408. [Google Scholar] [CrossRef]
- Sakurai, T.; Shoji, K.; Itoh, K.; Gartia, R.K. Origin of the exponential distribution of traps in glass. J. Appl. Phys. 2001, 89, 2208–2212. [Google Scholar] [CrossRef]
- Pontuschka, W.M.; Kanashiro, L.S.; Courrol, L. Luminescence Mechanisms for Borate Glasses: The Role of Local Structural Units. Glas. Phys. Chem. 2001, 27, 37–47. [Google Scholar] [CrossRef]


| NaF (%) | μ | Ea IR ± 0.02 (Max Value) | Ea SO ± 0.02 (Max Value) | R2 | FOM (%) |
|---|---|---|---|---|---|
| 0 | 0.61 | 0.28 | 0.47 | 0.9898 | 5.5 |
| 5 | 0.58 | 0.30 | 0.52 | 0.9960 | 3.8 |
| 10 | 0.57 | 0.29 | 0.54 | 0.9970 | 3.4 |
| 15 | 0.57 | 0.28 | 0.57 | 0.9980 | 3.1 |
| 20 | 0.57 | 0.32 | 0.58 | 0.9980 | 3.4 |
| 25 | 0.57 | 0.33 | 0.60 | 0.9982 | 3.3 |
| 30 | 0.56 | 0.31 | 0.62 | 0.9986 | 2.9 |
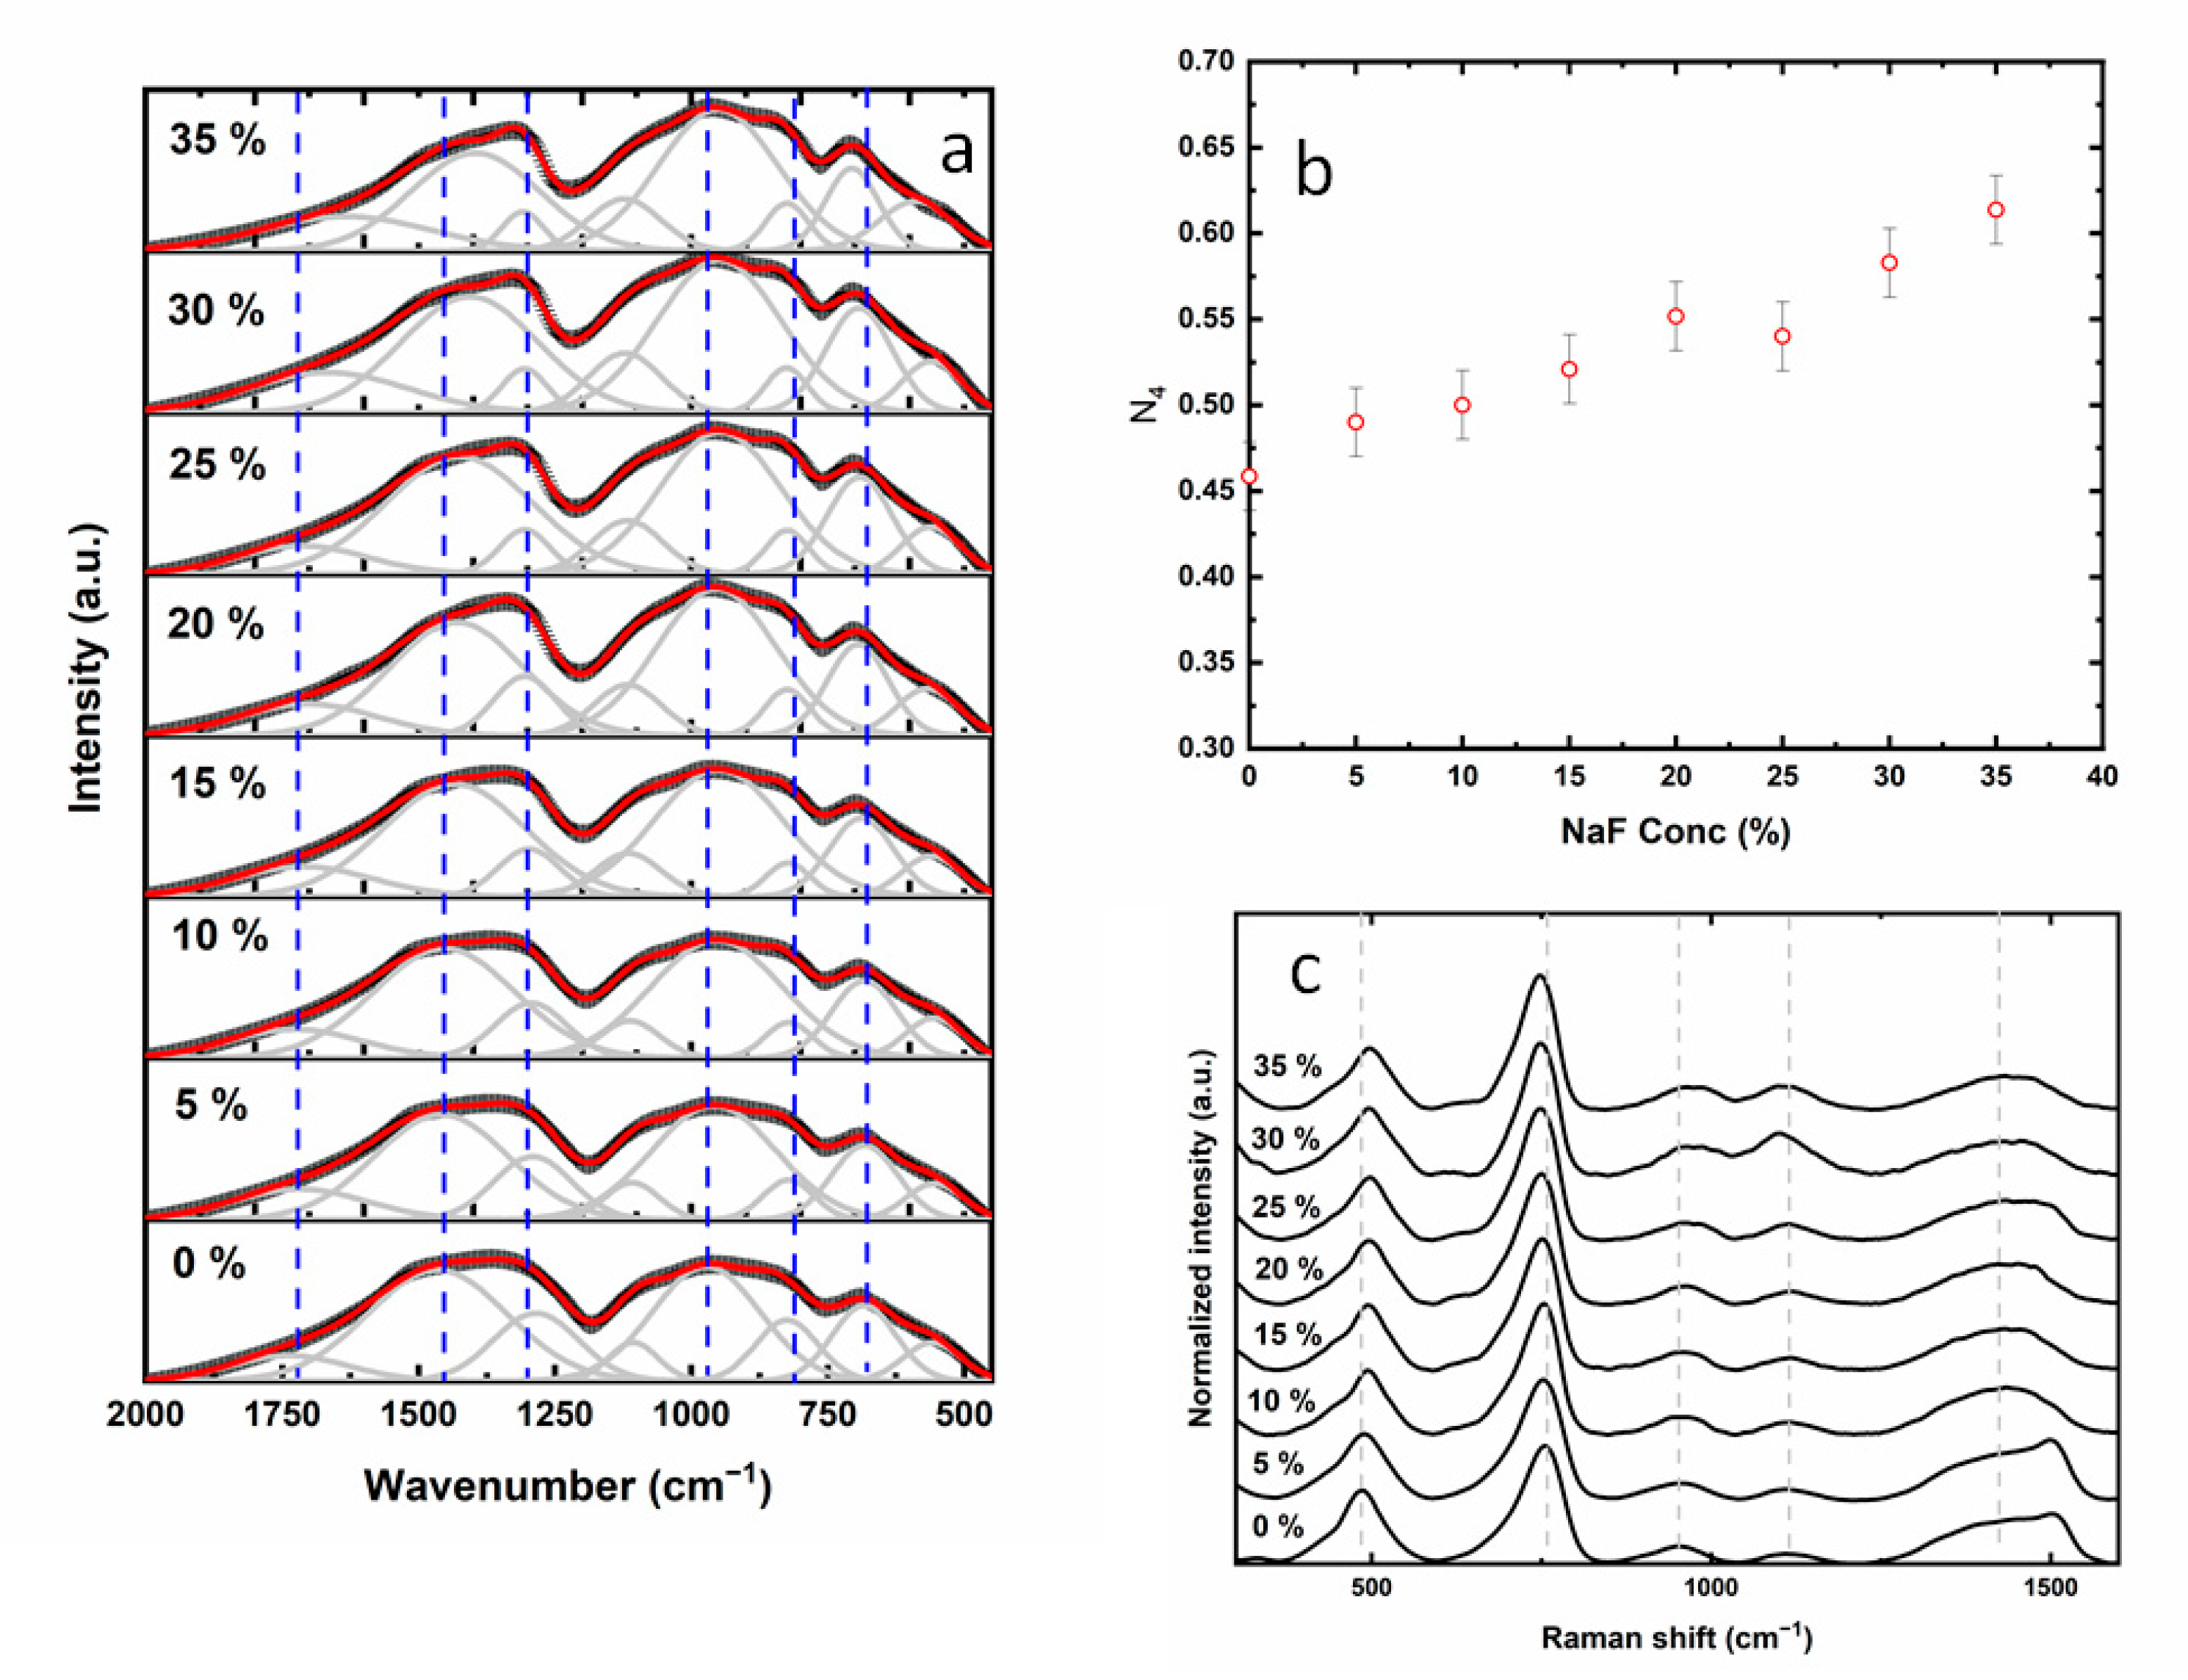
| Frequency Bands (cm−1) | Bands Assignment | References |
|---|---|---|
| 589 | B–O–B bending vibration in the borate network | [29] |
| 683 | pentaborate group | [38] |
| 825 | B–O stretching vibration in BO3 species | [29] |
| 950 | diborate group | [38] |
| 1080 | BO3 species/[BO3F]− | [42] |
| 1125 | pentaborate group | [38] |
| 1395–1452 | B–O stretching vibration in BO4 species | [29] |
Publisher’s Note: MDPI stays neutral with regard to jurisdictional claims in published maps and institutional affiliations. |
© 2021 by the authors. Licensee MDPI, Basel, Switzerland. This article is an open access article distributed under the terms and conditions of the Creative Commons Attribution (CC BY) license (https://creativecommons.org/licenses/by/4.0/).
Share and Cite
Rodríguez Chialanza, M.; Azcune, G.; Bentos Pereira, H.; Faccio, R. New Perspective on Thermally Stimulated Luminescence and Crystallization of Barium Borate Oxyfluoride Glasses. Crystals 2021, 11, 745. https://doi.org/10.3390/cryst11070745
Rodríguez Chialanza M, Azcune G, Bentos Pereira H, Faccio R. New Perspective on Thermally Stimulated Luminescence and Crystallization of Barium Borate Oxyfluoride Glasses. Crystals. 2021; 11(7):745. https://doi.org/10.3390/cryst11070745
Chicago/Turabian StyleRodríguez Chialanza, Mauricio, Germán Azcune, Heinkel Bentos Pereira, and Ricardo Faccio. 2021. "New Perspective on Thermally Stimulated Luminescence and Crystallization of Barium Borate Oxyfluoride Glasses" Crystals 11, no. 7: 745. https://doi.org/10.3390/cryst11070745