Article

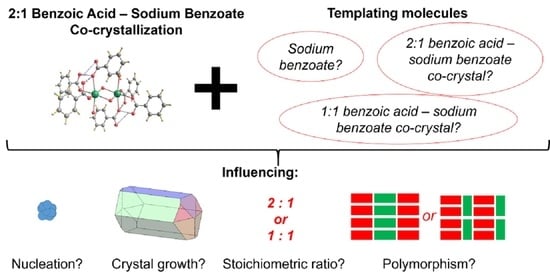
Co-Crystallization Kinetics of 2:1 Benzoic Acid–Sodium Benzoate Co-Crystal: The Effect of Templating Molecules in a Solution

Department of Chemical and Materials Engineering, National Central University, 300 Zhongda Road, Zhongli District, Taoyuan City 32001, Taiwan
*
Author to whom correspondence should be addressed.
Crystals 2021, 11(7), 812; https://doi.org/10.3390/cryst11070812
Submission received: 15 June 2021 / Revised: 29 June 2021 / Accepted: 11 July 2021 / Published: 12 July 2021
(This article belongs to the Special Issue Pharmaceutical Crystallization)

Abstract

:
The addition of dissolved templating molecules in crystallization will create “supramolecular assemblies” within the solution, serving as “anchor points” for the solute molecules to nucleate and grow. In this work, nucleation and crystal growth kinetics of 2:1 benzoic acid (HBz)–sodium benzoate (NaBz) co-crystallization with or without templates in a solution were analyzed by monitoring the concentration of the mother liquor during cooling crystallization. The results showed that the addition of the dissolved 2:1 or 1:1 HBz–NaBz co-crystals as templating molecules could reduce the critical free energy barrier of 2:1 HBz–NaBz co-crystal during its nucleation, but did not significantly affect the order of crystal growth rate. On the other hand, the critical free energy barrier of the nucleation process was increased if dissolved NaBz was used as a templating molecule, while a significant rise in the order of crystal growth rate occurred. The crystal habit obtained from the NaBz-templated system was needle-like, suggesting that sodium–sodium coordination chains of NaBz supramolecular assemblies in the solution phase were responsible for creating elongated crystals. Conversely, a large prismatic crystal habit found in non-templated and 2:1 and 1:1 HBz–NaBz co-crystal-templated systems implied that those templating molecules formed sparsely interconnected supramolecular assemblies in the solution phase.

Graphical Abstract

1. Introduction

Co-crystallization is one of the available techniques to alter the physicochemical properties of a molecule, where a molecule is paired with a suitable non-volatile molecule called co-former. These molecules are paired with each other in a stoichiometric ratio and form a crystal with distinct lattice parameters, differing it with solid solution. This pairing is facilitated by intermolecular hydrogen bonds, π–π interaction, halogen bonds, and Van der Waals forces, without any proton transfer, an important feature distinguishing it with salt formation reaction [1]. Co-crystallization is a feasible approach to tune the physicochemical properties of a substance, especially for a molecule that lacks easily ionizable functional groups or sensitive to acid and base treatment. Co-crystallization is an important technique in altering the materials properties of numerous active pharmaceutical ingredients, for example, acetaminophen–theophylline co-crystal [2], sulfathiazole–sulfanilamide co-crystal [3,4], sulfathiazole–theophylline co-crystal [3,4], nitrofurantoin–p-aminobenzoic acid co-crystal [5], ezetimibe–methyl paraben co-crystal [6], and benzoic acid–sodium benzoate co-crystal [7,8]. Co-crystallization is also gaining importance outside pharmaceutical field, with some of its applications in reducing the hygroscopicity of fertilizer [9] and improving the stability of an explosive agent [10].
Ensuring consistency is indispensable in large-scale co-crystallization process. The major implication of variabilities is the possibility of inconsistent properties of co-crystals synthesized in separate batches. Taking caffeine–maleic acid co-crystals, for example, the solubility values of the stoichiometric ratios of 2:1 and 1:1 are starkly different [11]. In another study, a co-crystal with a single stoichiometric ratio was very difficult to obtain in a bench-scale stirred tank due to hydrodynamic mixing [12]. This evidence suggests that co-crystallization is highly process dependent.
To ensure a consistent production of co-crystals, understanding the kinetics of nucleation and growth of co-crystallization is necessary. In this study, nucleation and growth kinetics of co-crystals of benzoic acid (HBz) and sodium benzoate (NaBz) were studied. Their chemical structures are depicted in Figure 1. As drug substances, HBz is commonly used for acne treatment, antifungal agent, oral health care, and skin protectant, while NaBz is commonly found in menstrual or diuretic medication [13].
Co-crystallization of HBz and NaBz was interesting to study because HBz and NaBz could form co-crystals in either a 2:1 [7,8,14] or a 1:1 stoichiometric ratio [15]. In addition, 2:1 HBz–NaBz co-crystal has two polymorphs: Form A and Form B [8]. The thermodynamic relationship between those two forms are enantiotropic with the A-to-B solid transition at about 110 °C. Form A is more stable at room temperature [8].
In crystallization, the presence of an additive may help the molecules to adopt a particular intermolecular interaction, promoting crystal nucleation and growth [16]. In extreme cases, additives could even induce a certain metastable form, which is hardly produced without the help of the additives. Sulfonamides have been utilized to dictate pyrazinamide to adopt a supramolecular synthon of sulfonamide–pyrazinamide linked via a N–H···O=C hydrogen bond, promoting the crystallization of γ-form pyrazinamide [17]. In another case, the various headgroups of the self-assembled monolayer of organic thiols deposited on a gold substrate could interact molecularly with sulfathiazole, resulting in the crystallization of various polymorphs [18]. Metacetamol, a molecule structurally similar to acetaminophen, was used as a templating molecule for producing metastable Form II of acetaminophen [19] by affecting the solution-mediated polymorphic transition. Cooling crystallization of acetaminophen in the presence of dissolved oxalic acid and maleic acid as templating molecules produced Form II of acetaminophen [20]. Dissolved templating molecules could form supramolecular assemblies with a packing pattern, more or less similar to the crystalline phase of the molecules [21]. We speculate that these supramolecular assemblies act as “invisible seeds” in a solution, influencing the outcome of a crystallization process.
The aim of this study is to use the templating molecules from dissolved co-crystals to guide the co-crystallization of the HBz–NaBz system, so that its variability of stoichiometric ratio and polymorphism may be overcome. Being an ionic co-crystal, 2:1 HBz–NaBz co-crystal is built on the coordination complexes of three kinds: a sodium atom with another sodium atom, a sodium atom with a carboxylic acid ligand, and a sodium atom with a carboxylate ligand and several hydrogen bonds, as illustrated in Figure 2. There are three hydrogen bonds located at H2···O3, H2···O4, H6A···O4 in Form A, as illustrated in Figure 2a [7]. For Form B, two hydrogen bonds are present: H2···O3 and H5B···O4, as shown in Figure 2b [8]. To our best knowledge, no crystallographic data for 1:1 HBz–NaBz co-crystal have been published. Presumably, crystal packing also consists of sodium coordination complex(es) and hydrogen bond(s).
In our work, the effects of supersaturation and templating molecules in solution towards the nucleation rate, crystal growth rate, stoichiometric ratio, and polymorphism of 2:1 HBz–NaBz co-crystals were studied. Simulating the intermolecular interactions between HBz and NaBz within the co-crystal lattice, templating molecules were originated from dissolved NaBz, 2:1 HBz–NaBz, and 1:1 HBz: NaBz co-crystals in solution. To ensure a homogeneous distribution of HBz and NaBz down to the molecular level, and to avoid pre-existed HBz or NaBz complexes in solution, reaction crystallization rather than re-crystallization of 2:1 HBz–NaBz co-crystal was employed. Therefore, the 2:1 HBz–NaBz co-crystals were produced by reacting three parts of HBz with one part of NaOH, resulting in HBz and NaBz in a 2:1 ratio, followed by cooling crystallization [22]. The scheme of this reaction co-crystallization is depicted in Scheme 1.

2. Theory

Nucleation rate: The time vs. concentration profile in a cooling crystallization process exhibited a Z-shaped curve, also known as a desupersaturation curve, as illustrated in Figure 3. An induction period is defined as the sum of the time required for a supersaturation to reach steady-state distribution of molecular clusters (tr), to undergo primary nucleation (tn), and to grow into nuclei with a detectable size (tg) [23]. This relationship is given as:
τ = t r + t n + t g
Here, tr can be assumed to be zero because of rapid mixing. Primary nucleation time tn dominates over tg because of the relatively long plateau region compared with the shoulder portion near the turning point of the desupersaturation curve [24]. Therefore, the induction period, mainly consisting of primary nucleation can be assumed to be inversely proportional to the rate of primary nucleation per unit volume (J). This relationship can be expressed as:
τ = t n = f N · J 1
where fN is the minimum detectable number density of nuclei per unit volume. For a detectable size of accumulated crystals of about ~10 µm, the fN value is about 7.64 × 10¹¹ nucleus m−3 [25].
According to the classical nucleation theory (CNT), the overall free energy change in homogeneous nucleation, ΔG, is the sum of the surface excess free energy, ΔGS, and the volume excess free energy, ΔGV [23]. For a spherical nucleus, the relationship is given by:
Δ G = Δ G S + Δ G V
Δ G = 4 π r 2 γ + 4 3 π r 3 Δ G v
where r is the radius of the nucleus, γ is the interfacial energy between the crystalline surface and the solution, and ΔGv is the free energy change in the transformation per unit volume.
For the system to form a nucleus, it should pass the critical energy barrier (ΔGcrit), which is equal to dΔG/dr = 0 for a spherical cluster [23]. Therefore, by applying this derivation to Equation (4), critical nucleus size (rcrit) can be obtained as:
r c r i t = 2 γ Δ G v
By substituting Equation (5) into Equation (4), the free energy required to form a critical nucleus size (ΔGcrit) can be obtained as:
Δ G c r i t = 16 π γ 3 3 Δ G v 2 = 4 π r c r i t 2 3
The growth of a non-electrolyte molecular cluster can be expressed by the Gibbs–Thomson relationship as [23]:
ln C 0 C * = ln S 0 = 2 γ v k T r
where υ is the molecular volume (molecular weight/(density × Avogadro’s number)), k is the Boltzmann’s constant, and T is the temperature. The density of 2:1 co-crystal of benzoic acid–sodium benzoate is 1387 kg·m−3, as determined from the single crystal X-ray data of 2:1 co-crystal of benzoic acid–sodium benzoate [8].
According to Equation (5), ΔGv is inversely proportional to the radius of a nucleus, r. By rearranging Equation (7) and substituting with r, ΔGv can be rewritten as:
Δ G v = 2 γ r = k T ln S 0 v
By substituting the ΔGv term in Equation (8) into Equation (6), the free energy required to form a nucleus in a critical size, ΔGcrit, can be expressed as:
Δ G c r i t = 16 π γ 3 v 2 3 k T ln S 0 2
The free energy of forming a critical nucleus, ΔGcrit, bears similarity with the temperature-dependent chemical reaction. Therefore, nucleation rate, J, can be written in the Arrhenius reaction rate equation as:
J = J 0   e x p Δ G c r i t k T
where J0 is a pre-exponential factor. The rate of nucleation can be expressed alternatively by substituting Equation (9) into Equation (10):
J = J 0   e x p 16 π γ 3 v 2 3 k T 3 ln S 0 2
Since the induction period is inversely proportional to the rate of nucleation as described in Equation (2), taking the natural logarithm of Equation (11) and substituting it into Equation (2) would result in:
ln τ = ln t n = ln J 0 f N + 16 π γ 3 v 2 3 k T 3 ln S 0 2
The value of coefficient J0 and γ are calculated from the intercept and slope, respectively, of the linear regression of ln τ vs. ln S 0 2 . τ values used for the regression were obtained from the desupersaturation curve (Figure 3) at the designated S0.
The theoretical number of molecules in the critical nucleus, i*, is expressed as [26]:
i * = 4 π r c r i t 3 3 v
Crystal growth rate: Once nuclei have become larger than the critical radius, they will be stable in the supersaturated solution. They will grow into visible crystals, while reducing the solute concentration in the mother liquor at the same time. This growth phenomenon would end once the concentration reaches the saturation point. The mass of the crystals, mt, at a given time, t, can be written as:
m t = C 0 C t · V s o l u t i o n
where Ct is the concentration at a given time, t, and Vsolution is the volume of the solution.
There are two stages for incorporating the molecules into the crystal lattice: (1) diffusion of solute molecules from the bulk solution to the solid surface and (2) arrangement of the molecules into the crystal lattice. These two stages are difficult to measure individually. Hence, the crystal growth rate is commonly expressed using an “overall” crystal growth rate coefficient [23] as shown in Equation (15).
d m t d t = K G A t C t C * g
where dm/dt is the crystal mass growth rate, KG is the overall crystal growth rate coefficient, At is the crystal surface area at a given time t, Ct is the concentration at any time t, C* is the saturation point of (i.e., solubility value) at 16 °C, and g is the order of crystal growth kinetics. For 2:1 HBz–NaBz co-crystals, the value of C* in 4:1 (v/v) ethanol–water co-solvent at 16 °C was 0.196 kg/L.
Volume and surface area of a single crystal at a given time, Vt,i and At,i, respectively, can be described by relating the characteristic length of the crystal Lt,i with volumetric and surface shape factor α and β, respectively [27]. Both relationships are given in Equations (16) and (17):
V t , i = α ( L t , i ) 3
A t , i = β ( L t , i ) 2
On the other hand, the volume of an individual crystal at a given time, Vt,i, can also be written in terms of its mass, mt,i, and its density, ρc, as written in Equation (18).
V t , i = m t , i ρ c
Substituting Equation (18) into Equation (16) yields a relationship between the characteristic length Lt,i, mass mt,i, and density ρc, as written in Equation (19). Substituting Equation (19) into Equation (17) resulted in Equation (20), relating term At,i with mt,i and ρc.
L t , i = m t , i α ρ c 1 3
A t , i = β m t , i α ρ c 2 3
In the case of all crystals present in the system, the relationship becomes:
A t = A t , i = β m t , i α ρ c 2 3 β m t α ρ c 2 3
At and mt denote the overall surface area of all crystals and total mass of all crystals in the system, respectively. By substituting Equation (21) into Equation (15), Equation (23) can be obtained after rearrangement and the introduction of the term KG. After taking its natural logarithm, Equation (24) can be rewritten as Equation (25).
d m t d t = K G β m t α ρ c 2 3 C t C * g
1 m t 2 3 d m t d t = K G β 1 α ρ c 2 3 C t C * g
1 m t 2 3 d m t d t = K G C t C * g
ln 1 m t 2 3 d m t d t = ln K G + g ln C t C *
The value of coefficient KG and crystal growth order g are obtained by linear regression of ln 1 m t 2 3 d m t d t vs. ln C t C * using Ct values within the growth period of desupersaturation curve (Figure 3) and mt values after calculation by Equation (14).
Nucleation and growth determination by concentration measurement: In studying the nucleation rate, the induction period is an important parameter to obtain. The induction period is commonly determined by visual confirmation of crystal appearance, such as eye [26], focused beam reflectance measurement [28], and turbidimeter [29,30,31]. Another method is by indirectly measuring the concentration change in the solution over time. Solute concentration can be measured by various means, such as density [32], refractive index [33], electrical conductivity [24], and ultrasound [34], resulting in the desupersaturation curve as illustrated in Figure 3. The induction time would then be determined based on the plateau region. In this study, an off-line UV-Vis spectrometer was used as the main tool to measure the concentration of 2:1 HBz–NaBz co-crystal over time. The induction time would also be visually verified by off-line optical microscopy.

3. Results and Discussion

Nucleation kinetics: As predicted, all of the desupersaturation curves for co-crystallization with and without templating molecules exhibited a Z-shaped manner, as shown in Figure 4. All of the curves ended up as a constant flat line at the concentration of about 0.196 kg/L, which was the solubility value, C*, of 2:1 HBz–NaBz co-crystals in the 4:1 (v/v) ethanol–water co-solvent at 16 °C. From these curves, τ was determined by measuring the time period of the plateau regions, as tabulated in Table 1. Both S0 and τ values were converted into their natural logarithmic forms of (ln S0)−2 and ln τ, respectively, yielding linear plots in Figure 5. According to Equation (12), values of γ and J0 can be obtained from the slopes and intercepts, respectively, as tabulated in Table 1. For calculating J0, the fN value of 7.64 × 10¹¹ nucleus m−3 was used [25]. This approximate fN value was considered to be acceptable since particles with sizes of about ~10 µm were detected upon reaching the induction period, based on the OM images in Figures S1–S4. Lastly, ΔGv, ΔGcrit, J, rcrit, and i* were calculated by Equations (8), (9), (10), (5), and (13), respectively. The results are tabulated in Table 2.
As anticipated, supersaturation is inversely proportional to the induction period in both template and non-templated co-crystallization (Table 1). For a given S0, the co-crystallizations with templating molecules had shorter induction periods than the ones without. Correspondingly, the nucleation rate, J, was faster for the templated co-crystallization. The descending order of the nucleation rate was co-crystallization with templating molecules of: (1) 1:1 HBz–NaBz co-crystal, (2) 2:1 HBz–NaBz co-crystal, (3) NaBz, and (4) without templating molecules. Since γ, ΔGv, ΔGcrit, rcrit, and i* parameters are independent from the induction period, the order of these parameters did not follow the nucleation rate order. At a given S0, the co-crystallization system with NaBz templating molecules had the highest γ, ΔGv, ΔGcrit, rcrit, and i* values. The values of those parameters were almost the same for the co-crystallization system without templating molecules, 2:1 HBz–NaBz co-crystal templating molecules, and 1:1 HBz–NaBz co-crystal templating molecules.
Undoubtedly, the nucleation rate of co-crystallization of 2:1 HBz–NaBz co-crystal was enhanced by templating molecules. The effect of these dissolved templates to the system were not just simply for raising the supersaturation, but these template molecules preserved their “memory” from the solid state in the form of supramolecular assemblies in the solution, in a similar fashion as rhenium compounds [21] and aspartic acid in the solution phase [35]. Those supramolecular assemblies aided co-crystallization by acting as anchoring sites for the immediate formation of hydrogen bonds and coordination complexes of a sodium atom with another sodium atom, a sodium atom with a carboxylic acid ligand, and a sodium atom with a carboxylate ligand among HBz and NaBz molecules, which were the backbone of 2:1 HBz–NaBz co-crystals. There are two pieces of evidence for the existence of supramolecular assembly in a solution. Firstly, simply redissolving 2:1 HBz–NaBz co-crystals at S0 = 1.66 followed by cooling to 16 °C resulted in an instant precipitation of 2:1 HBz–NaBz co-crystals (i.e., τ < 60 s), while reaction co-crystallization of HBz with NaOH, as previously described, gave a τ value of 370 s, which was six times slower. The rapid precipitation of 2:1 HBz–NaBz co-crystals after its dissolution was caused by the solid-state “memory effect” of the solutes, unlike the HBz–NaOH reaction co-crystallization solutes, which were freshly formed without any “memory effect” carried over to the solution. Secondly, yellow solution was produced right away upon mixing HBz–NaOH for reaction co-crystallization, whereas a normal clear solution was obtained by dissolving 2:1 HBz–NaBz co-crystals at S0 = 1.66, as shown in the photograph in Figure S5. The appearance of the yellow solution strongly suggested that the supramolecular assembly derived from the reaction co-crystallization of HBz with NaOH was related to the π-stacking and charge transfer between the aromatic rings of HBz and NaBz in a solution. In general, the π-stacking arrangement and charge transfer are responsible for color change co-crystal systems of furosemide-4,4′-bipyridine [36] and emodin with various co-crystal formers [37]. In addition, a similar finding to our case of the yellow solution due to the π-stacking of supramolecular assemblies has been documented in the acetaminophen-maleic acid co-crystal system [20].
In the case of employing the 1:1 HBz–NaBz co-crystal templating molecules, the nucleation rates were significantly faster than any other templating cases at a given S0. In the HBz–NaBz co-crystal system, the requirement for sodium cation coordinations most likely could be satisfied by a 2:1 stoichiometric ratio [7]. Since the single-crystal structure of 1:1 HBz–NaBz co-crystal was unavailable, we speculate that the six-coordination bonds of sodium ions in 1:1 HBz–NaBz co-crystals were not as stable as the ones in the 2:1 ratio. To form a denser and a more stable crystalline structure, carboxylic group-containing HBz molecules would immediately be accepted to stabilize the coordination upon crystallization. The domino effect of rapid packing of the solutes to stabilize the template coordination had ultimately turned the clusters of the molecules into nuclei.
Interestingly, the values of γ, ΔGcrit, rcrit, and i* of the 2:1 HBz–NaBz co-crystallization pointed out that NaBz templating molecules provided a slightly higher energy barrier in the nucleation process than without the templates. The sodium-rich NaBz supramolecular assemblies in the solution were mostly consisting of sodium–sodium and sodium–carboxylate coordination complexes, but without any sodium–carboxylic coordination or carboxylic–carboxylate hydrogen bonding moiety. It would take more efforts for both NaBz supramolecular assemblies and the solutes to rearrange their intermolecular interactions to accommodate both sodium–carboxylic coordination and carboxylic–carboxylate hydrogen bonding moiety, as reflected by the higher interfacial energy γ and critical free energy barrier ΔGcrit, as compared with those from non-templated and co-crystal molecules templated systems. The negligible differences of γ, ΔGcrit, rcrit, and i* values in the cases of non-templated and templated co-crystallization using 2:1 and 1:1 HBz–NaBz co-crystals were because of the similar kinds of intermolecular interactions among the supramolecular assemblies and the solutes.
Growth kinetics: As plotted in Figure 4, all curves underwent a sharp plunge in concentration immediately after the end of the induction period. During this crystal growth period, the critical nuclei started to grow into visible crystals. The crystal growth rate, dmt/dt, at a certain time t was obtained by first converting the growth period of the desupersaturation curves in Figure 4 into the mass vs. time curves by Equation (14), fitting them with polynomials, and finally, taking the derivative of the polynomials with respect to time to obtain dmt/dt. The parameters of crystal growth kinetics were obtained by plotting ln (m−2/3(dmt/dt)) vs. ln (Ct − C*), as in Figure 6, and linearly fitted them according to Equation (25).
The kinetics of crystal growth can be discerned in Table 3 by comparing the growth kinetic order, g, among different S0s and various kinds of templating molecules. The g values were relatively independent from S0, with the average value of 1.2, 1.9, 1.0, and 1.0 for non-templated co-crystallization, templated co-crystallization by NaBz templating molecules, templated co-crystallization by 2:1 HBz–NaBz co-crystal templating molecules, and templated co-crystallization by 1:1 HBz–NaBz co-crystal templating molecules, respectively. Since the intermolecular interaction in the cases of non-templated and 2:1 and 1:1 HBz–NaBz co-crystal-templated systems were the same, the crystal growth would also happen in the same mechanism with each other, as reflected by the similarities in the g values. On the other hand, the g values in the NaBz-templated system was remarkably larger than other cases, meaning that the crystal growth rate happened faster than the other cases. We suspected that the excess coordination chains of sodium with another sodium atom in the NaBz-templated system contributed to the high growth rate order.
Characterizations of 2:1 HBz–NaBz co-crystals: All of the TGA scans of co-crystals synthesized at different S0 values without templating molecules underwent weight losses between 90 to 250 °C, as illustrated in Figure S6, corresponding to the thermal decomposition of HBz [12]. Those weight losses of 59.6–63.1 wt.% were quite close to the theoretical weight loss of 62.9 wt.% (Equation (S1)). In the cases of co-crystallization aided with templating molecules, the TGA scans in Figure S7 also show that the 2:1 HBz–NaBz co-crystals also exhibited weight losses of 61.9–63.1 wt.% between 90 and 250 °C, agreeing with the theoretical calculation of 62.9 wt.% based on Equation (S1).
The 2:1 HBz–NaBz co-crystals generated in all experiments without templating molecules were in the thermodynamically stable form of Form A, despite the variations in the initial degrees of supersaturation, S0, and the templating molecules employed. The PXRD patterns of 2:1 HBz–NaBz co-crystals at different S0 values in Figure S8 exhibited the diffraction characteristic peaks at 2θ = 7.30°, 7.99°, 17.25°, 18.70°, 20.97°, 24.52°, and 27.42°, matching well with the simulated PXRD pattern of 2:1 HBz–NaBz co-crystal Form A [8]. Similarly, the PXRD pattern in Figure S9 shows that Form A 2:1 HBz–NaBz co-crystals were produced at S0 = 1.66 despite different templating molecules being used. From those results, it seemed that the addition of templating molecules in 2:1 HBz–NaBz co-crystallization could only enhance the rate of crystallization kinetics, without affecting either the stoichiometric ratio or the polymorphism of the 2:1 HBz–NaBz co-crystals.
To further examine the templating effect on crystal habit, OM images of co-crystal samples at the end of the crystal growth phase, i.e., reaching the saturation concentration of 0.196 kg/L at 16 °C, were taken, and not later, to minimize the aging effect on crystal habit. The average aspect ratio of length-to-width of the 2:1 HBz–NaBz co-crystal was affected by the templating molecules. The representative OM images and the average aspect ratios of the crystals with and without templating molecules are shown in Figure 7 and Table 4, respectively. Normally, 2:1 HBz–NaBz co-crystals had a prismatic shape, such as the one in Figure 7a with the aspect ratio of about 6.0. Remarkably, the crystal habit was changed into almost a needle shape with NaBz templating molecules, with the aspect ratio of about 9.6 (Figure 7b). Other interesting findings were that the aspect ratios of the co-crystals were reduced to 5.3 and 4.3 with 2:1 and 1:1 HBz–NaBz co-crystal templating molecules, respectively.
The theoretical crystal morphology of 2:1 HBz–NaBz co-crystals is depicted in Figure 8, determined based on Bravais–Friedel–Donnay–Harker (BFDH) theory. According to this theory, the most morphologically important faces are the one with the largest interplanar distance (dhkl). For 2:1 HBz–NaBz co-crystals with monoclinic lattice and 2/m symmetry [8], it was determined that those faces were (011), (002), (–102), (110), and (11–1). Superimposition of these faces onto the co-crystal packing configuration revealed that coordination complexes of sodium with another sodium atom formed elongated “chains” along [100] direction (Figure 8b), while several of these “chains” formed a discrete pattern along [010] and [001] directions (Figure 8c), weakly interconnected possibly by van der Waals forces.
During the co-crystallization with NaBz templating molecules consisting of elongated coordination complexes of sodium with another sodium atom or with a carboxylate ligand [38,39], these chains would serve as the attachment points for HBz and NaBz solutes to nucleate and grow. The generated co-crystals would then prefer to grow along [100] direction (Figure 8b), producing co-crystals with a high aspect ratio. It was also suspected that these elongated coordination complexes of sodium “chains” were the reason behind the high growth order, g, of the NaBz-templated system (Table 3).
On the contrary, the 2:1 and 1:1 HBz–NaBz co-crystal templating molecules formed a higher quantity of discrete supramolecular assemblies, possibly interconnected with weak van der Waals forces. This resulted in the larger amount of “attachment points” for the solute molecules, resulting in crystals with larger size in the [010] and [001] directions (Figure 8c), making the aspect ratio to be smaller. This higher quantity of “attachment points” was also the reason behind the lower interfacial energy γ for co-crystallization with both 2:1 and 1:1 HBz–NaBz co-crystal templating molecules.

4. Conclusions

Kinetics of co-crystallization of 2:1 HBz–NaBz co-crystal by cooling had been conducted by concentration measurements over time, producing Z-shaped desupersaturation curves as the basis in determining nucleation and crystal growth kinetics. The initial degree of supersaturation, S0, was found to be proportional with the nucleation rate. The addition of 4.2 mol% of templating molecules enhanced the nucleation rate of 2:1 HBz–NaBz co-crystallization, regardless of the types of the templating molecules used. However, the addition of sodium-rich NaBz templating molecules could slightly increase the interfacial energy γ, critical free energy ∆Gcrit, critical nucleus radius rcrit, and the number of molecules in the critical nucleus i* due to the rearrangement of the coordination complexes of sodium with another sodium atom and carboxylate ligand within the supramolecular assemblies of the template to accommodate both sodium–carboxylic coordination and carboxylic–carboxylate hydrogen bonding moiety. On the other hand, the differences in those thermodynamic parameters among a non-templated system and 2:1 and 1:1 HBz–NaBz co-crystal templating molecules were negligible because the intermolecular interactions of the supramolecular assemblies of the template and the solute molecules were similar with each other.
Generally, the order of the crystal growth kinetics of 2:1 HBz–NaBz co-crystals depended on S0 for the non-templated and NaBz-templated co-crystallization. The higher the supersaturation, the higher the order was. Meanwhile, the growth order was independent from S0 for 2:1 and 1:1 HBz–NaBz co-crystal templating molecules. Analysis of the crystal habits and the aspect ratios of the generated 2:1 HBz–NaBz co-crystals revealed that the extensive coordination chain of sodium with another sodium atom within the NaBz supramolecular assemblies in the solution was responsible for creating elongated, almost needle-like crystals. In contrast, co-crystals with lower aspect ratios were generated in the presence of 2:1 and 1:1 HBz–NaBz co-crystal templating molecules. The lower aspect ratio was produced because the templating molecules formed sparsely interconnected supramolecular assemblies in the solution, creating many “anchor points” for the solutes, generating less-elongated crystals.
We believed that this work would spark the conversation about the existence of supramolecular assemblies in the solution phase. The history of the solution would greatly impact our understanding in various solution-based processes, such as mixing, crystallization, and dissolution. In the future, a decisive research work to directly observe, measure, and predict the “supramolecular assemblies” in various systems is much needed.

Supplementary Materials

These following Supplementary Materials are available online, free of charge at https://www.mdpi.com/article/10.3390/cryst11070812/s1. Materials and Methods, Figure S1: OM images of crystallization of 2:1 HBz–NaBz co-crystals without templating molecules at the initial degree of supersaturation (S0) of: (a) 1.66, (b) 1.54, (c) 1.48, and (d) 1.43, Figure S2: OM images of crystallization of 2:1 HBz–NaBz co-crystals with NaBz templating molecules at the initial degree of supersaturation (S0) of: (a) 1.66, (b) 1.54, (c) 1.48, and (d) 1.43, Figure S3: OM images of crystallization of 2:1 HBz–NaBz co-crystals with 2:1 HBz–NaBz co-crystal templating molecules at the initial degree of supersaturation (S0) of: (a) 1.66, (b) 1.54, (c) 1.48, and (d) 1.43, Figure S4: OM images of crystallization of 2:1 HBz–NaBz co-crystals with 1:1 HBz–NaBz co-crystal templating molecules at the initial degree of supersaturation (S0) of: (a) 1.66, (b) 1.54, (c) 1.48, and (d) 1.43, Figure S5: Photo image of (a) clear solution obtained by dissolving 2:1 HBz-NaBz co-crystals in 4:1 (v/v) ethanol-water co-solvent, and (b) yellow solution derived by reaction co-crystallization of HBz and NaOH in 4:1 (v/v) ethanol-water co-solvent, Figure S6: TGA scans of 2:1 HBz-NaBz co-crystals generated without templating molecules at different initial degrees of supersaturation: (a) S0 = 1.66; (b) S0 = 1.54; (c) S0 = 1.48; and (d) S0 = 1.43, Figure S7: TGA scans of 2:1 HBz-NaBz co-crystals generated at S0 = 1.66: (a) without templating molecules, (b) with dissolved NaBz templating molecules, (c) with dissolved 2:1 HBz-NaBz co-crystal templating molecules, (d) with dissolved 1:1 HBz-NaBz co-crystal templating molecules, Figure S8: PXRD patterns of 2:1 HBz-NaBz co-crystals generated without templating molecules from (a) S0 = 1.66, (b) S0 = 1.54, (c) S0 = 1.48, and (d) S0 = 1.43, and (e) simulated PXRD patterns of 2:1 HBz-NaBz Form A co-crystal (CCDC No. 875040), Figure S9: PXRD patterns of 2:1 HBz-NaBz co-crystals generated at S0 = 1.66: (a) without templating molecules, (b) with dissolved NaBz templating molecules, (c) with dissolved 2:1 HBz-NaBz co-crystal templating molecules, and (d) with dissolved 1:1 HBz-NaBz co-crystal templating molecules, and (e) simulated PXRD pattern of 2:1 HBz-NaBz Form A co-crystal (CCDC No. 875040), Table S1: List of the theoretical amounts of produced 2:1 HBz-NaBz co-crystals and the amounts of HBz in Solution A and NaOH in Solution B required at different S0 values and Table S2: Amounts of templating molecules added into Solution A for the co-crystallization of 2:1 HBz-NaBz co-crystals.

Author Contributions

Conceptualization, T.L.; methodology, F.Z.L. and T.L.; software, D.E.P.; validation, F.Z.L. and D.E.P.; formal analysis, F.Z.L. and D.E.P.; investigation, F.Z.L.; resources, T.L.; data curation, F.Z.L., D.E.P., and T.L.; writing—original draft preparation, F.Z.L.; writing—review and editing, D.E.P. and T.L.; visualization, D.E.P.; supervision, T.L.; project administration, T.L.; funding acquisition, T.L. All authors have read and agreed to the published version of the manuscript.

Funding

This work was supported by the Ministry of Science and Technology of Taiwan, R.O.C. under grant number of 104-2221-E-008-070-MY3, 107-2221-E-008-037-MY3, and 110-2221-E-008-006-MY3.

Data Availability Statement

Not applicable.

Acknowledgments

We are greatly indebted to the Precious Instruments Utilization Center of National Central University, especially to Li-Fan Chen for the assistance in TGA and Chin-Chuan Huang for the assistance in PXRD.

Conflicts of Interest

The authors declare no conflict of interest.

List of Nomenclatures

SymbolDescriptionUnit
AtOverall crystal surface area at a given timem2
At,iSurface area of an individual crystal at a given timem2
C0Initial concentration of 2:1 HBz–NaBz co-crystalkg L−1
CtConcentration of 2:1 HBz–NaBz co-crystal at a given timekg L−1
C*Solubility value of 2:1 HBz–NaBz co-crystalkg L−1
dmt/dtCrystal mass growth rate kg s−1
fNMinimum detectable number of nuclei per unit volumem−3
gOrder of crystal growth kineticsdimensionless
i*Theoretical number of molecules in the critical nucleusdimensionless
JRate of primary nucleations−1 m−3
J0Pre-exponential factor of nucleation rate equations−1 m−3
KGOverall crystal growth rate coefficientkg m−2 s−1
KGModified overall crystal growth rate coefficientkg1/3 s−1
kBoltzmann’s constant, 1.38065 × 10⁻²³m2 kg s−2 K−1
Lt,iCharacteristic length of a single crystal at a given timem
mtOverall crystal masskg
mt,iMass of an individual crystal at a given timekg
rRadius of a nucleusm
rcritCritical nucleus sizem
S0Initial degree of supersaturationdimensionless
TTemperatureK
tgTime required for nuclei to grow into a detectable sizes
tnTime required for for the solutes to undergo primary nucleations
trTime required for a supersaturation to reach steady-state distribution of molecular clusterss
VsolutionVolume of solutionm3
Vt,iVolume of an individual crystal at a given timem3
υMolecular volumem3
αVolumetric shape factor dimensionless
βSurface shape factordimensionless
γInterfacial energy between the surface and solutionJ m−2
ΔGOverall free energy change in homogeneous nucleationJ
∆GcritCritical free energy required to form a critical nucleus sizeJ
ΔGSExcess free energy between the surface and bulk solid of a particleJ
ΔGVExcess free energy between bulk solid and solute in solution phaseJ
∆GvFree energy change in the transformation per unit volumeJ m−3
ρcDensity of crystalkg m−3
τInduction periods

References

  1. Berry, D.J.; Steed, J. Pharmaceutical cocrystals, salts and multicomponent systems; intermolecular interactions and property based design. Adv. Drug Deliv. Rev. 2017, 117, 3–24. [Google Scholar] [CrossRef] [Green Version]
  2. Mukaida, M.; Sato, H.; Sugano, K.; Terada, K. Stability Orders of Acetaminophen and Theophylline Co-crystals Determined by Co-crystal Former Exchange Reactions and Their Correlation with In Silico and Thermal Parameters. J. Pharm. Sci. 2017, 106, 258–263. [Google Scholar] [CrossRef] [PubMed] [Green Version]
  3. Shefter, E.; Sackman, P. Structural Studies on Molecular Complexes V: Crystal Structures of Sulfathiazole—Sulfanilamide and Sulfathiazole—Theophylline Complexes. J. Pharm. Sci. 1971, 60, 282–286. [Google Scholar] [CrossRef] [PubMed]
  4. Yeh, K.L.; Lee, T. Intensified Crystallization Processes for 1:1 Drug–Drug Cocrystals of Sulfathiazole–Theophylline, and Sulfathiazole–Sulfanilamide. Cryst. Growth Des. 2018, 18, 1339–1349. [Google Scholar] [CrossRef]
  5. Cherukuvada, S.; Babu, N.J.; Nangia, A. Nitrofurantoin– p -aminobenzoic acid cocrystal: Hydration stability and dissolution rate studies. J. Pharm. Sci. 2011, 100, 3233–3244. [Google Scholar] [CrossRef]
  6. Sugandha, K.; Kaity, S.; Mukherjee, S.; Isaac, J.; Ghosh, A. Solubility Enhancement of Ezetimibe by a Cocrystal Engineering Technique. Cryst. Growth Des. 2014, 14, 4475–4486. [Google Scholar] [CrossRef]
  7. Butterhof, C.; Milius, W.; Breu, J. Co-crystallisation of benzoic acid with sodium benzoate: The significance of stoichiometry. CrystEngComm 2012, 14, 3945. [Google Scholar] [CrossRef]
  8. Butterhof, C.; Bärwinkel, K.; Senker, J.; Breu, J. Polymorphism in co-crystals: A metastable form of the ionic co-crystal 2 HBz·1 NaBz crystallised by flash evaporation. CrystEngComm 2012, 14, 6744. [Google Scholar] [CrossRef]
  9. Sandhu, B.; Sinha, A.S.; Desper, J.; Aakeröy, C.B. Modulating the physical properties of solid forms of urea using co-crystallization technology. Chem. Commun. 2018, 54, 4657–4660. [Google Scholar] [CrossRef]
  10. Lee, T.; Chen, J.W.; Lee, H.L.; Lin, T.Y.; Tsai, Y.C.; Cheng, S.-L.; Lee, S.-W.; Hu, J.-C.; Chen, L.-T. Stabilization and spheroidization of ammonium nitrate: Co-crystallization with crown ethers and spherical crystallization by solvent screening. Chem. Eng. J. 2013, 225, 809–817. [Google Scholar] [CrossRef]
  11. Li, Z.-H.; Yu, T.; Lee, T.; Kim, W.-S. Cocrystallization of Caffeine–Maleic Acid in a Batchelor Vortex Flow. Cryst. Growth Des. 2020, 20, 1618–1627. [Google Scholar] [CrossRef]
  12. Chen, T.-H.; Yeh, K.L.; Chen, C.W.; Lee, H.L.; Hsu, Y.C.; Lee, T. Mixing Effect on Stoichiometric Diversity in Benzoic Acid–Sodium Benzoate Cocrystals. Cryst. Growth Des. 2019, 19, 1576–1583. [Google Scholar] [CrossRef]
  13. United States Food and Drug Administration OTC Active Ingredient. Available online: https://www.fda.gov/media/75750/download (accessed on 11 June 2021).
  14. Butterhof, C.; Milius, W.; Breu, J. Influence of Cation Size on the Co-crystallisation of Benzoic Acid with Different Benzoates. Z. Anorg. Allg. Chem. 2013, 639, 308–311. [Google Scholar] [CrossRef]
  15. Brittain, H.G. Vibrational Spectroscopic Studies of Cocrystals and Salts. 3. Cocrystal Products Formed by Benzenecarboxylic Acids and Their Sodium Salts. Cryst. Growth Des. 2010, 10, 1990–2003. [Google Scholar] [CrossRef]
  16. Patel, M.A.; Nguyen, B.; Chadwick, K. Predicting the Nucleation Induction Time Based on Preferred Intermolecular Interactions. Cryst. Growth Des. 2017, 17, 4613–4621. [Google Scholar] [CrossRef]
  17. Zhang, K.; Xu, S.; Liu, S.; Tang, W.; Fu, X.; Gong, J. Novel Strategy to Control Polymorph Nucleation of Gamma Pyrazinamide by Preferred Intermolecular Interactions during Heterogeneous Nucleation. Cryst. Growth Des. 2018, 18, 4874–4879. [Google Scholar] [CrossRef]
  18. Bora, P.; Saikia, B.; Sarma, B. Oriented Crystallization on Organic Monolayers to Control Concomitant Polymorphism. Chem. A Eur. J. 2020, 26, 699–710. [Google Scholar] [CrossRef]
  19. Agnew, L.R.; McGlone, T.; Wheatcroft, H.P.; Robertson, A.; Parsons, A.R.; Wilson, C.C. Continuous Crystallization of Paracetamol (Acetaminophen) Form II: Selective Access to a Metastable Solid Form. Cryst. Growth Des. 2017, 17, 2418–2427. [Google Scholar] [CrossRef]
  20. Yeh, K.L.; Lee, T. Selective formation of form II paracetamol through the assistance of paracetamol co-crystals as templates in a solution. CrystEngComm 2021, 23, 3940–3945. [Google Scholar] [CrossRef]
  21. O’Donnell, J.L.; Zuo, X.; Goshe, A.J.; Sarkisov, L.; Snurr, R.Q.; Hupp, J.T.; Tiede, D.M. Solution-Phase Structural Characterization of Supramolecular Assemblies by Molecular Diffraction. J. Am. Chem. Soc. 2007, 129, 1578–1585. [Google Scholar] [CrossRef] [PubMed]
  22. Lee, T.; Lee, H.L. Direct Co-crystal Assembly from Synthesis to Co-crystallization. CrystEngComm 2015, 17, 9002–9006. [Google Scholar] [CrossRef]
  23. Mullin, J.W. Crystallization, 4th ed.; Butterworth-Heinemann: Woburn, MA, USA, 2001. [Google Scholar]
  24. Lee, T.; Chen, Y.H.; Wang, Y.W. Effects of Homochiral Molecules of (S)-(+)-Ibuprofen and (S)-(−)-Sodium Ibuprofen Dihydrate on the Crystallization Kinetics of Racemic (R,S)-(±)-Sodium Ibuprofen Dihydrate. Cryst. Growth Des. 2008, 8, 415–426. [Google Scholar] [CrossRef]
  25. Mersmann, A.; Bartosch, K. How to predict the metastable zone width. J. Cryst. Growth 1998, 183, 240–250. [Google Scholar] [CrossRef]
  26. Boomadevi, S.; Dhanasekaran, R.; Ramasamy, P. Investigations on nucleation and growth kinetics of urea crystals from methanol. Cryst. Res. Technol. 2002, 37, 159–168. [Google Scholar] [CrossRef]
  27. Mersmann, A.; Eble, A.; Heyer, C. Crystal Growth. In Crystallization Technology Handbook; Informa UK Limited: London, UK, 2001. [Google Scholar]
  28. Saleemi, A.; Onyemelukwe, I.I.; Nagy, Z. Effects of a structurally related substance on the crystallization of paracetamol. Front. Chem. Sci. Eng. 2013, 7, 79–87. [Google Scholar] [CrossRef]
  29. Shiau, L.-D.; Lu, T.-S. A model for determination of the interfacial energy from the induction time or metastable zone width data based on turbidity measurements. CrystEngComm 2014, 16, 9743–9752. [Google Scholar] [CrossRef]
  30. Shiau, L.-D.; Wang, H.-P. Simultaneous determination of interfacial energy and growth activation energy from induction time measurements. J. Cryst. Growth 2016, 442, 47–51. [Google Scholar] [CrossRef]
  31. Shiau, L.-D. Investigations into the Influence of Solvents on the Nucleation Kinetics for Isonicotinamide, Lovastatin, and Phenacetin. ACS Omega 2019, 4, 17352–17358. [Google Scholar] [CrossRef] [PubMed]
  32. Qiu, Y.; Rasmuson, Å.C. Nucleation and growth of succinic acid in a batch cooling crystallizer. AIChE J. 1991, 37, 1293–1304. [Google Scholar] [CrossRef]
  33. Helt, J.E.; Larson, M.A. Effects of temperature on the crystallization of potassium nitrate by direct measurement of supersaturation. AIChE J. 1977, 23, 822–830. [Google Scholar] [CrossRef]
  34. Glade, H.; Ilyaskarov, A.; Ulrich, J. Determination of Crystal Growth Kinetics Using Ultrasonic Technique. Chem. Eng. Technol. 2004, 27, 736–740. [Google Scholar] [CrossRef]
  35. Lee, T.; Lin, Y.K. The Origin of Life and the Crystallization of Aspartic Acid in Water. Cryst. Growth Des. 2010, 10, 1652–1660. [Google Scholar] [CrossRef]
  36. Sangtani, E.; Sahu, S.K.; Thorat, S.H.; Gawade, R.L.; Jha, K.; Munshi, P.; Gonnade, R.G. Furosemide Cocrystals with Pyridines: An Interesting Case of Color Cocrystal Polymorphism. Cryst. Growth Des. 2015, 15, 5858–5872. [Google Scholar] [CrossRef]
  37. Li, M.; Li, Z.; Zhang, Q.; Peng, B.; Zhu, B.; Wang, J.-R.; Liu, L.; Mei, X. Fine-Tuning the Colors of Natural Pigment Emodin with Superior Stability through Cocrystal Engineering. Cryst. Growth Des. 2018, 18, 6123–6132. [Google Scholar] [CrossRef]
  38. Butterhof, C.; Martin, T.; Milius, W.; Breu, J. Microphase Separation with Small Amphiphilic Molecules: Crystal Structure of Preservatives Sodium Benzoate (E 211) and Potassium Benzoate (E 212). Z. Anorg. Allg. Chem. 2013, 639, 2816–2821. [Google Scholar] [CrossRef]
  39. Martin, T.; Gorelik, T.; Greim, D.; Butterhof, C.; Kolb, U.; Senker, J.; Breu, J. Microphase Separation upon Crystallization of Small Amphiphilic Molecules: ‘Low’ Temperature Form II of Sodium Benzoate (E 211). CrystEngComm 2016, 18, 5811–5817. [Google Scholar] [CrossRef]
Figure 1. The molecular structure of (a) benzoic acid and (b) sodium benzoate.
Crystals 11 00812 g001
Figure 2. Illustration of intermolecular interactions of 2:1 co-crystal of HBz–NaBz: (a) Form I and (b) Form II. Some carboxylic/carboxylate ligands of sodium atoms are omitted for clarity.
Crystals 11 00812 g002
Scheme 1. Reaction co-crystallization of 2:1 HBz–NaBz co-crystal.
Crystals 11 00812 sch001
Figure 3. Desupersaturation curve of crystallization in general.
Crystals 11 00812 g003
Figure 4. Representative desupersaturation curves of co-crystallization of 2:1 HBz–NaBz co-crystals at different S0 values of 1.66, 1.54, 1.48, and 1.43 (a) without templating molecules addition, (b) with dissolved NaBz templating molecules addition, (c) with dissolved 2:1 HBz–NaBz co-crystal templating molecules addition, (d) with dissolved 1:1 HBz–NaBz co-crystal templating molecules addition.
Crystals 11 00812 g004
Figure 5. Plots of (ln S0)−2 vs. ln τ of co-crystallization of 2:1 HBz–NaBz co-crystal with and without templating molecules fitted to Equation (12) based on the data in Table 1.
Crystals 11 00812 g005
Figure 6. Plot of ln (m−2/3(dmt/dt)) vs. ln (Ct − C*) of 2:1 HBz–NaBz co-crystallization by fitting to Equation (25): (a) without templating molecules, (b) with dissolved NaBz templating molecules, (c) with dissolved 2:1 HBz–NaBz co-crystal templating molecules, (d) with dissolved 1:1 HBz–NaBz co-crystal templating molecules.
Crystals 11 00812 g006
Figure 7. Representative OM images of 2:1 HBz–NaBz co-crystals generated at S0 = 1.66: (a) without templating molecules, (b) with dissolved NaBz templating molecules, (c) with dissolved 2:1 HBz–NaBz co-crystal templating molecules, and (d) with dissolved 1:1 HBz–NaBz co-crystal templating molecules.
Crystals 11 00812 g007
Figure 8. (a) Theoretical morphology of 2:1 HBz–NaBz co-crystal by BFDH method and theoretical molecular packing of 2:1 HBz–NaBz co-crystal in Form A, drawn together with the faces viewed along (b) b-axis and (c) a-axis.
Crystals 11 00812 g008
Table 1. Induction period (τ), interfacial energy (γ), and nucleation rate pre-exponential factor (J0) of co-crystallization of 2:1 HBz–NaBz co-crystals at different initial degrees of supersaturation (S0) with and without templating molecules.
S0 = C0/C*τ (s)γ × 105 (J·m−2)J0 × 10−9 (Nucleus s−1·m−3)
Without templating molecules
1.66370 ± 14191.92 ± 2.288.04 ± 0.30
1.541080 ± 27
1.481494 ± 49
1.431848 ± 180
With NaBz templating molecules
1.66277 ± 18202.38 ± 3.5915.97 ± 2.79
1.54714 ± 47
1.481086 ± 39
1.431816 ± 68
With 2:1 HBz–NaBz co-crystal templating molecules
1.66205 ± 35194.34 ± 3.3717.05 ± 3.25
1.54538 ± 38
1.48717 ± 45
1.431097 ± 96
With 1:1 HBz–NaBz co-crystal templating molecules
1.66187 ± 20190.62 ± 1.9618.62 ± 2.26
1.54366 ± 11
1.48533 ± 32
1.43894 ± 47
Table 2. Free energy change in transformation per unit volume (∆Gv), free energy required to form a critical nucleus size (ΔGcrit), nucleation rate (J), critical nucleus size (rcrit), and theoretical number of molecules in the critical nucleus (i*) of co-crystallization of 2:1 HBz–NaBz co-crystals at different initial degrees of supersaturation (S0) with and without templating molecules.
S0 = C0/C*∆Gv × 10−6
(J·m−3)
∆Gcrit × 1022
(J)
J × 10−7
(Nucleus s−1·m−3)
rcrit × 1011
(m)
i*
Without templating molecules
1.66−4.3562.61 ± 2.22167.34 ± 3.2588.25 ± 1.056.19 ± 0.22
1.54−3.7086.26 ± 3.0692.56 ± 3.68103.59 ± 1.2310.01 ± 0.36
1.48−3.36104.63 ± 3.7158.45 ± 3.27114.09 ± 1.3513.38 ± 0.48
1.43−3.07125.70 ± 4.4634.51 ± 2.58125.05 ± 1.4817.62 ± 0.63
With NaBz templating molecules
1.66−4.3573.44 ± 3.89250.35 ± 20.2993.06 ± 1.657.26 ± 0.38
1.54−3.70101.18 ± 5.36124.62 ± 5.59109.23 ± 1.9411.75 ± 0.62
1.48−3.36122.74 ± 6.5072.54 ± 1.20120.30 ± 2.1315.69 ± 0.83
1.43−3.07147.46 ± 7.8139.04 ± 0.64131.86 ± 2.3420.66 ± 1.09
With 2:1 HBz–NaBz co-crystal templating molecules
1.66−4.3565.03 ± 3.36330.00 ± 40.4589.36 ± 1.556.43 ± 0.33
1.54−3.7089.60 ± 4.63177.76 ± 17.48104.89 ± 1.8210.40 ± 0.54
1.48−3.36108.68 ± 5.62110.00 ± 8.96115.52 ± 2.0013.90 ± 0.72
1.43−3.07130.57 ± 6.7563.48 ± 4.21126.62 ± 2.2018.30 ± 0.95
With 1:1 HBz–NaBz co-crystal templating molecules
1.66−4.3561.33 ± 1.88398.61 ± 32.1687.65 ± 0.906.07 ± 0.19
1.54−3.7084.50 ± 2.59222.79 ± 14.68102.88 ± 1.069.81 ± 0.30
1.48−3.36102.50 ± 3.14141.80 ± 7.81113.31 ± 1.1713.10 ± 0.40
1.43−3.07123.14 ± 3.7884.48 ± 3.73124.20 ± 1.2817.26 ± 0.53
Table 3. Order of crystal growth kinetics (g) and coefficient KG of 2:1 HBz–NaBz co-crystallization at different initial degrees of supersaturation (S0) with and without templating molecules.
S0 = C0/C*gKG × 103
(kg1/3 s−1)
Without templating molecules
1.661.19.9
1.541.638.0
1.481.03.6
1.431.17.0
With NaBz templating molecules
1.661.983.0
1.541.997.0
1.481.866.8
1.431.980.7
With 2:1 HBz–NaBz co-crystal templating molecules
1.660.84.1
1.540.94.3
1.481.08.9
1.431.419.7
With 1:1 HBz–NaBz co-crystal templating molecules
1.661.17.6
1.540.83.9
1.481.110.0
1.430.93.2
Table 4. Average aspect ratios of the 2:1 HBz–NaBz co-crystals generated with and without templating molecules at S0 = 1.66.
2:1 HBz–NaBz Co-CrystalsAverage Aspect Ratio
Without templating molecules6.0 ± 1.7
With NaBz templating molecules9.6 ± 3.7
With 2:1 HBz–NaBz co-crystal templating molecules5.3 ± 1.4
With 1:1 HBz–NaBz co-crystal templating molecules4.3 ± 1.5
Publisher’s Note: MDPI stays neutral with regard to jurisdictional claims in published maps and institutional affiliations.

