
Constitutive Equation for Flow Stress in Superalloy 718 by Inverse Analysis under Hot Forming in a Region of Precipitation


Abstract
:1. Introduction
2. Materials and Methods
2.1. Materials
2.2. Hot Compression Tests and Microstructural Observation
2.3. Flow Curve Determination by Inverse Analysis Coupled with Thermomechanical CAE
3. Results and Discussion
3.1. Comparison of Flow Curves Obtained by Experiment and Inverse Analysis
3.2. Flow Curve Regression
3.3. Generalized Flow Curve
4. Conclusions
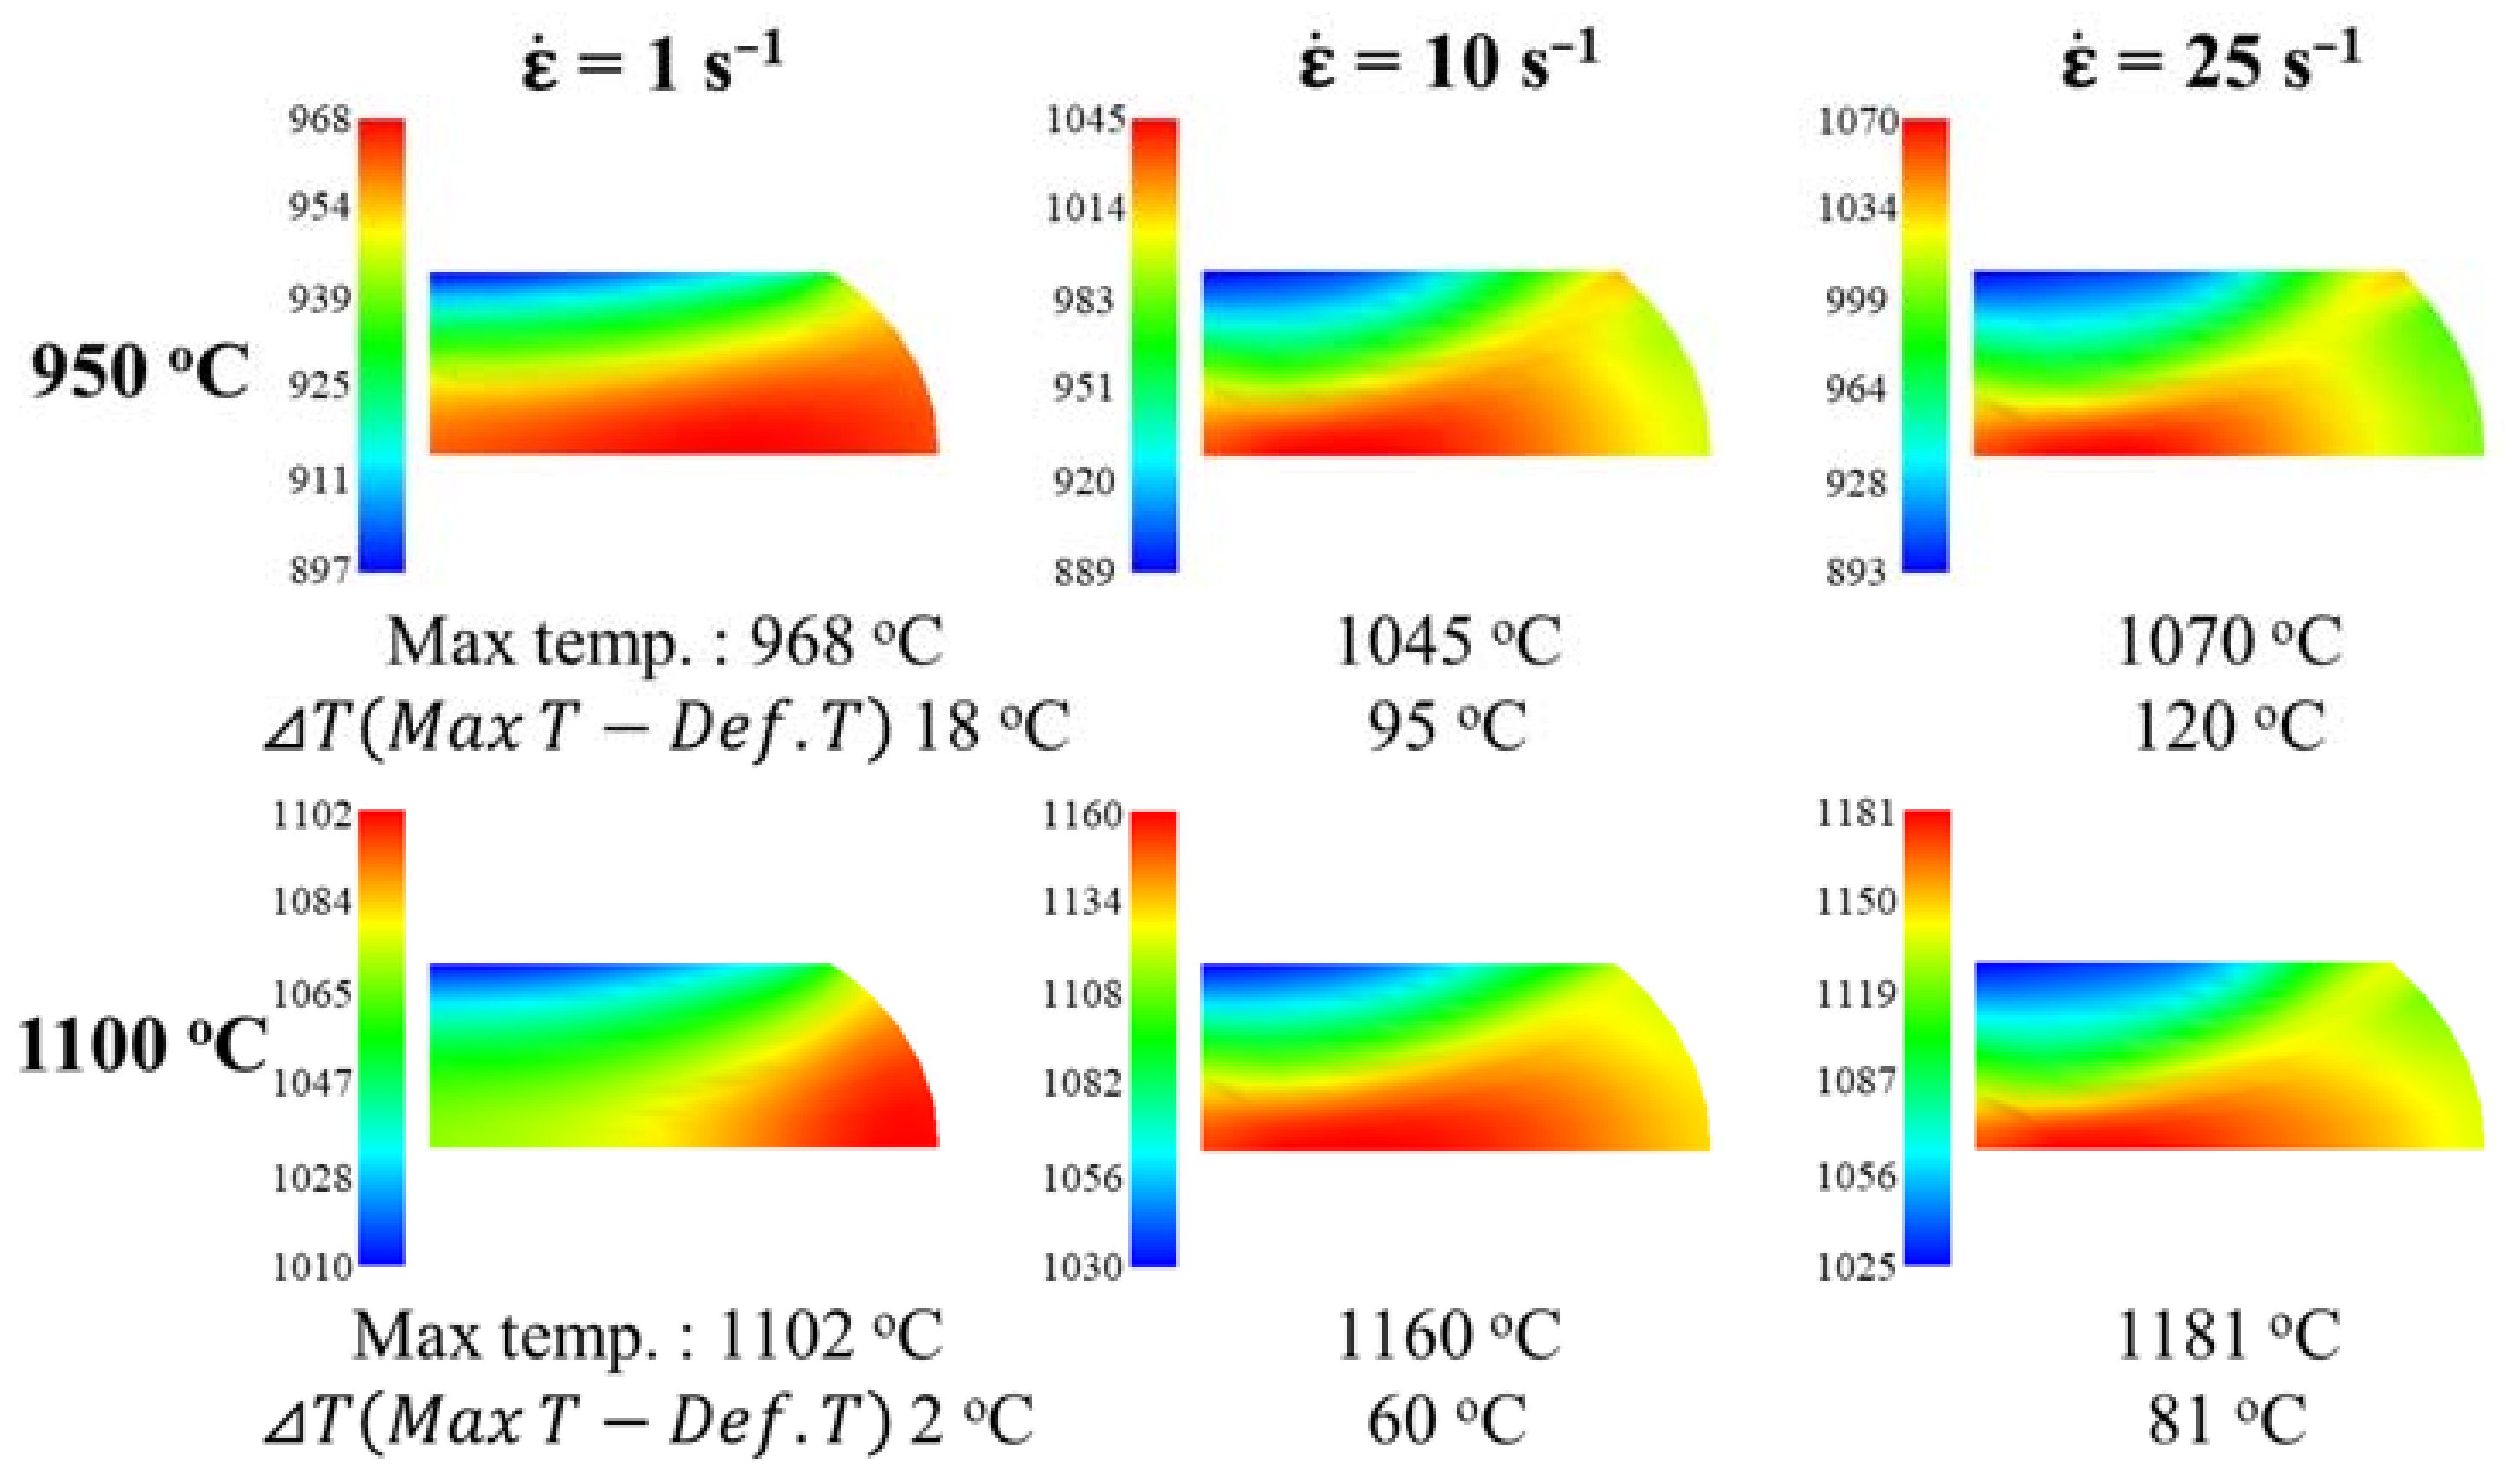
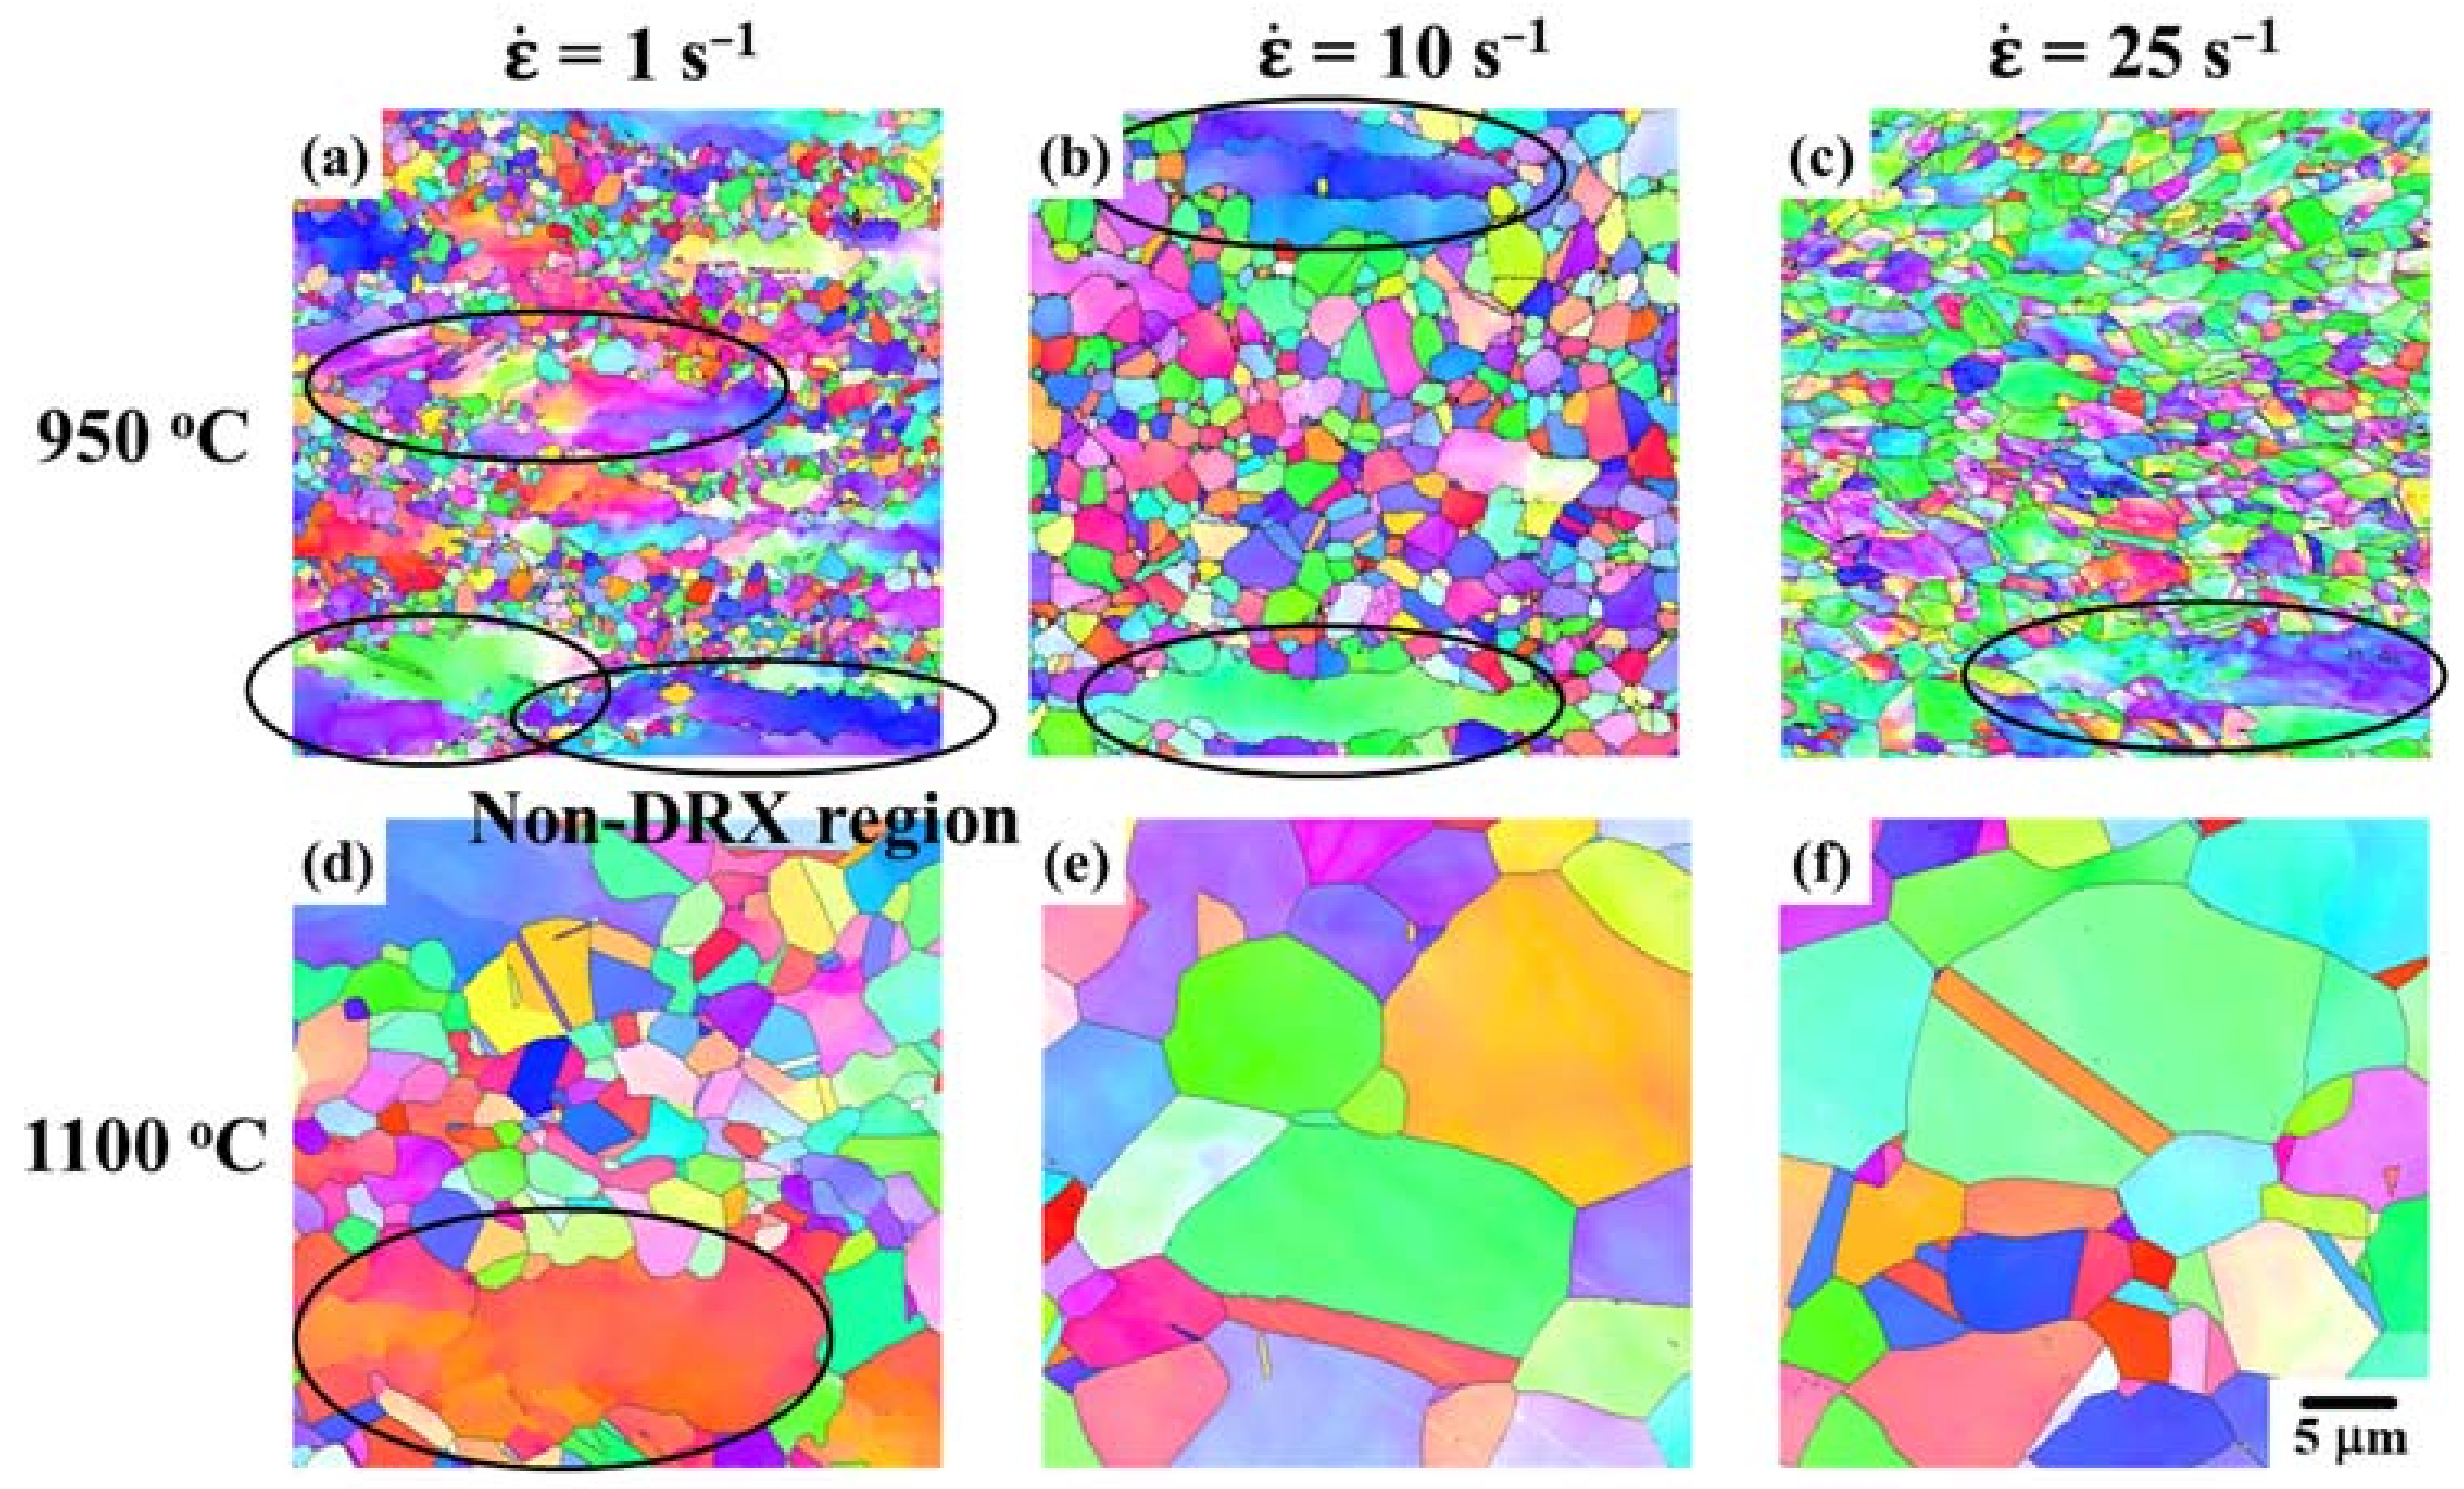
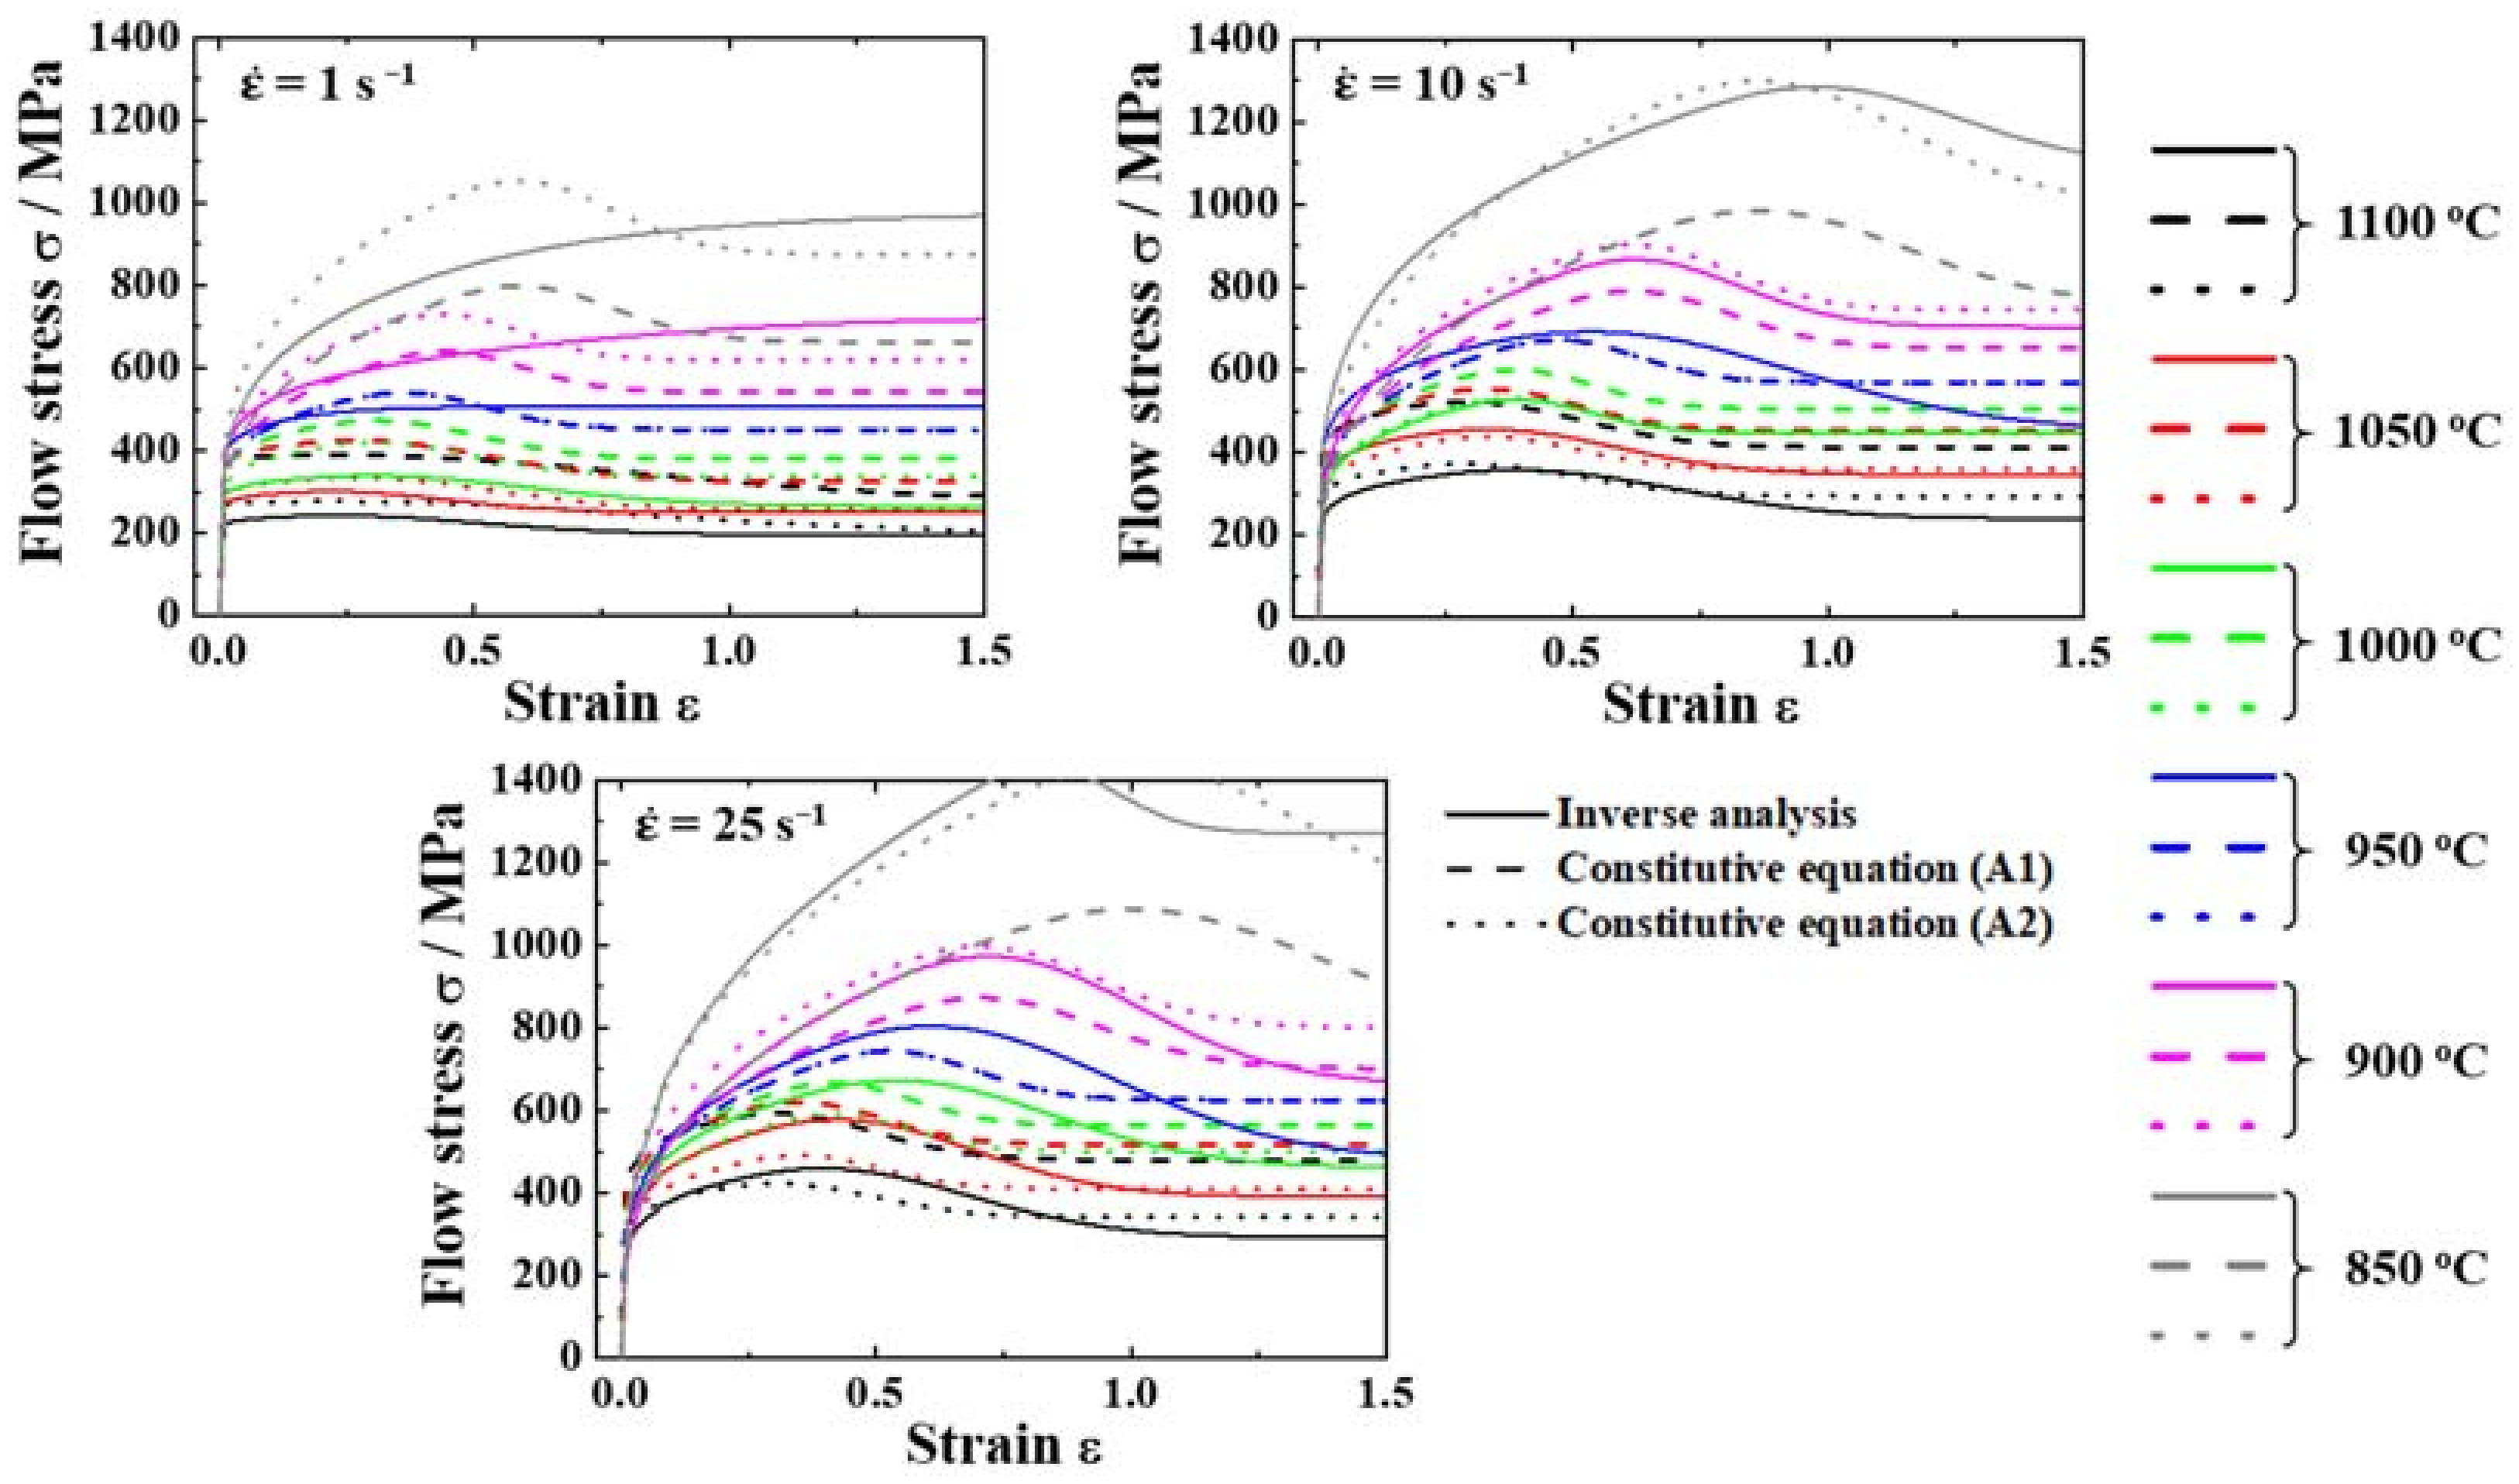
- A flow curve obtained from experimental results at a deformation temperature of 950 °C and a strain rate of 1 s−1 shows strong DRX behavior. On the other hand, a flow curve obtained from IA results at a deformation temperature of 950 °C and a strain rate of 1 s−1 shows weak DRX behavior and complex dynamic events such as DRV and DRX. This might be attributed to the flow curve obtained from the experimental results, including the effects of internal–external heat transfer, friction, and heat generated by hot working, leading to heterogeneous deformation. From IA results, a uniaxial flow stress can be attained to remove those effects.
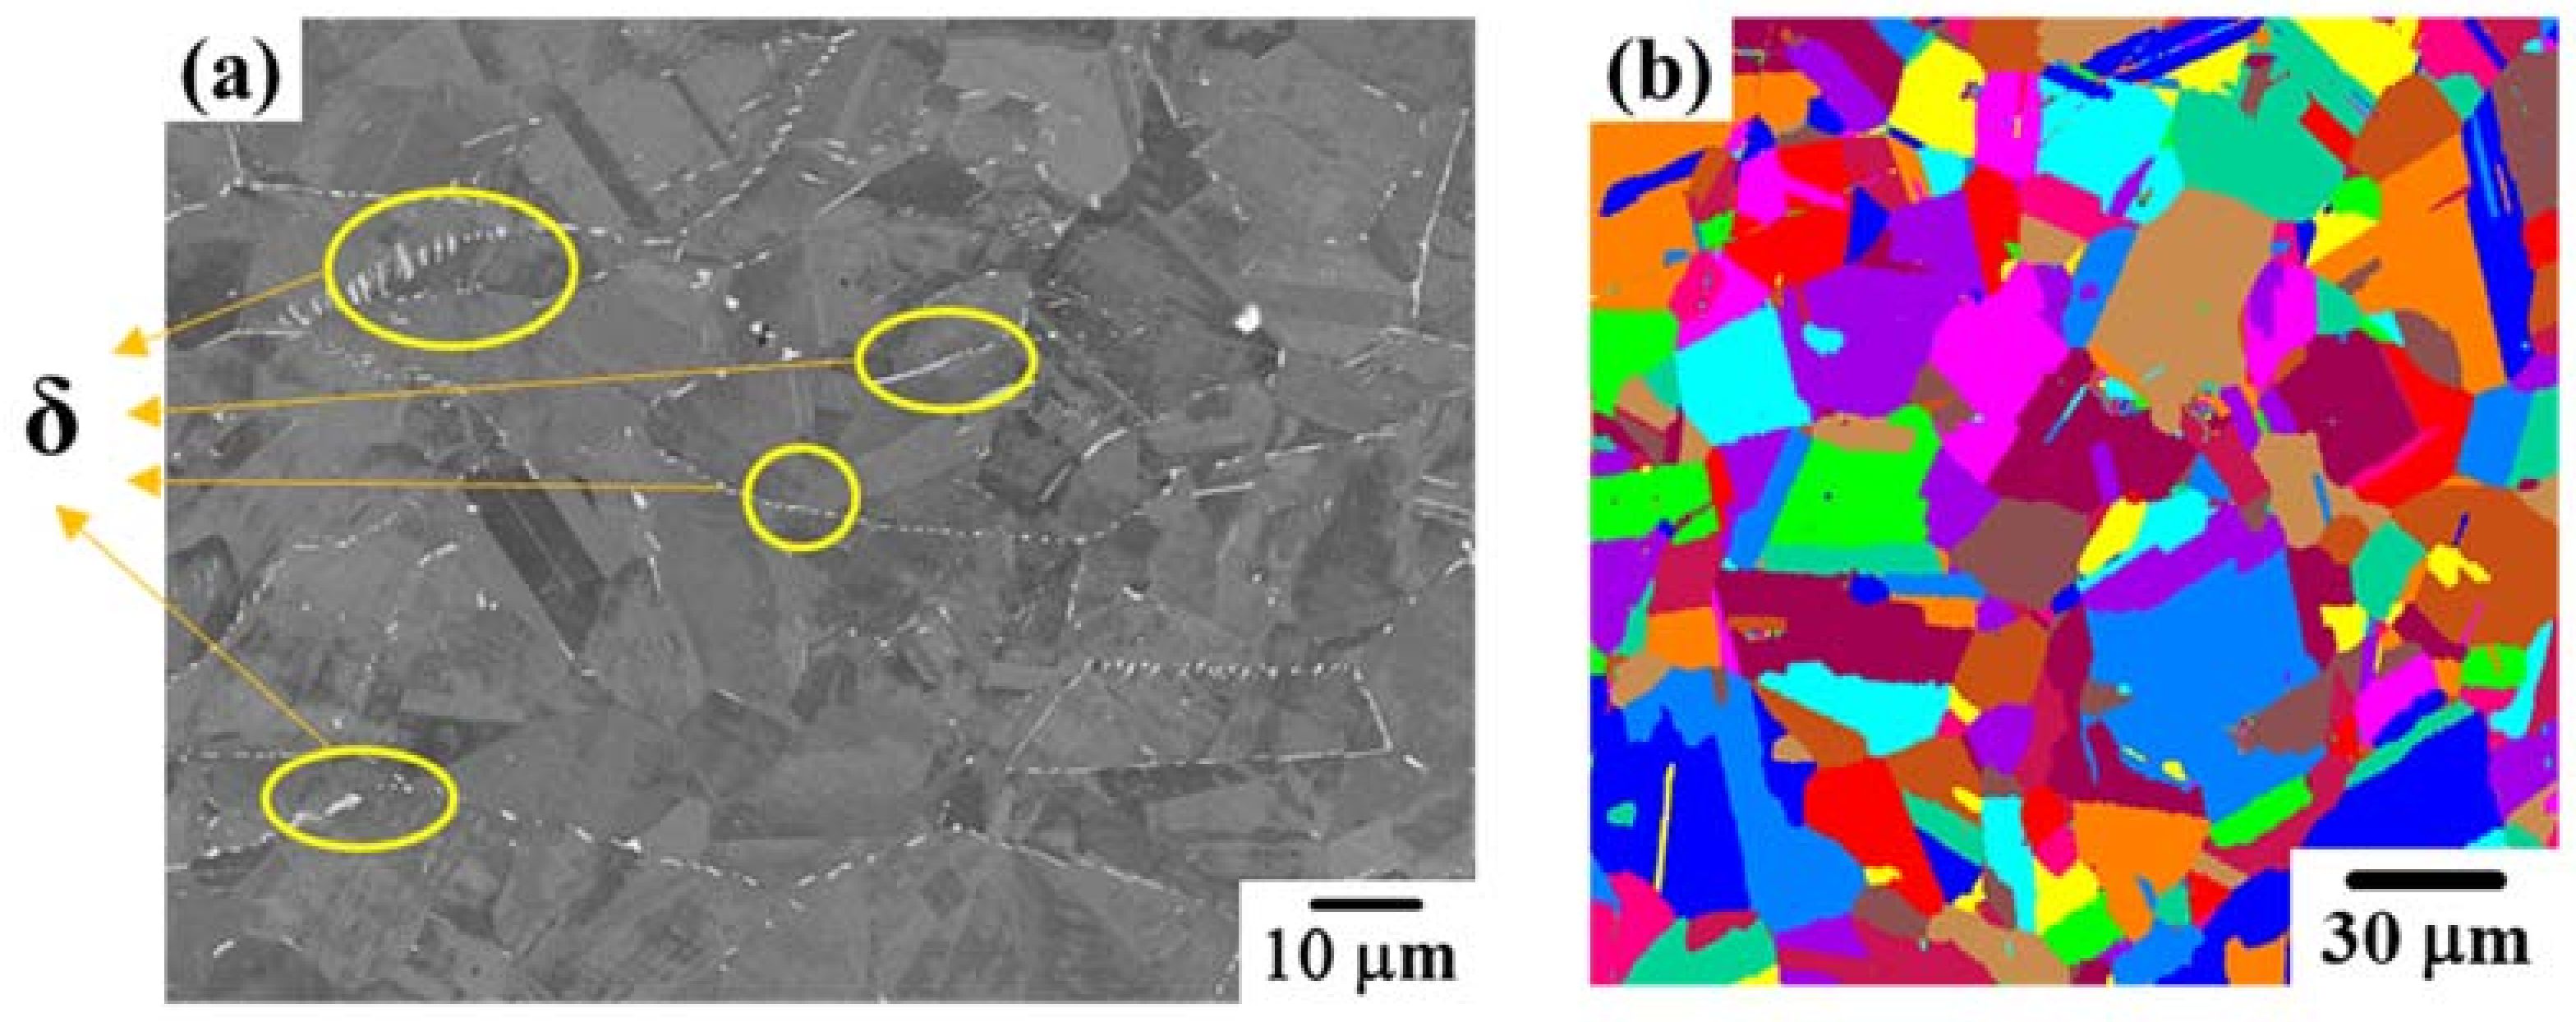
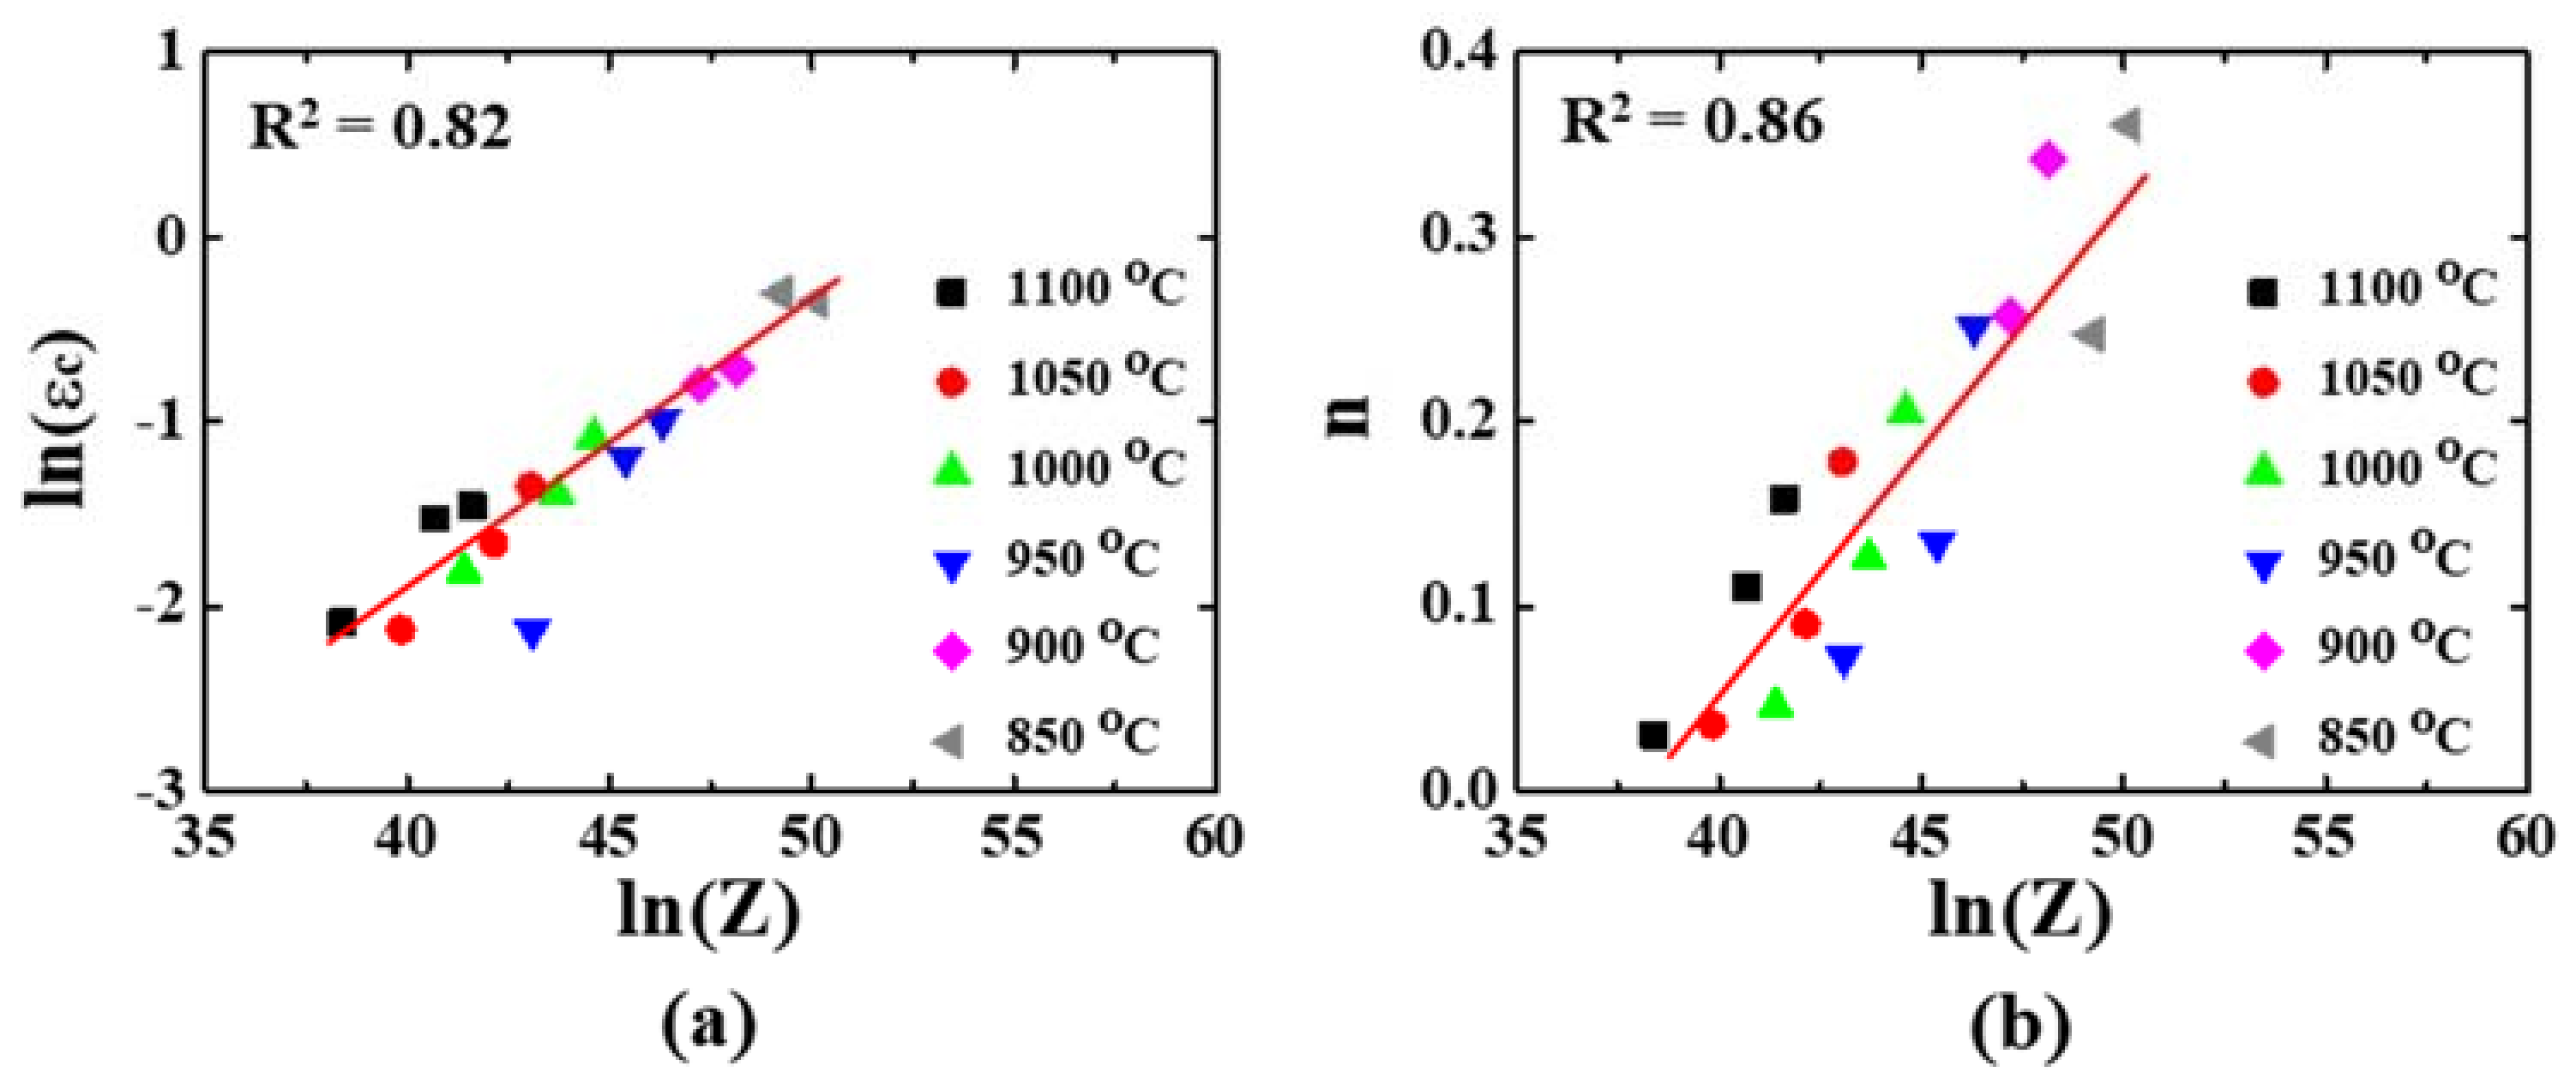
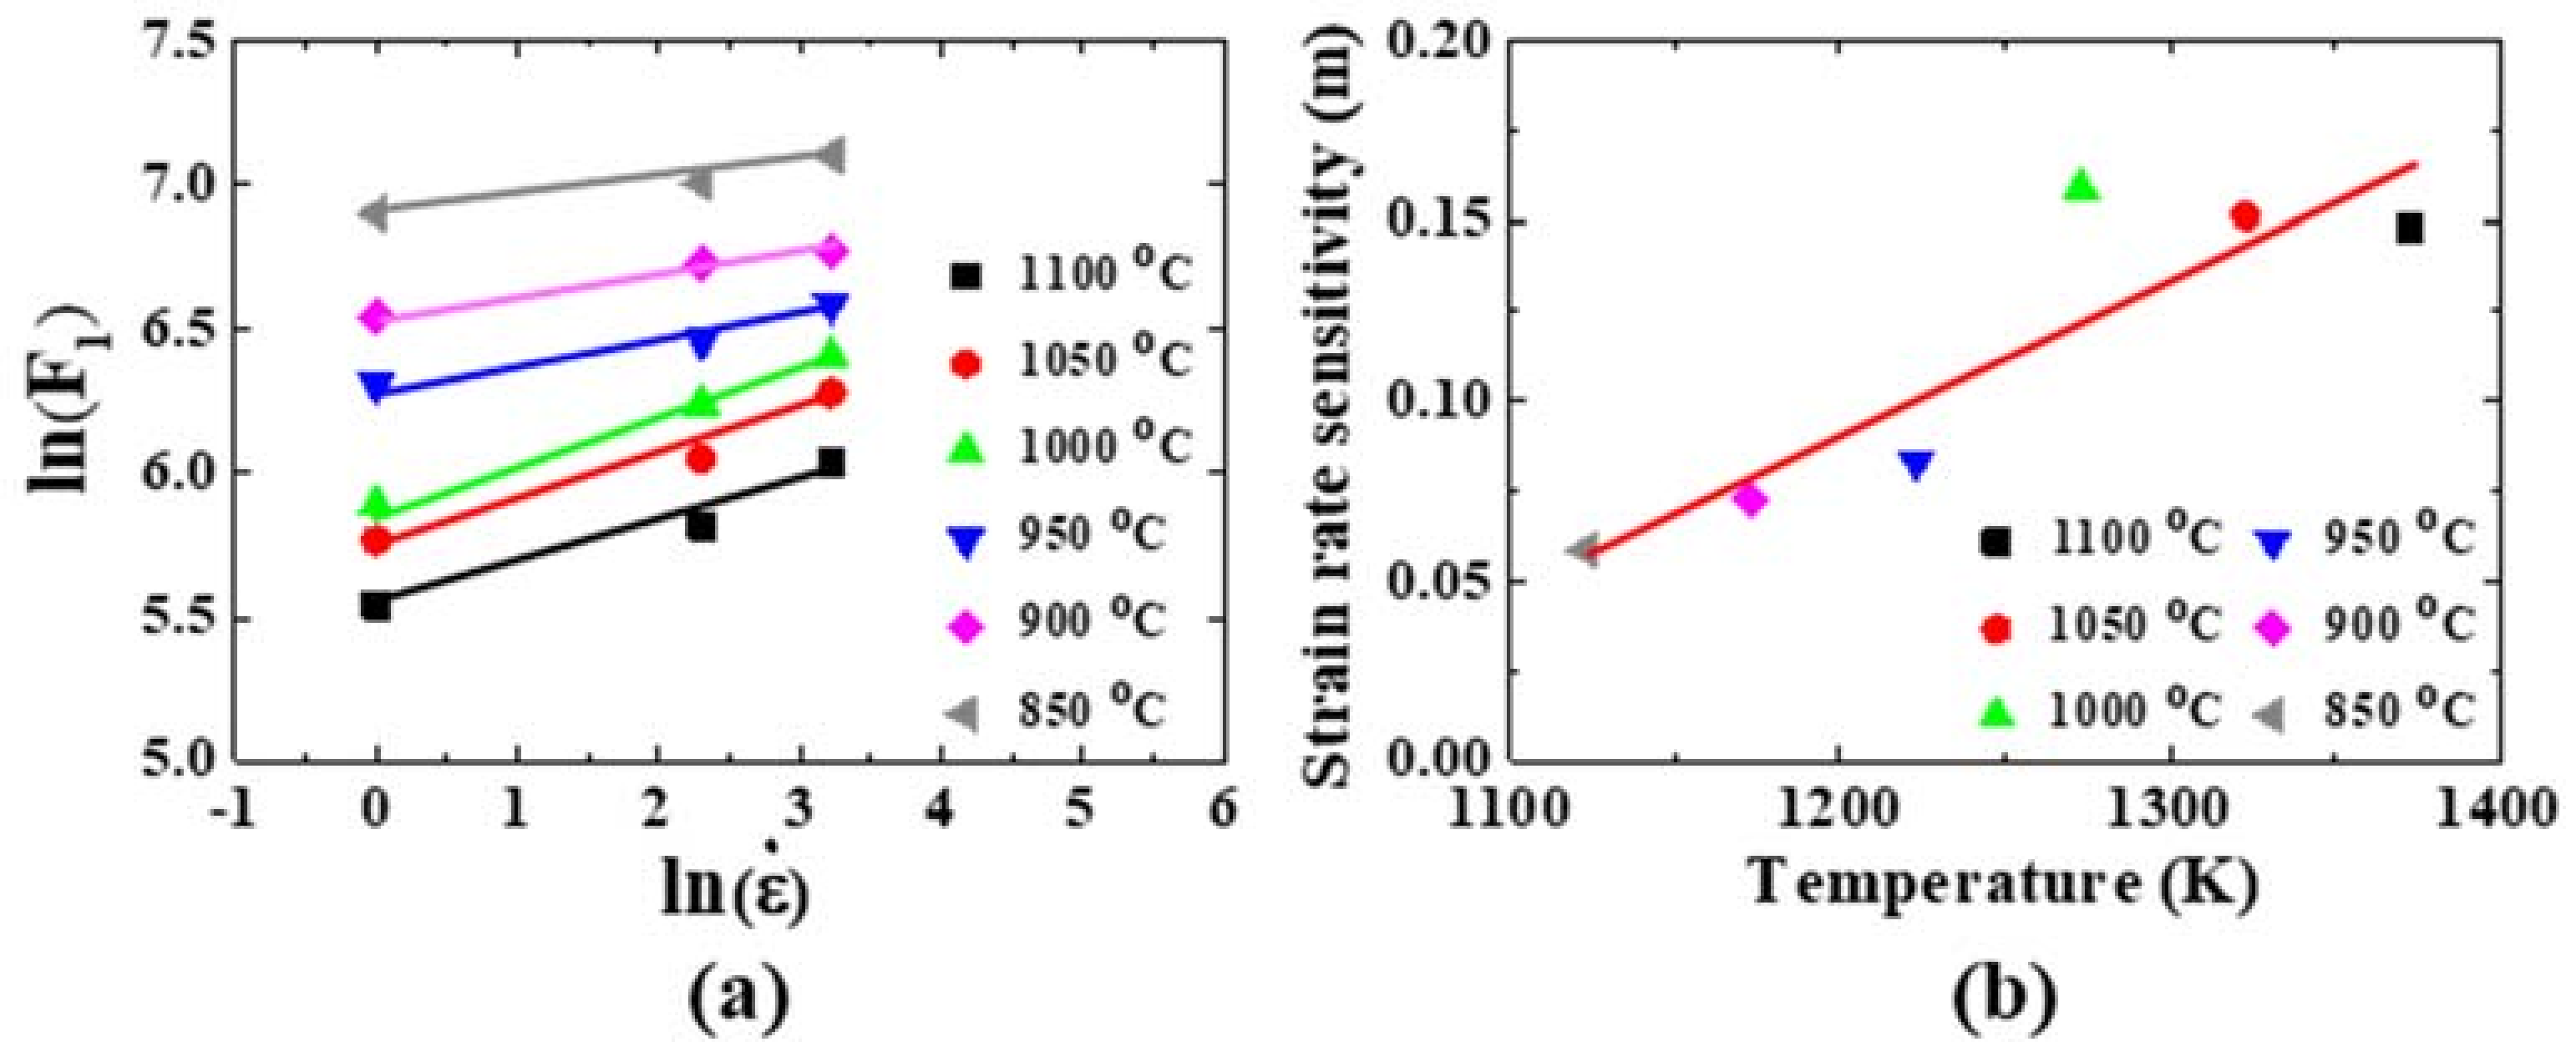
- The dynamically precipitated δ phases deformed at 1050 °C and γ″ phases deformed at 950 °C might affect the increase in the plastic modulus F1 and the decrease in the critical strain εc, deteriorating the accuracy of regression in terms of, for example, the strain rate sensitivity m and the temperature sensitivity A.
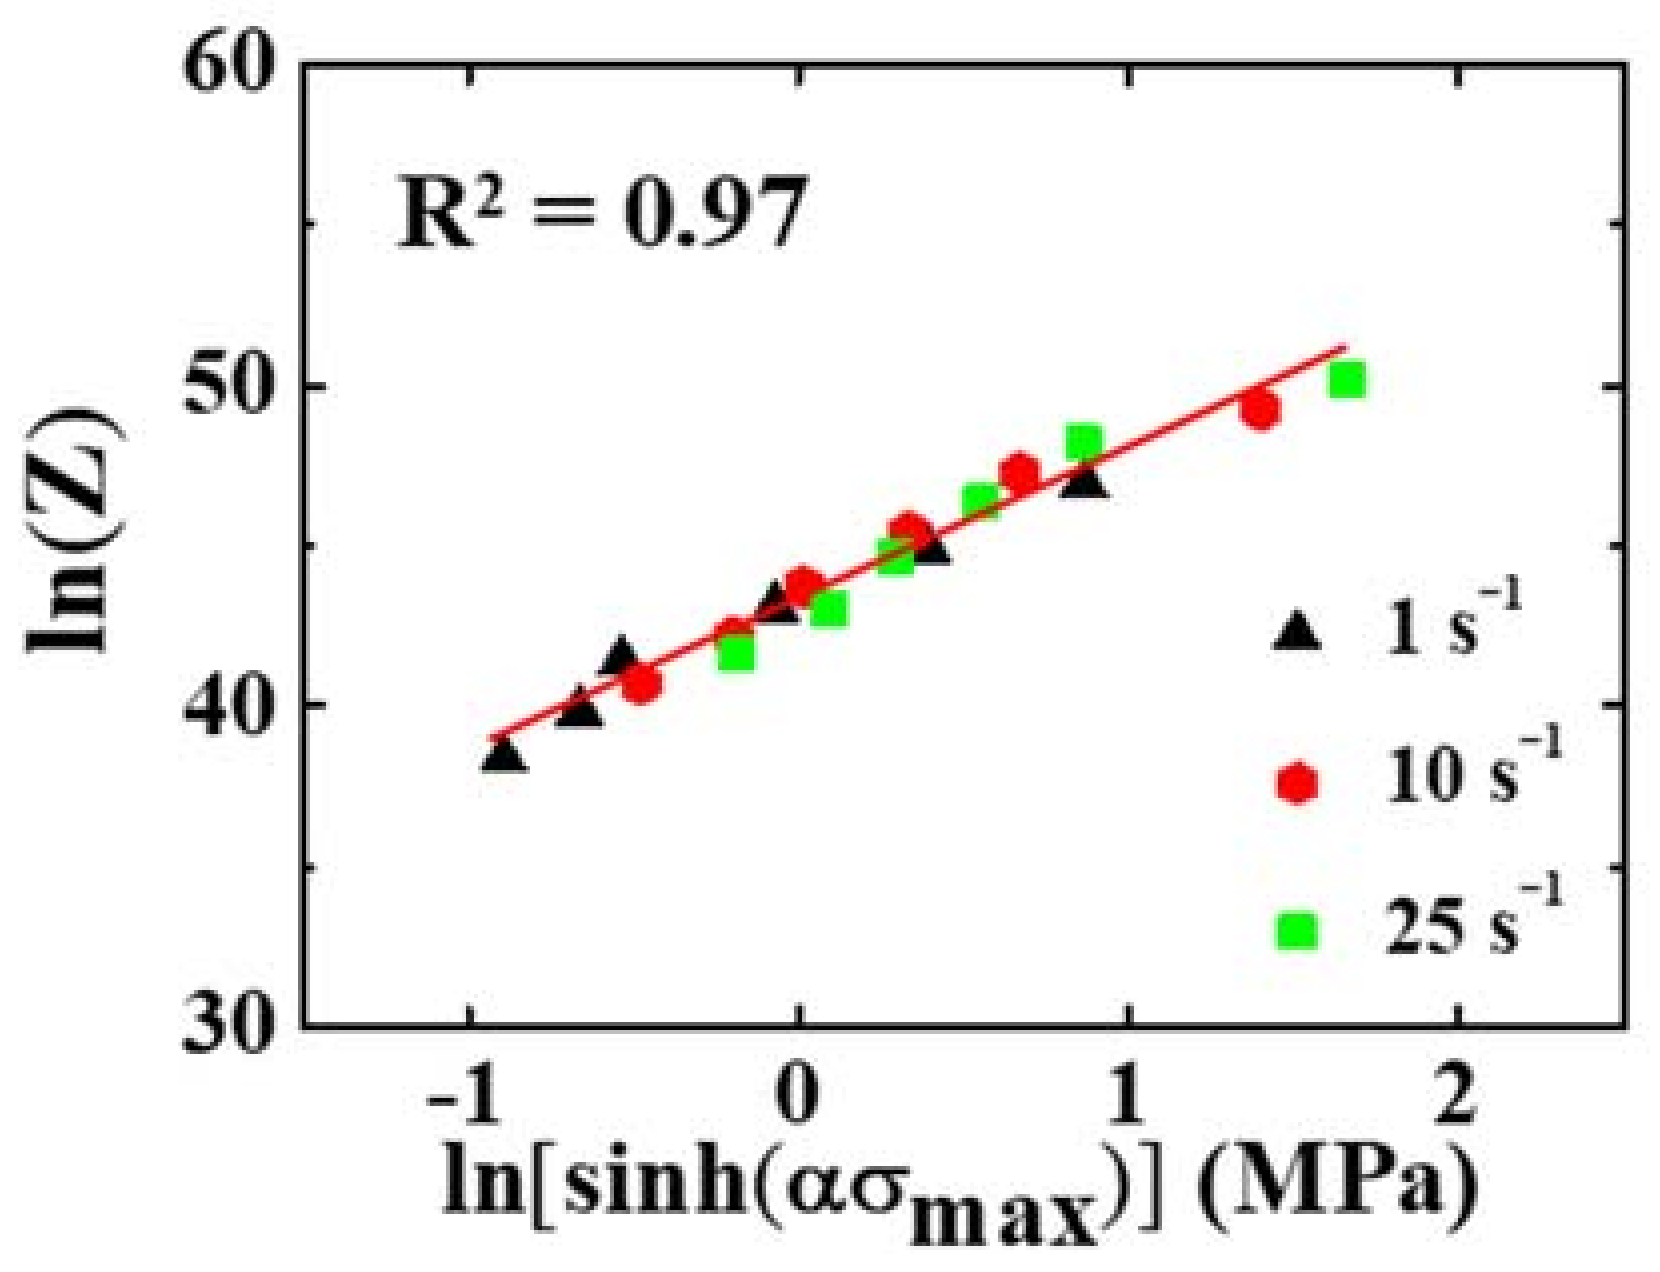
- A high-precision constitutive equation for the generalized flow curve in superalloy 718 has been achieved by using the temperature sensitivity A2 obtained from the relationship between ln(F3) and 103(1/T–1/T*), instead of the temperature sensitivity A1 obtained from the relationship between and 103(1/T–1/T*), which is affected by the plastic modulus F1 and the critical strain .
Author Contributions
Funding
Institutional Review Board Statement
Informed Consent Statement
Data Availability Statement
Conflicts of Interest
References
- The Japan Research and Development Center for Metals. JRCM NEWS, March 2007; 2–6. Available online: http://www.jrcm.or.jp/jrcmnews/0703jn245.pdf(accessed on 5 July 2021).
- Thamboo, S.V.; Schwant, R.C.; Yang, L.; Jackman, L.A.; Bond, B.J.; Kennedy, R.L. Large diameter 718 ingots for land-based gas turbines. In Superalloys 718, 625, 706 and Various Derivatives; Loria, E.A., Ed.; TMS: Warrendale, PA, USA, 2001; pp. 57–70. [Google Scholar]
- Uginet, J.F.; Jackson, J.J. Alloy 718 forging development for large land-based gas turbine. In Superalloys 718, 625, 706 and Derivatives; Loria, E.A., Ed.; TMS: Warrendale, PA, USA, 2005; pp. 57–67. [Google Scholar]
- Chamanfar, A.; Sarrat, L.; Jahazi, M.; Asadi, M.; Weck, A.; Koul, A.K. Microstructural characteristics of forged and heat treated Inconel-718 disks. Mater. Des. 2013, 52, 791–800. [Google Scholar] [CrossRef]
- Alabort, E.; Reed, R.C.; Barba, D. Combined modelling and miniaturised characterisation of high-temperature forging in a nickel-based superalloy. Mater. Des. 2018, 160, 683–697. [Google Scholar] [CrossRef]
- Tan, Y.B.; Ma, Y.H.; Zhao, F. Hot deformation behavior and constitutive modeling of fine grained Inconel 718 superalloy. J. Alloys Compd. 2017, 716, 65–72. [Google Scholar] [CrossRef]
- Azarbarmas, M.; Aghaie-Khafri, M.; Cabrera, J.M.; Calvo, J. Microstructural evolution and constitutive equations of Inconel 718 alloy under quasi-static and quasi-dynamic conditions. Mater. Des. 2016, 94, 28–38. [Google Scholar] [CrossRef] [Green Version]
- Chen, F.; Liu, J.; Ou, H.; Lu, B.; Cui, Z.; Long, H. Flow characteristics and intrinsic workability of IN718 superalloy. Mater. Sci. Eng. A 2015, 642, 279–287. [Google Scholar] [CrossRef]
- Gujrati, R.; Gupta, C.; Jha, J.S.; Mishra, S.; Alankar, A. Understanding activation energy of dynamic recrystallization in Inconel 718. Mater. Sci. Eng. A 2019, 744, 638–651. [Google Scholar] [CrossRef]
- Tang, X.; Wang, B.; Huo, Y.; Ma, W.; Zhou, J.; Ji, H.; Fu, X. Unified modeling of flow behavior and microstructure evolution in hot forming of a Ni-based superalloy. Mater. Sci. Eng. A 2016, 662, 54–64. [Google Scholar] [CrossRef]
- Yanagida, A.; Liu, J.; Yanagimoto, J. Flow curve determination for metal under dynamic recrystallization using inverse analysis. Mater. Trans. 2003, 44, 2303–2310. [Google Scholar] [CrossRef] [Green Version]
- Yanagida, A.; Yanagimoto, J. Regression method of determining generalized description of flow curve of steel under dynamic recrystallization. ISIJ Int. 2005, 45, 858–866. [Google Scholar] [CrossRef] [Green Version]
- Soltanpour, M.; Yanagimoto, J. Material data for the kinetics of microstructure evolution of Cr–Mo–V steel in hot forming. J. Mater. Proc. Technol. 2012, 212, 417–426. [Google Scholar] [CrossRef]
- Meng, Y.; Lin, J.Y.; Yanagida, A.; Yanagimoto, J. Modeling static and dynamic kinetics of microstructural evolution in hot deformation of Fe–0.15C–0.2Si–1.4Mn–0.03Nb alloy. Steel Res. Int. 2017, 88, 1700036. [Google Scholar] [CrossRef]
- Park, H.W.; Kim, K.; Park, H.W.; Ding, S.; Yanagimoto, J. Formulation of a generalized flow curve for 0.2% carbon steel under high-speed hot forming conditions by a regression method. ISIJ Int. 2020, 60, 2896–2904. [Google Scholar] [CrossRef]
- Dupin, E.; Yanagida, A.; Yanagimoto, J. Modeling static and dynamic kinetics of microstructure evolution in type 316 stainless steel. Steel Res. Int. 2014, 85, 1099–1108. [Google Scholar] [CrossRef]
- Kim, K.; Park, H.W.; Ding, S.; Park, H.W.; Yanagimoto, J. Flow stress of duplex stainless steel by inverse analysis with dynamic recovery and recrystallization model. ISIJ Int. 2021, 61, 280–291. [Google Scholar] [CrossRef]
- Ding, S.; Khan, S.A.; Yanagimoto, J. Constitutive descriptions and microstructure evolution of extruded A5083 aluminum alloy during hot compression. Mater. Sci. Eng. A 2018, 728, 133–143. [Google Scholar] [CrossRef]
- Ding, S.; Khan, S.A.; Yanagimoto, J. Flow behavior and dynamic recrystallization mechanism of A5083 aluminum alloys with different initial microstructures during hot compression. Mater. Sci. Eng. A 2020, 787, 139522. [Google Scholar] [CrossRef]
- Horikoshi, S.; Yanagida, A.; Yanagimoto, J. Uniform hot compression of nickel-based superalloy 720Li under isothermal and low friction conditions. ISIJ Int. 2020, 60, 2905–2916. [Google Scholar] [CrossRef]
- Thomas, A.; El-Wahabi, M.; Cabrera, J.M.; Prado, J.M. High temperature deformation of Inconel 718. J. Mater. Proc. Technol. 2006, 177, 469–472. [Google Scholar] [CrossRef]
- Desvallees, Y.; Bouzidi, M.; Bois, F.; Beaude, N. Delta phase in INCONEL 718: Mechanical properties and forging process requirements. In Superalloys 718, 625, 706 and Various Derivatives; Loria, E.A., Ed.; TMS: Warrendale, PA, USA, 1994; pp. 281–291. [Google Scholar]
- Azadian, S.; Wei, L.Y.; Warren, R. Delta phase precipitation in Inconel 718. Mater. Charact. 2004, 53, 7–16. [Google Scholar] [CrossRef]
- Slama, C.; Abdellaoui, M. Structural characterization of the aged Inconel 718. J. Alloys Compd. 2000, 306, 277–284. [Google Scholar] [CrossRef]
- Kulawik, K.; Buffat, P.A.; Kruk, A.; Wusatowska-Sarnek, A.M.; Czyrska-Filemonowicz, A. Imaging and characterization of γ′ and γ″ nanoparticles in Inconel 718 by EDX elemental mapping and FIB–SEM tomography. Mater. Charact. 2015, 100, 74–80. [Google Scholar] [CrossRef]
- Calvo, J.; Penalva, M.; Cabrera, J.M. Characterization of strain-induced precipitation in Inconel 718 superalloy. J. Mater. Eng. Perform. 2016, 25, 3409–3417. [Google Scholar] [CrossRef] [Green Version]
- Nowotnik, A.; Sieniawski, J.; Mrówka-Nowotnik, G. Identification of dynamically precipitated phases in hot-working Inconel 718 alloy. J. Achiev. Mater. Manuf. Eng. 2008, 31, 275–280. [Google Scholar]
- Nowotnik, A. The influence of hot-deformation parameters on the mechanical properties and precipitation process in nickel based superalloy. In Superalloys 2008; Reed, R.C., Green, K.A., Caron, P., Gabb, T.P., Fahrmann, M.G., Huron, E.S., Woodard, S.A., Eds.; TMS: Warrendale, PA, USA, 2008; pp. 709–718. [Google Scholar]
- Chen, S.; Chen, K.; Peng, G.; Chen, X.; Ceng, Q. Effect of heat treatment on hot deformation behavior and microstructure evolution of 7085 aluminum alloy. J. Alloys Compd. 2012, 537, 338–345. [Google Scholar] [CrossRef]
- Ebrahimi, G.R.; Momeni, A.; Kazemi, S.; Alinejad, H. Flow curves, dynamic recrystallization and precipitation in a medium carbon low alloy steel. Vacuum 2017, 142, 135–145. [Google Scholar] [CrossRef]
- Mirzaee, M.; Keshmiri, H.; Ebrahimi, G.R.; Momeni, A. Dynamic recrystallization and precipitation in low carbon low alloy steel 26NiCrMoV 14-5. Mater. Sci. Eng. A 2012, 551, 25–31. [Google Scholar] [CrossRef]
- Sellars, C.M.; McTegart, W.J. On the mechanism of hot deformation. Acta Metall. 1966, 14, 1136–1138. [Google Scholar] [CrossRef]
- Cheng, L.; Xue, X.; Tang, B.; Liu, D.; Li, J.; Kou, H.; Li, J. Deformation behavior of hot-rolled IN718 superalloy under plane strain compression at elevated temperature. Mater. Sci. Eng. A 2014, 606, 24–30. [Google Scholar] [CrossRef]
- Wang, Y.; Shao, W.Z.; Zhen, L.; Zhang, B.Y. Hot deformation behavior of delta-processed superalloy 718. Mater. Sci. Eng. A 2011, 528, 3218–3227. [Google Scholar] [CrossRef]
- Song, R.; Ponge, D.; Raabe, D.; Speer, J.G.; Matlock, D.K. Overview of processing, microstructure and mechanical properties of ultrafine grained bcc steels. Mater. Sci. Eng. A 2006, 441, 1–17. [Google Scholar] [CrossRef]
- Park, H.W.; Yanagimoto, J. Formation process and mechanical properties of 0.2% carbon steel with bimodal microstructures subjected to heavy-reduction single-pass hot/warm compression. Mater. Sci. Eng. A 2013, 567, 29–37. [Google Scholar] [CrossRef]
- Park, H.W.; Shimojima, K.; Sugiyama, S.; Komine, H.; Yanagimoto, J. Microstructural evolution and formation mechanism of bimodal structure of 0.2% carbon steel subjected to the heavy-reduction controlled rolling process. Mater. Sci. Eng. A 2015, 624, 203–212. [Google Scholar] [CrossRef] [Green Version]
- Dieter, G.E. Mechanical Metallurgy, 3rd ed.; McGraw-Hill: New York, NY, USA, 1986. [Google Scholar]
- Cao, G.H.; Sun, T.Y.; Wang, C.H.; Li, X.; Liu, M.; Zhang, Z.X.; Hu, P.F.; Russell, A.M.; Schneider, R.; Gerthsen, D.; et al. Investigations of γ′, γ″ and δ precipitates in heat-treated Inconel 718 alloy fabricated by selective laser melting. Mater. Charact. 2018, 136, 398–406. [Google Scholar] [CrossRef] [Green Version]
- Sundararaman, M.; Mukhopadhyay, P.; Banerjee, S. Precipitation of the δ-Ni3Nb phase in two nickel base superalloys. Metall. Mater. Trans. A 1988, 19, 453–465. [Google Scholar] [CrossRef]
- Hall, R.C. The Metallurgy of Alloy 718. J. Basic Eng. 1967, 89, 511–516. [Google Scholar] [CrossRef]
- Huang, K.; Logé, R.E. A review on dynamic recrystallization phenomena in metallic materials. Mater. Des. 2016, 111, 548–574. [Google Scholar] [CrossRef]
- Park, H.W.; Yanagimoto, J. Effect of carbon content on formation of bimodal microstructure and mechanical properties of low-carbon steels subjected to heavy-reduction single-pass hot/warm deformation. Mater. Sci. Eng. A 2014, 607, 542–550. [Google Scholar] [CrossRef] [Green Version]
- Lee, S.H.; Na, H.S.; Kim, B.H.; Kim, D.J.; Kang, C.Y. Effect of niobium on the ferrite continuous-cooling-transformation (CCT) curve of ultrahigh-thickness Cr-Mo steel. Metall. Mater. Trans. A 2013, 44, 2523–2532. [Google Scholar] [CrossRef]


| Ni | Cr | Nb | Ti | Al | Co | Mn | Cu | C | Si | B | Fe |
|---|---|---|---|---|---|---|---|---|---|---|---|
| 52.4 | 18.4 | 5.37 | 0.99 | 0.60 | 0.24 | 0.06 | 0.06 | 0.03 | 0.06 | 0.004 | Bal. |
| Temperature, °C | Strain Rate, s−1 | F1 | n | εc | F3 | εmax | Error, % |
|---|---|---|---|---|---|---|---|
| 1100 | 1 | 255.248 | 0.030 | 0.123 | 196.800 | 0.231 | 1.8 |
| 10 | 336.008 | 0.111 | 0.217 | 199.017 | 0.388 | 2.0 | |
| 25 | 420.233 | 0.158 | 0.232 | 226.308 | 0.406 | 2.2 | |
| 1050 | 1 | 320.102 | 0.036 | 0.119 | 250.717 | 0.219 | 0.7 |
| 10 | 425.052 | 0.090 | 0.190 | 287.614 | 0.332 | 1.5 | |
| 25 | 532.354 | 0.178 | 0.258 | 302.749 | 0.434 | 1.9 | |
| 1000 | 1 | 361.269 | 0.046 | 0.163 | 265.924 | 0.301 | 1.8 |
| 10 | 512.820 | 0.126 | 0.248 | 308.279 | 0.436 | 1.9 | |
| 25 | 605.083 | 0.205 | 0.337 | 357.156 | 0.551 | 1.9 | |
| 950 | 1 | 549.412 | 0.072 | 0.119 | 507.551 | 8.267 | 2.1 |
| 10 | 640.235 | 0.134 | 0.302 | 376.275 | 0.533 | 2.4 | |
| 25 | 728.158 | 0.251 | 0.369 | 372.241 | 0.619 | 1.5 | |
| 900 | 1 | 695.208 | 0.124 | 0.832 | 721.084 | 0.086 | 2.2 |
| 10 | 836.635 | 0.257 | 0.448 | 585.873 | 0.620 | 1.9 | |
| 25 | 873.508 | 0.343 | 0.489 | 512.182 | 0.730 | 1.6 | |
| 850 | 1 | 990.674 | 0.214 | 0.312 | 976.117 | −14.271 | 1.4 |
| 10 | 1098.662 | 0.247 | 0.736 | 908.623 | 0.976 | 2.2 | |
| 25 | 1210.014 | 0.361 | 0.704 | 983.583 | 0.835 | 2.2 |
| Parameters | Values or Equations |
|---|---|
| Strain rate sensitivity m | 4.32 × 10⁻⁴T – 0.4276 |
| Temperature sensitivity A | A1 = 5301.8 (comparison) A2 = 9108.2 (applied) |
| Work hardening coefficient n | |
| Critical strain | |
| Optimized plastic modulus F1* | 636.4 |
| Optimized steady-state stress F3* | 451.1 |
| Reference temperature T* (K) | 1223 |
Publisher’s Note: MDPI stays neutral with regard to jurisdictional claims in published maps and institutional affiliations. |
© 2021 by the authors. Licensee MDPI, Basel, Switzerland. This article is an open access article distributed under the terms and conditions of the Creative Commons Attribution (CC BY) license (https://creativecommons.org/licenses/by/4.0/).
Share and Cite
Park, H.-W.; Kakiuchi, S.; Kim, K.; Yanagida, A.; Yanagimoto, J. Constitutive Equation for Flow Stress in Superalloy 718 by Inverse Analysis under Hot Forming in a Region of Precipitation. Crystals 2021, 11, 811. https://doi.org/10.3390/cryst11070811
Park H-W, Kakiuchi S, Kim K, Yanagida A, Yanagimoto J. Constitutive Equation for Flow Stress in Superalloy 718 by Inverse Analysis under Hot Forming in a Region of Precipitation. Crystals. 2021; 11(7):811. https://doi.org/10.3390/cryst11070811
Chicago/Turabian StylePark, Hyung-Won, Sosei Kakiuchi, Kyunghyun Kim, Akira Yanagida, and Jun Yanagimoto. 2021. "Constitutive Equation for Flow Stress in Superalloy 718 by Inverse Analysis under Hot Forming in a Region of Precipitation" Crystals 11, no. 7: 811. https://doi.org/10.3390/cryst11070811