Abstract
In this study, nanosized ZnO and Zn1−xFexO powders were synthesized using the flame aerosol synthesis (FAS) method. The microstructure of the ZnO powder shows a significant difference with different precursor concentrations. By adding Fe to the precursor, nanosized Zn1−xFexO powder (x = 0~0.1) can be easily fabricated. The phase formation, microstructure, and infrared absorption properties were systematically investigated by XRD, SEM, TEM, and IR. With the substitution of Fe into the Zn site, lattice distortion occurred, resulting in excellent infrared absorption properties. Compared to other conventional synthesis methods, the FAS method has the advantages of high yield, high crystallinity, and low cost; furthermore, nanosized powder is easily obtained. The FAS method is believed to be one of the best choices for the large-scale production of ZnO and Zn1−xFexO powders.
1. Introduction
The United States was the first country to develop thermal stealth coatings. In 1967, the US Air Force commissioned Honeywell Inc. to research diffuse reflection infrared reflective coatings. In the mid-1970s, as the performance of infrared detectors continued to improve, the US Army accelerated the development of thermal stealth coatings, focusing on improving army standard camouflage coatings that were only suitable for use in the visible light and near-infrared bands. With the advancement of infrared detection technology, the speed of infrared stealth materials has increased significantly. Low-infrared emissivity coatings are commonly used stealth materials. Therefore, research and exploration into low-infrared emissivity fillers is essential.
The development of nanotechnology has provided the technical foundation and material reserves for nano-stealth coatings, which will promote the development of nano-stealth coatings to a higher level. Nano-doped semiconductor material fillers are a new type of infrared/microwave-compatible stealth material, and research into the use of these material fillers in infrared low radiation and microwave absorbing materials has been gradually increasing. Doped semiconductor materials are composed of metal oxides (hosts) and dopants (carrier donors). Among these materials, ZnO is one of the most promising candidates owing to its high infrared absorption. At present, the preparation of low-infrared emission doped ZnO mainly utilizes microwave methods [1], coprecipitation [2], solid-state reactions [3], hydrothermal [4], and sol-gel methods [5].
Flame aerosol synthesis (FAS) is a one-step synthesis of high-purity materials that allow precise control over particles and composition [6]. The FAS method is not a conventional method but has the significant advantage of scale-up capability, providing tens or even hundreds of grams per minute. The fabrication of multiple metal oxides such as Al2O3 [7], SiO2 [8], TiO2 [9], V2O5 [10], Mn2O3 [11], and Fe2O3 [12], and YAlO3 [13,14] has been investigated. Both pure and doped ZnO were also fabricated using the FAS method [15,16,17,18,19,20,21,22,23]. However, none of the previous studies focused on the infrared absorption properties of doped ZnO fabricated by the FAS method. In this study, we synthesized ZnO and Zn1−xFexO powders using the FAS method. The crystallinity, microstructure, and infrared absorption of the samples were systematically investigated.
2. Materials and Methods
ZnO and Zn1−xFexO powders were prepared by the FAS method using a homemade co-flow diffusion flame burner, as shown in Figure 1. A water-based solution was used as the precursor. Zinc nitrate hexahydrate (Zn(NO3)2•6H2O, Aladdin, purity 99%, CAS: 10196-18-6) and iron(III) nitrate nonahydrate (Fe(NO3)3•9H2O, Aladdin, purity 99.9%, CAS: 7782-61-8) were dissolved in water. In the ZnO sample, the cation concentration, only Zn, was 0.1 mol/L and 0.2 mol/L. In the Zn1-xFexO sample, the cation concentration of Zn+Fe was 0.1 mol/L. In the Zn1−xFexO, the Fe doping amount varied from 0 to 0.1, with a total of six samples. For complete dissolution, all precursor solutions were magnetically stirred for 1 h at 20 °C. The liquid precursor solution was nebulized using a medical nebulizer. Precursor droplets were dispersed by O2. Both the O2 and the methane supported the basal flame with flow rates of 1.6 L/min and 4.8 L/min, respectively (gas pan gas purity > 99%). The flame was enclosed with a 40 cm long quartz glass tube with an inner diameter of 100 mm. After synthesis, the powder attached to the quartz tube was scraped off.
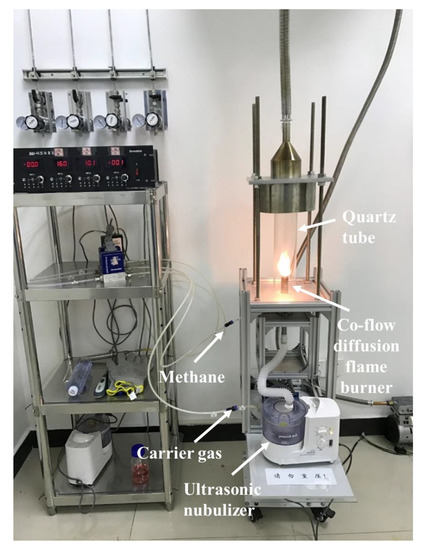
Figure 1.
Photograph of the flame aerosol synthesis equipment.
X-ray diffraction (XRD; Advanced D-8, Bruker, Karlsruhe, Germany) was used to detect the phase formation of the product powder. The crystal lattice of Zn1−xFexO was calculated from the XRD results by using the software Fullprof Suite TooBar (open source software) with the conventional Rietveld refinement process. The grain size of the Zn1−xFexO was calculated by using the Scherrer formula [24]. The crystallinity of the ZnO was evaluated by the full width half maximum (FWHM) of the main peak [25]. The transmission electron microscopy (TEM; G2 F20, FEI, Hillsboro, USA) was used to examine the microstructures of ZnO, and the EDS (Energy Dispersive X-Ray Spectrum, GENESIS, EDAX, Pleasanton, USA) in Scanning electron microscopy (SEM; QUANTA FEG450, FEI, Hillsboro, USA) was used to examine the microstructures of Zn1−xFexO. The infrared emission property was measured via Fourier transform infrared spectrometer using an infrared emission wave range between 8–14 μm.
3. Results
Figure 2 shows the XRD results of ZnO powder with different precursor concentrations. It was found that both samples had a pure ZnO phase without any other peaks (PDF#89-0511). However, the 0.1 mol/L precursor concentration sample had a much higher peak intensity than the 0.2/L sample, and both samples were measured under the same conditions. Moreover, the FWHM values of the ZnO (100) and (101) peak was used to evaluate the crystallinity. The FWHM values of (100) and (101) peaks of 0.1/L sample are 0.28°/0.26°, and 0.40°/0.39° for 0.2/L sample, respectively. Thus, the low peak intensity and large FWHM indicate that the 0.2 mol/L sample had a much worse crystallinity. To obtain good infrared absorption results, the crystallinity of ZnO or Zn1−xFexO should be as high as possible.
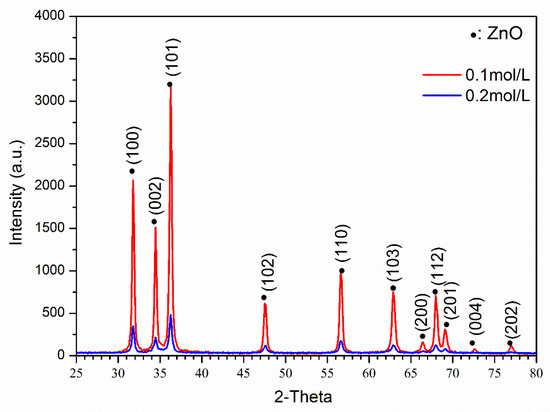
Figure 2.
XRD results of ZnO powders with different precursor solution concentrations.
Figure 3 shows TEM images of ZnO powders with different precursor concentrations, demonstrating a significant difference in the microstructures of the samples. Both samples have two types of particles: large spheres and small particles. This shows that both the liquid–particle route (large sphere) and gas–particle route (small particles) exited during FAS [6]. However, the spheres were hollow in the 0.1 mol/L precursor concentration sample but solid in the 0.2 mol/L sample. More importantly, as shown in Figure 3c,d, most of the small particles in the 0.1 mol/L sample have a rod-like shape. However, none of the particles in the 0.2 mol/L sample showed such a shape. Moreover, the particle size in the 0.2 mol/L sample was also significantly larger than that in the 0.1 mol/L sample.

Figure 3.
TEM images of the ZnO powders with different precursor solution concentrations (a,c) 0.1 mol/L; (b,d) 0.2 mol/L.
Combined with the XRD results, it is believed that both the microstructure and crystallinity differences arise due to different concentrations. A higher concentration means more solute in every individual droplet after nebulization. There are two different routes during FAS; thus, the presence of more solute will cause distinct differences in the microstructures. Some of the droplets retained the liquid and formed sphere-like particles. When the concentration was not high enough, in the final product, ZnO only existed on the surface of the sphere-like particles, which were hollow spheres in the 0.1 mol/L sample. After the concentration reached a high level, the spherical particles became solid. The other droplets evaporated to gas, and all the final products were solid particles. When the concentration was low, the particles were small, which may be due to the rod-like crystal structure of the particles. In contrast, a high concentration led to the formation of large and round particles. Simultaneously, regardless of the precursor concentration, the enthalpy change in each droplet was the same because the FAS was the same. When the concentration is high, there is more ZnO in each droplet, which causes the average energy per crystal cell of ZnO to be low. Low energy during synthesis can cause worse crystallinity. The better crystallinity and small particle size are beneficial to infrared absorption, and therefore the 0.1 mol/L precursor solution was chosen for Zn1−xFexO synthesis.
Figure 4a shows the XRD results of the Zn1−xFexO powders with different Fe contents. Until the concentration of Fe reached 0.1 mol/L, phase formation did not change significantly. The phase formation of most of the samples was kept as pure ZnO. The ZnFe2O4 only appeared in Zn0.9Fe0.1O, indicating excessive Fe addition. With the addition of Fe, the peak of ZnO shifted to a high angle, as shown in Figure 4b. Table 1 shows the crystal parameters calculated from the XRD results. It can be seen that both the a and c axis parameters decrease with the increase in Fe concentration. Both the peak shift and the change in axis parameters confirm the substitution of Fe3+ with Zn2+ in the ZnO crystal cell, as shown in Figure 4c. The cation radii of Fe3+ and Zn2+ are 0.645 Å and 0.74 Å, respectively. When the substitution occurred, the ZnO cell shrank. During the substitution of Fe on the Zn, there will also be oxygen vacancy. However, the fine crystal structure and the effect of the oxygen vacancy on the infrared absorption still need further investigation. In contrast, the grain size calculated from the XRD results does not show an apparent difference. The FWHM values of (101) peak also do not have a significant change. It shows that the Fe doping only obviously affects the lattice parameter of ZnO.
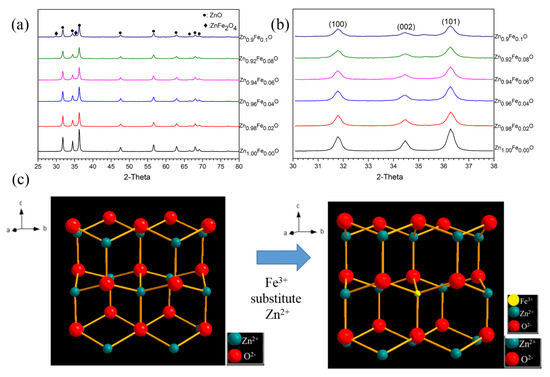
Figure 4.
(a,b) XRD results of the Zn1−xFexO powders with different Fe amounts; (c) a sketch of the Zn(Fe)O crystal structure.

Table 1.
The lattice parameters and grain size of the Zn1−xFexO powders.
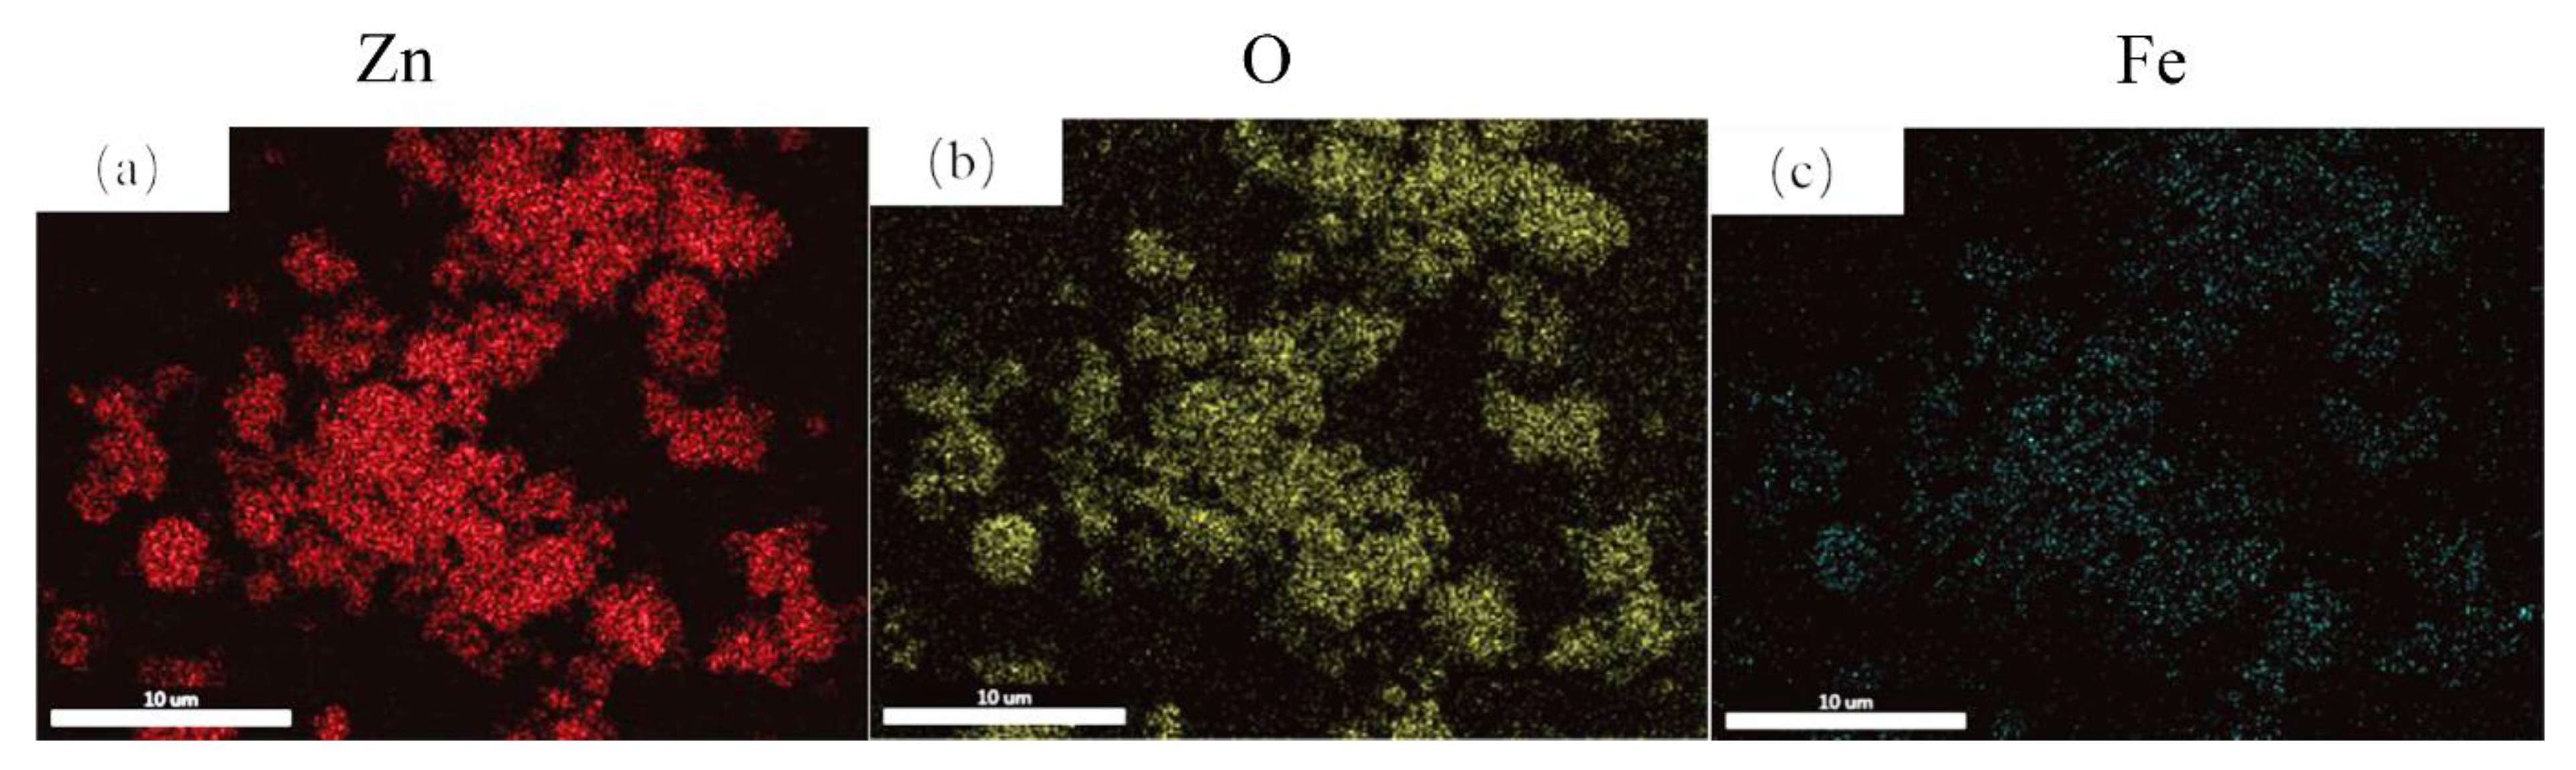
As shown in Figure 4, Fe doping can significantly change the lattice parameters of ZnO and may further affect infrared absorption. However, it is worth further confirming the actual Fe doping in the sample after the FAS process to test if there is element loss or segregation. Figure 5 shows the EDS mapping results of the Zn0.92Fe0.08O powder. There is no apparent segregation from the mapping results, which shows that Fe doping is homogenous. The statistics atomic ratio between Zn and Fe from the EDS is 91.7:9.3, near the Zn0.92Fe0.8O. However, it is worth mentioning that the EDS is not very accurate in characterizing the element ratio quantitatively. So furthermore, accurate characterization is still needed.
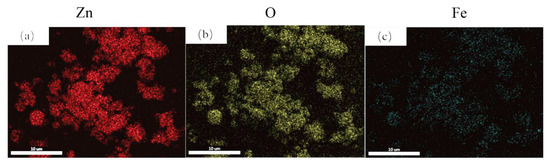
Figure 5.
The EDS mapping of the Zn0.92Fe0.08O powder. (a) Zn element distribution (b) O element distribution (c) Fe element distribution.
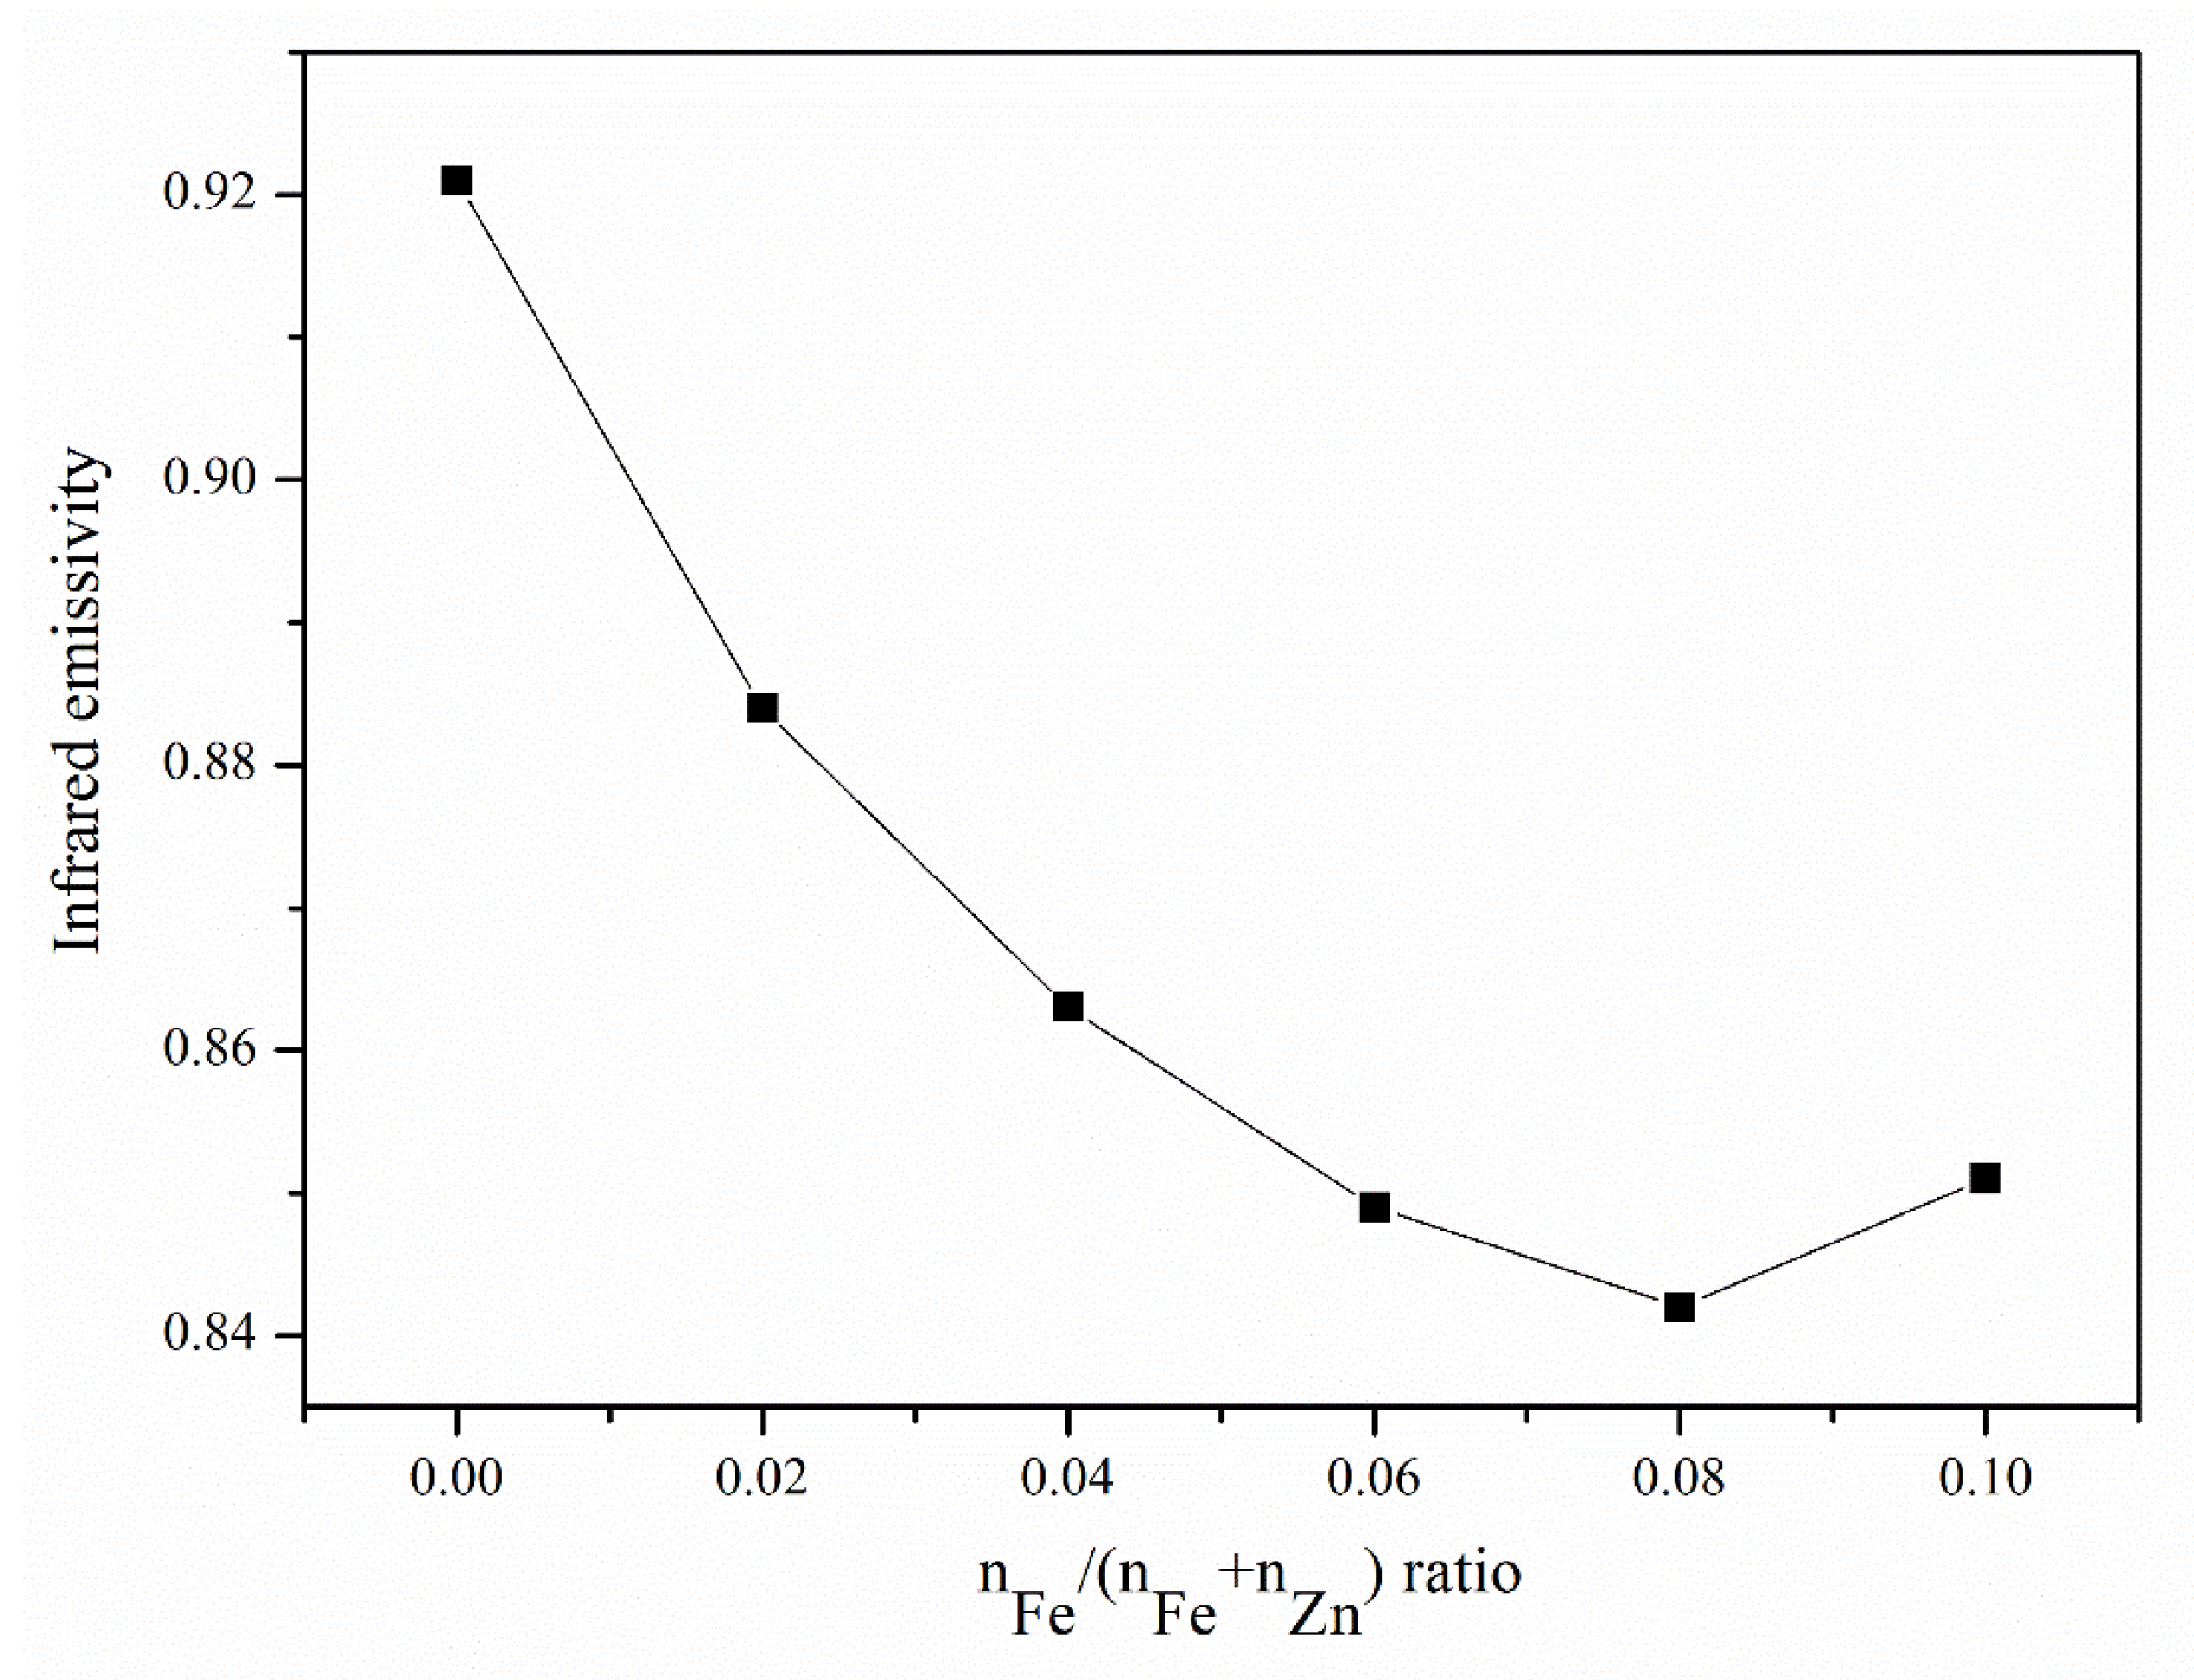
Figure 6 shows the infrared emissivity results of Zn1−xFexO powders with different Fe amounts. Infrared emission was significantly suppressed with increasing Fe content. Because the samples’ microstructures are the same, the apparent difference in the infrared emission originates from the crystal structure. Both Fe-O and Zn-O are ionic crystals, and when Fe3+ is substituted with Zn2+, lattice deformation occurs in the ZnO crystal cell. Lattice deformation releases free electrons, which can absorb infrared waves. The more the amount of Fe added, the greater is the substitution of Zn. In addition, more lattice deformation caused high infrared absorption or low infrared emission. When Fe addition reached its threshold, the second phase of the ZnFe2O4 phase appeared, not contributing to the infrared absorption. Although the infrared absorption property is shown here, more characterization such as photoluminescence and light spectrum absorption spectroscopy is essential to do in future work.
Figure 6.
Infrared emissivity results of the Zn1−xFexO powders with different Fe amounts.
4. Discussion
The previous section explains that it is possible to synthesize Zn1−xFexO powder with high infrared absorption using the FAS method. This section briefly compares the FAS method with other methods reported in reference [2,3,4,5]. Table 2 summarizes the FAS method and the other four synthesis methods used to produce doped ZnO powder. In this evaluation, the crystallinity data is coming from the XRD results, which is qualitative. The yield data comes from the precursor amount of literature or common sense of the different synthesis methods. The particle size comes from the SEM or TEM images. The biggest advantage of the FAS method is its yield. The solid reaction method can fabricate tens of grams per hour in the lab, and the other three chemical methods only produce grams or even milligrams per hour. The FAS method can easily produce tens of grams per hour in our lab and kilograms per hour in large facilities [11]. An overwhelmingly high yield can dramatically decrease the production cost. In addition, FAS uses the simplest precursor, which lowers the cost of the raw materials. With the exception of the solid reaction method, which has a high-temperature process, most chemical methods do not produce good crystallinity and need another post-calcination process after the initial synthesis. In contrast, owing to the instantaneous high temperature of the FAS method, the crystallinity of the powder with a low precursor concentration and no further heat treatment can compete with that produced using the chemical method with a post-calcination process. Removing the calcination process can further decrease the fabrication cost. The FAS method can easily fabricate nanosized powders; however, other conventional chemical methods require dispersants to control the agglomeration. In summary, the FAS is the best method to fabricate nanosized powders with high yield and low cost.
Table 2.
Summary of the different synthesis methods of doped ZnO powder.
In addition to the apparent advantages mentioned above, the FAS method also has shortcomings. The first and most crucial limitation is that the FAS method requires an uncommon and homemade flame burner. Owing to the unusual equipment, the FAS method is still not widely used. Furthermore, combustible gas is inevitable in the FAS method, which causes safety issues, and is a severe problem. FAS has not been as widely investigated as other methods, and the reaction in the FAS method is completed in a very short time as it uses an extremely high-temperature flame. The reaction mechanism of the FAS method is still a black box. Therefore, it is not possible to provide specific directions to control the microstructure of the product powder.
5. Conclusions
In this study, we investigated the synthesis of ZnO and Zn1-xFexO (x = 0~0.1) powders using the FAS method. For pure ZnO, according to the full width half maximum (FWHM) value of the main peak, the precursor solution concentration significantly affected the crystallinity and microstructure. The low concentration resulted in a high crystallinity and small particle size. When Fe was added to ZnO, the second phase of ZnFe3O4 appeared only in the Zn0.9Fe0.1O sample. Along with the increase in the Fe amount, both the a- and c-axis parameters of ZnO decreased, indicating the substitution of Fe at the Zn site. The heavily doped Zn1−xFexO powder showed excellent infrared absorption properties until the Fe amount reached 0.1 mol/L, when the second phase appeared. Compared with other conventional methods, the FAS is a promising method for the fabrication of nanosized powders with high yield and low cost. It can fabricate the size controllable nano ZnO and Zn1−xFexO powders in a yield of tens kilograms or even more per day. However, the FAS method still needs to solve the cost and security issue of the flame burner. Moreover, the infrared absorption properties of the nano ZnO and Zn1-xFexO powders need to be measured by more methods such as photoluminescence and light spectrum absorption spectroscopy.
Author Contributions
H.T. and T.Y. contributed to the sample preparation and most of the experiment. The L.W. contributed to the analysis of the results. The Z.Z. contributed to the measurement of TEM, supervision of the whole experiment, and the writing. All authors have read and agreed to the published version of the manuscript.
Funding
H.T. was supported by the National Natural Science Foundation of China (51806115). L.W. was supported by the Key Research Program of Frontier Sciences (ZDBS-LY-JSC039) and the Youth Innovation Promotion Association of the Chinese Academy of Sciences (2020143). Z.Z. was supported by the Magnetic Resonance Union of the Chinese Academy of Sciences (2020GZL001).
Conflicts of Interest
The authors declare no conflict of interest.
References
- Wojnarowicz, J.; Chudoba, T.; Lojkowski, W. A Review of Microwave Synthesis of Zinc Oxide Nanomaterials: Reactants, Process Parameters and Morphologies. Nanomaterials 2020, 10, 1086. [Google Scholar] [CrossRef]
- Sun, X.; Jia, Y.; Liu, X.; Wang, J.; Xu, J.; He, X.; Fu, C.; Liu, S. Preparation, dielectric property and infrared emissivity of Fe-doped ZnO powder by coprecipitation method at various reaction time. Ceram. Int. 2014, 40, 5307–5311. [Google Scholar]
- Zhang, S.; Cao, Q.; Yao, Y. Synthesis and infrared emissivities of Mn-doped ZnO:Co powders. Infrared Phys. Technol. 2013, 61, 1–4. [Google Scholar] [CrossRef]
- Wang, Z.; Zhang, Y.; Mao, J.; Wang, J. Study on Cerium Doped Flower-like ZnO Microcrystaline Preparation and Its Microwave Absorbing Properties. Adv. Mater. Res. 2014, 834–836, 12–17. [Google Scholar] [CrossRef]
- Zhang, B.; Lu, C.; Li, H. Improving microwave adsorption property of ZnO particle by doping graphene. Mater. Lett. 2014, 116, 16–19. [Google Scholar] [CrossRef]
- Li, S.; Ren, Y.; Biswas, P.; Stephen, D. Flame aerosol synthesis of nanostructured materials and functional devices: Processing, modeling, and diagnostics. Prog. Energy Combust. Sci. 2016, 55, 1–59. [Google Scholar] [CrossRef] [Green Version]
- Strobel, R.; Baiker, A.; Pratsinis, S.E. Aerosol flame synthesis of catalysts. Adv. Powder Technol. 2006, 17, 457–480. [Google Scholar] [CrossRef]
- Huang, J.; Jiang, Y.; van Vegten, N.; Hunger, M.; Baiker, A. Tuning the support acidity of flame-made Pd/SiO2-Al2O3 catalysts for chemoselective hydrogenation. J. Catal. 2011, 281, 352–360. [Google Scholar] [CrossRef]
- Wang, J.; Li, S.; Yan, W.; Tse, S.; Yao, Q. Synthesis of TiO2 nanoparticles by premixed stagnation swirl flames. Proc. Combust. Inst. 2011, 33, 1925–1932. [Google Scholar] [CrossRef]
- Sel, S.; Duygulu, O.; Kadiroglu, U.; Machin, N. Synthesis and characterization of nano-V2O5 by flame spray pyrolysis, and its cathode performance in Li-ion rechargeable batteries. Appl. Surf. Sci. 2014, 318, 150–156. [Google Scholar] [CrossRef]
- Wagloehner, S.; Nitzer-Noski, M.; Kureti, S. Oxidation of soot on manganese oxide catalysts. Chem. Eng. J. 2015, 259, 492–504. [Google Scholar] [CrossRef]
- Zhang, Z.; Tian, H.; Li, S.; Wang, Q. Synthesis of ultra-fine iron powder by combining the flame aerosol synthesis and post-reduction. J. Mater. Res. 2019, 34, 3964–3974. [Google Scholar] [CrossRef]
- Wu, Z.; Zhang, Y.; Zhao, X.; Wang, H.; Li, S. Dual liquid/vapor-fed flame synthesis for the effective preparation of SiO2@YAlO3:Nd3+ nanophosphors. Proc. Combust. Inst. 2021, 38, 1299–1307. [Google Scholar] [CrossRef]
- Wei, J.; Li, S.; Ren, Y.; Zhang, Y.; Stephen, T. Investigating the role of solvent formulations in temperature-controlled liquid-fed aerosol flame synthesis of YAG-based nanoparticles. Proc. Combust. Inst. 2019, 37, 1193–1201. [Google Scholar] [CrossRef]
- Height, M.; Pratsinis, S.; Mekasuwandumrong, O.; Praserthdam, P. Ag-ZnO catalysts for UV-photodegradation of methylene blue. Appl. Catal. B Environ. 2006, 3, 305–312. [Google Scholar] [CrossRef]
- Pawinrat, P.; Mekasuwandumrong, O.; Panpranot, J. Synthesis of Au-ZnO and Pt-ZnO nanocomposites by one-step flame spray pyrolysis and its application for photocatalytic degradation of dyes. Catal. Commun. 2009, 10, 1380–1385. [Google Scholar] [CrossRef]
- Liewhiran, C.; Phanichphant, S. Doctor-bladed thick films of flame-made Pd/ZnO nanoparticles for ethanol sensing. Curr. Appl. Phys. 2008, 8, 336–339. [Google Scholar] [CrossRef]
- Kruefu, V.; Liewhiran, C.; Wisitsoraat, A.; Phanichphant, S. Selectivity of flame-spray-made Nb/ZnO thick films towards NO2 gas. Sens. Actuators B Chem. 2011, 156, 360–367. [Google Scholar] [CrossRef]
- Kilian, D.; Polster, S.; Vogeler, I.; Jank, M.; Frey, L.; Peukert, W. Pulsed direct flame deposition and thermal annealing of transparent amorphous Indium Zinc oxide films as active layers in field effect transistors. ACS Appl. Mater. Interfaces 2014, 6, 12245–12251. [Google Scholar] [CrossRef] [PubMed]
- Xu, F.; Liu, X.; Tse, S.; Cosandey, F.; Kear, B. Flame synthesis of zinc oxide nanowires. Chem. Phys. Lett. 2007, 449, 175–181. [Google Scholar] [CrossRef]
- Widiyastuti, W.; Wang, W.; Purwanto, A.; Lenggoro, I.; Okuyama, K. A pulse combustion-spray pyrolysis process for the preparation of nano- and submicrometer- sized oxide particles. J. Am. Ceram. Soc. 2007, 90, 3779–3785. [Google Scholar] [CrossRef]
- Halfer, T.; Zhang, H.; Mädler, L.; Rezwan, K. Ceramic mask-assisted flame spray pyrolysis for direct and accurate patterning of metal oxide nanoparticles. Adv. Eng. Mater. 2013, 15, 773–779. [Google Scholar] [CrossRef]
- Liewhiran, C.; Phanichphant, S. Effects of palladium loading on the response of a thick film flame-made ZnO gas sensor for detection of ethanol vapor. Sensors 2007, 7, 1159–1184. [Google Scholar] [CrossRef] [Green Version]
- Patterson, A. The Scherrer Formula for I-Ray Particle Size Determination. Phys. Rev. 1939, 56, 978–982. [Google Scholar] [CrossRef]
- Toyoda, M.; Nanbu, Y.; Nakazawa, Y.; Hirano, M.; Inagaki, M. Effect of crystallinity of anatase on photoactivity for methyleneblue decomposition in water. Appl. Catal. B Environ. 2004, 49, 227–232. [Google Scholar] [CrossRef]

Publisher’s Note: MDPI stays neutral with regard to jurisdictional claims in published maps and institutional affiliations. |
© 2021 by the authors. Licensee MDPI, Basel, Switzerland. This article is an open access article distributed under the terms and conditions of the Creative Commons Attribution (CC BY) license (https://creativecommons.org/licenses/by/4.0/).