Article

On Sampling Discrete Orientations from XRD for Texture Representation in Aggregates with Varying Grain Size

Institute of Metal Forming, RWTH Aachen University, D-52072 Aachen, Germany
*
Author to whom correspondence should be addressed.
Crystals 2021, 11(9), 1021; https://doi.org/10.3390/cryst11091021
Submission received: 18 June 2021 / Revised: 12 August 2021 / Accepted: 21 August 2021 / Published: 25 August 2021
(This article belongs to the Special Issue Micromechanical Modelling and Its Applications to Polycrystals)

Abstract

:
The amount of orientation difference of crystallites, i.e., the texture in a metallic polycrystal governs, plastic anisotropy, electrical and magnetic properties of the material. For simulating the microstructure and texture evolution during forming processes, representative volume elements (RVEs) often generated based on experimental measurements are commonly used. While the grain size and morphology of polycrystals are often determined via light-optical microscopy, their texture is conventionally analyzed through diffraction experiments. Data from these different experiments must be correlated such that a representative set of sampled orientations is assigned to the grains in the RVE. Here, the concept Texture Sampling through Orientation Optimization (TSOO) is introduced, where based on the intensity the required number of orientations is first assigned to the grains of the RVE directly. Then the Bunge–Euler angles of all orientations are optimized in turn with respect to the experimental measurements. As orientations are assigned to grains of variable size during optimization, the compatibility between inhomogeneity in the microstructure and texture is inherently addressed. This method was tested for different microstructures of non-oriented electrical steels and showed good accuracy for homogenous and inhomogeneous grain size distributions.

1. Introduction and State of the Art

Many properties of polycrystalline materials such as elastic and plastic response, electrical conductivity, magnetic permeability, etc., depend upon the crystallographic texture, i.e., the orientation of individual crystallites with respect to the bulk material geometry [1]. These crystallite orientations are commonly represented by an orientation distribution function (ODF) [2]. Experimentally, an ODF is constructed by measuring orientations in diffraction experiments like electron backscatter diffraction (EBSD) or X-ray diffraction (XRD). Typically, from these experiments, thousands to millions of data points are obtained for the construction of the ODF. The ODF f g signifies the probability of a volume fraction (dV/V) in the total polycrystal taken by the crystallites of orientations between g and dg,
d V V = f g d g
where an orientation g is defined with a set of Euler angles g = φ 1 , ϕ , φ 2 within the Euler space 0 ,     2 π , 0 ,     π ,   0 ,     2 π .
Nowadays, numerical simulation tools such as crystal plasticity finite element methods (CP-FEM) [3] or visco-plastic self-consistent methods (VPSC) [4] have become popular and powerful tools in microstructure modeling and to predict mechanical properties during deformation. However, only CP-FEM simulations can take into account microstructure and interactions on the local grain level, for example for tracking geometrically necessary dislocation densities during deformation [5]. Similarly, only CP-FEM simulations can predict certain material properties, e.g., magnetic properties of electrical steels [6] that, along with texture, also depend on microstructure features as grain size and grain morphology. Consequently, the current study is restricted to CP-FEM for microstructure modeling.
As CP-FEM is computationally expensive, modeling the microstructure of the entire sample is infeasible. The representative volume element (RVE) replicating the initial state of the material is used instead. RVEs are reference cubes, that are smaller than the original sample, and where the typical morphological properties, i.e., grain size, texture, etc., are statically represented, and at the same time, the volume average of stress, and strain are identical to the original sample [7]. As the stress–strain response of the RVE is dependent on the morphological properties, these quantities must be precisely represented in the RVE. Grain size and texture are considered two of the most important influencing factors [8].
As mentioned, one of the methods to measure texture is EBSD. So-called Kikuchi patterns, generated from this diffraction experiment are transformed to easily readable formats such as orientation maps where every crystal direction is color-coded. Points on the orientation map with the same color correspond to a similar crystal normal direction and individual grains are identified as regions of the sample that have the same orientation within a small tolerance. From this orientation data, kernel density estimate [9] methods are used where bell-shaped functions are superimposed on the orientations and a uniquely defined continuous ODF function is extracted. Thus, in EBSD, the grain size data, and orientation information can be obtained from a single experiment. These orientation maps can be directly transferred to a 2D RVE. However, since these orientation maps in EBSD are 2-D, constructing a 3-D RVE with this data is infeasible. Data from different layers of the sample would therefore be required, obtainable only via abrasive sample polishing which is a very tedious process. Alternatively, 3-D RVEs are reconstructed from EBSD data based on statistical data drawn from the grain size distribution and the orientation map [10]. As the grains in the RVE only statistically represent the measured data, in this case, the orientations measured in EBSD cannot be directly used. A smaller number of orientations must be chosen and assigned to the grains in the RVE, while the RVE must still statistically represent the ODF obtained from measurements.
Alternatively, a commonly used and less expensive method of measuring texture is through XRD. The intensities in the diffraction figures obtained from these experiments correspond to the volume fraction of the grains. Diffraction figures corresponding to different lattice planes can then be interpreted to obtain the volume fraction of the specimen corresponding to an orientation. These are called pole figures in the literature [11]. Pole figures from different lattice planes are then complied to an ODF by pole figure inversion methods [12]. In contrast to EBSD, here, no spatial information of the grains is available, and therefore additional light optical microscopy is necessary to obtain grain size data. Again, for RVE orientations corresponding to the individual grains are required and a co-relationship between them must be established.
Therefore, for both experimental methods, the first challenge is to select orientations for the RVE grains. As mentioned, this orientation selection must be carefully performed so that the ODF of the RVE also statistically represents the measured ODF. Since intensities in the ODF represents the volume fraction corresponding to an orientation, a second challenge arises when assigning the orientations to the grains. Hence, the assignment must also consider the grain size distribution in the RVE, which is especially important for deformation microstructure developing during forming processes. These processes often induce inhomogeneous grain size due to a temperature profile in the workpiece during forming. The process of this selection and assignment is referred to in the literature as “texture sampling” [13]. Available literature for this sampling can be categorized into two types and these are summarized below.
In the first category of methods, the sampling of orientations is performed assuming that the grains in the microstructure are homogenous and therefore every orientation in the sampling is given equal weight. Therefore, orientation assignment is independent of the grain sizes, i.e., sampled orientations are assigned to any grain in the RVE because they all have the same equal volume fraction. Eisenlohr et al. [13] proposed a “Hybrid Integer Approximation method” (Hybrid IA) which was developed as a combination of a probabilistic sampling method developed by Toth et al. [14], and a deterministic “Integer Approximation (IA)” method proposed by Leffers et al. [15]. This method shows good reconstruction quality for strong, intermediate, and random textures. A very similar method was proposed recently by Biswas et al. [16]. As mentioned, these methods were developed for microstructures where the grain size distribution is homogeneous, e.g., annealed microstructures. In contrast, for typical inhomogeneous microstructures that developed due to the temperature profile in forming processes, the grain size data must also be respected during the assignment. When equally weighted orientations are assigned to a microstructure with inhomogeneous grains, the contribution of the texture intensity of the bigger grains in the RVE is much larger compared to the smaller grains. This then leads to an ODF with an unreasonably strong texture.
In the second category, orientation sampling is performed considering the inhomogeneity in the grain structure. Here, both orientation selection and sampling have to be performed in sync. Helming et al. [17] proposed a fitting procedure by dividing the Euler space into equal-distant grids. Weights on the grid centers are optimized by comparing the reconstructed ODF with the experimental ODF. Then, weights below a certain threshold are dropped to obtain the required number of orientations for the RVE. Schaeben et al. [18] also used a very similar approach. They used two different types of kernel functions in the density estimates, namely de la Valle´e Poussin kernels and Dirichlet kernel for fitting the weights. Lopez et al. [8] proposed an extended ODF, named grain size orientation distribution function (GSODF) which is a combination of grain size distribution and ODF. Firstly, grains (obtained from EBSD) are grouped according to their size, and an individual ODF for each group is calculated. Secondly, the grains in the RVE are grouped in a similar way. Finally, orientations are assigned to grains in each group by only selecting orientations from the corresponding ODF group at random. This method is particularly precise when considering a large number of grains (~15,000) in the RVE but is dependent on EBSD data where the orientation of each grain is known. In the method proposed by Melchior et al. [19], firstly equal weight orientations greater than the number of grains in the RVE are extracted using a probabilistic sampling method proposed by Toth et al. [14]. Then, these orientations are grouped into smaller clusters, where the mean orientation of each cluster is assigned to a grain in the RVE. The clusters are generated by a sorting procedure that also considers the grain size.
The current paper focuses on the second category of texture sampling methods, where the grain size inhomogeneity is considered. Here, a simple method is proposed named “texture sampling through orientation optimization (TSOO)” where initially through a deterministic approach a small set of orientations is obtained and directly assigned to the grains in the RVE taking into account their size. The orientations originally assigned to the grains are then optimized until they match the experimental ODF. Since the initial assignment of orientations in the RVE is based on grain size, an inhomogeneous microstructure can be inherently considered in this sampling method. The optimization procedure is implemented in Matlab 2018b, and for the generation of the ODFs from the sampled orientations the code is coupled with MTEX [20].
This paper is structured as follows: Section 2 describes the material and experimental framework. The texture sampling method (TSOO) is tested and validated using different non-oriented electrical steel samples. This material is first introduced and the details about the material characterization are given. Then, the actual texture sampling method is introduced where through an optimization approach the initial orientations are adjusted in order to match the experimental ODF. In Section 3, the results of the optimization procedure for homogenous and inhomogeneous microstructures are shown and the robustness of the method is tested. In Section 4, the sensitivity of the optimization approach to fluctuations in the initial state is analyzed by introducing noise to one of the use cases. Then, CP-FEM simulations are performed to analyze how the initial ODFs perform in numerical simulations of texture evolution. Finally, all the results are summarized and critically discussed.

2. Materials and Methods

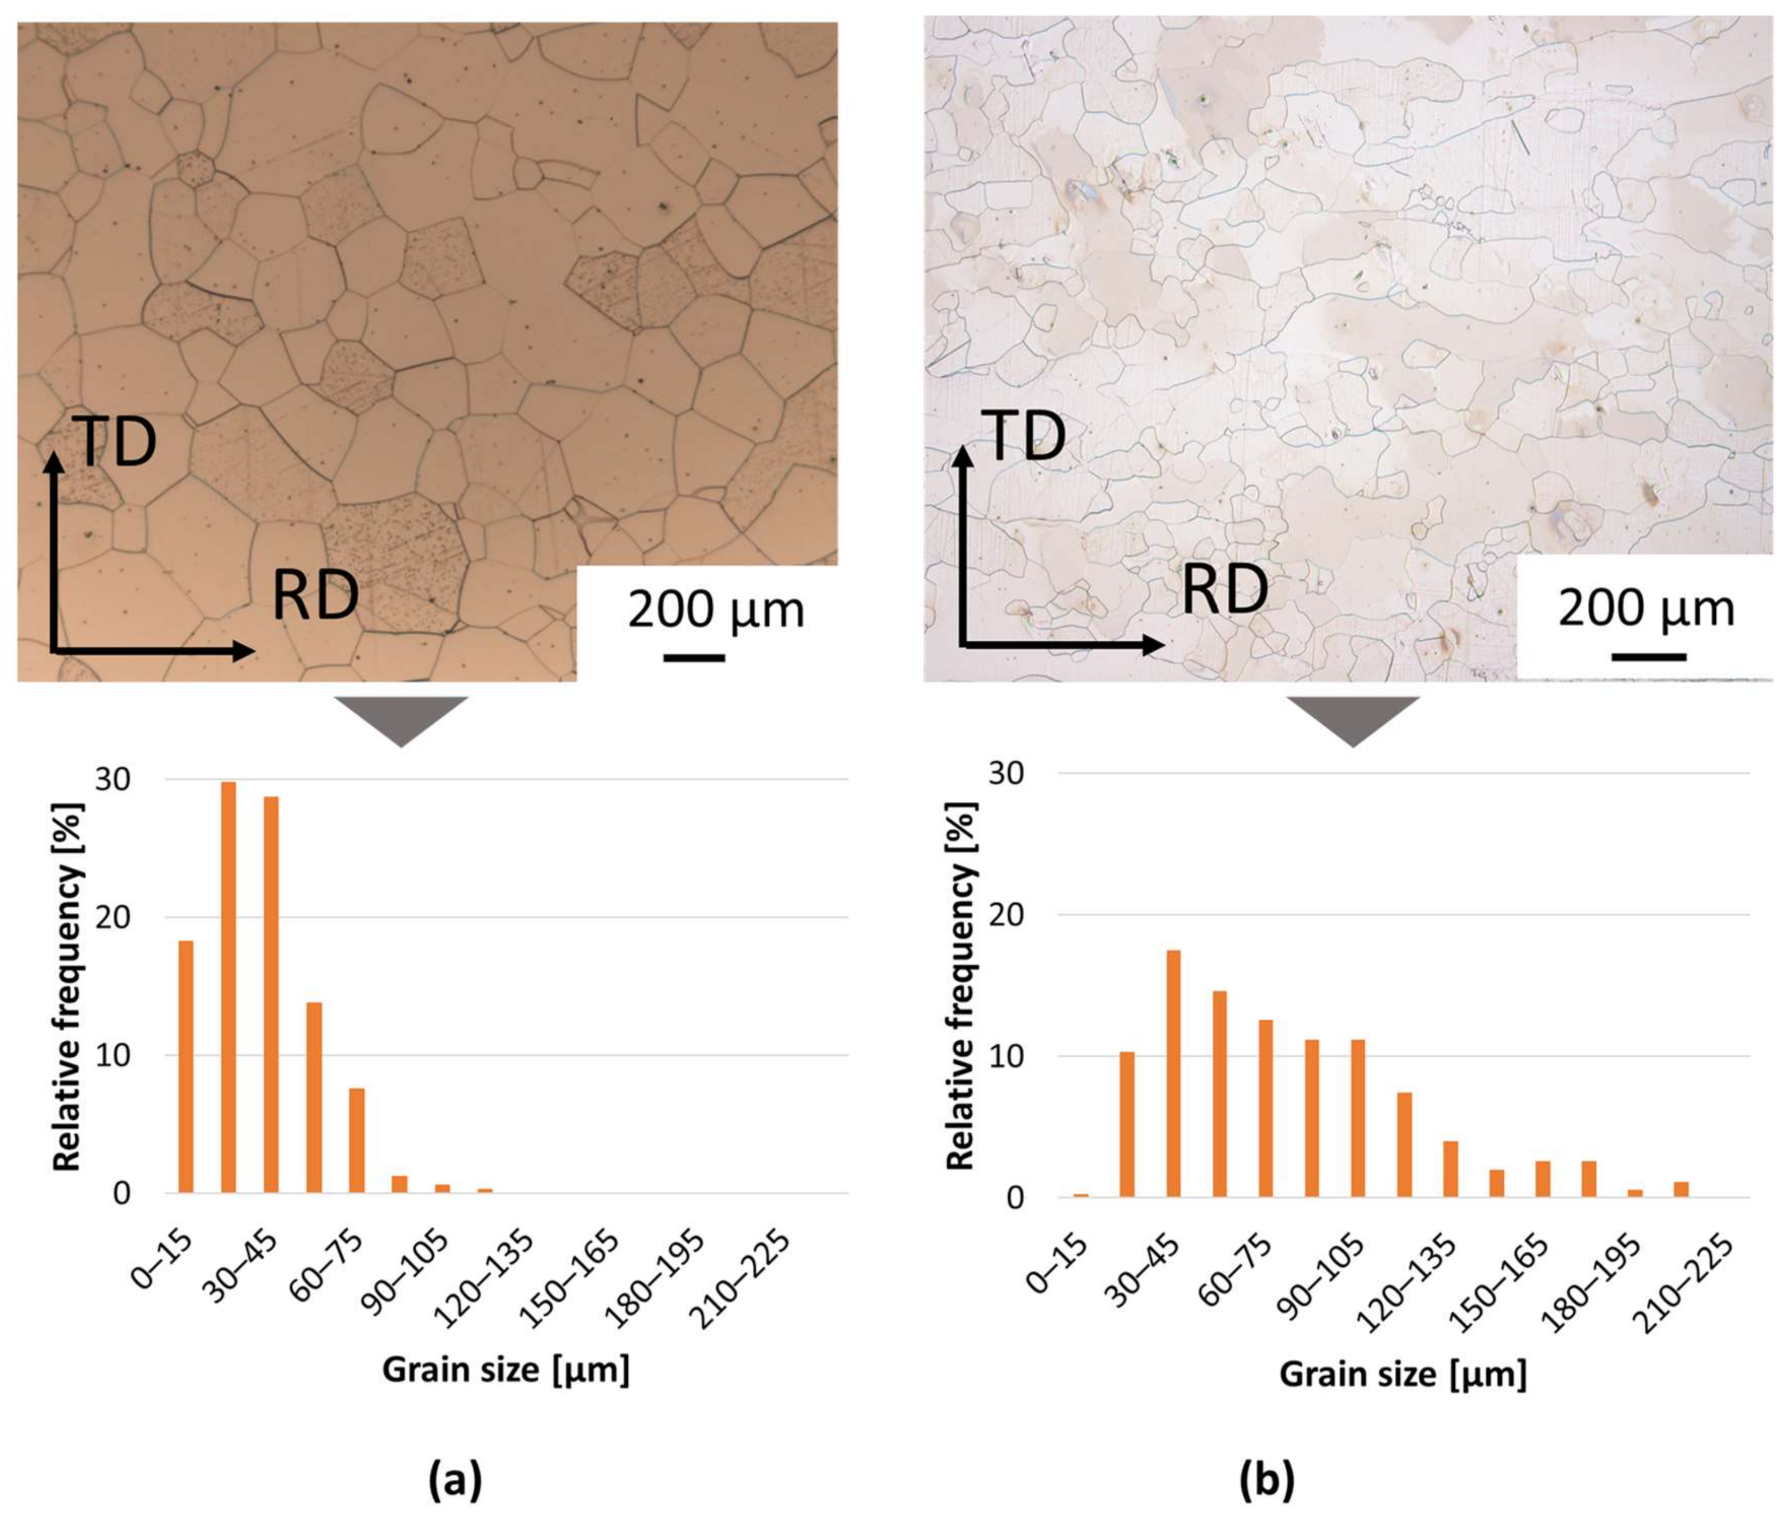
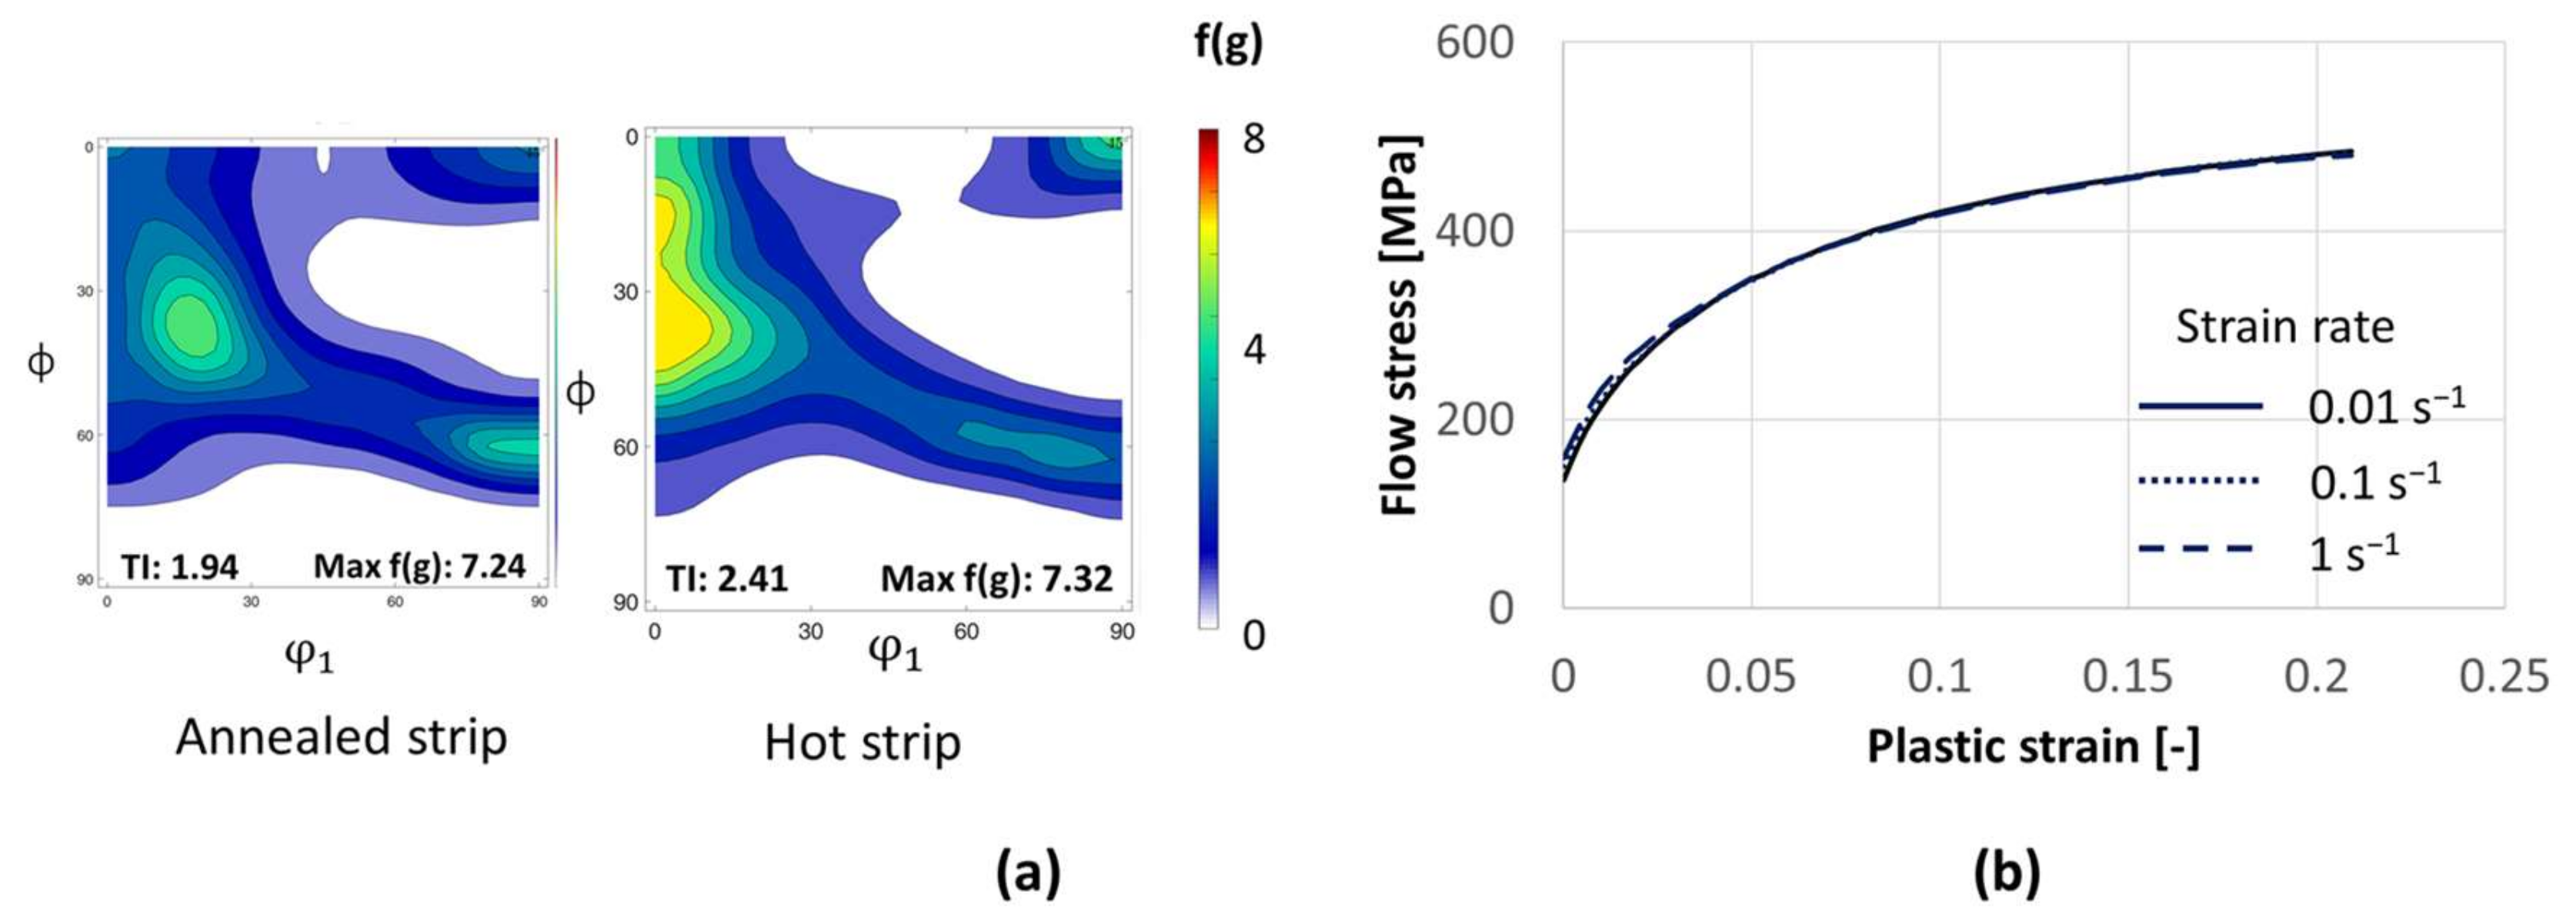
2.1. Materials and Materials Characterization
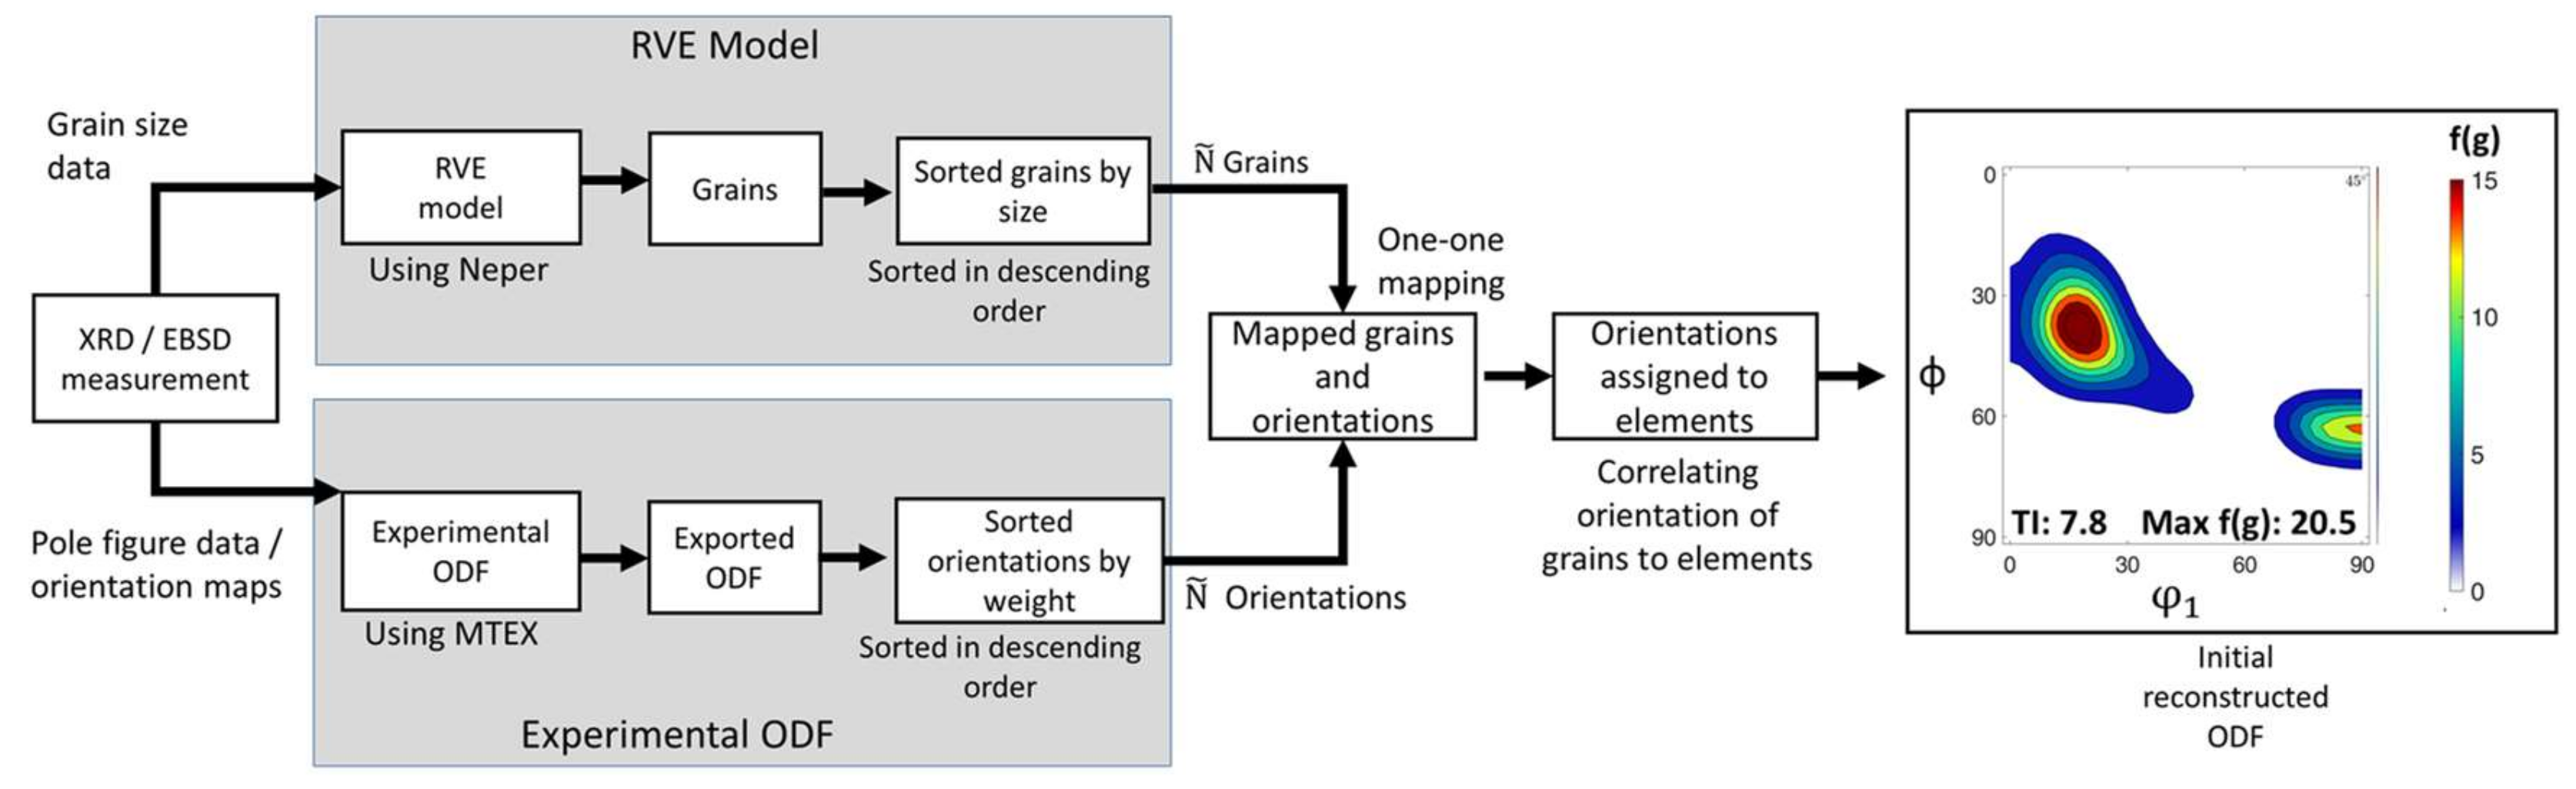
In this paper, ferritic (BCC) high silicon non-oriented (NO) electrical steel is chosen as a material for the investigation of texture sampling through TSOO. The excellent magnetic properties of such steels make it an ideal material for the core of electric motors and generators. However, these properties are highly dependent on both the grain size and grain morphology as well as the texture [6]. As this paper focuses on capturing both grain size distribution and texture in RVEs this material serves as an ideal example.
The typical steps during the processing of electrical steel sheets are hot rolling, cold or warm rolling, and then final annealing heat treatment. This paper samples microstructure and texture for both a 2.4 wt.% Si hot strip (hot rolled at 1030 °C) prior to warm rolling and a 3.2 wt.% Si annealed strip after hot rolling (at 1030 °C with subsequent furnace cooling), cold rolling (1 mm to 0.5 mm in six passes), and full recrystallization heat treatment (1000 °C for 60 s). The hot strip enables the assessment of the novel sampling method proposed in this paper under inhomogeneous conditions. Compared to the hot rolled strip the annealed strip possesses a relatively homogenous grain size, especially at its center. Therefore, it enables a comparison of the proposed sampling method with established sampling methods for homogenous grain size distributions. The full chemical composition of both strips is given in Table 1.
To analyze the center region, all strips were first ground to half their thickness. The micrographs and the grain size measurements of the hot strip were obtained at the Institute of Metal Forming (IMF), TU Bergakademie Freiberg, Germany while the micrographs and the grain size measurements of the annealed strip were obtained at the Institute of Physical Metallurgy and Metal Physics (IMM), RWTH Aachen University, Germany. The line-intercept method is used to determine the grain sizes in the RD-TD plane. Here, a set of parallel line segments are placed on the micrograph, and the number of times each line segment intercepts a grain boundary is counted and considered as the grain size. A minimum of 300 grains is measured for each sample.
The micrographs of the hot rolled and annealed strip as well as the corresponding grain size distribution are shown in Figure 1. The average grain size and standard deviation of the annealed strip is 33.2 µm and 18.76 µm, respectively, while it is 78.43 µm and 48.79 µm, respectively, for the hot strip, confirming the greater inhomogeneity in the hot strip compared to the annealed strip.
Texture measurements on the ground strips in the TD-RD plane were performed on the X-ray diffractometer “D8 Advance” (manufactured by Bruker Corporation, Billerica, MA, USA) at the IMM. The experimental ODF of the annealed and hot strip obtained via XRD is shown in Figure 2a. Due to the BCC crystal lattice structure and sample symmetry during rolling the ODF can be represented in the reduced Euler space 0° < (φ1, ϕ, φ2) < 90° and all the significant rolling texture components can be observed in the φ2 = 45° section. A clear difference in the ODF plots for the two strips can be observed, where the dominating intensity of the annealed strip is concentrated around φ1 = 20°, ϕ = 35°, φ2 = 45°, while the maximum intensity of the hot strip is along the α-fiber (<110>//RD).
Finally, flow curves of the hot strip were determined through stack layer compression tests on the servo-hydraulic testing machine “Servotest” (manufactured by Servotest Testing Systems Ltd, Surrey, UK) at the Institute of Metal Forming (IBF), RWTH Aachen University, Germany and are shown in Figure 2b. The material exhibits a very low strain rate sensitivity at 400 °C. These flow curves are later used to model the warm rolling process of the hot strip and to simulate the microstructure and texture evolution.

2.2. ODF Sampling

As discussed earlier, the texture sampling method can be broadly classified into orientation selection and orientation assignment and the base of this sampling is an RVE constructed from experimental data. RVE can be generated using different polycrystal generation toolboxes, e.g., Neper [21]. The input to such software is the intended number of grains in the RVE ( N ˜ ) and measured grain size distribution. The number of grains is chosen such that measured grain size data is reflected in the RVE and at the same time the computational effort to perform numerical simulations is minimal. Neper version 3.5.0 is used in this paper for the RVE creation.
The second step is the creation of ODF. For EBSD measurements the ODF creation is straightforward where kernel density estimations can be used. But in the current paper, the texture is measured using XRD measurements. From XRD measurements, pole density functions (PDF) are generated, which represent the relative frequency of the lattice orientations (normal vectors) within the specimen by volume. Pole figure data is a 2-D representation of texture and in order to uniquely convert this data to a 3-D ODF a combination of pole figures for different lattice planes must be used. This conversion is referred to in the literature as “pole figure inversion” [12]. The MTEX toolbox version 5.7.0 is used here for this conversion.
From the ODF generation, the aim is now to sample a small set of N ˜ orientations g ˜ i , i = 1 N ˜ . Each sampled orientation is assigned to a single grain in the pre-constructed RVE and the ODF generated from the N ˜ must statistically represent the experimental ODF. In order to obtain this statistical representation, an optimization procedure is proposed in this paper. Both steps are detailed in individual subsections below.

2.2.1. Initial Sampling

First, an initial set of N ˜ orientations for the RVE needs to be generated. For this, the experimental ODF is discretized using an equidistant grid in Euler space. Then, the orientation corresponding to the center of each grid box and its corresponding weight is exported using MTEX [20]. These orientations are subsequently sorted in descending order based on the weights. The top N ˜ orientations ( g ˜ i ,     i = 1 N ˜ ) with the highest weights are considered for assignment to the RVE grains. At the same time, from the RVE constructed from the experimental grain size distribution, the size of the individual grains is extracted. The grains are then sorted in descending order of their size. Now, the sorted grains and the orientations are one-to-one mapped, such that the biggest grain is assigned the orientation with the highest weight and vice versa. This mapping procedure is also illustrated in Figure 3.
Now, the ODF corresponding to the RVE must be generated. For this, the RVE is first meshed using the meshing functionality in Neper. Every grain now consists of a group of elements, and therefore, each element is assigned an orientation based on the grain it belongs to. Hence, after this assignment, the number of orientations in the reconstructed ODF is equal to the number of elements in the RVE. With all these orientations, using the kernel density estimation in MTEX [9], an ODF ( f g ˜ ) is determined. However, since some orientations from the experimental orientation set with small weight are lost, some significant statistical data is lost and therefore this RVE ODF is expected to have a strong texture compared to the experimental ODF. An example of an ODF reconstructed by the initial sampling is shown in Figure 3. It is obvious that adjustments to the orientations are required next in order to replicate the experimental ODF. As long as the statistical distribution of the experimental ODF is respected in the process, such adjustments are permissible.
Do note that the RVE is initially meshed and then orientations are assigned to each element in the RVE for the construction of the ODF. In principle, an ODF can also be constructed by reassigning a weight to each orientation, where the weight is proportional to the size of the grain in the RVE. The former method is chosen in this paper because the RVE is later used in CP-FEM simulations, where the ODF is reconstructed by assigning the same orientation to all elements in the FE mesh that make up a given grain.

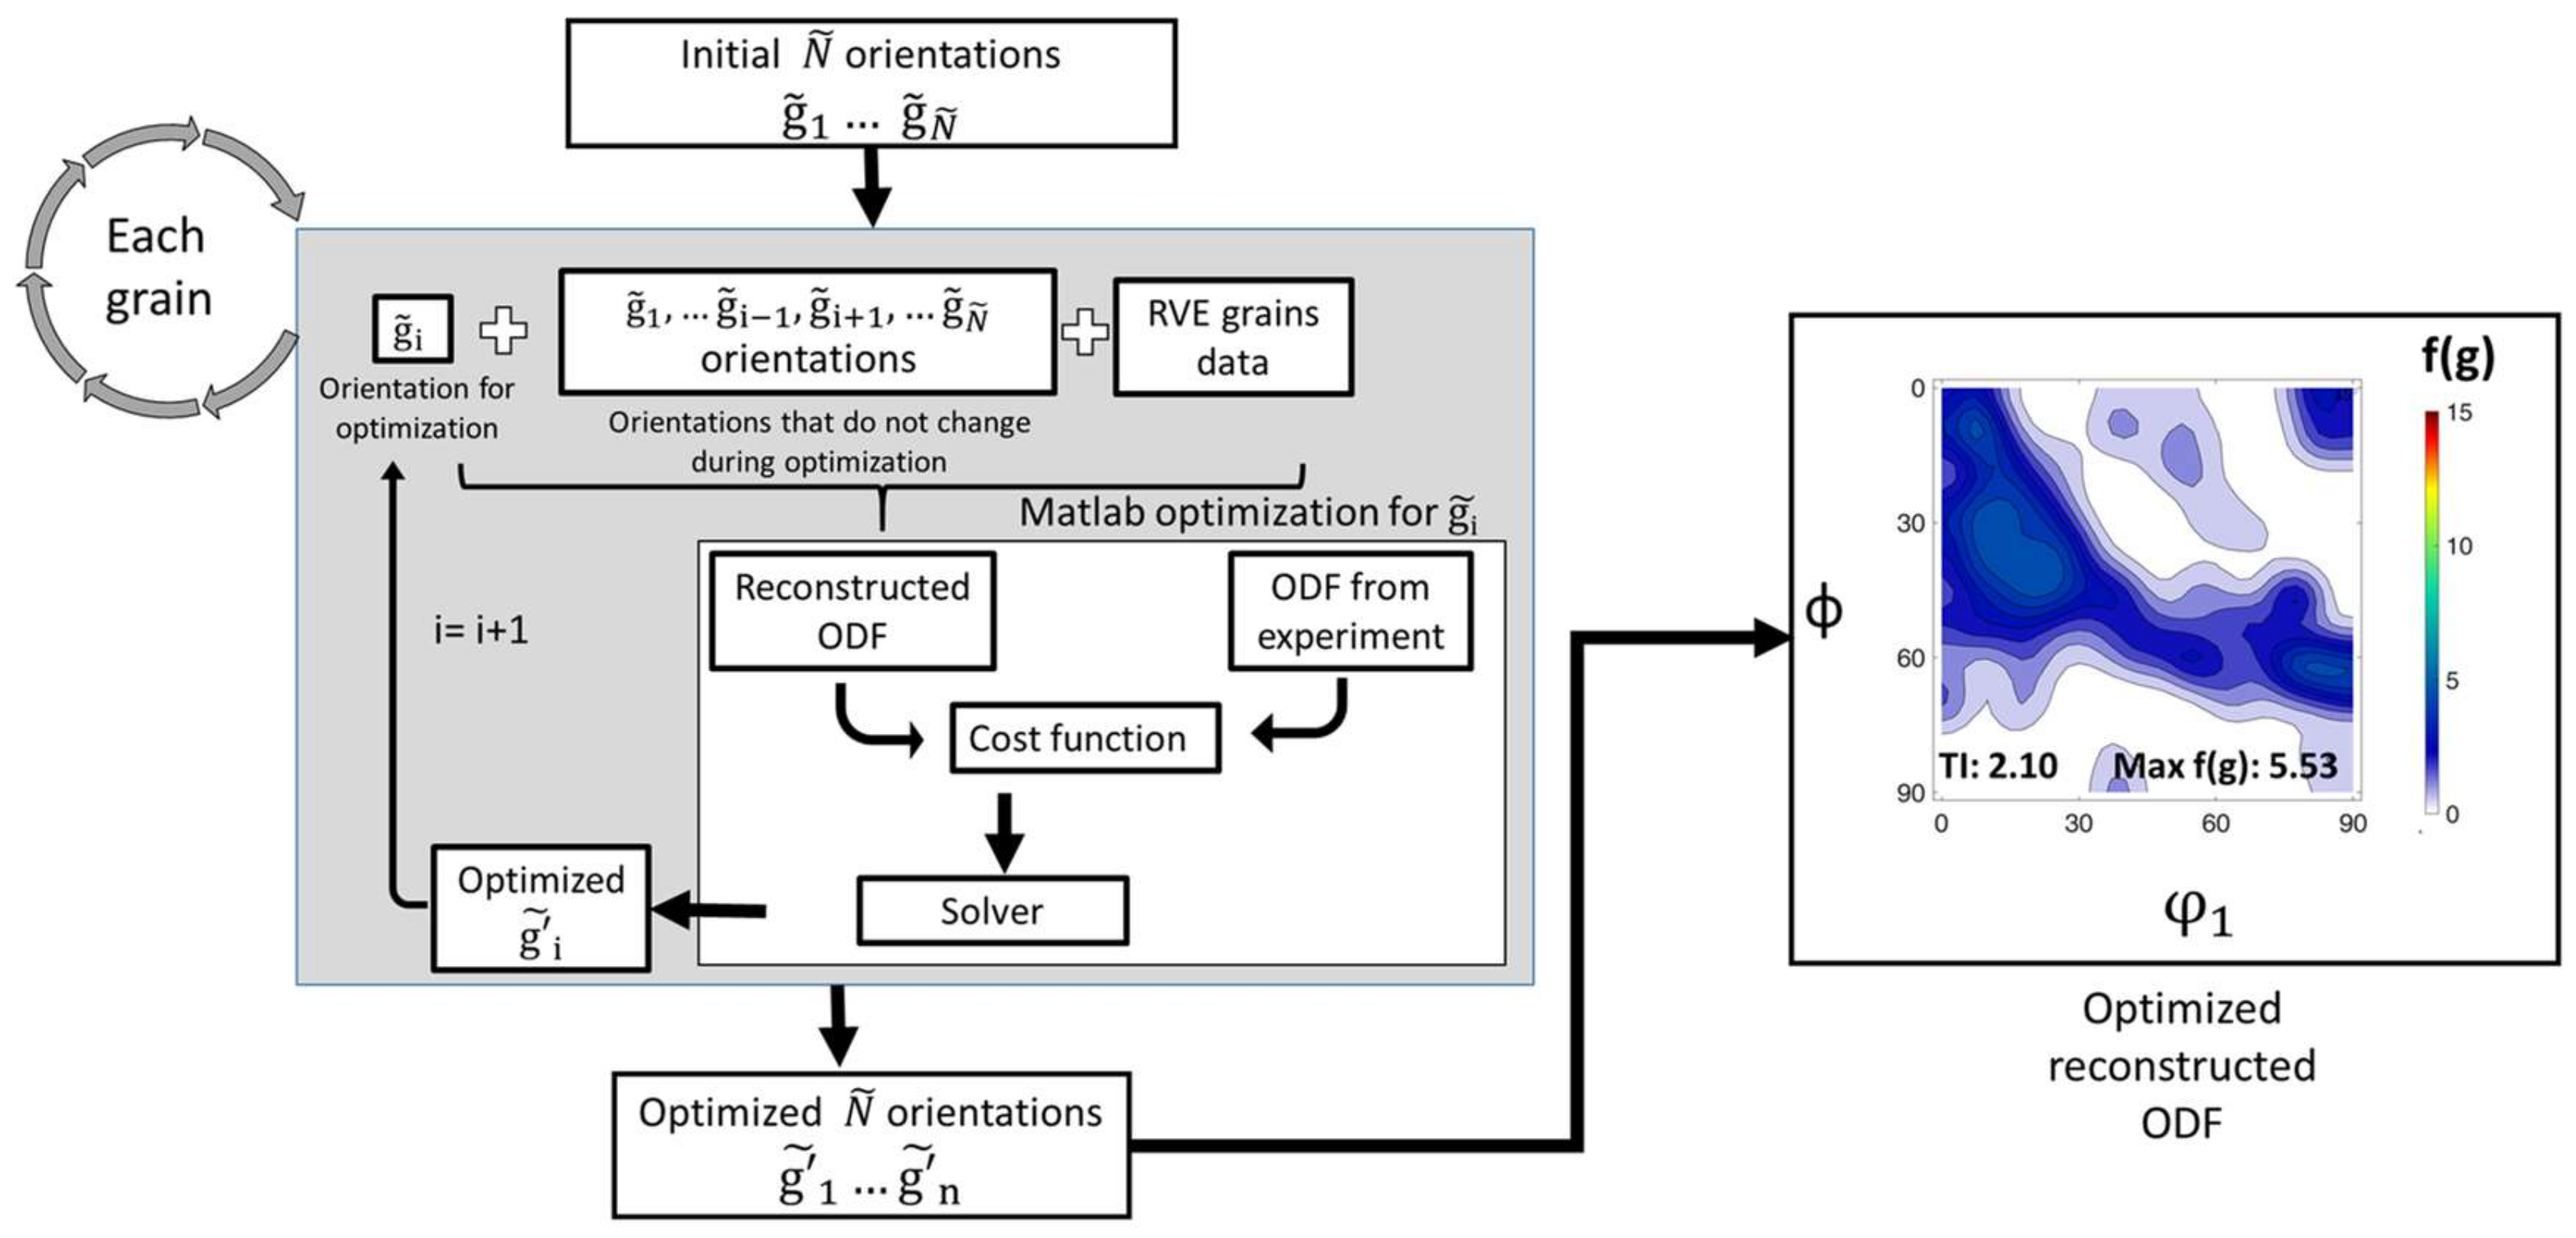
2.2.2. Optimization Step

An optimization procedure is introduced in this subsection to adjust the initially selected N ˜ orientation. The cost function for the optimization is the L2 error [18] between the reconstructed ODF and the experimental ODF. The L2 error gives an estimate of the difference between the volume fraction of orientations with respect to the experimental ODF ( f g ) and the sampled ODF ( f ( g ˜ ) over the whole Euler space.
J = f g ˜ f g 2  
The non-linear gradient-based fmincon function in the MATLAB version 2018b optimization toolbox is used here to optimize the Euler angles for each grain and this program is coupled with the MTEX toolbox to obtain the reconstructed ODF. The optimization process is shown for one grain ( g ˜ i ) in Figure 4. This process starts from the orientation with the highest weight (or the biggest grain) g ˜ 1 . An ODF with the N ˜ orientations is optimized with respect to the experimental ODF by modifying the Euler angles in g ˜ 1 . A new set of Euler angles g ˜ 1 is thus obtained after optimization. Then the orientation g ˜ 1 is replaced with g ˜ 1 in the initial set. Using this new orientation set, the orientation corresponding to the next biggest grain is optimized. This process continues until the last orientation that corresponds to the lowest weight (or the smallest grain) is optimized. The final set of orientations ( g ˜ 1 ,     i = 1 N ˜ ) is then used for initializing the RVE for numerical simulations. An example of an ODF sampled via this TSOO method can be seen in Figure 4. As expected, after adjusting the initial set of orientations, the texture weakened. Although several rounds of optimization would be possible, the procedure is restricted to one optimization for each grain to minimize computational effort.

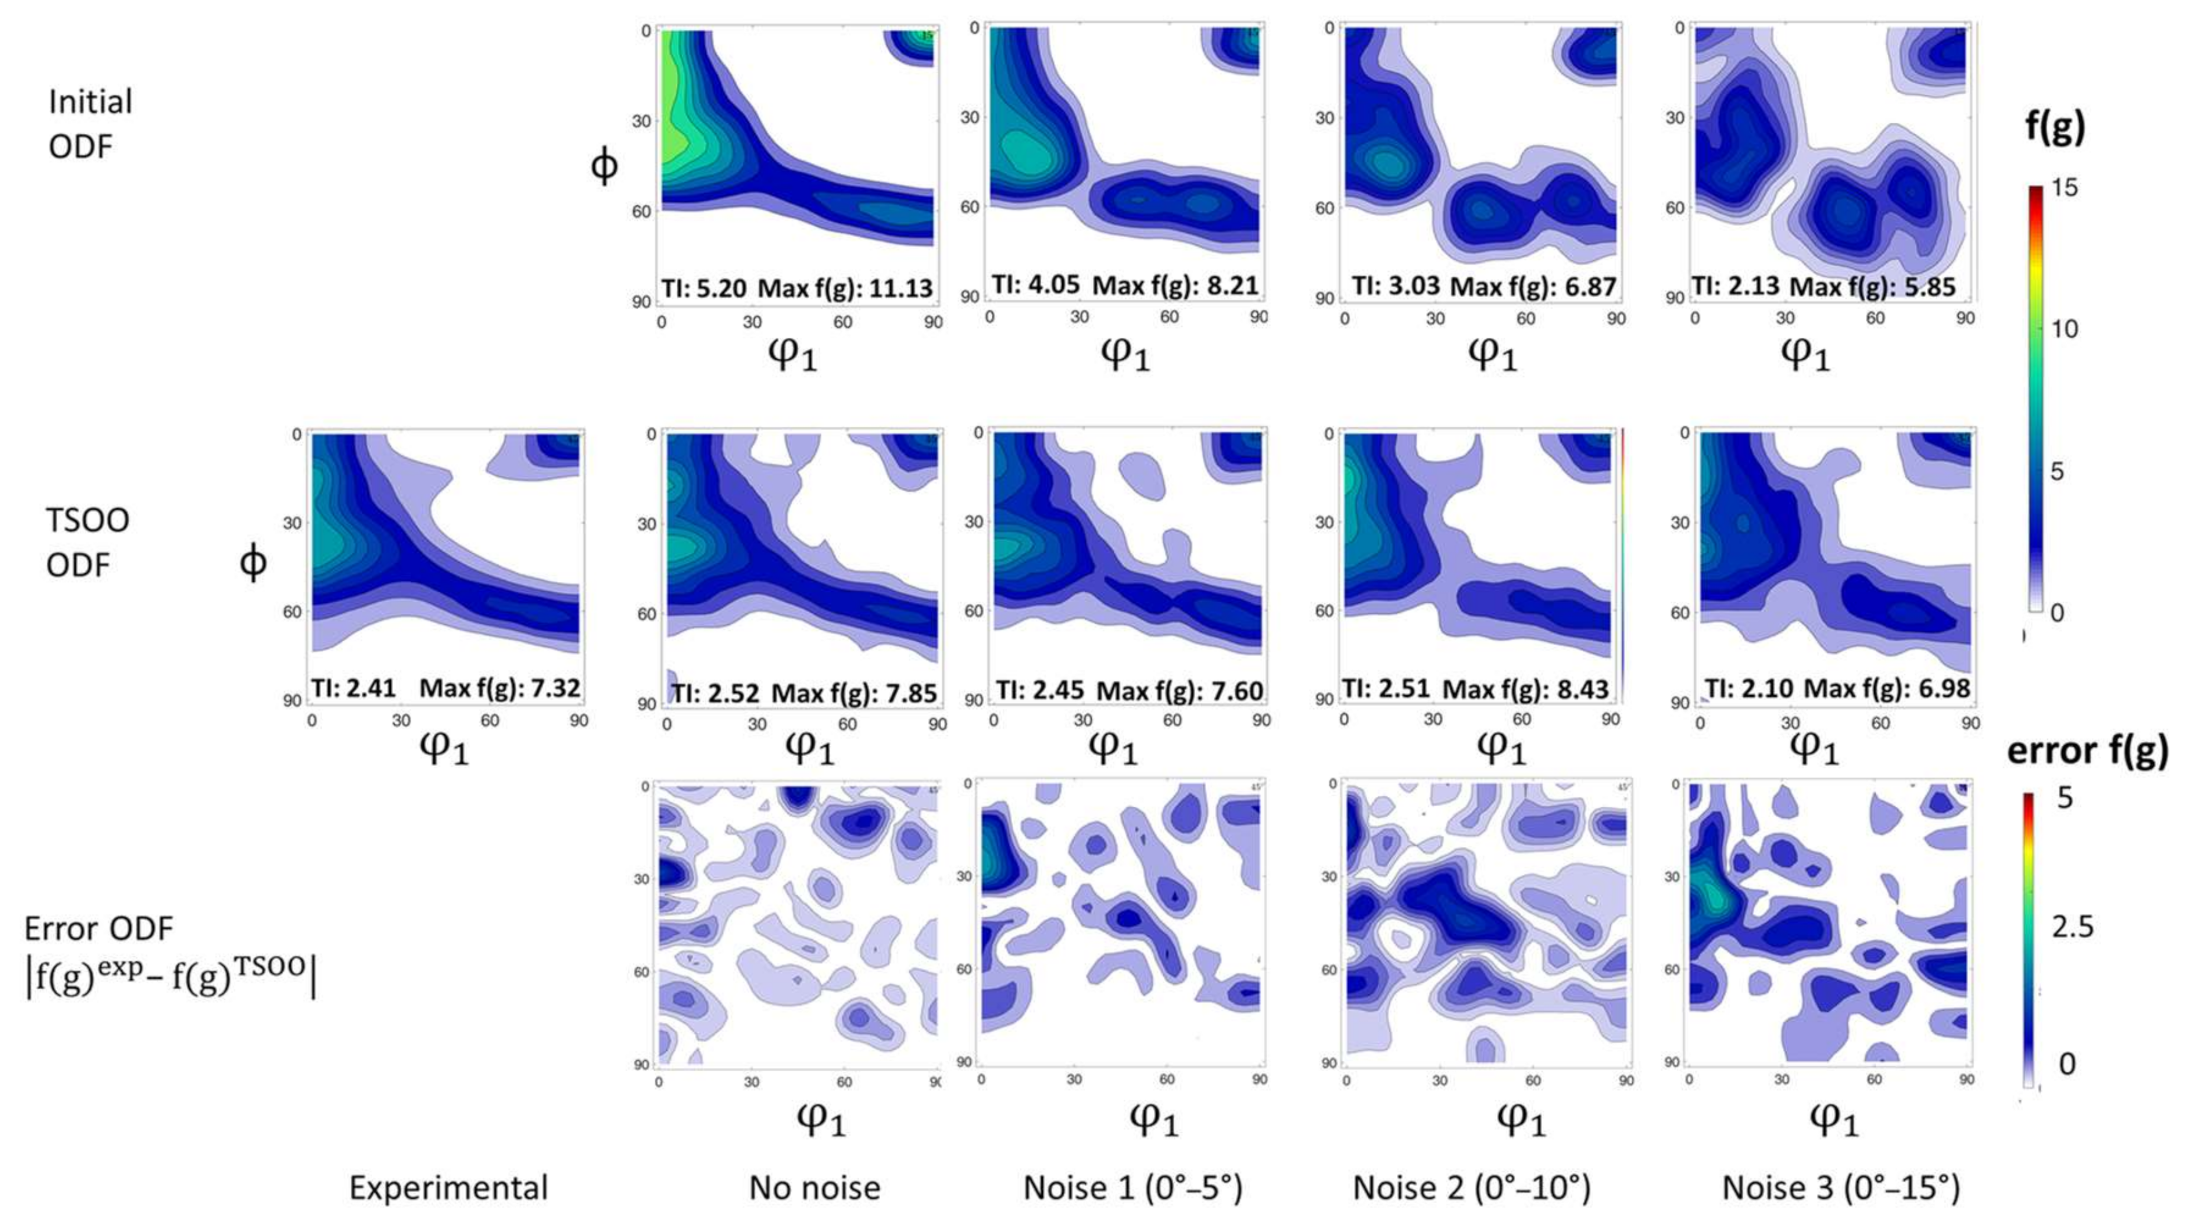
2.2.3. Sensitivity of Initial Sample Selection

As mentioned, the grain size distribution and texture corresponding to the RVE only statistically represent the experimental measurements. The starting orientations used in the optimization will influence the resulting ODF and might even lead to diverging results in the gradient-based nonlinear optimization procedure. Therefore, in order to study the robustness of the initial sampling, perturbations are imposed on the orientations to generate different initial ODFs. These are then optimized, and the results are analyzed.
In order to introduce these perturbations, firstly orientations are selected using the initial sampling procedure described in Section 2.2.1. Then, for every Euler angle ( φ 1 , ϕ , φ 2 ) in the N ˜ orientation, a random angle is either added or subtracted. The range of the random angles is chosen beforehand e.g., between 0–5°. This then generates a new set of N ˜ orientations, which are assigned to the elements of the corresponding grains. The new ODF thus deviates from the ODF generated with the original N ˜ orientations and this deviation is stronger if the random angle is larger. The optimization results of the perturbed ODF will be compared to the TSOO sampled original ODF without perturbations (or noise) to assess robustness.

2.3. CP-FEM Simulations

The main applications of sampled textures are in numerical modeling of microstructure and texture evolution during deformation. Since, in this paper, the original orientations extracted from the experimental ODF are modified via optimization it is essential to validate the performance of the reconstructed ODF in numerical modeling.
Thereby, the reconstructed ODF is used to predict the texture evolution in warm rolling of a NO electrical steel hot strip with an initial thickness of 1 mm to a final thickness of 0.5 mm at 400 °C in three passes via CP-FEM. The corresponding experiments were conducted on the rolling mill “Walze 86” at the IBF. The rolling setup and the process parameters can be obtained from [22]. The performance of the novel sampling method TSOO will be compared to the performance of an ODF sampled via the method for inhomogeneous grain size distributions by Melchior et al. [19].
The numerical texture evolution modeling is divided into two parts: Firstly, a 3-pass macro-scale 2D plane strain rolling simulation is performed with a coupled temperature displacement plasticity model in Abaqus Standard. Then, the nodal history at the center of the strip thickness is extracted from the simulation and converted into a deformation gradient. More details of the macro model and the deformation gradient are detailed in [23].
Secondly, the deformation gradient corresponding to the center of the strip generated from the macro-model is imposed onto the RVE. The initial state of the RVE needs to represent the experimental grain size distribution and the texture. The RVE deforms under periodic boundary conditions (PBC). A phenomenological material model implemented in the CP-FEM open-source code DAMASK [3] is used in this study to predict the texture evolution. Temperature-dependent material data is not available for this material model, and therefore isothermal conditions are assumed. As the temperature change in the strip center is small, this does not pose a problem. The phenomenological constitutive equations are briefly described below. The constitutive model is based on the assumption that plastic slip γ occurs on a slip system α once the resolved shear stress τ α exceeds a critical value τ α c . So, the shear rate γ ˙ α on a slip system α is defined by the resolved shear stress τ α and the critical resolved shear stress τ α c , using the equation
γ ˙ α = γ ˙ 0 τ α τ α c n sgn ( τ α )
γ ˙ 0 is the reference shear rate and n is the strain rate sensitivity corresponding to the slip system α . The critical resolved shear stress is then calculated by considering the micromechanical interactions between different slip systems, using the equation
τ α c = β = 1 N q α β h 0 1 τ β c τ s a γ ˙ β
where h 0 , a , τ s are the slip hardening parameters. q α β takes into account the effects of self-hardening α = β , and latent hardening α β . These values are taken as 1 for coplanar slip and 1.4 otherwise. The other material parameters fitted for this material are shown in Table 2 and the flow curves used for the fitting procedure are shown in Figure 1a. The fitting procedure is described in detail in [24].

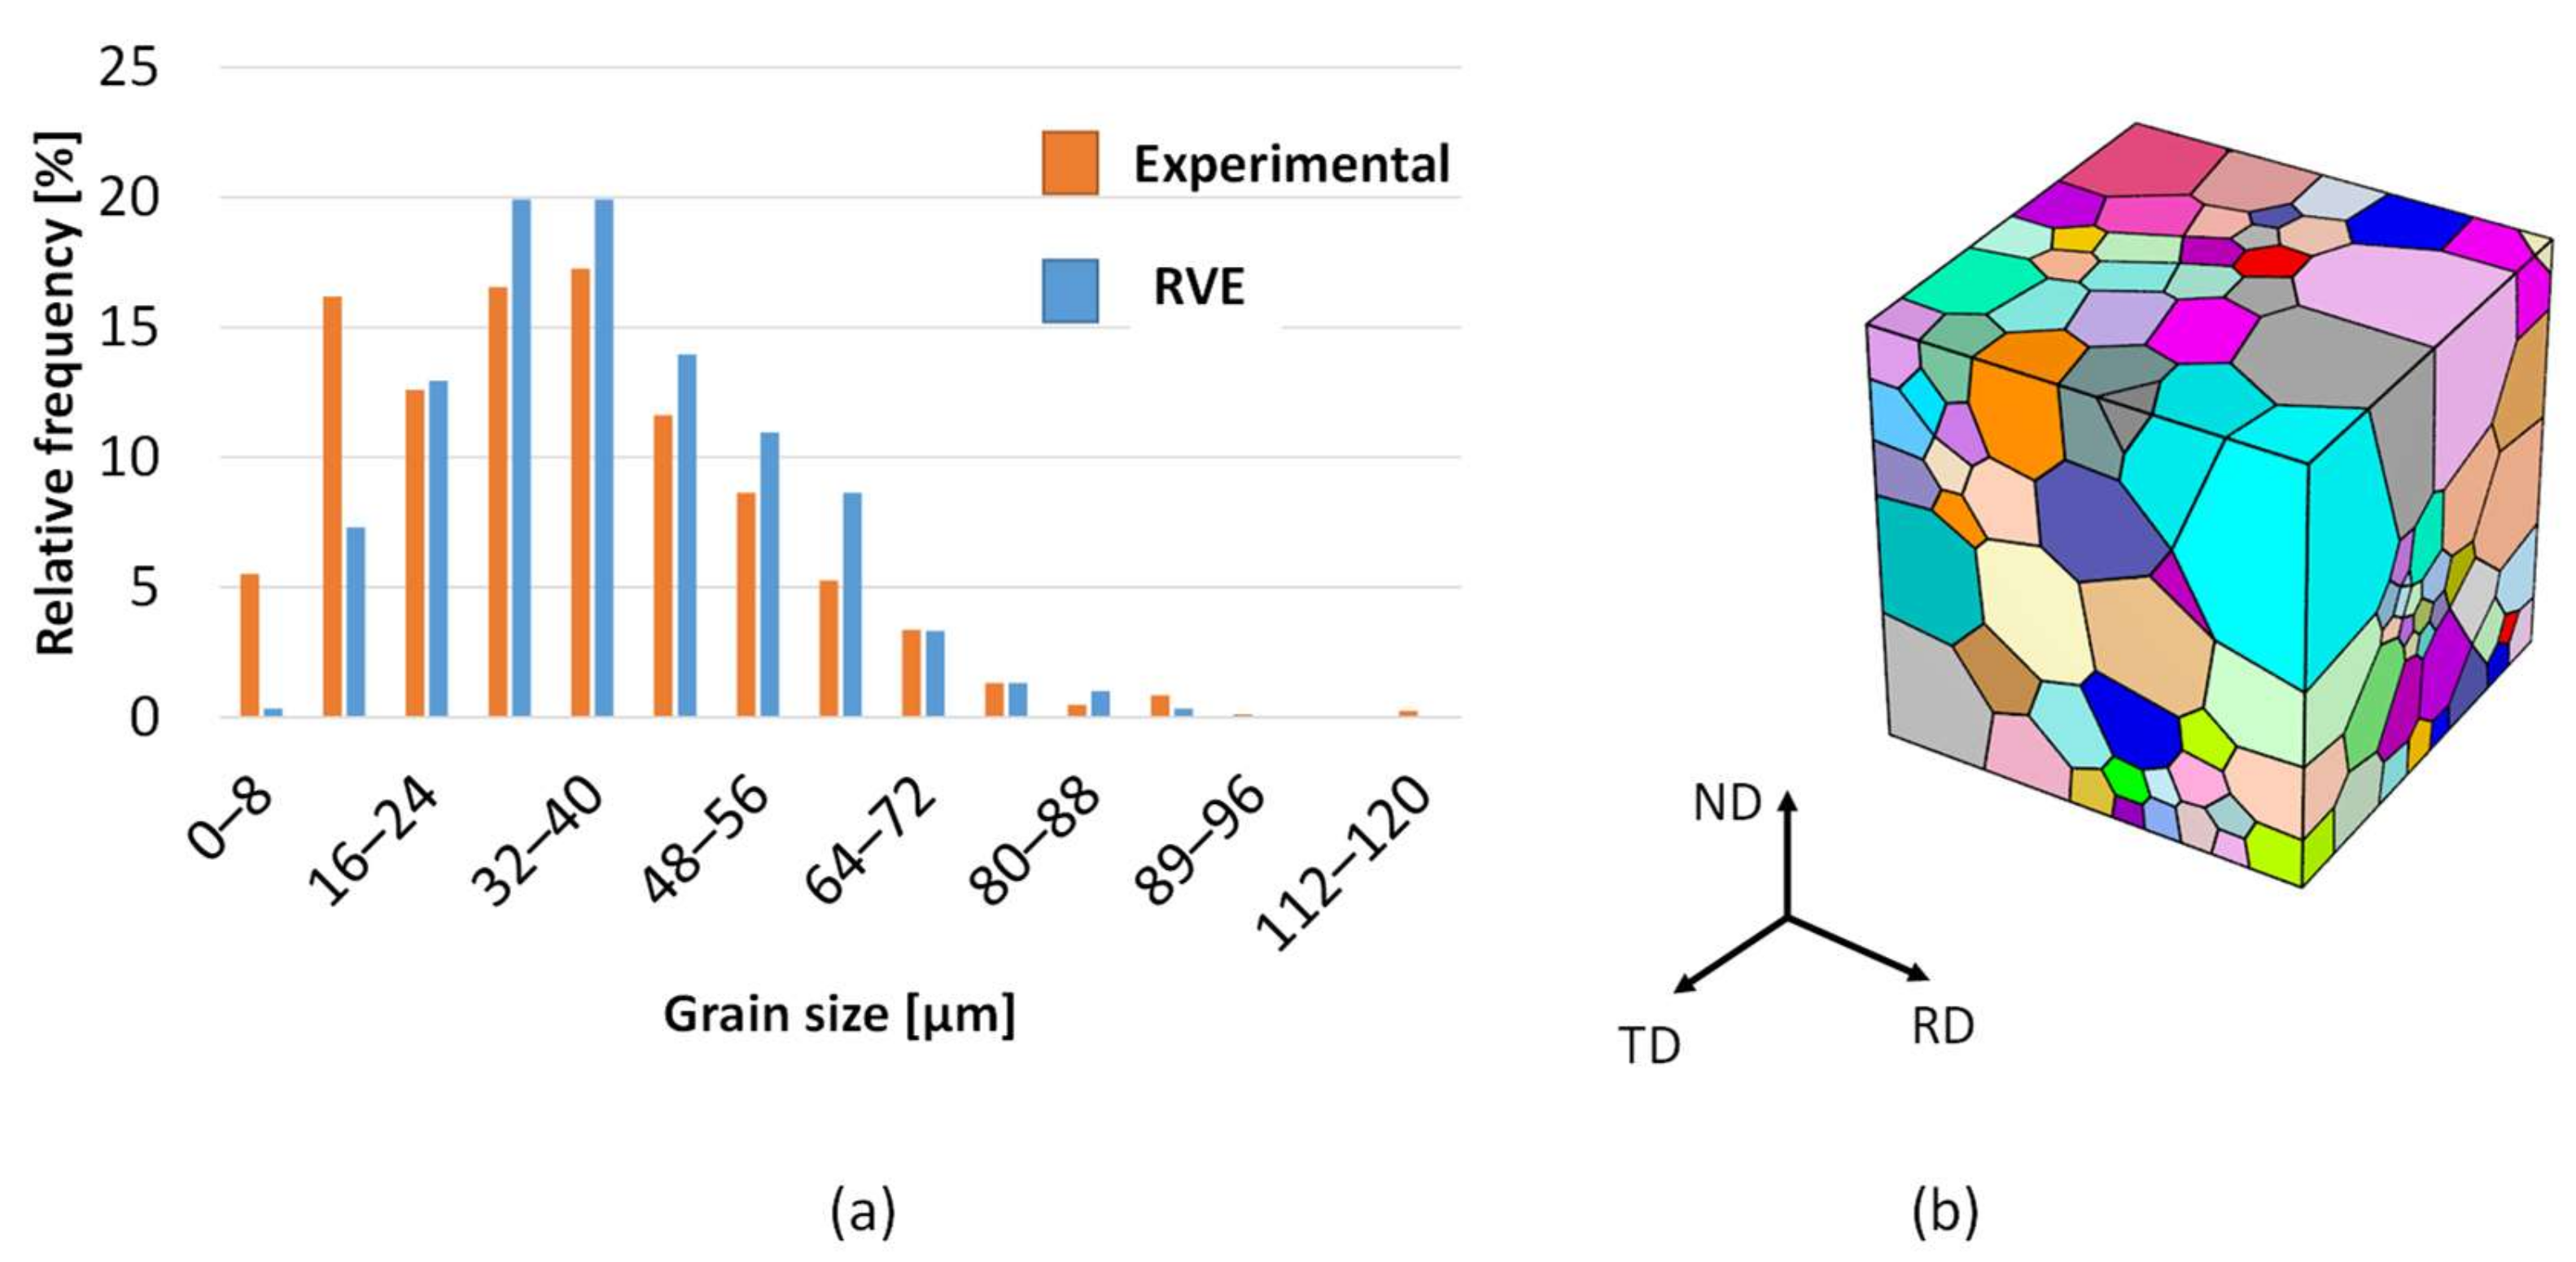
2.4. RVE Construction for Texture Sampling

Generally, an RVE must replicate the macroscopic stress-strain response as well as statistically represent the grain morphology and texture of a sample. The number and size of grain must be chosen accurately so that all the above characteristics are satisfied. Thus, in this subsection, RVEs with a varying number of grains are considered for the hot strip microstructure, and the average stress-strain response under compression is extracted and compared to an experimental flow curve. Furthermore, the texture sampling quality of these RVEs is assessed.
RVEs with 50, 150, and 300 grains are chosen. CP-FEM simulations were performed using all these RVEs, where a uniaxial compressive load is applied in the ND direction at a rate of 0.1 s−1. The microscopic flow curve is then extracted from the RVEs, and compared to the experimental macroscopic flow curve at 0.1 s−1. The results are shown in Figure 5a. The flow curves of the RVE with 150 grains deviate from the experimental flow curve, whereas the flow curves for 50 and 300 grains are in close agreement with the experiment.
Texture sampling is analyzed via ODFs generated for the RVEs using the TSOO method discussed in Section 2.2. The resulting textures are shown in Figure 5b. The ODFs with 50 and 150 grains have a higher intensity along the α-fiber (<110>//RD), whereas for the ODF with 300 grains the intensities are closer to the experimental ODF. Additionally, intensities along the γ-fiber (<111>//ND) are very weak for the 50 and 150 grains RVE. The texture index and the maximum intensity of the RVE with 300 grains are very close to the experimental ODF. The TI is also calculated using MTEX.
Since only the RVE with 300 grains satisfies the characteristics defined above, i.e., it replicates the macroscopic stress-strain response as well as the experimental ODF, 300 grains were chosen for all the RVEs that are considered in this paper. RVEs with an even greater number of grains that might further improve texture quality were not considered as they are very computationally expensive.

3. Results

In this section, various aspects of the texture sampling method TSOO put forward in the preceding sections will be trialed: Firstly, the capabilities of TSOO are verified by reconstructing ODFs in RVEs of artificial microstructure with an increasing degree of grain size inhomogeneity. Secondly, the method is applied to RVEs of real microstructures obtained from micrographs and XRD experiments. Two examples are considered, an annealed microstructure with a homogenous grain size distribution and a deformation microstructure with an inhomogeneous grain size distribution.

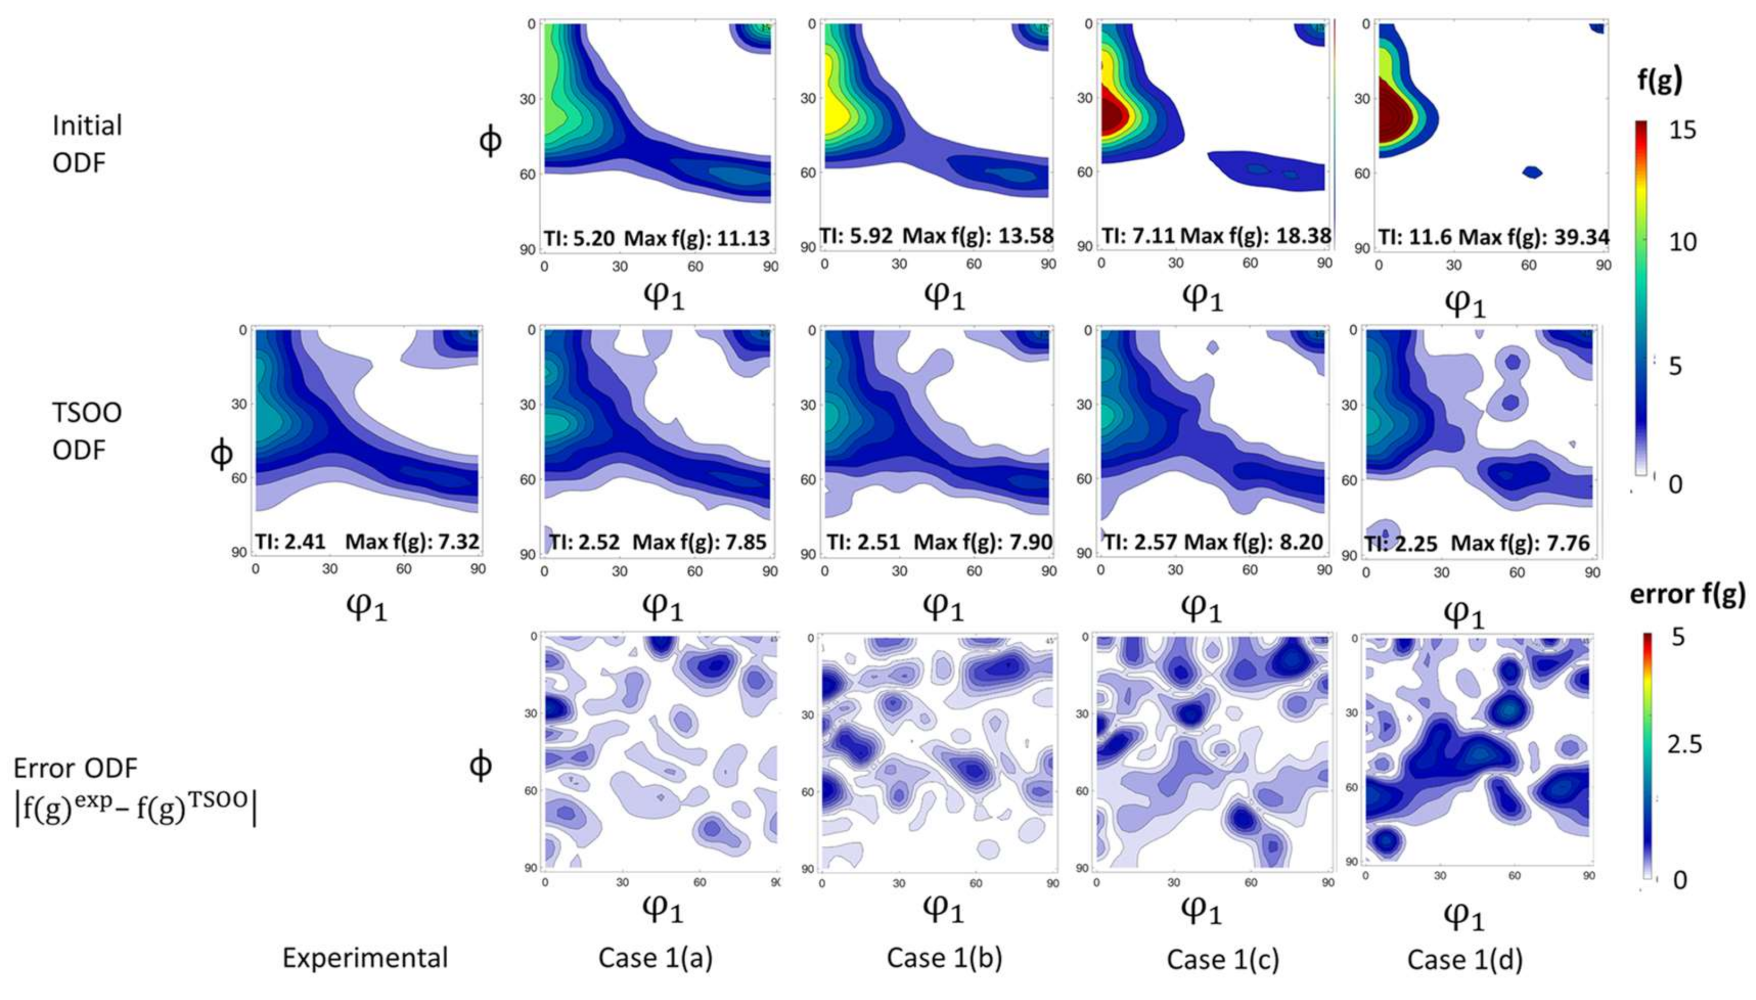
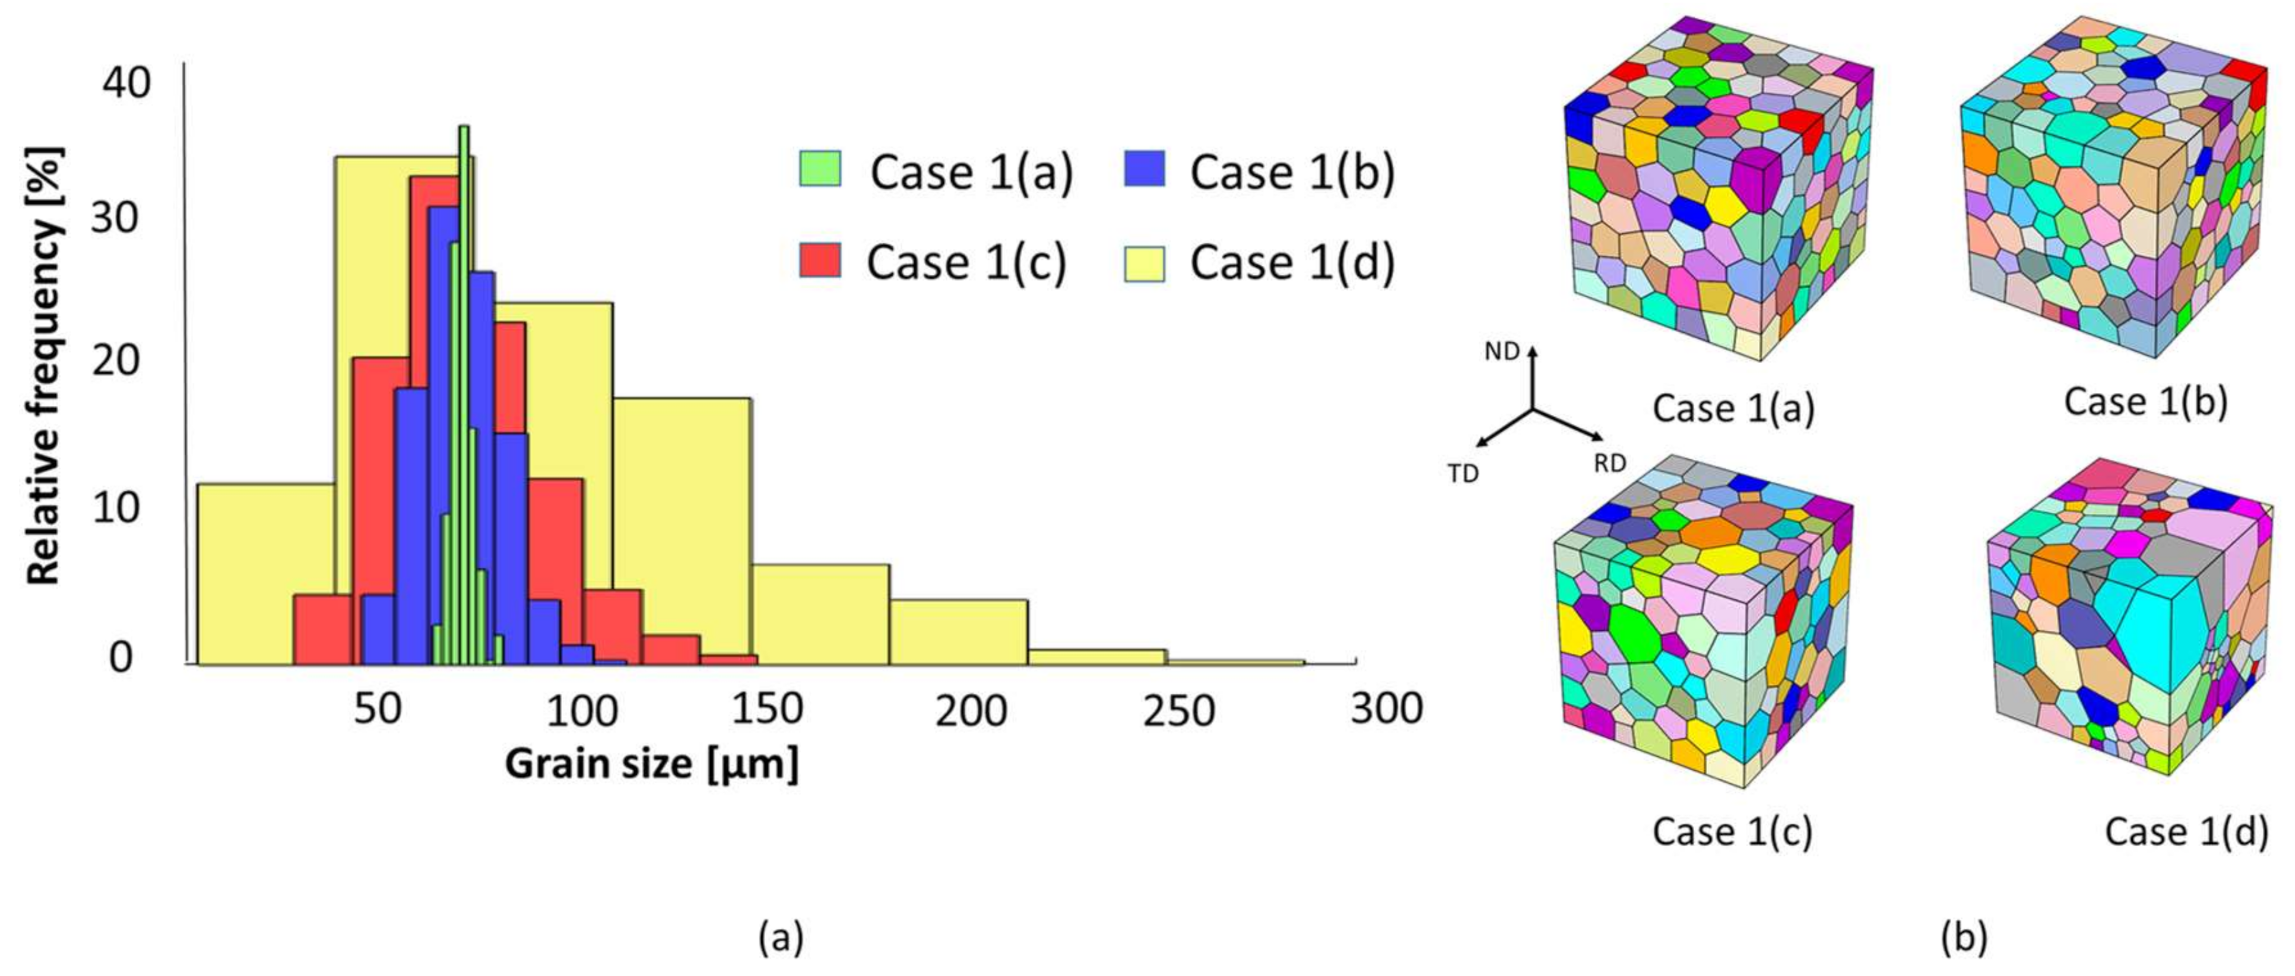
3.1. Texture Representation in Artificial Microstructures with Varying Homogenity (Case 1)

In the first case, the robustness of the TSOO method is tested with different RVEs having approximately the same average grain size but a varying grain size distribution. The goal of this investigation is to fit the same experimental texture to each of the grain size distributions. This helps analyze the adaptability and robustness of the TSOO method for different grain size distributions.
Four different cases 1(a)–1(d), with an ascending order of inhomogeneity, are considered. The grain size distribution and the corresponding RVEs are shown in Figure 6. The average grain size in all the cases is approx. 77.01 µm and the standard deviations are 2.74 µm, 10.61 µm, 20.35 µm, and 50.10 µm, respectively. The RVEs are generated using Neper [21], assuming the grain sizes follow a lognormal distribution. As discussed above a fixed number of 300 grains was considered and this is considered the lowest viable number of orientations to match the experimental ODF. The RVEs are meshed with hexahedral elements in a way that there are at least five elements per grain. The total number of elements for Cases 1(a)–1(c) is 17,576 and for Case (d) is 65,184. Case (d) requires more elements to properly represent the very small grains (0–10 µm) in the meshed RVE.
For all cases, the optimization is performed with respect to the ODF of the experimental NO electrical steel hot strip. All initial ODFs and sampled ODFs via TSOO are shown in Figure 7 together with the experimental ODF. As explained earlier, it can be seen that the initial ODFs are stronger in all the cases. The maximum intensity along the α-fiber (<110>//RD) increases substantially with increasing inhomogeneity in grain size. Additionally, a weakening of the γ-fiber (<111>//ND) is observed and this fiber is fully invisible in the cases 1(c) and 1(d) for the initial ODF. Do note that the intensity legend is fixed at 15 so that the sampled ODFs can be easily compared. Additionally, the maximum intensity is specified for all ODFs as well. In all ODFs sampled via TSOO, the high intensities along the α-fiber are reduced and the ODFs are much closer to the experimental reference. While the general agreement is very good, in direct comparison the TI and the maximum intensity in the homogenous RVEs is closer to the experimental ODF than in the inhomogeneous RVEs. This is also evident in the error ODF which is plotted as the absolute difference between the intensities of the experimental ODF and TSOO ODF. Especially, the error intensities along the α-fiber increase as the grain size inhomogeneity increases.

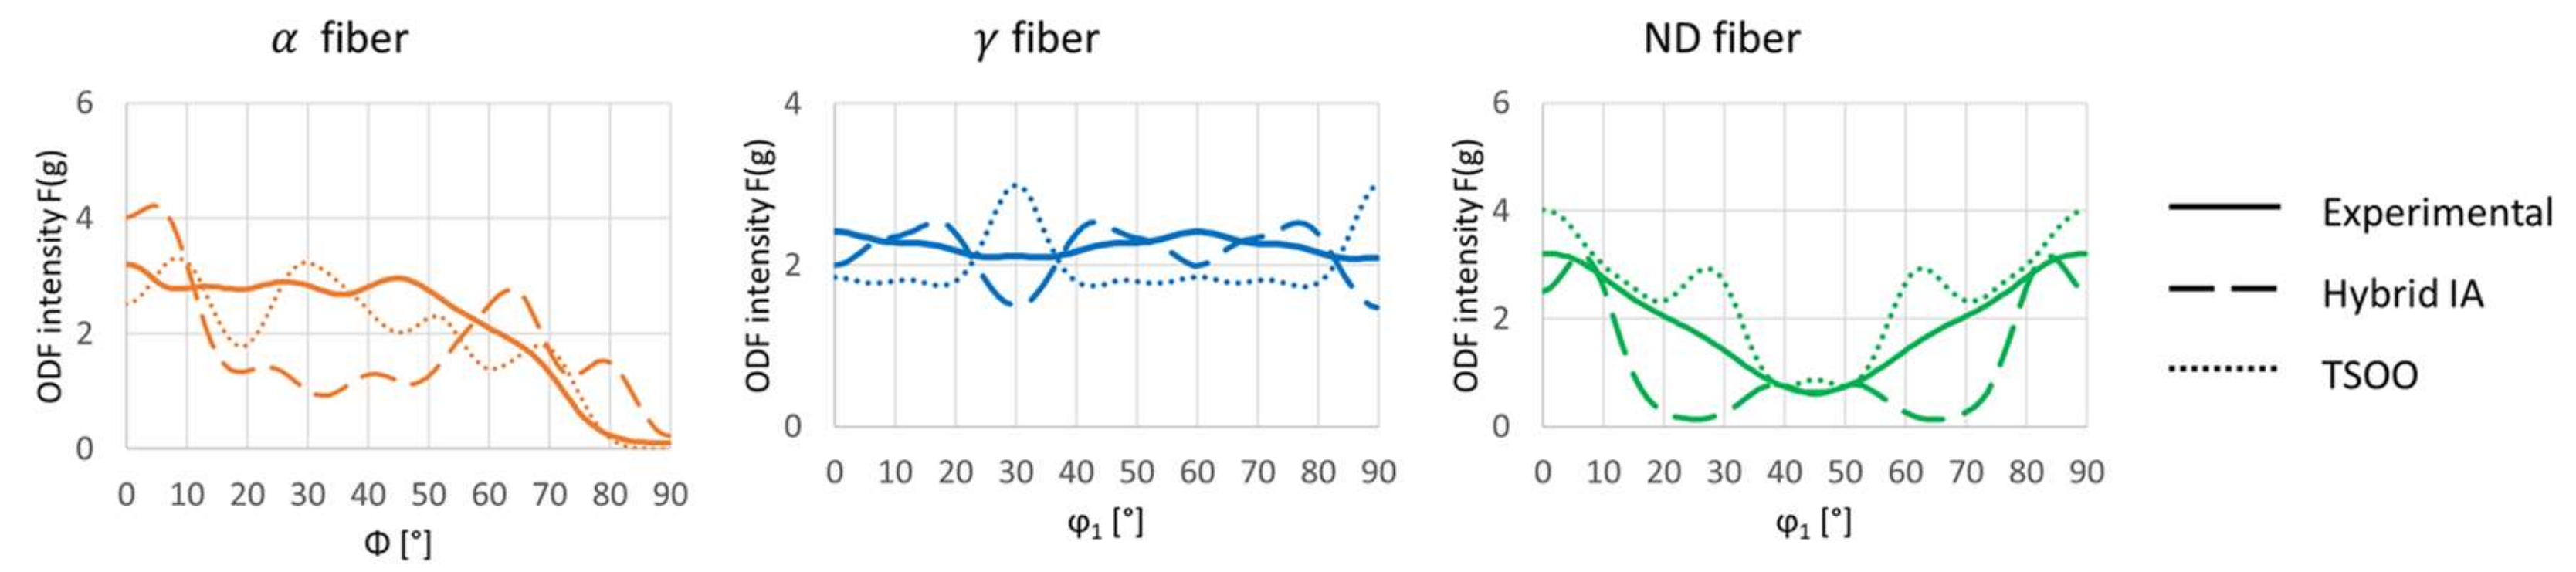
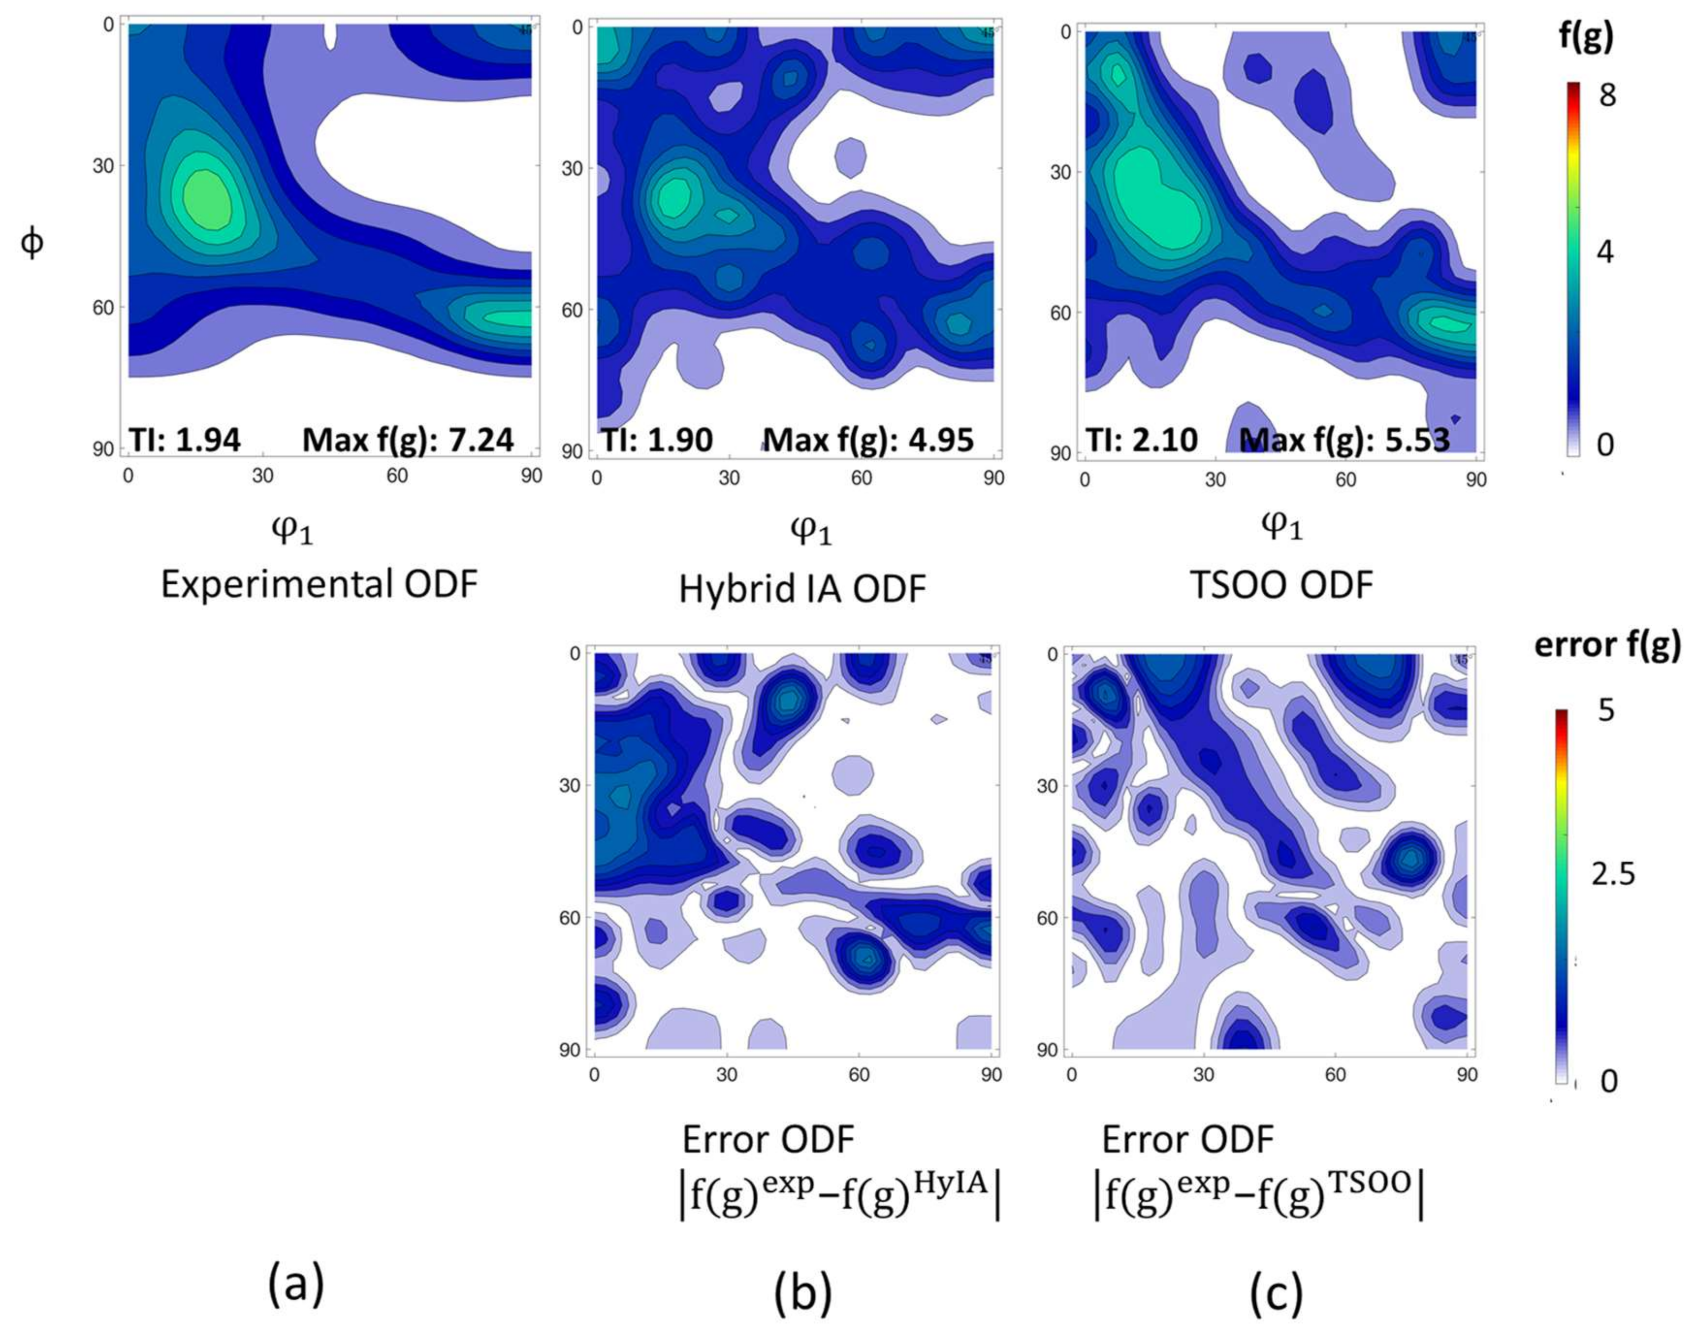
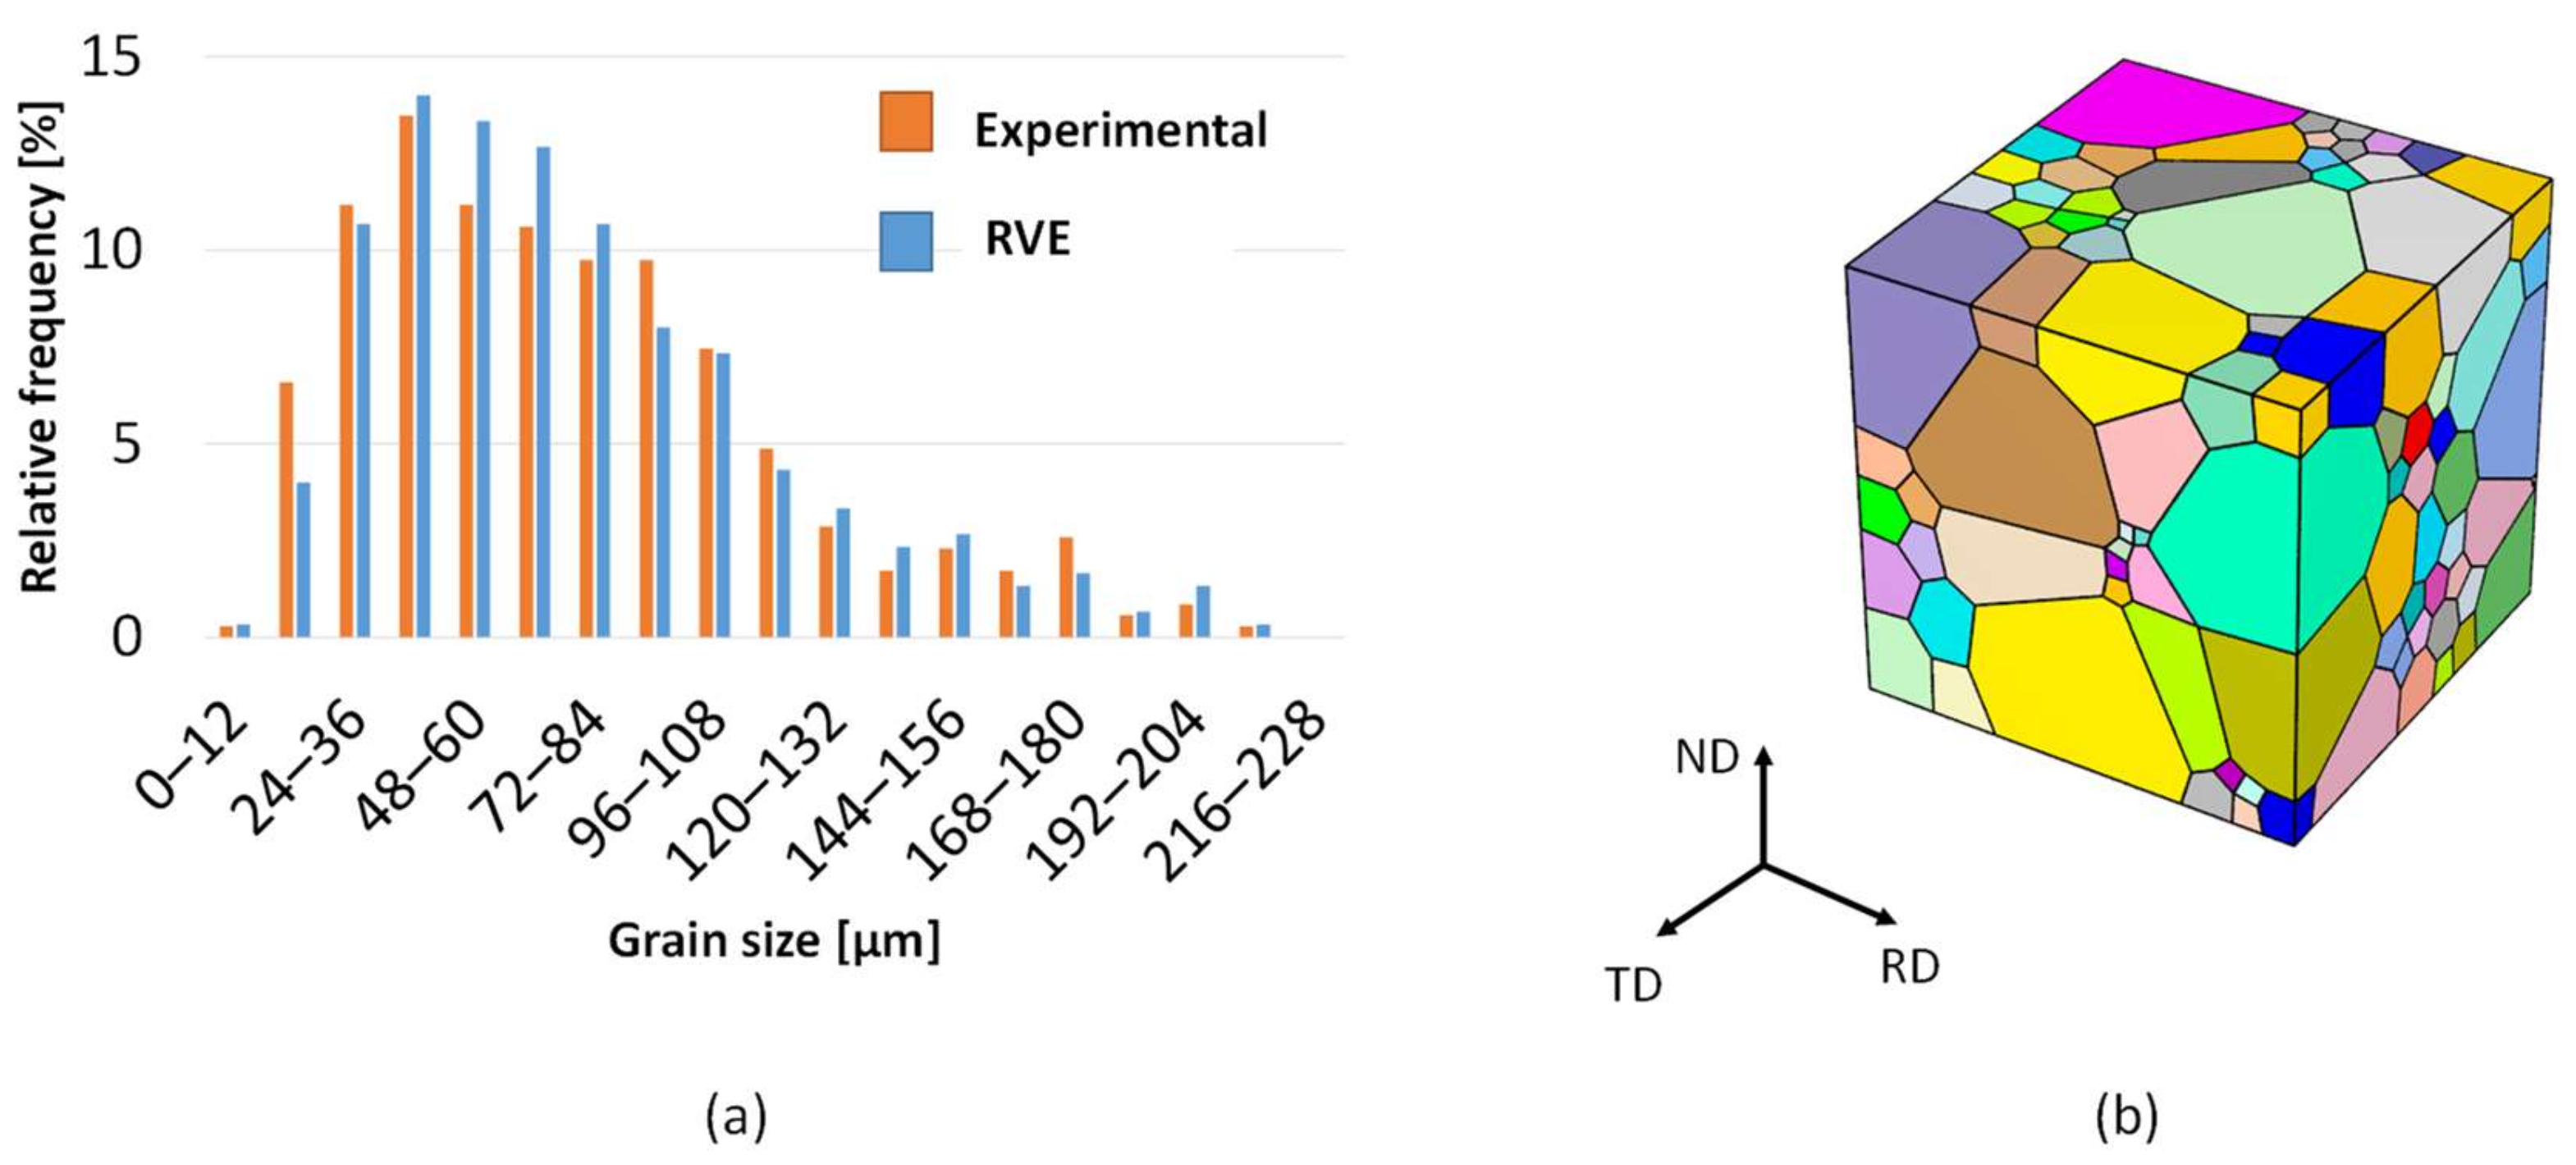
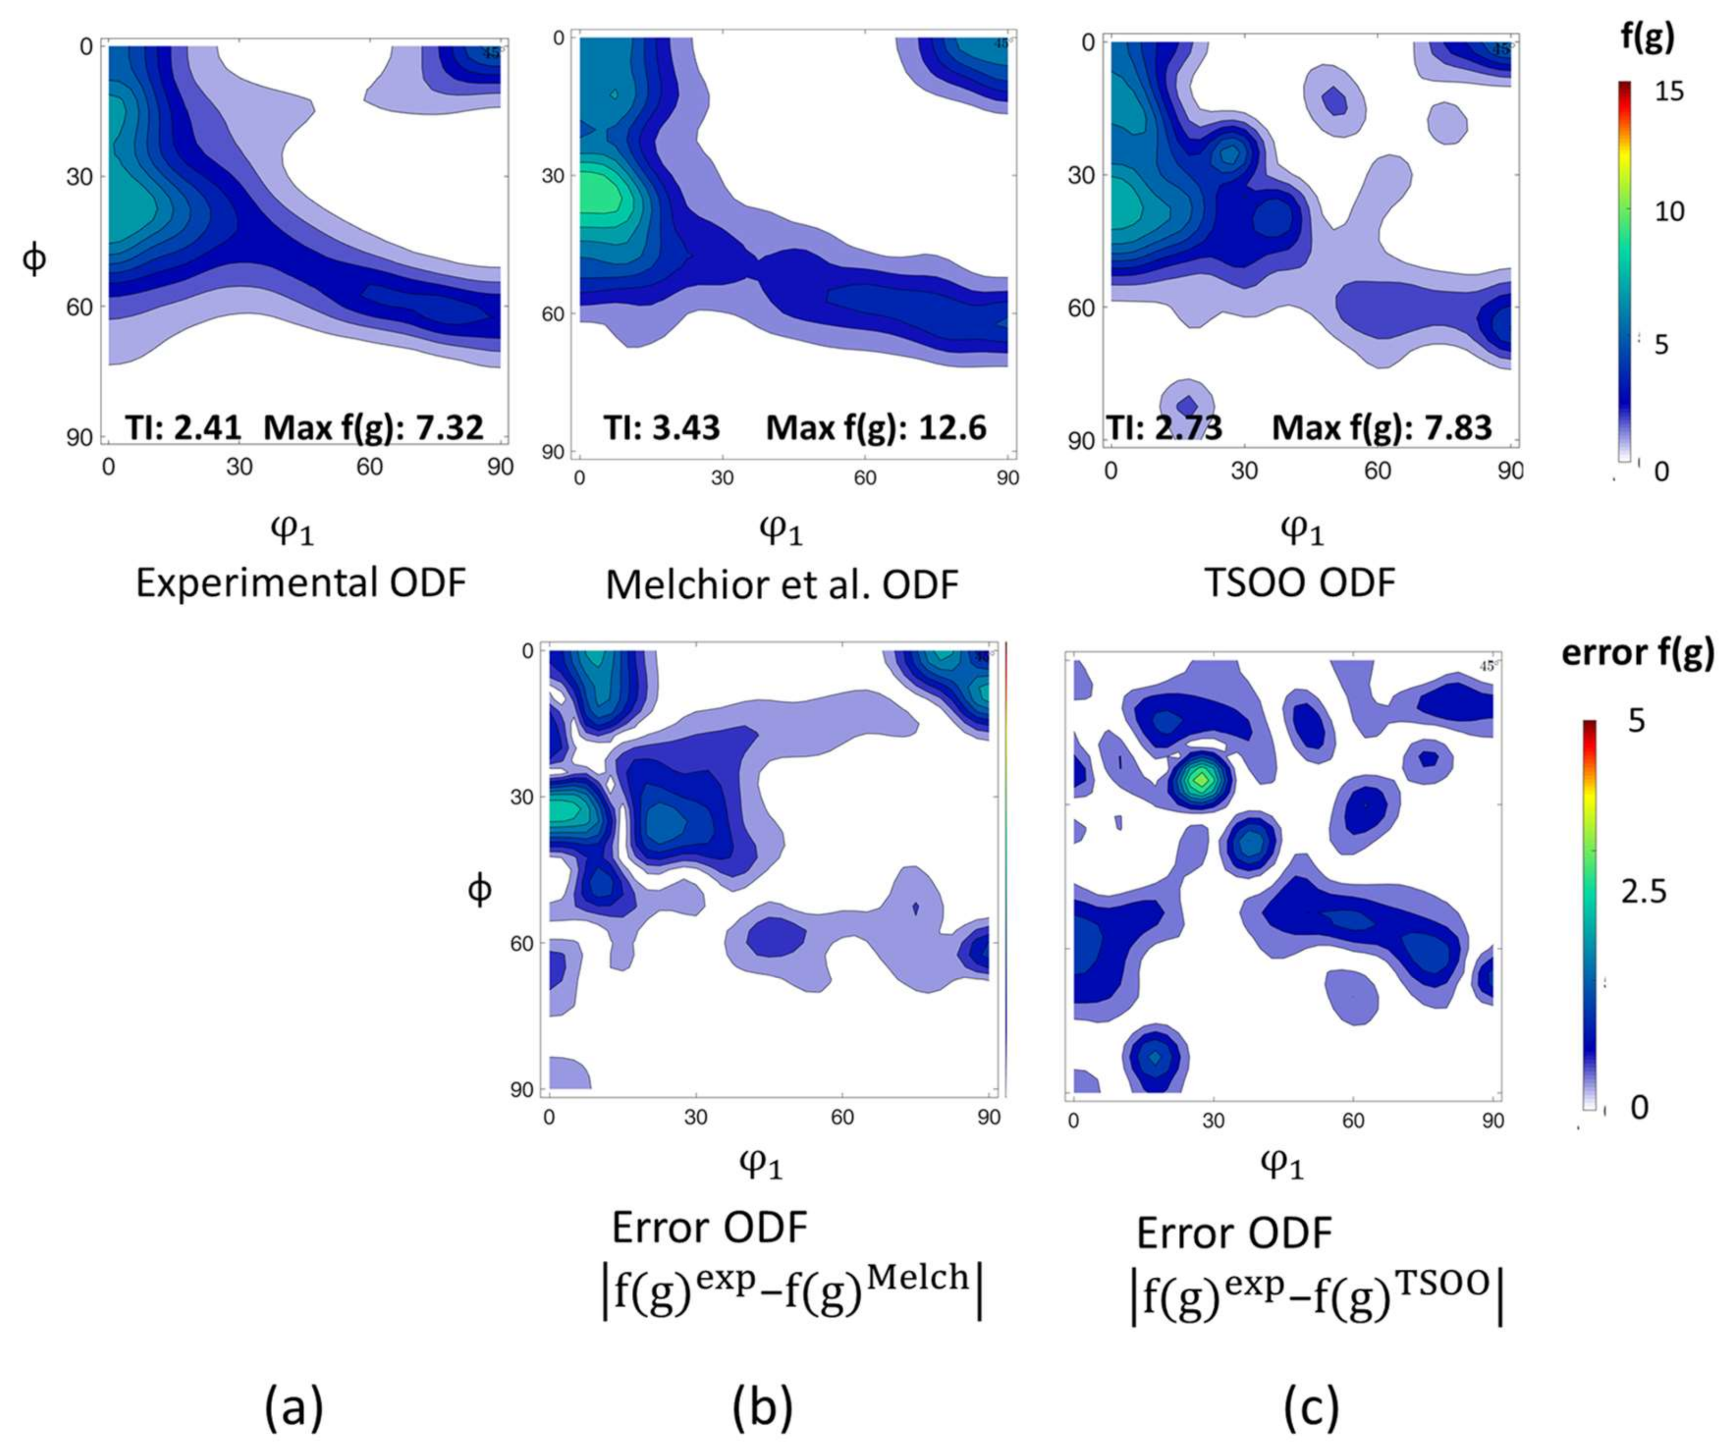
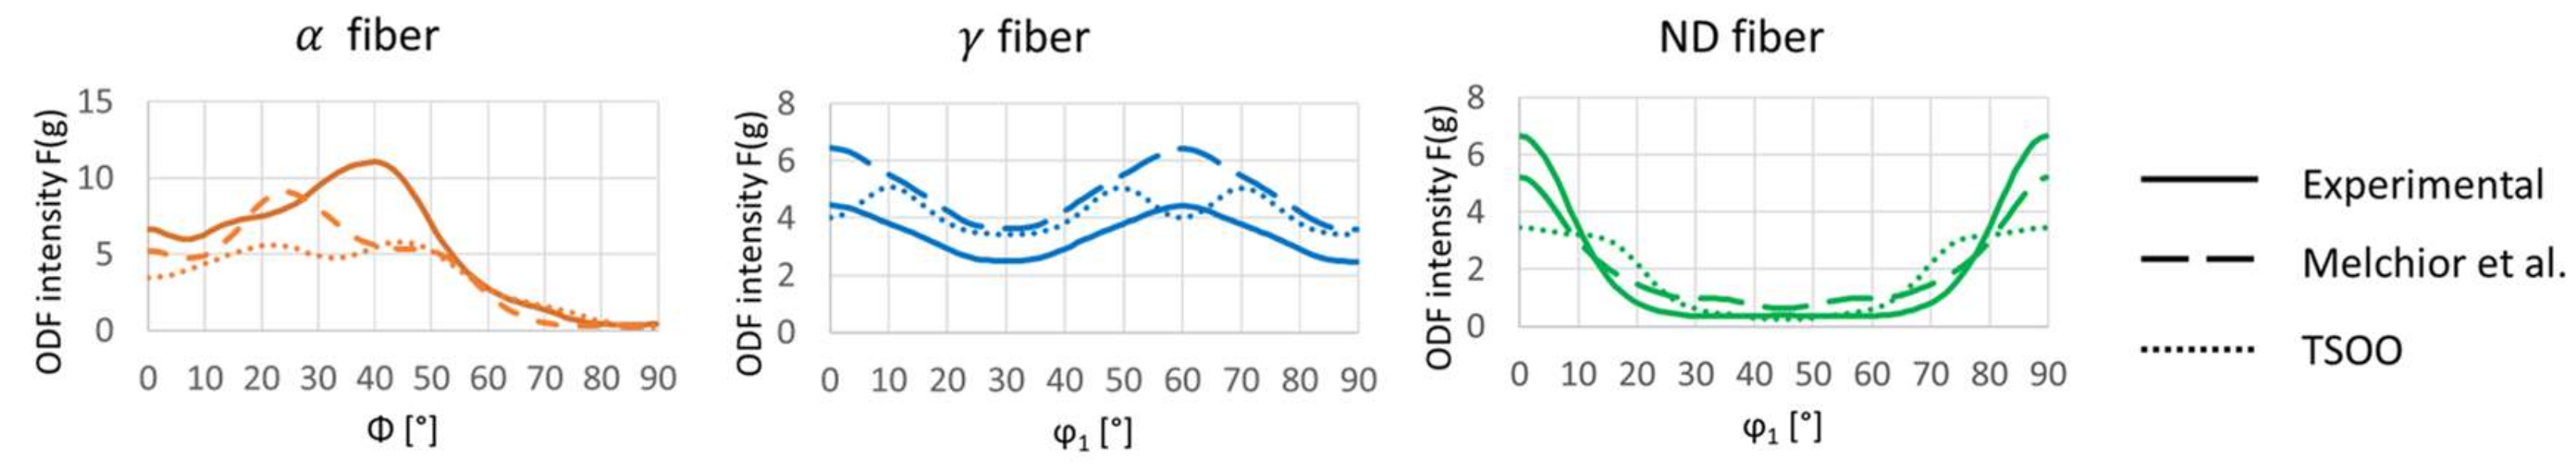
3.2. Texture Representation in the Annealed Microstructure (Case 2)

Having investigated the robustness of TSOO for different artificial grain size distributions, real microstructures are considered next. First, the annealed NO electrical steel strip microstructure with a rather homogeneous grain size distribution is considered. As mentioned in Section 2.1, the measured grain size standard deviation is only 18.76 µm. The grain sizes in the RVE are fitted assuming the experimental grain sizes are equiaxed, i.e., the diameters along the normal, rolling, and transverse direction are near identical as well as follow a lognormal distribution. Furthermore, the grains diameter in 2D is assumed to represent the diameter in 3D, i.e., d 2 D = d 3 D . The experimental and RVE grain size distributions are shown in Figure 8a, while the resulting cubic RVE consisting of 300 grains is depicted in Figure 8b. Again, the RVE is meshed with at least five cubic hexahedral elements per grain totaling to 21952 elements for the whole RVE.
The corresponding texture measured using XRD is shown in Figure 9a. The experimental texture is observed to have a dominant orientation φ1 = 20°, ϕ = 35°, φ2 = 45° which is typical for recrystallized sheets.
Figure 9b shows the reconstructed ODF generated using the hybrid IA method proposed by Eisenlohr et al. [13]. This method can be considered a reference for microstructures with homogeneous grain size as it is integrated into the DAMASK [3] CP-FEM toolbox. The ODF reconstructed via Hybrid IA picks up the dominant orientations observed in the experiment. In addition, the TI is captured but the maximum intensity has a slight deviation with respect to the experimental ODF.
The ODF sampled via TSOO is shown in Figure 9c. The TSOO method predicts all dominant orientations observed in the experimental ODF. The maximum intensity is closer to the experimental ODF when compared to Hybrid IA but is still a bit too low. Additionally, the error along the α-fiber is slightly higher in the Hybrid IA case compared to TSOO.
To better assess the results intensities along three significant fibers namely, α-fiber, γ-fiber and ND-fiber were extracted from all ODFs and are shown in Figure 10. For the experimental ODF, the intensity of the α-fiber is nearly constant until Φ = 45° and then decreases. For the ODF generated with Hybrid IA, the intensity of the α-fiber between 10° and 50° is much lower than the experimental ODF. For the TSOO ODF, the intensity is closer to the experimental ODF and the tendency is also similar. The intensities along the γ-fiber are almost constant in the experimental ODF. The intensities of the sampled ODF’s slightly deviate, but in general, their trend is similar to the experimental ODF. The ND fiber intensity of the experimental ODF is the highest at φ 1 = 0° and 90° and the lowest at φ 1 = 45°. This trend is mostly met by the sampled ODF’s but the intensity of the Hybrid IA is low compared to the experimental ODF, while the intensity of the TSOO is slightly higher.
To quantify these findings the error between the intensities of the experimental ODF and the sampled ODF along these fibers is calculated. The absolute mean error and the absolute maximum error over the whole fiber are considered and these results are summarized in Table 3. For the ODF sampled with Hybrid IA, the highest mean and max error is in the α-fiber. The lowest mean and max error is in the γ-fiber with 0.48 and 0.90, respectively. For the ODF sampled with TSOO, the highest mean and max error values of 0.49 and 1.35 are in the ND fiber, and the lowest are found in the γ-fiber with 0.24 and 0.61, respectively. For all three fibers, the absolute mean and the maximum intensity error is lower when using TSOO compared to Hybrid IA.
It must be noted that, since the grains in the microstructure are relatively homogenous (standard deviation of 18.76 µm), the advantage of the TSOO sampling method is minor in this case. A more inhomogeneous microstructure will be assessed next.

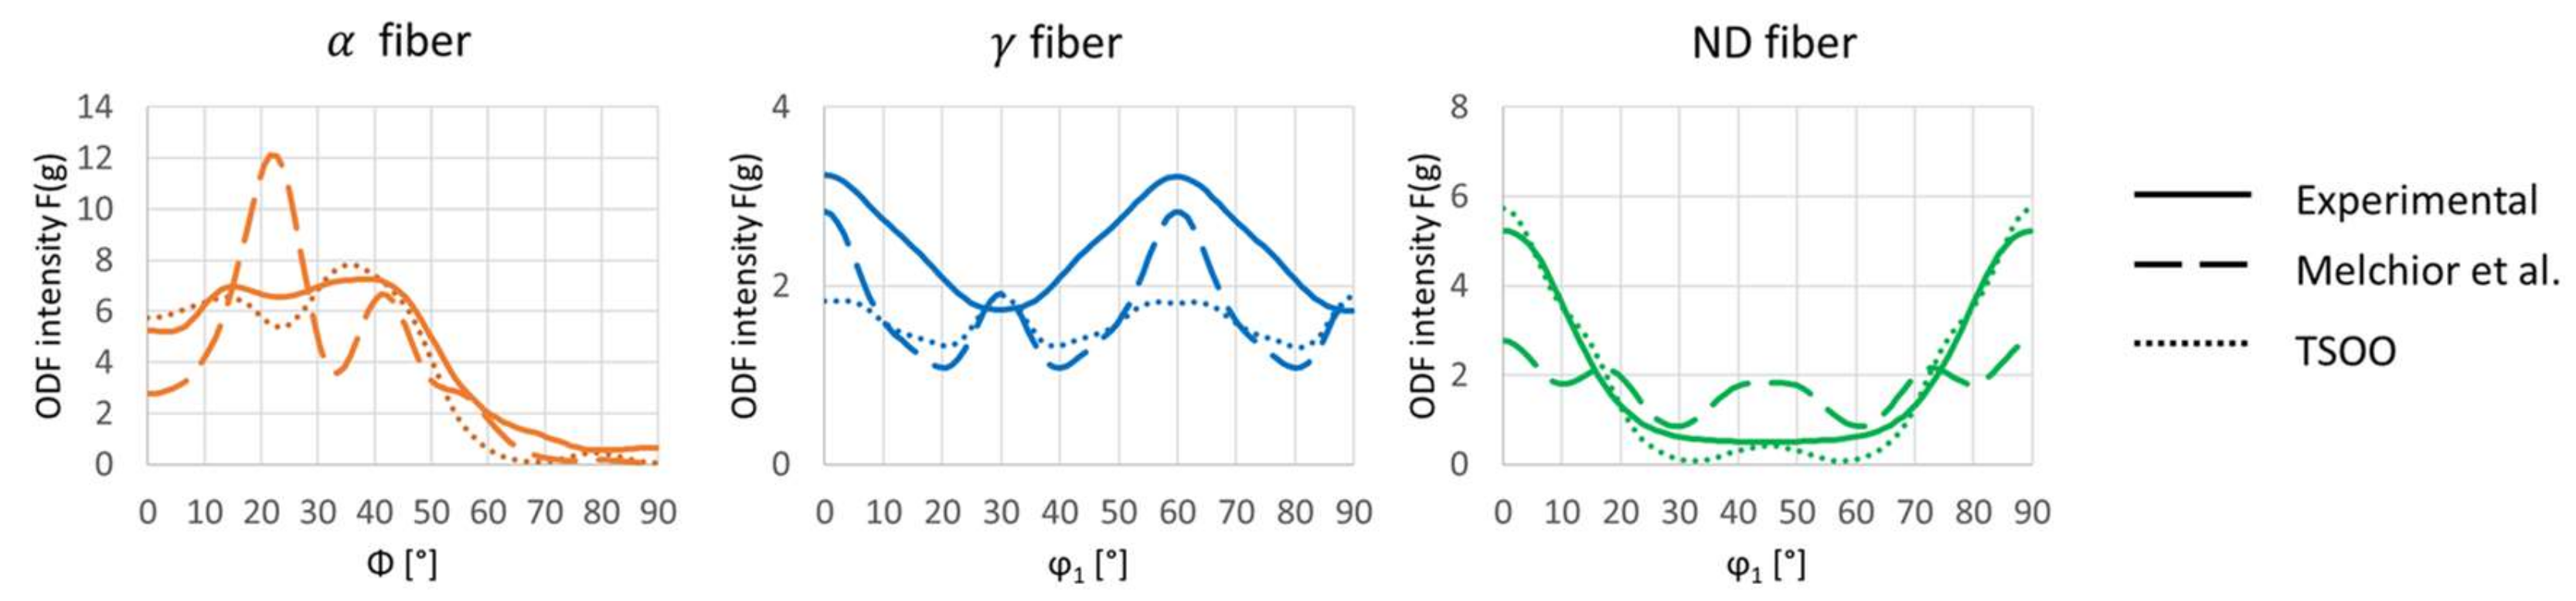
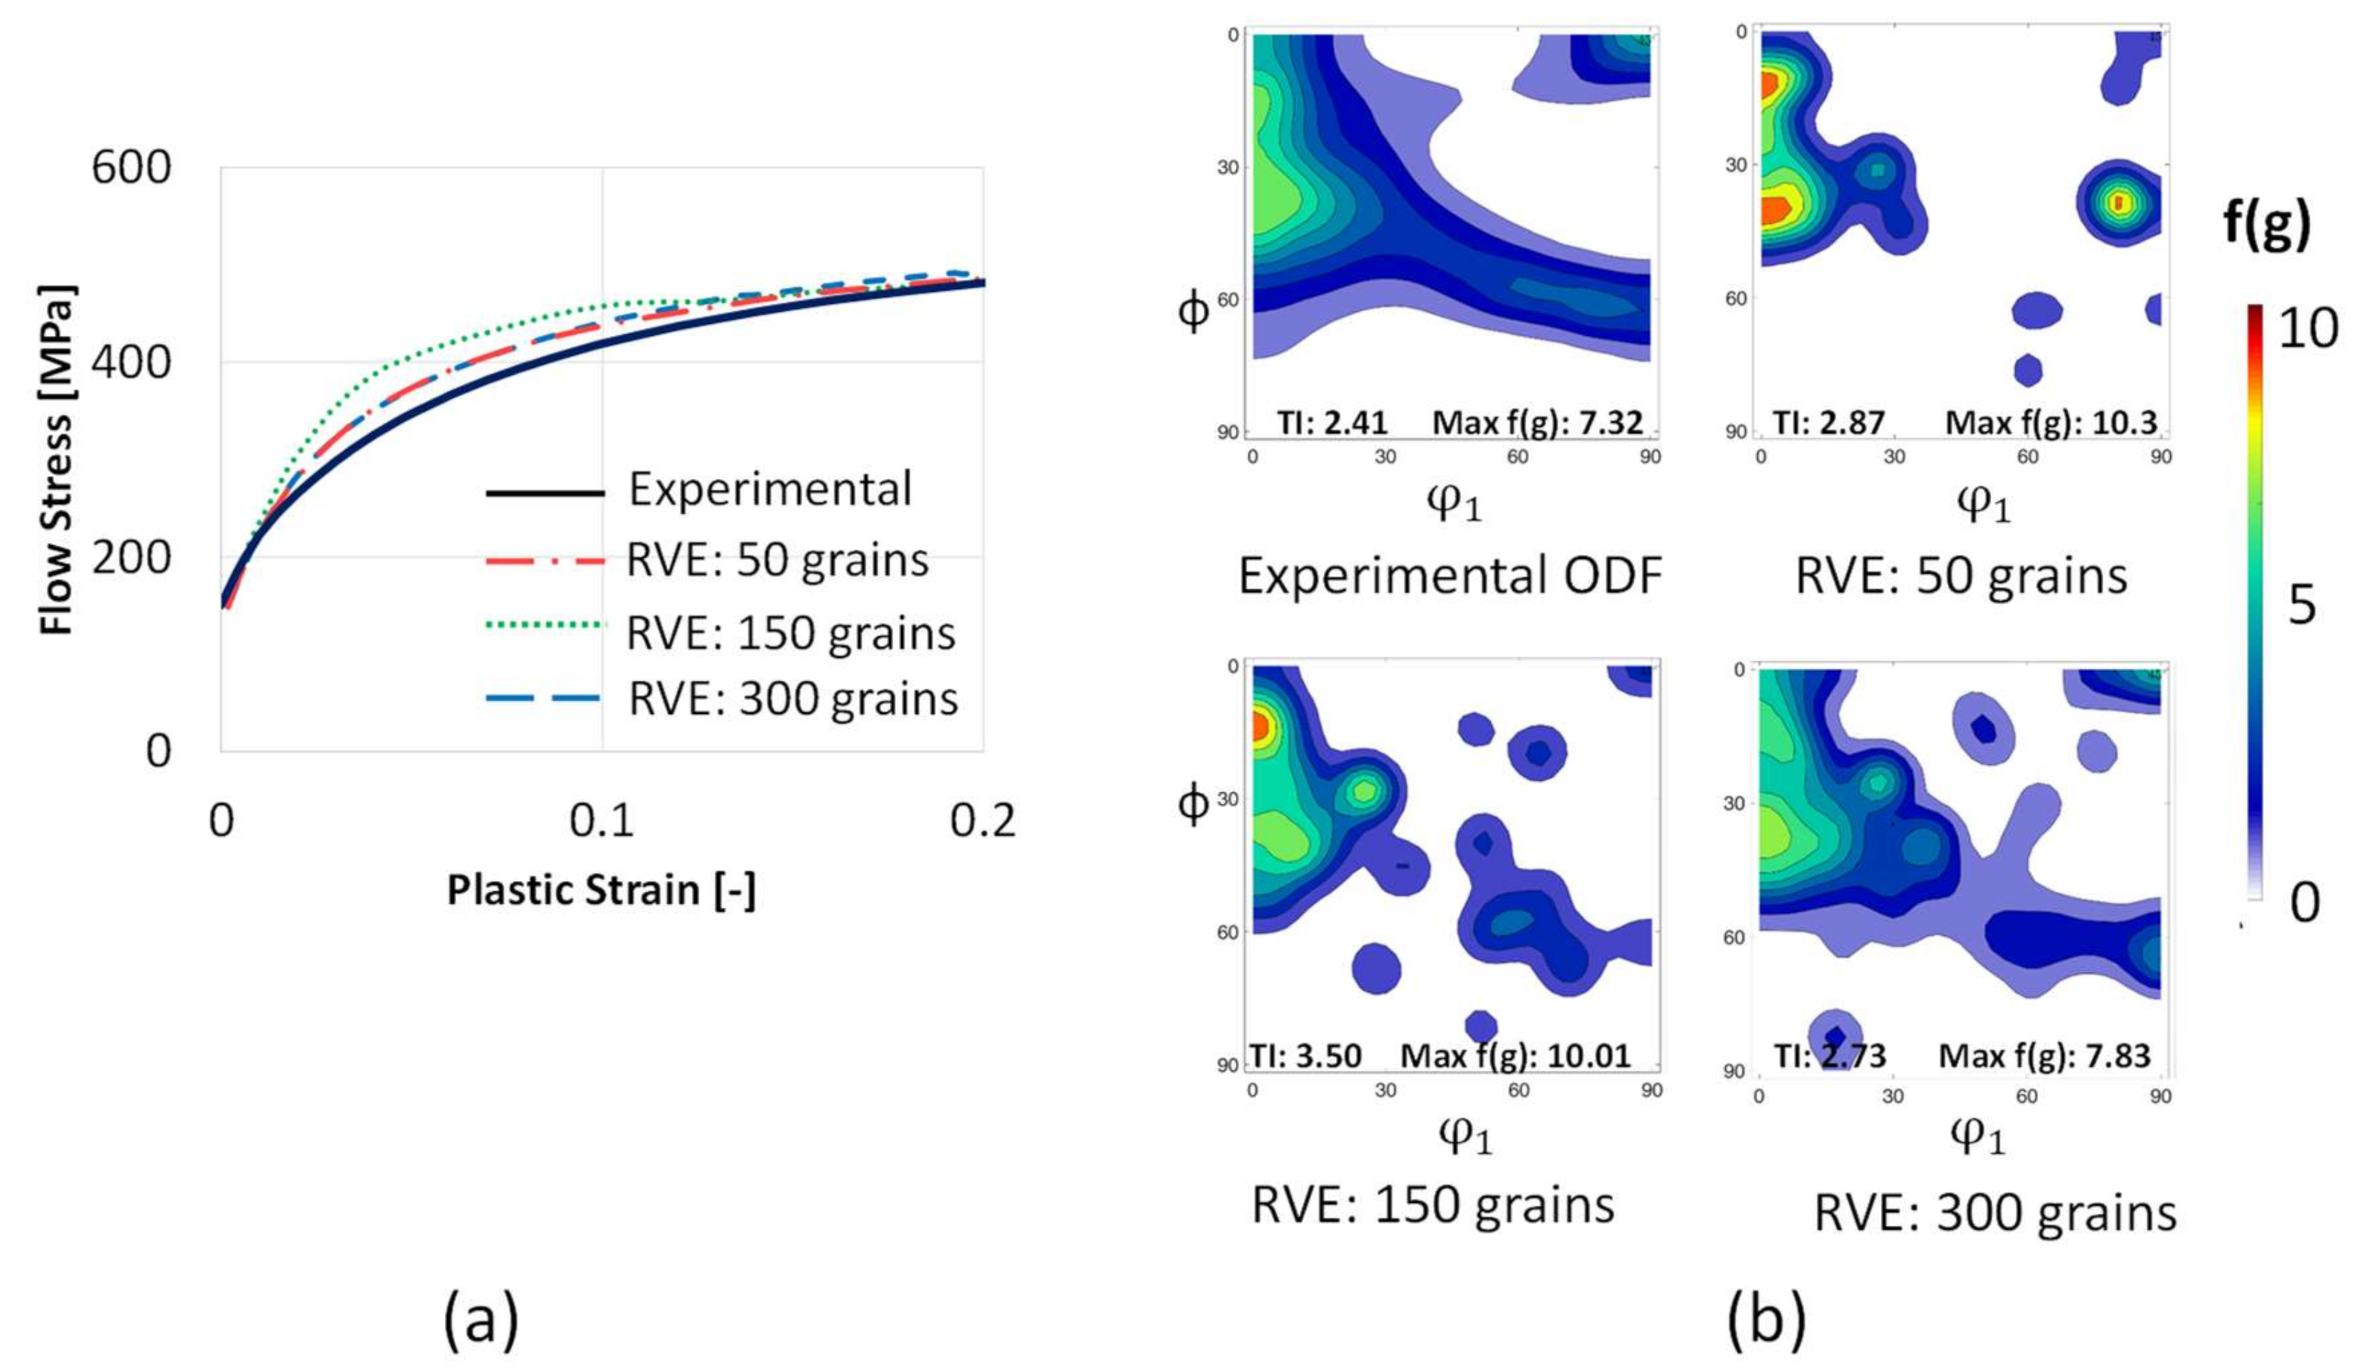
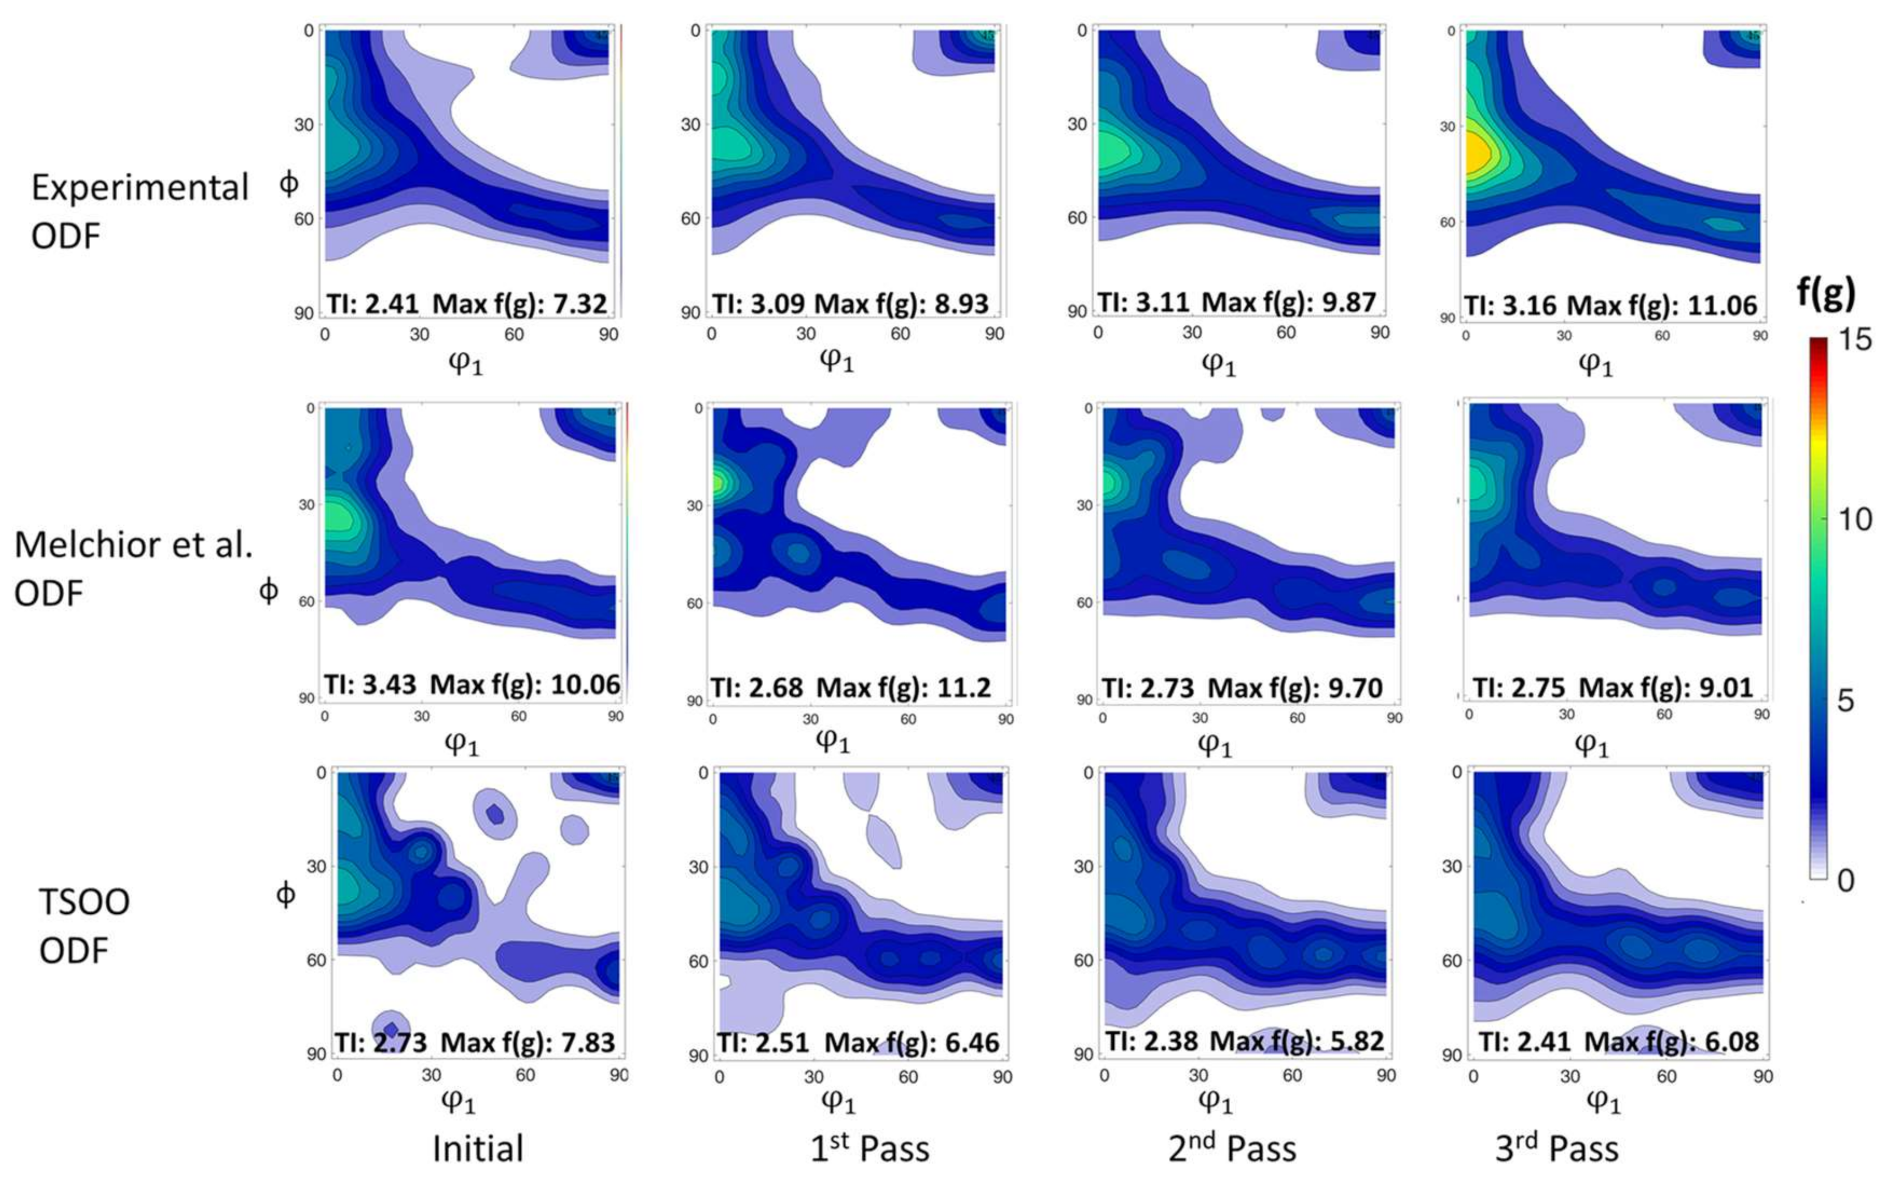
3.3. Texture Representation in the Deformation Microstructure (Case 3)

Finally, the NO electrical steel hot strip deformation microstructure with a high degree of inhomogeneity is considered. As mentioned in Section 2.1, the grain size standard deviation is 48.79 µm and thus much greater than in the annealed sheet. Similar to the annealed strip, the grains in the hot strip were assumed equiaxed and the diameter measured in the 2D micrograph is used for the creation of the 3D RVE. The RVE with 300 grains is constructed based on the experimental grain size distribution shown in Figure 11a by assuming that it follows a log-normal distribution. The resulting RVE grain size distribution is also shown in Figure 11a. Finally, RVE with at least five elements per grain consists of 59,319 elements post meshing and is shown in Figure 11b.
The experimental texture is shown in Figure 12a. The texture represents a predominant α-fiber (<110>//RD) and γ-fiber (<111>//ND) that is typically observed after hot rolling. Since the Hybrid IA method was developed for homogenous grain sizes, the sampling method by Melchior et al. [19] is used as a reference for the inhomogeneous microstructure instead. The ODF reconstructed via Melchior et al. is depicted in Figure 12b. It is observed that the dominant intensities along the α-fiber are well captured but the maximum intensity and TI are slightly higher compared to the experimental ODF. This is also observed in the error ODF, where the absolute error along the α-fiber is high.
The ODF sampled using TSOO is shown in Figure 12c. The maximum intensity and the TI are similar to the experimental ODF of the hot strip. The intensities along the α-fiber and γ-fiber are well replicated and the error along the α-fiber is lower compared to the sampling via Melchior et al.
Again, an in-depth analysis is performed by plotting the intensities along the significant fibers (see Figure 13). In the case of the experimental ODF, the intensity of the α-fiber is maximum at approximately ϕ = 45°, and the intensity is the lowest at ϕ = 90°. The intensities along the γ-fiber fluctuate between 1.8 and 3.2, with the maximum at φ1 = 60°. For the ND fiber, the maximum intensities are at the beginning and end, i.e., φ1 = 0° and φ1 = 90°, while at φ1 = 45° the intensity is the lowest. In the case of the initial ODF reconstructed via Melchior et al., the maximum intensity along the α-fiber is at ϕ = 20° and the intensity drops progressively along the fiber, with a second lower peak at ϕ = 45°. For the γ-fiber, the intensities fluctuate but in general, the tendency of the experimental ODF is not well captured. For the ND fiber, the intensities between φ1 = 20° and φ1 = 70° are higher than the experimental ODF. For the initial ODF sampled with TSSO, the tendency, as well as the maximum intensity along the α-fiber, is well captured. The intensities along the γ-fiber are generally lower than in the experimental ODF, but except between φ1 = 20° and φ1 = 40° the tendency is captured. The ND fiber is well-replicated throughout.
To quantify the results the difference between the intensities along the fibers is again calculated and summarized in Table 4. For the ODF sampled via Melchior et al., the highest mean and maximum error is found in the α-fiber, with values of 1.52 and 5.53, respectively, and the lowest mean and max error is in the γ-fiber, with values of 0.77 and 1.16, respectively. For the ODF sampled with TSOO, the highest mean and maximum error is in the γ-fiber, with values of 0.86 and 1.41, respectively, and the lowest mean and max error is in the ND-fiber, with values of 0.29 and 0.50, respectively. In summary, the absolute mean and max error is lower for TSOO in both the α- and ND-fiber and on par in the γ-fiber.

4. Discussion

In the previous section, the results of the TSOO orientation sampling method have been presented. Next, the characteristics of the TSOO sampling method are analyzed further. Therefore, noise is introduced in an arbitrary use case prior to optimization, and an ODF is reconstructed to check the robustness of the optimization with regard to varying initial states. Finally, the texture evolution during forming is simulated in CP-FEM based on an ODF reconstructed via the Melchior et al. method and via TSOO for further validation.

4.1. Sensitivity of Resulting Texture on the Orientations Used in the Initial Sampling

As discussed earlier, in order to assess the dependence of the TSOO optimization process on the initial state, noise is introduced into one of the sampled ODFs prior to the optimization step via perturbations. The RVE of case 1(a) (shown in Figure 6b) is used for this study. The procedure for introducing the perturbation is detailed in Section 2.2.3. Three different ranges of the random angle are chosen, 0–5°, 0–10°, 0–15°, respectively. Again, the optimization was performed with respect to the experimental texture of the NO electrical steel hot strip. The initial ODFs with perturbations and the corresponding ODFs after optimization are shown in Figure 14. The original ODFs for case 1(a), without noise, are also shown for easier comparison. In the ODFs with noise prior to optimization, the texture randomness increases with an increasing random angle value as expected. In addition, the intensities along the α-fiber substantially drop with more noise. After optimization, the significant α-fiber and γ-fiber reappear, and the maximum intensity and TI are close to the experimental ODF. Although the quality of the ODFs sampled via TSOO decreases with increasing noise levels, the error plots reveal that the orientations along significant fibers are least affected by noise. Thus, the TSOO method seems to be mostly resilient towards small deviations in the initial orientations. However, the optimization time increases nearly twofold for the highest degrees of noise when compared to the original case without noise. Therefore, it seems best to use the most prominent orientations for the creation of the initial state as proposed in Section 2.2.1.

4.2. Assessment of Texture Evolution Prediction Based on CP-FEM Simulations

One of the main applications of texture sampling methods, in general, is the numerical modeling of microstructure evolution during deformation. Hence, the RVE shown in Figure 11b and the ODFs shown in Figure 12 sampled via the Melchior et al. method and via TSOO are used in CP-FEM simulations to analyze the quality of the initial texture. As discussed in Section 2, a three-pass warm rolling process is simulated as a benchmark case.
The experimental and CP-FEM texture evolution for both sampling methods is shown in Figure 15. In the experimental texture, the maximum intensity is along the α-fiber, and this intensity gradually increases during rolling. Additionally, the TI increases during rolling. For the initial ODF sampled via Melchior et al., the maximum intensity is higher than in the experimental ODF. During deformation, the maximum intensity shifts to the orientation φ1 = 0°, ϕ = 25°, φ2 = 45°, and this intensity strongly increases in the first pass and then decreases again in the second and third passes. The TI also increases in the first pass and remains nearly constant in the second and third passes. For the initial ODF sampled with TSOO, the dominant intensity is along the α-fiber, which is similar to the experiment. During deformation, the maximum intensity and TI decreases up to the second pass and increases slightly in the final pass. Here, the maximum intensity is always along the α-fiber, i.e., at φ1 = 0°, ϕ = 45°, φ2 = 45°, like in the experiment.
In general, the CP-FEM simulations used were not also to predict the tendencies observed in the experimental ODF well irrespective of the sampling method. One possible reason for this is that, during warm rolling at 400 °C, in-grain shear bands were observed in the microstructure [22], which were responsible for the high intensity along the α-fiber. A simple phenomenological material model cannot predict the texture evolution due to the formation of these shear bands. The texture modeling due to the shear band formation in DAMASK is only possible when using a physics-based crystal plasticity material model, e.g., the dislocation density model [3]. Furthermore, using a thermo-mechanically coupled solution scheme not only for the macro but also the RVE simulations might further improve the results.
Again, for easier analysis, intensities along the significant fibers after the final rolling pass are plotted in Figure 16. A similar analysis for the initial ODFs was presented in Figure 13. Compared to the initial ODF, intensities along the α-fiber are substantially higher and the highest intensity is now at ϕ = 40°. The tendency along the γ-fiber is similar to the initial state but there is a slight increase in intensity. There is no significant difference between the ND fiber before and after rolling. For the ODF generated after rolling with Melchior et al. along the α-fiber, except between ϕ = 15° and ϕ = 30° the intensity is lower than the experimental ODF. The intensity initially increases until ϕ = 25°, then decreases. Around ϕ = 45°, the intensity is constant and then decreases again until ϕ = 90°. Although the intensity along the γ-fiber is higher than the experimental ODF, the tendency along the fiber is similar. At the beginning and end of the ND fiber, the intensity is lower compared to the experimental ODF, but between φ1 = 20° and φ1 = 70° the value is higher. For the ODF resulting from TSOO after rolling, the intensities along the α-fiber are lower compared to the experimental ODF, but the tendency mostly matches the experiments. For the γ-fiber, although the intensities were lower than in the experimental ODF initially, after rolling the intensities are higher than the experimental ODF and on the same level as the Melchior et al. results. The general tendency is captured but diverges towards lower values between φ1 = 0° and 10° and φ1 = 50° and 70°. For the ND fiber, the intensities before φ1 = 20° and after φ1 = 70° are lower than the experimental ODF while between φ1 = 30° and φ1 = 60° the intensity is similar to the experimental ODF and the general trend is in close proximity.
The summary of the absolute mean and maximum error of the three fibers is shown in Table 5. For the ODF sampled via Melchior et al., the absolute mean error is highest for the γ-fiber with a value of 1.53 and lowest for the ND-fiber. The highest absolute maximum error corresponds to the α-fiber and the lowest absolute error corresponds to the γ-fiber. For the ODF sampled with TSOO, the highest absolute mean error is for the α-fiber and the lowest is for the γ-fiber. The highest and the lowest maximum absolute error is also for the α-fiber and γ-fiber respectively. In general, the error in the intensities along the fibers for both methods in the same range. The TSOO method’s prediction error is lower along the γ-fiber, whereas the Melchior method’s prediction error is lower along the α-fiber and ND fibers.

5. Conclusions

In order to perform microstructural simulations computationally efficiently, experimental texture data consisting of thousands of data points must be represented in an RVE that typically only contains a few hundred grains. This statistical representation is especially challenging for deformation microstructures due to the high degree of grain size inhomogeneity. In this paper, a novel approach for texture sampling using optimization (TSOO) is proposed. An initial guess for the required orientations is first extracted directly from an ODF generated from XRD pole figure data. As this initial guess produces a very strong texture further processing is necessary. Therefore, the orientations are assigned to grains in an RVE and optimized to capture both the underlying texture based on the sampled ODF and the microstructure inhomogeneity.
Different use cases with a varying degree of microstructural inhomogeneity were considered in this paper. The results suggest that the TSOO texture sampling method proposed in this paper can be universally applied to both homogeneous and inhomogeneous microstructures. This was verified based on two practical examples for NO electrical steels, with annealed homogenous and deformed inhomogeneous microstructures. The sensitivity of the method with respect to different initial states was trialed based on artificial noise. The influence of the initial state on prediction quality was minor, suggesting high robustness. However, computational efficiency suffered from a noisy initial state. In summary, this novel method for texture sampling can be used to correlate grain size measurements and texture data and to generate RVEs for CP-FEM simulations.
Despite these promising first results, a conclusive assessment of the TSOO performance is not yet possible. For this, the CP-FEM simulation used must be further improved, e.g., by choosing a more sophisticated physics-based material model so that the experimental texture evolution can be better reproduced.
Additionally, some extensions to the TSOO concept could be trialed in the future: Currently, the TSOO optimization is performed such that the Euler angles of every grain are adjusted. Multiple cycles of optimizations can be incorporated into TSOO in order to improve the quality of the texture sampling. In addition, to reduce the computational costs of the method, other combinations, e.g., optimizing multiple grains together could be investigated. Finally, the misorientation information measured, e.g., from EBSD can be incorporated into the RVE to further improve the sampling quality. For this, the cost function must be modified so that the morphology of the RVE can also be adjusted so that the misorientation distribution is reflected in the RVE.

Author Contributions

Conceptualization, A.V., A.K. and J.L.; methodology, A.V., A.K. and J.L; validation, A.V.; formal analysis, A.V.; investigation, A.V.; data curation, A.V.; writing—original draft preparation, A.V.; writing—review and editing, J.L.; visualization, A.V.; supervision, A.K. and J.L; project administration, J.L. All authors have read and agreed to the published version of the manuscript.

Funding

This research was funded by the Deutsche Forschungsgemeinschaft (DFG, German Research Foundation), grant number 255707264.

Data Availability Statement

The data presented in this study is available on request from the corresponding author.

Acknowledgments

The authors would also thank the Institute of Metal Forming (IMF), TU Bergakademie Freiberg for providing the hot-rolled material as well as the grain size measurements and the Institute of Physical Metallurgy and Metal Physics (IMM), RWTH Aachen University for providing the grain size measurements of the annealed strip and XRD investigations. We would also like to acknowledge the developers of MTEX, Neper, and DAMASK for their effort in developing open-source software.

Conflicts of Interest

The authors declare no conflict of interest.

References

  1. Ghosh, P.; Chromik, R.R.; Knight, A.M.; Wakade, S.G. Effect of metallurgical factors on the bulk magnetic properties of non-oriented electrical steels. J. Magn. Magn. Mater. 2014, 356, 42–51. [Google Scholar] [CrossRef]
  2. Bunge, H.J. Texture and Magnetic Properties. Textures Microstruct. 1970, 11, 75–91. [Google Scholar] [CrossRef] [Green Version]
  3. Roters, F.; Diehl, M.; Shanthraj, P.; Eisenlohr, P.; Reuber, C.; Wong, S.L.; Maiti, T.; Ebrahimi, A.; Hochrainer, T.; Fabritius, H.O.; et al. DAMASK—The Düsseldorf Advanced Material Simulation Kit for modeling multi-physics crystal plasticity, thermal, and damage phenomena from the single crystal up to the component scale. Comput. Mater. Sci. 2019, 158, 420–478. [Google Scholar] [CrossRef]
  4. Lebensohn, R.A.; Tomé, C.N. A self-consistent anisotropic approach for the simulation of plastic deformation and texture development of polycrystals: Application to zirconium alloys. Acta Metall. Et Mater. 1993, 41, 2611–2624. [Google Scholar] [CrossRef]
  5. Lebensohn, R.A.; Castañeda, P.P.; Brenner, R.; Castelnau, O. Full-Field vs. Homogenization Methods to Predict Microstructure–Property Relations for Polycrystalline Materials; Springer: Boston, MA, USA, 2011. [Google Scholar]
  6. Salih, M.Z.; Weidenfeller, B.; Al-hamdany, N.; Brokmeier, H.-G.; Gan, W.M. Magnetic properties and crystallographic textures of Fe 2.6% Si after 90% cold rolling plus different annealing. J. Magn. Magn. Mater. 2014, 354, 105–111. [Google Scholar] [CrossRef]
  7. Swaminathan, S.; Ghosh, S.; Pagano, N.J. Statistically Equivalent Representative Volume Elements for Unidirectional Composite Microstructures: Part I—Without Damage. J. Compos. Mater. 2006, 40, 583–604. [Google Scholar] [CrossRef]
  8. Galán López, J.; Kestens, L.A.I. A multivariate grain size and orientation distribution function: Derivation from electron backscatter diffraction data and applications. J. Appl. Crystallogr. 2021, 54, 148–162. [Google Scholar] [CrossRef] [PubMed]
  9. Hielscher, R. Kernel density estimation on the rotation group and its application to crystallographic texture analysis. J. Multivar. Anal. 2013, 119, 119–143. [Google Scholar] [CrossRef]
  10. Qayyum, F.; Chaudhry, A.A.; Guk, S.; Schmidtchen, M.; Kawalla, R.; Prahl, U. Effect of 3D Representative Volume Element (RVE) Thickness on Stress and Strain Partitioning in Crystal Plasticity Simulations of Multi-Phase Materials. Crystals 2020, 10, 944. [Google Scholar] [CrossRef]
  11. Engler, O.; Randle, R. Introduction to Texture Analysis Macrotexture, Microtexture, and Orientation; CRC Press: Boca Raton, FL, USA, 2009. [Google Scholar]
  12. Hielscher, R.; Schaeben, H. A novel pole figure inversion method: Specification of the MTEX algorithm. J Appl Cryst. 2008, 41, 1024–1037. [Google Scholar] [CrossRef]
  13. Eisenlohr, P.; Roters, F. Selecting a set of discrete orientations for accurate texture reconstruction. Comput. Mater. Sci. 2008, 42, 670–678. [Google Scholar] [CrossRef]
  14. Tóth, L.S.; Van Houtte, P. Discretization techniques for orientation distribution functions. Textures Microstruct. 1970, 19, 224–229. [Google Scholar] [CrossRef]
  15. Leffers, T.; Juul Jensen, D. Evaluation of the effect of initial texture on the development of deformation texture. Textures Microstruct. 1970, 6, 231–254. [Google Scholar] [CrossRef] [Green Version]
  16. Biswas, A.; Vajragupta, N.; Hielscher, R.; Hartmaier, A. Optimized reconstruction of the crystallographic orientation density function based on a reduced set of orientations. J. Appl. Crystallogr. 2020, 53, 178–187. [Google Scholar] [CrossRef] [PubMed] [Green Version]
  17. Helming, K.; Tamm, R.; Fels, B. An Automated Component Method. MSF 1998, 273–275, 119–124. [Google Scholar] [CrossRef]
  18. Schaeben, H.; Bachmann, F.; Fundenberger, J.-J. Construction of weighted crystallographic orientations capturing a given orientation density function. J. Mater. Sci. 2017, 52, 2077–2090. [Google Scholar] [CrossRef]
  19. Melchior, M.A.; Delannay, L. A texture discretization technique adapted to polycrystalline aggregates with non-uniform grain size. Comput. Mater. Sci. 2006, 37, 557–564. [Google Scholar] [CrossRef]
  20. Bachmann, F.; Hielscher, R.; Schaeben, H. Texture Analysis with MTEX—Free and Open Source Software Toolbox. SSP 2010, 160, 63–68. [Google Scholar] [CrossRef] [Green Version]
  21. Quey, R.; Dawson, P.R.; Barbe, F. Large-scale 3D random polycrystals for the finite element method: Generation, meshing and remeshing. Comput. Methods Appl. Mech. Eng. 2011, 200, 1729–1745. [Google Scholar] [CrossRef] [Green Version]
  22. Wei, X.; Krämer, A.M.; Hirt, G.; Stöcker, A.; Kawalla, R.; Heller, M.; Korte-Kerzel, S.; Leuning, N.R.; Hameyer, K. Cold Rolling Strategies for Improving the Magnetic Properties of Non-Grain-Oriented Electrical Steel. In Proceedings of the METEC & 4th ESTAD 2019, European Steel Technology and Application Days: CCD Congress Center Düsseldorf, Düsseldorf, Germany, 24–28 June 2019. [Google Scholar]
  23. Wei, X.; Hojda, S.; Dierdorf, J.; Lohmar, J.; Hirt, G. Model for Texture Evolution in Cold Rolling of 2.4 wt.-% Si Non-Oriented Electrical Steel. In AIP Conference Proceedings; AIP Publishing LLC: Melville, NY, USA, 2017; Volume 1896, pp. 1–6. [Google Scholar]
  24. Vuppala, A.; Wei, X.; Hojda, S.; Teller, M.; Hirt, G. Investigation of texture evolution during rolling simulation of non-oriented SI based electrical steels with 2D and 3D RVE. In Proceedings of the 6th European Conference on Computational Mechanics (ECCM 6), Glasgow, UK, 11–15 June 2018. [Google Scholar]
Figure 1. (a) Measured micrograph and the extracted grain size distribution of the annealed strip, (b) Measured micrograph and the extracted grain size distribution of the hot strip.
Crystals 11 01021 g001
Figure 2. (a) Experimental ODF of the annealed and hot strips, (b) Flow curves of the hot strip for three strain rates.
Crystals 11 01021 g002
Figure 3. Flow diagram illustrating the initial orientation sampling.
Crystals 11 01021 g003
Figure 4. Flow chart illustrating the optimization process for each grain. All grains are optimized once starting from the biggest.
Crystals 11 01021 g004
Figure 5. (a) Homogenized flow stress extracted from RVEs with a varying number of grains, (b) Results of the TSOO method for RVEs with a varying number of grains.
Crystals 11 01021 g005
Figure 6. (a) Grain size distributions with varying inhomogeneity investigated in this study, (b) Corresponding RVEs created for each grain size distribution.
Crystals 11 01021 g006
Figure 7. Experimental ODF of the hot strip along with the initial ODF and sampled ODF via TSOO for different artificially generated grain size distributions along with the absolute error ODF.
Crystals 11 01021 g007
Figure 8. (a) Comparison of the grain size distribution from experiment and RVE for an annealed microstructure; (b) RVE created to replicate the experimental microstructure.
Crystals 11 01021 g008
Figure 9. (a) Experimental texture measured for the annealed strip with XRD; (b) ODF generated with Hybrid IA [13]; (c) ODF sampled using TSOO.
Crystals 11 01021 g009
Figure 10. Comparison of ODF intensities along relevant fibers for the investigated sampling methods in the annealed strip.
Crystals 11 01021 g010
Figure 11. (a) Comparison of the grain size distribution from experiment and RVE for a hot rolled microstructure; (b) the RVE created to replicate the experimental microstructure.
Crystals 11 01021 g011
Figure 12. (a) Experimental texture for the hot strip measured with XRD; (b) ODF generated using the method by Melchior et al. [19]; (c) ODF sampled via TSOO.
Crystals 11 01021 g012
Figure 13. Comparison of ODF intensities along relevant fibers for the investigated sampling methods in the hot strip prior to warm rolling.
Crystals 11 01021 g013
Figure 14. Initial ODFs and optimized ODFs generated by TSOO for case 1(a) with different artificial noise levels.
Crystals 11 01021 g014
Figure 15. Experimental and simulated texture at the start and end of each rolling pass.
Crystals 11 01021 g015
Figure 16. Comparison of ODF intensities along relevant fibers for the investigated sampling methods after warm rolling.
Crystals 11 01021 g016
Table 1. Chemical composition of the annealed and hot strip.
Chemical
Element
SiAlMnPSC Fe
Annealed strip
weight-%
3.160.890.170.0120.0010.002balance
Hot strip
weight-%
2.40.390.300.0210.0030.002balance
Table 2. DAMASK Phenopower law parameters used in the CP-FEM simulation.
Elastic Parameters
C11C12C24
232.2 GPa 135.6 GPa 117.0 GPa
Plastic Parameters
γ ˙ 0 n τ 0 c τ s h 0 a
<111> {110}0.01 s−177145.05 MPa314.60 MPa2.77 × 1092.12
<111> {211}0.01 s−177140.30 MPa323.16 MPa2.77 × 1092.12
Table 3. Summary of the absolute mean and maximum error of the relevant fibers with respect to the experimental ODF.
α-Fiberγ-FiberND-Fiber
Mean ErrorMax ErrorMean ErrorMax ErrorMean ErrorMax Error
Experimental vs. Hybrid IA1.061.840.480.900.791.83
Experimental vs. TSOO0.400.990.240.610.491.35
Table 4. Summary of the absolute mean and maximum error of the relevant fibers with respect to the experimental ODF.
α-Fiberγ-FiberND-Fiber
Mean ErrorMax ErrorMean ErrorMax ErrorMean ErrorMax Error
Experimental vs. Melchior1.525.530.771.161.092.54
Experimental vs. TSOO0.671.470.861.410.290.50
Table 5. Summary of the absolute mean and maximum error of relevant fibers with respect to the experimental ODF.
α-Fiberγ-FiberND-Fiber
Mean ErrorMax ErrorMean ErrorMax ErrorMean ErrorMax Error
Experimental vs. Melchior1.435.531.532.000.654.83
Experimental vs. TSOO1.995.870.871.360.923.21
Publisher’s Note: MDPI stays neutral with regard to jurisdictional claims in published maps and institutional affiliations.

