Article

Effect of Fe2O3 on Electro-Deoxidation in Fe2O3-Al2O3-NaCl-KCl System

College of Metallurgy and Energy, North China University of Science and Technology, Tangshan 063210, China
*
Author to whom correspondence should be addressed.
Crystals 2021, 11(9), 1026; https://doi.org/10.3390/cryst11091026
Submission received: 7 August 2021 / Revised: 22 August 2021 / Accepted: 24 August 2021 / Published: 26 August 2021
(This article belongs to the Special Issue Metallurgical Slag)

Abstract

:
The reduction of Fe2O3-Al2O3 is one of the important reactions in the resource utilization of iron-containing oxide waste. Fe2O3-Al2O3 was electro-deoxidized in the NaCl-KCl system by molten salt electrolysis to prepare FeO/Al2O3. The effect of the Fe2O3 content on the electro-deoxidation reaction process was studied. The results show that under the conditions of 850 °C, 2.3 V, and electro-deoxidation for 4 h, FeO/Al2O3 could be obtained by controlling the content of Fe2O3. The deoxidation process was divided into three stages: electric double layer charging, Fe2O3 electro-deoxidation to Fe3O4, and Fe3O4 electro-deoxidation to FeO. With the increase in the Fe2O3 content, the deoxidation reaction rate increased, and the low-valence iron oxide particles obtained by electro-deoxidation became larger. The mechanism of the influence of Fe2O3 on the electro-deoxygenation process was determined by analyzing the experimental results. The increase in the Fe2O3 content increased the concentration of activated molecules in the system, while it reduced the resistance of electro-deoxidation. The migration of active particles in the cathode was smoother, which increased the percentage of deoxygenation of activated molecules, thereby shortening the process of the deoxidation reaction.

1. Introduction

Fe2O3 and Al2O3 are the main components of solid waste such as red mud, blast furnace slag, and zinc kiln slag [1,2,3]. In order to treat these solid wastes as resources, researchers have reduced Fe2O3 to low-valent FeO or Fe3O4 through fire and wet methods and finally obtained metallic iron [4,5], ferroalloys [6], roadbed materials [7], and Fe-FeAl2O4 composite materials [3,8,9]. Therefore, the reduction reaction of the Fe2O3-Al2O3 system is an important reaction to realize the resource treatment of solid waste, and research on the system reaction is of great significance.
At present, the reduction reaction of the Fe2O3-Al2O3 system is mainly through C reduction [10,11], H2 reduction [12,13], CO reduction [14], and CO-CO2 [15] reduction. These methods have high energy consumption and CO2 emission problems. In recent years, the widely used molten salt electrolysis method has been used as a typical electrochemical method with low energy consumption and no CO2 emissions. It mainly includes the FFC method [16], the SOM method [17], the OS calcium thermal method [18], and the USTB method [19]. Through molten salt electrolysis, high-melting point metals, metal alloys, intermetallic compounds, and carbide ceramics were prepared in molten salt systems such as CaCl2-NaCl and NaCl-KCl [20]. Electro-deoxidation research on the Fe2O3-Al2O3 system mainly focused on the preparation of FeAl and its intermetallic compounds [21,22,23,24], while the intermediate product FeO-Al2O3 has received fewer reports. The reduction reaction of Fe2O3-Al2O3 to FeO-Al2O3 is a necessary process for the reduction of Fe2O3-Al2O3 to metal Fe, FeAl, or its intermetallic compounds. It is one of the key links to obtaining the reduction mechanism of Fe2O3-Al2O3.
Herein, reduction of Fe2O3-Al2O3 to FeO-Al2O3 was studied by using molten salt electrolysis at 850 °C in a NaCl-KCl melt. The microstructure and phase composition of the deoxygenated products were examined by using SEM and XRD. By examining the changes in the composition and structure of the cathode during the electrolysis process, the influence law of the Fe2O3 content on the electrolysis process and the electrosynthesis pathway of FeO-Al2O3 in molten salt were also studied.

2. Experimental

The raw materials in this experiment, namely, pure Al2O3 (Macklin Group Co., Ltd., Shanghai, China, Analytical reagent) and Fe2O3 (Sinopharm Group Co., Ltd., Shanghai, China, Analytical reagent) powders, were used as the cathode precursors. First, the amounts of Al2O3 and Fe2O3 were ball milled in ethanol for 6 h according to the mass ratio in Table 1. Then, the slurry was vacuum dried for 4 h, and the powder mixture was pressed into cylindrical pellets (10 × 3 × 1 mm3) under a uniaxial pressure of 8 MPa. The pellets were sintered at 800 °C for 4 h under argon flow to obtain cathode pellets. Then, the cathode pellets were connected to a 304 stainless-steel wire to assemble the cathode. A high-density graphite sheet (100 × 15 × 5 mm3) served as the anode. A eutectic mixture of NaCl-KCl (NaCl/KCl = 50.6:49.4 mol %, Sinopharm Group Co., Ltd., Shanghai, China, Analytical reagent) was used as the electrolyte, which was packed in a graphite crucible and dehydrated at 300 °C for 24 h. The graphite crucible, filled with the mixed salt, was introduced into the bottom of a tube furnace. Then, the furnace was sealed, and ultra-high purity argon gas was flushed into the reactor to provide a protective atmosphere. The furnace temperature was increased to 850 °C under continuous argon circulation. Then, a fresh graphite sheet and cathode were lowered into the melt. The electrolysis was carried out at 2.3 V for 4 h. After electrolysis, the samples were carefully rinsed with distilled water several times to remove the adhering salt and immersed in distilled water for 12 h, followed by drying at 150 °C for 0.5 h. The schematic illustration of the electrochemical deoxidation is shown in Figure 1.
The phase composition was identified by using X-ray diffraction (XRD, XPert PRO MPD, PANalytical, Almelo, The Netherlands). The microstructure and element analyses were carried out with SEM and EDS (GeminiSEM 300, Zeiss, Germany), respectively.

3. Results and Discussion

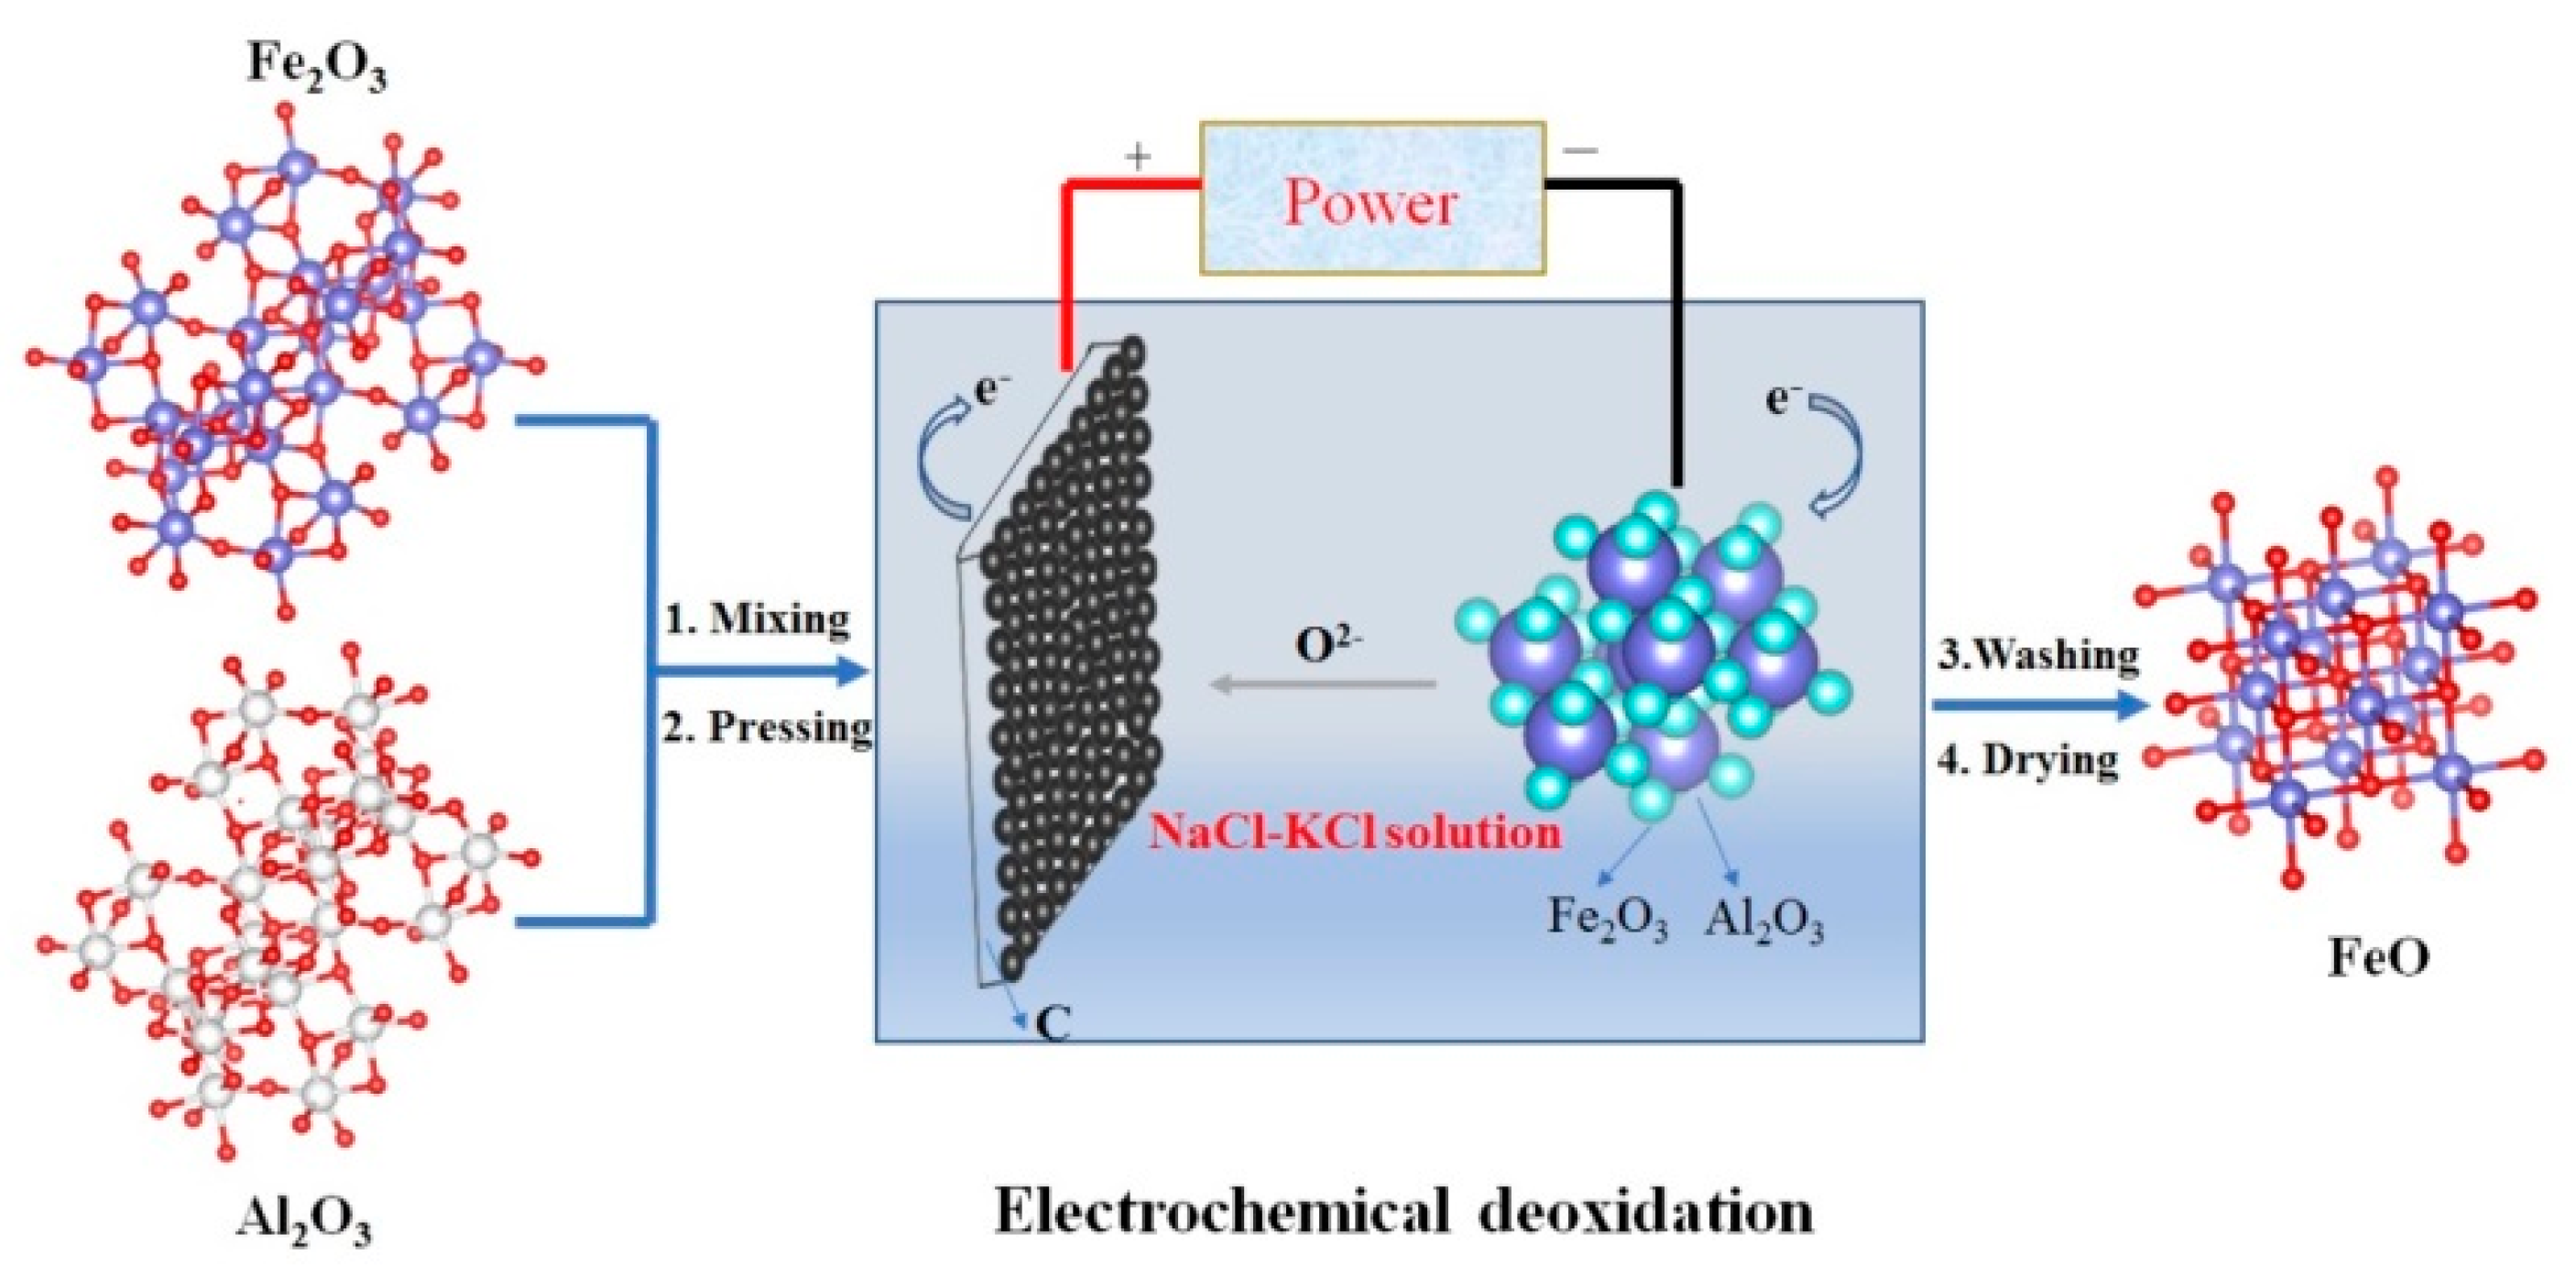
3.1. Thermodynamic Analysis and Electrochemical Reduction of Fe2O3-Al2O3

When energized, the Al2O3 and Fe2O3 in the molten salt would undergo the following electrolysis reactions:
Al2O3(s) = 2Al(s) + 2/3O2(g)
Fe2O3(s) = 2/3Fe3O4 + 1/6O2(g)
Fe3O4(s) = 3FeO + 1/2O2(g)
FeO(s) = Fe + 1/2O2(g)
The standard Gibbs free energy of the possible reaction of Fe2O3 and Al2O3 in the molten salt system at different temperatures could be calculated by using FactSage7.3. The standard theoretical decomposition voltage EΘ was calculated by Formula (5).
ΔGΘ = −nFEΘ
where ΔGΘ is the standard Gibbs free energy (kJ·mol−1); EΘ is the theoretical decomposition voltage in the standard state (V); F is the Faraday constant (96,485 C·mol−1); and n is the number of electrons gained or lost in the reaction equation.
Figure 2 shows the change curve of EΘ with T in different reactions. As the reaction temperature increases, EΘ becomes more positive. At 600~1100 °C, the order of reaction among (1)~(4) is (2) > (3) > (4) > (1).

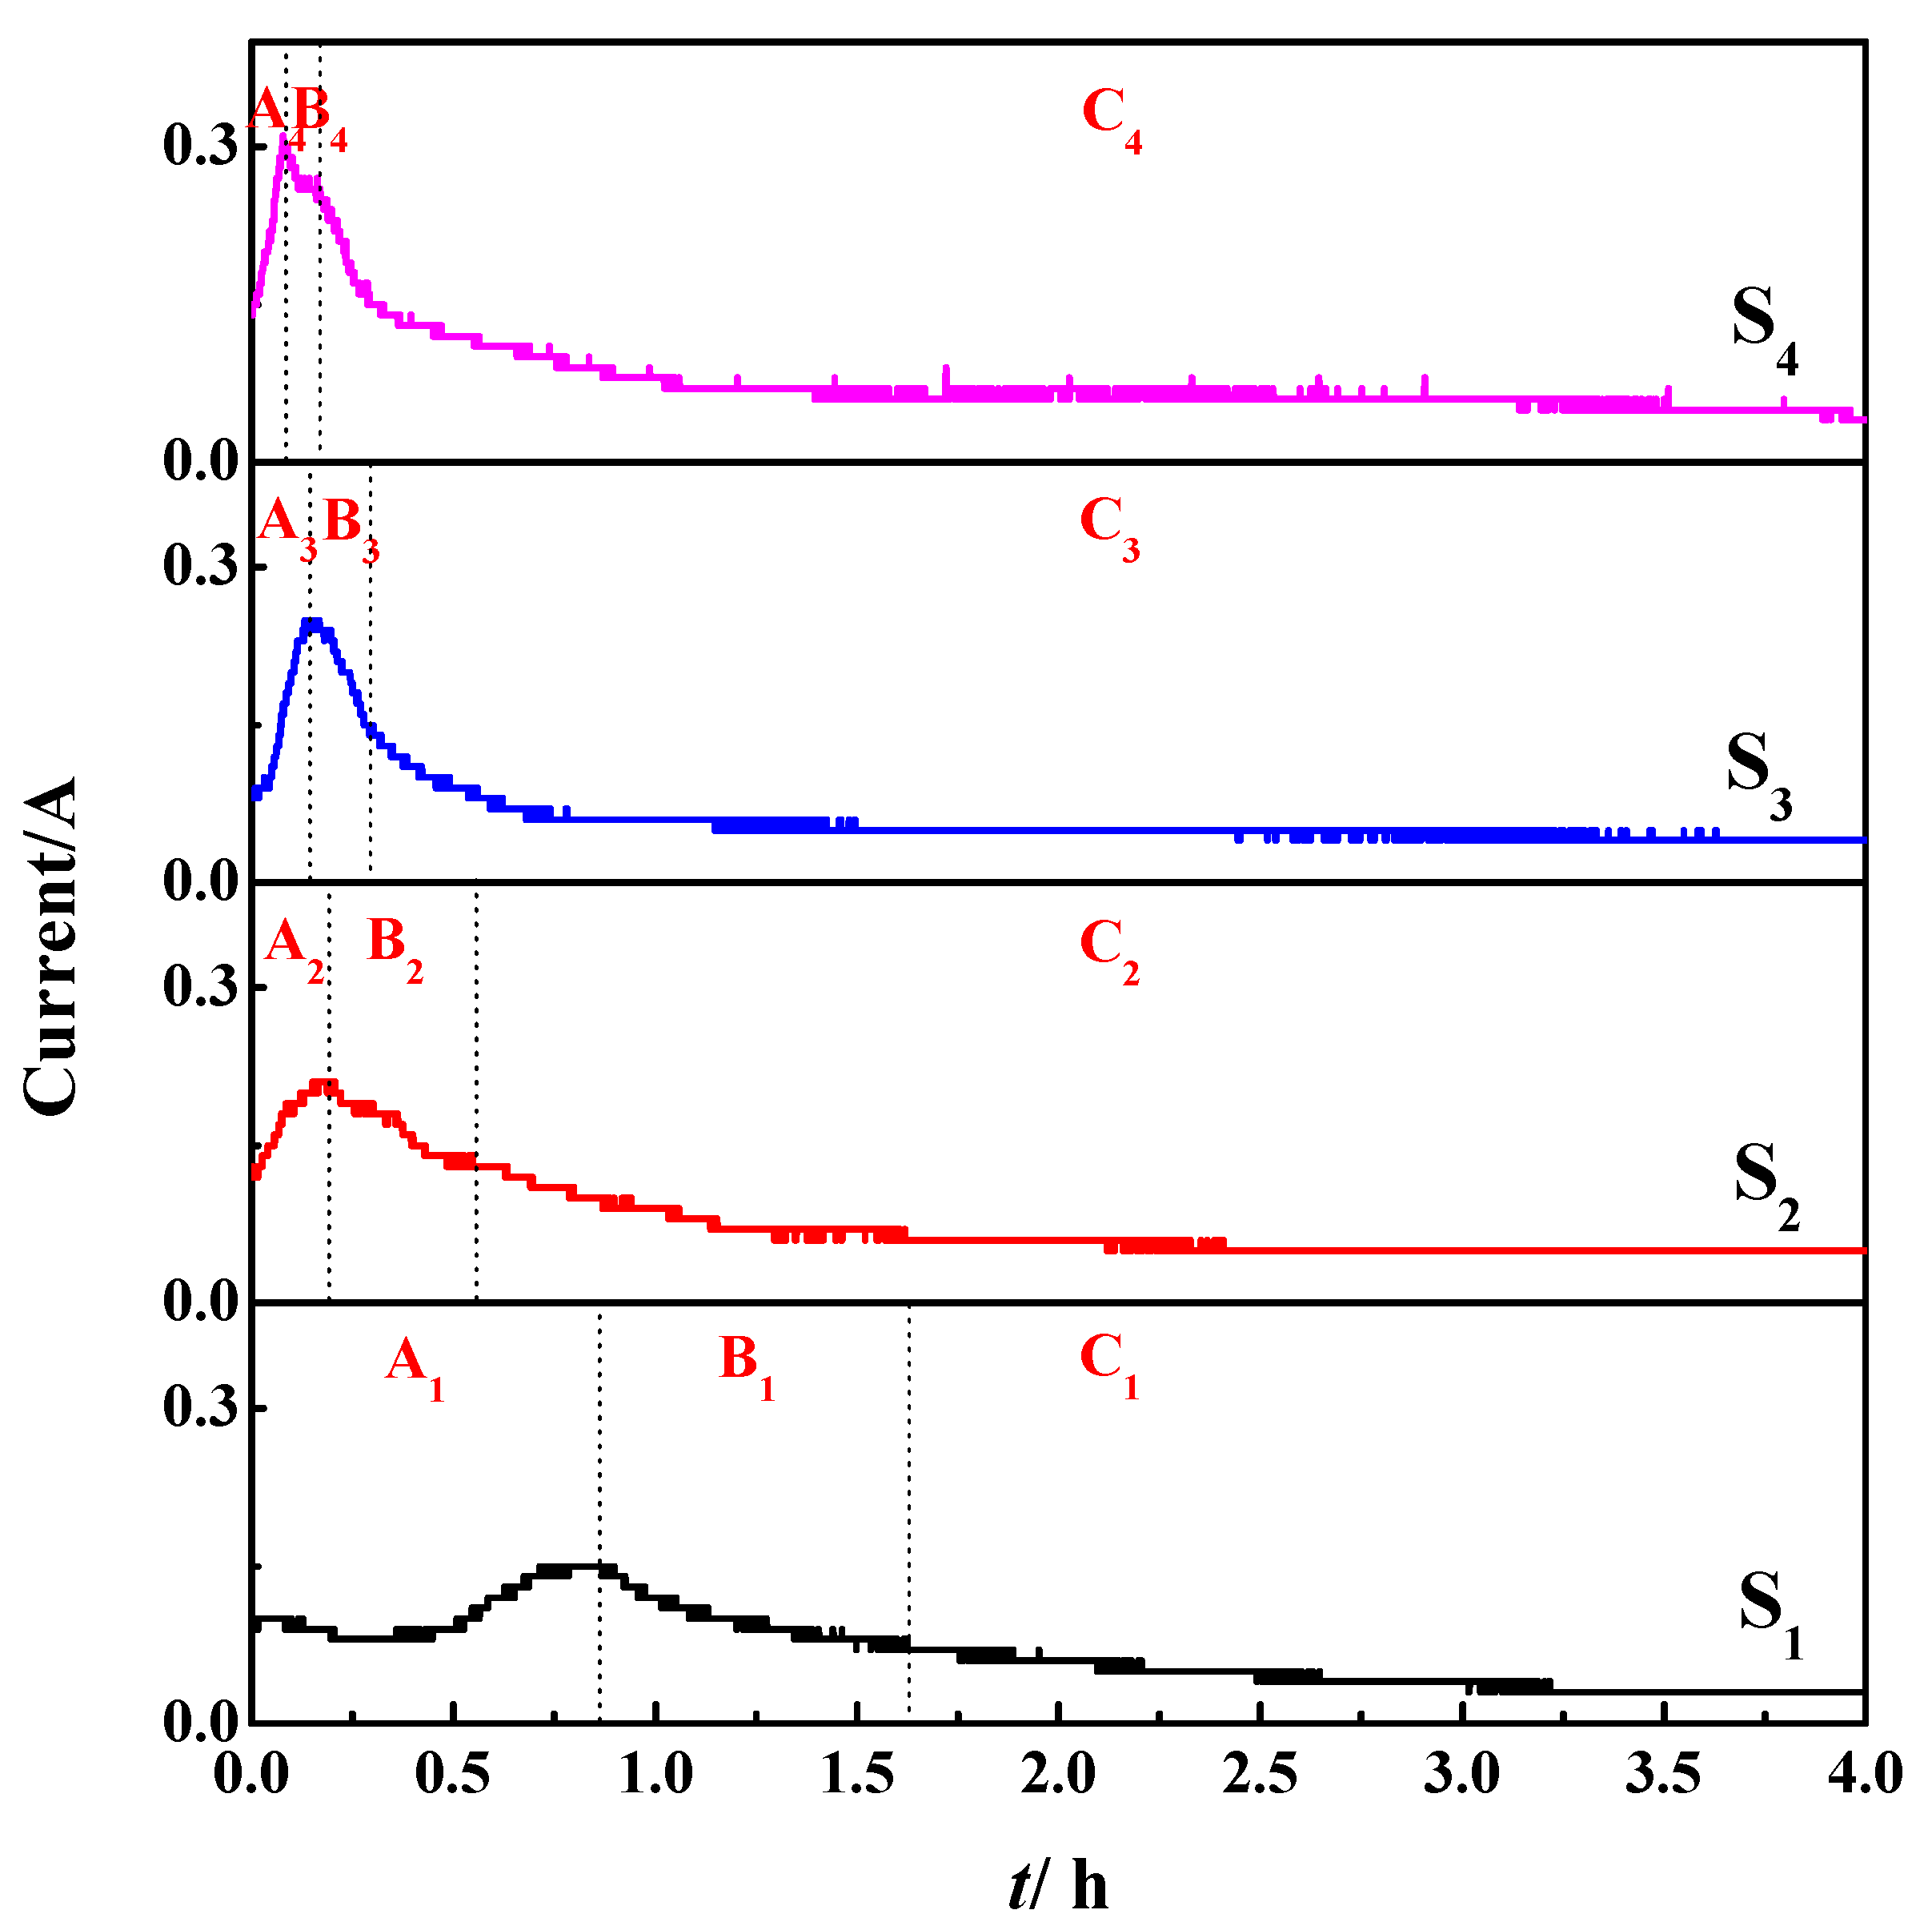
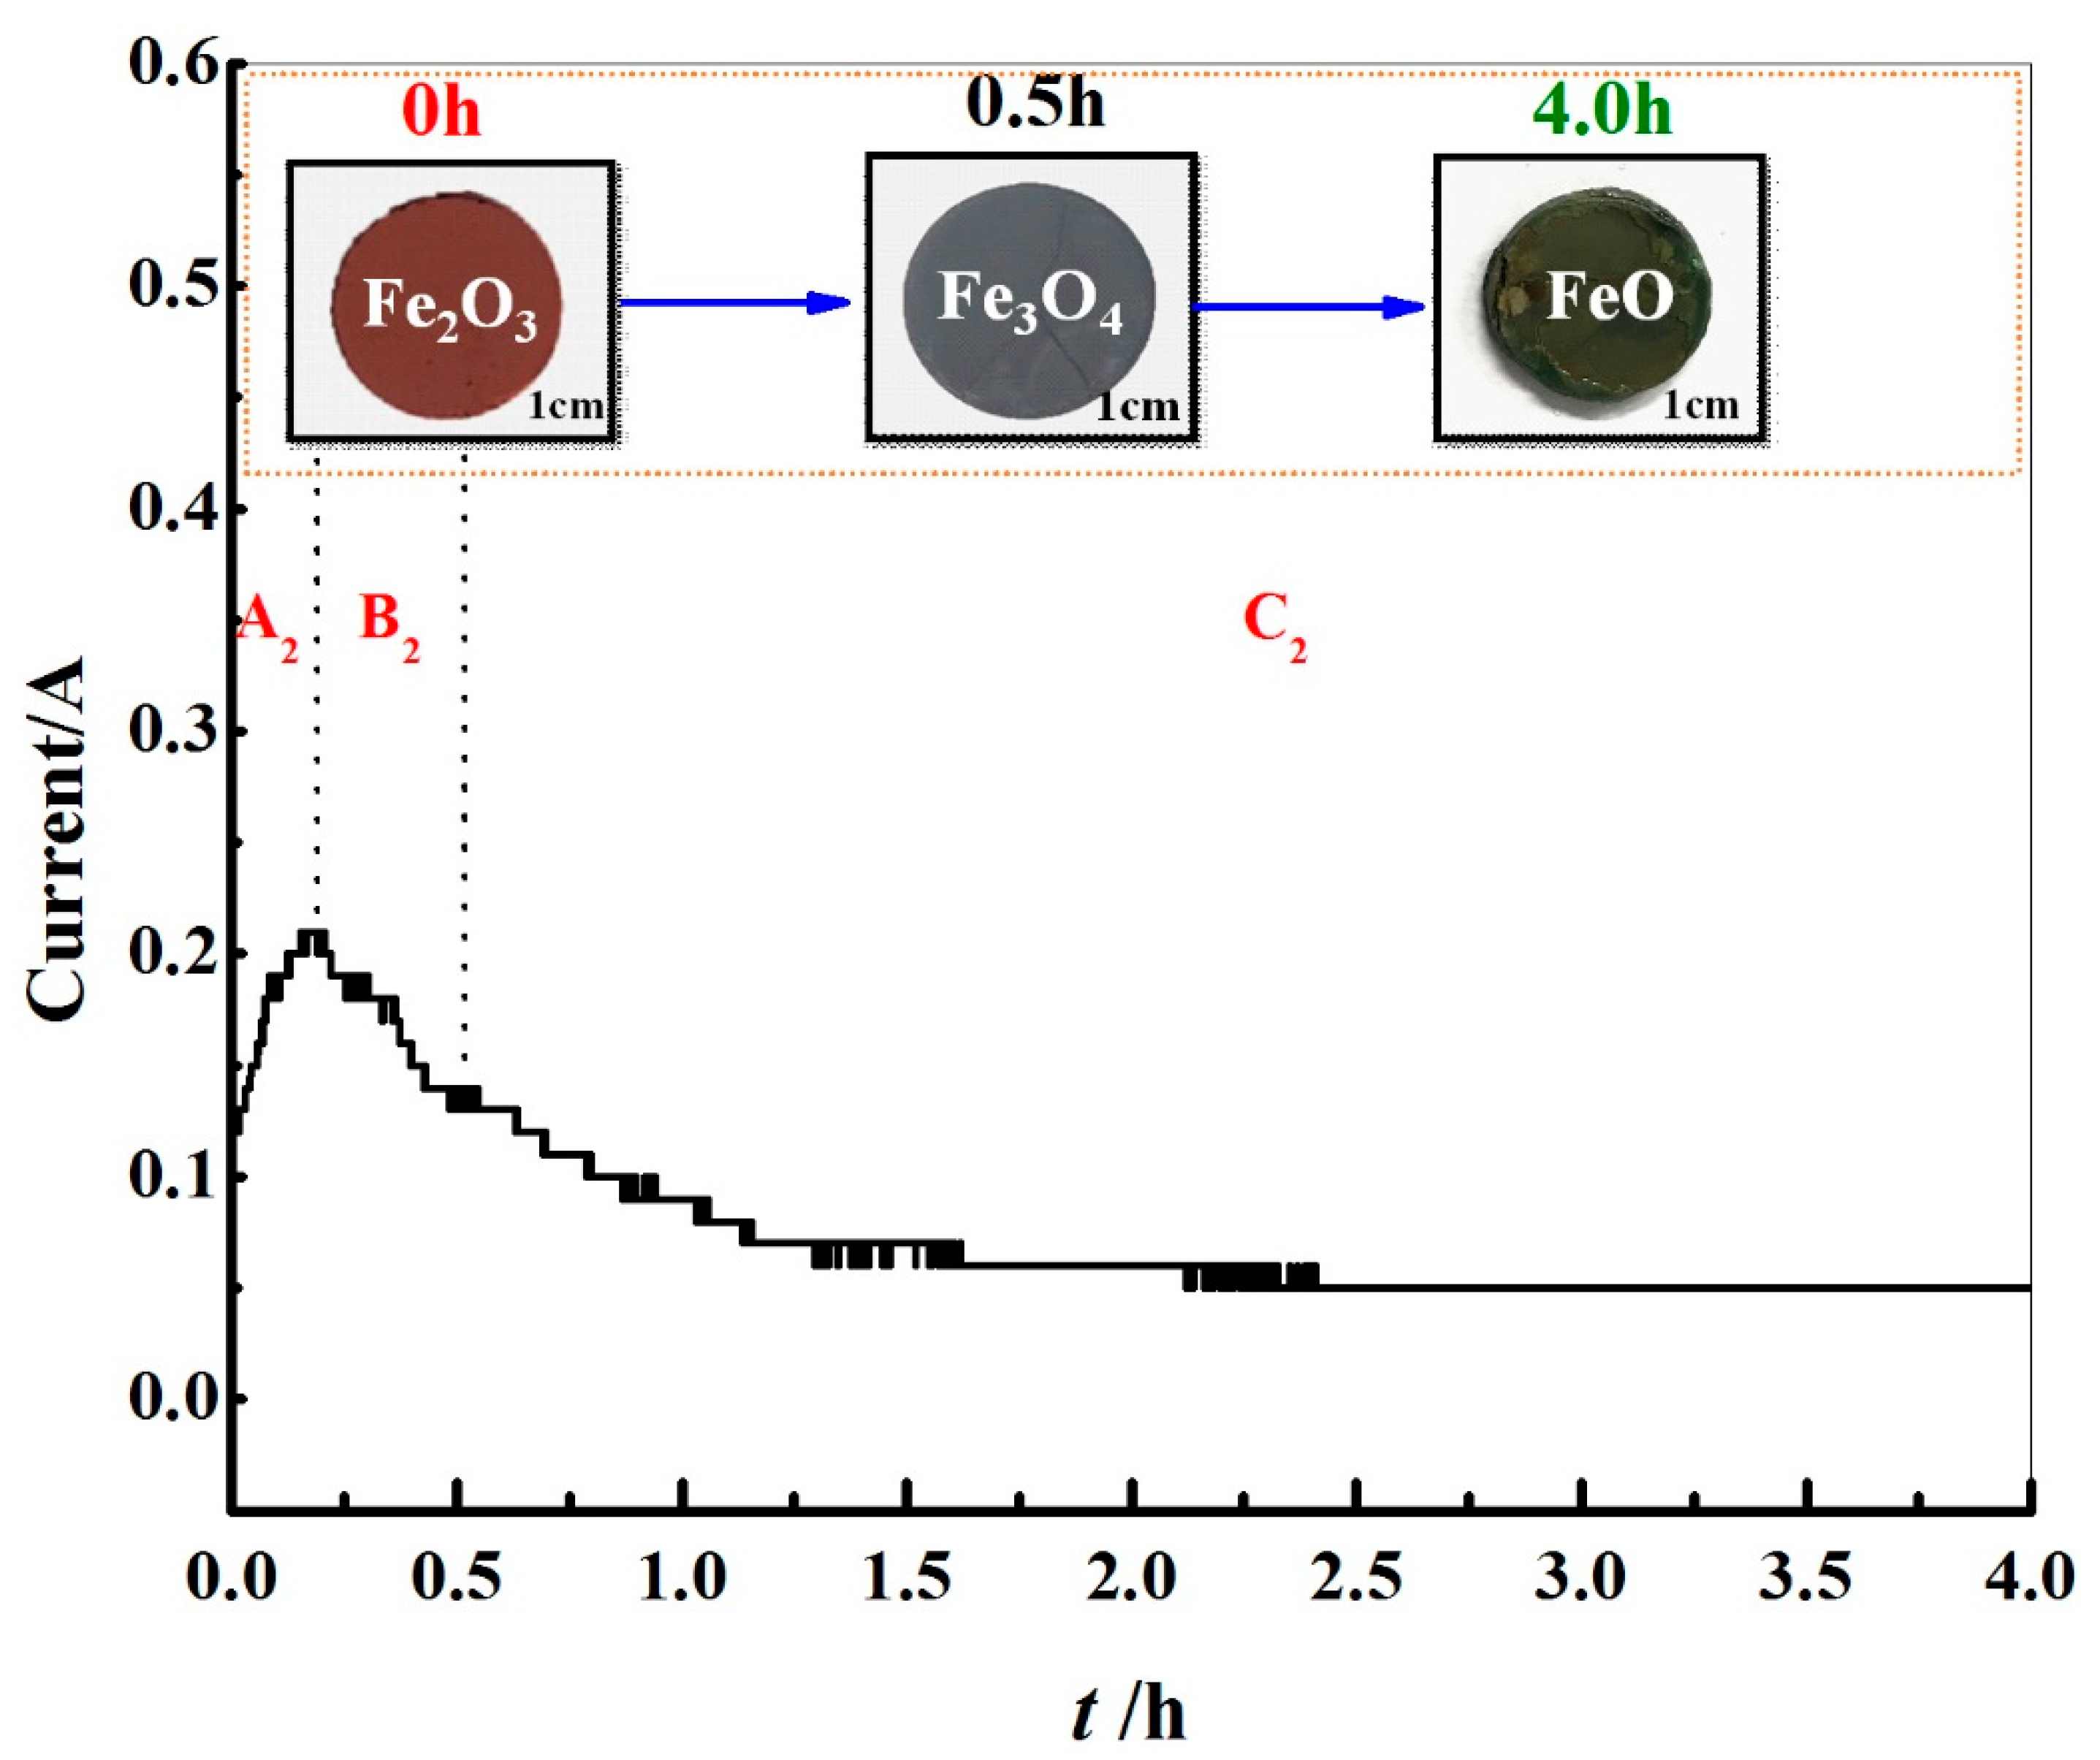
3.2. Effect on Deoxygenation Rate

Figure 3 shows the XRD pattern of the electrolysis under the experimental conditions in Table 1. The Fe2O3 content in the S1~S4 samples increased sequentially. S1 and S2 electrolyzed to Fe3O4, FeO, and Al2O3. S3 and S4 electrolyzed to FeO and Al2O3. The peaks of Fe3O4 gradually weakened from S1 to S4, the peaks of FeO became stronger, and the peaks of Al2O3 became weaker in turn. These experimental results show that with the increase in the Fe2O3 content, it was easier for FeO to be formed, and Al2O3 appeared to be reduced to a certain extent. This change of FeO was due to the increase in Fe2O3 in the samples. It increased the mass percentage of Fe2O3 activated molecules in the system that could participate in the electrical deoxidation reaction, thereby increasing the deoxidation reaction rate. As the external field conditions such as the temperature and voltage of the molten salt system had not changed, the diffusion flux of O2− in the NaCl-KCl molten salt remained unchanged. As the deoxidation reaction rate increased, the O2− produced by electrolysis could not be delivered to the anode in time, and more O2− accumulated near the cathode. This part of O2− reacted with Na+ and K+ to generate Na2O and K2O, and then it reacted with Al2O3 to generate NaAlO2 and KAlO2. As NaAlO2 and KAlO2 dissolved in the NaCl-KCl molten salt, this resulted in a decrease in Al2O3 in the cathode. The electrochemical reaction of Fe2O3 consisted of two steps. The first reaction electrolyzed to Fe3O4, and then the reaction of Fe3O4 electrolyzed to FeO. This conclusion is consistent with literature reports [21,25,26].
Figure 4 shows the change curves of the current with time in the process of S1~S4 electric deoxidation. The current is the amount of electricity per unit area, and it represents the rate of electrical deoxidation during the process of electrical deoxidation. The Fe2O3/Al2O3 electro-deoxygenation reaction process was divided into three stages: A, B, and C. Stage A was the charging process of the electric double layer. The current increased with time and reached the maximum current. At this time, the resistance was the smallest, the electric deoxidation rate was the highest, and the current was the largest, and the most active particles were produced. When the current reached the maximum current, this indicated that the electric double layer had been fully charged, and the electrical deoxidation reaction began to occur at 3PIs. Stage B was the Fe2O3 electro-deoxidation reaction process. Combined with the results of Figure 3, this stage should be the reaction of Fe2O3 electro-deoxidation to Fe3O4 (i.e., reaction (2)), and the current decreased with the reaction time. As the electric deoxidation of Fe2O3 to Fe3O4 progressed, the molten salt passed through the product layer and formed new 3PIs at the reaction product/unreacted material. The Fe3+ active particles obtained electrons at the 3PIs, and O2− diffused into the NaCl-KCl molten salt and migrated to the anode. As with the above-mentioned Fe2O3 electro-deoxygenation to Fe3O4 reaction, 3PIs formation, O2− transmission, and other reaction processes would increase the resistance of the system, and the current would decrease with time. Stage C was the process of Fe2O3 electro-deoxygenation to FeO (i.e., reactions (2) and (3)). The current decreased with the reaction time and was smaller than that in stage B. Compared with stage B, stage C increased the reaction of Fe3O4 electro-deoxidation to FeO (i.e., reaction (3)), and the resistance of the system further increased, meaning the current decreased with time and was less than the phenomenon of the stage B current.
For the It curves corresponding to S1, S2, S3, and S4, it was found that stage A, stage B, and stage C had certain changes. In stage A, the slopes of the corresponding curves for S1~S4 became larger, and the time to complete the electric double layer charging process was 0.78 h, 0.19 h, 0.16 h, and 0.09 h, which shows a gradual decrease, and the maximum current was 0.15A, 0.20 A, 0.24 A, and 0.3 A, which shows a gradual increase. Similarly, in stage B and stage C, the slopes of the corresponding curves of S1~S4 became larger, and the time required to complete the reaction of this stage became shorter. These results show that the rate of Fe2O3/Al2O3 electric deoxidation increased with the increase in the Fe2O3 content. It promoted the progress of the electric deoxidation reaction and shortened the time required to complete the corresponding reaction process. There are two reasons for the above phenomenon. One is that the increase in Fe2O3 increased the number of Fe2O3 activated molecules in the system that could participate in the electro-deoxygenation reaction. This increased the initial concentration of activated molecules in the Fe2O3 electro-deoxygenation reaction, thereby increasing the deoxygenation reaction rate. The second is that Al2O3 is an oxide with high resistivity and strong electrical insulation [27]. Al2O3 in the S1~S4 samples decreased sequentially. This meant that the resistance of the deoxidizing system decreased correspondingly and reduced the resistance of the free electrons to 3PIs. In turn, the deoxygenation reaction rate was increased. The effect of the Fe2O3 content on the deoxidation rate is consistent with the XRD results in Figure 3.

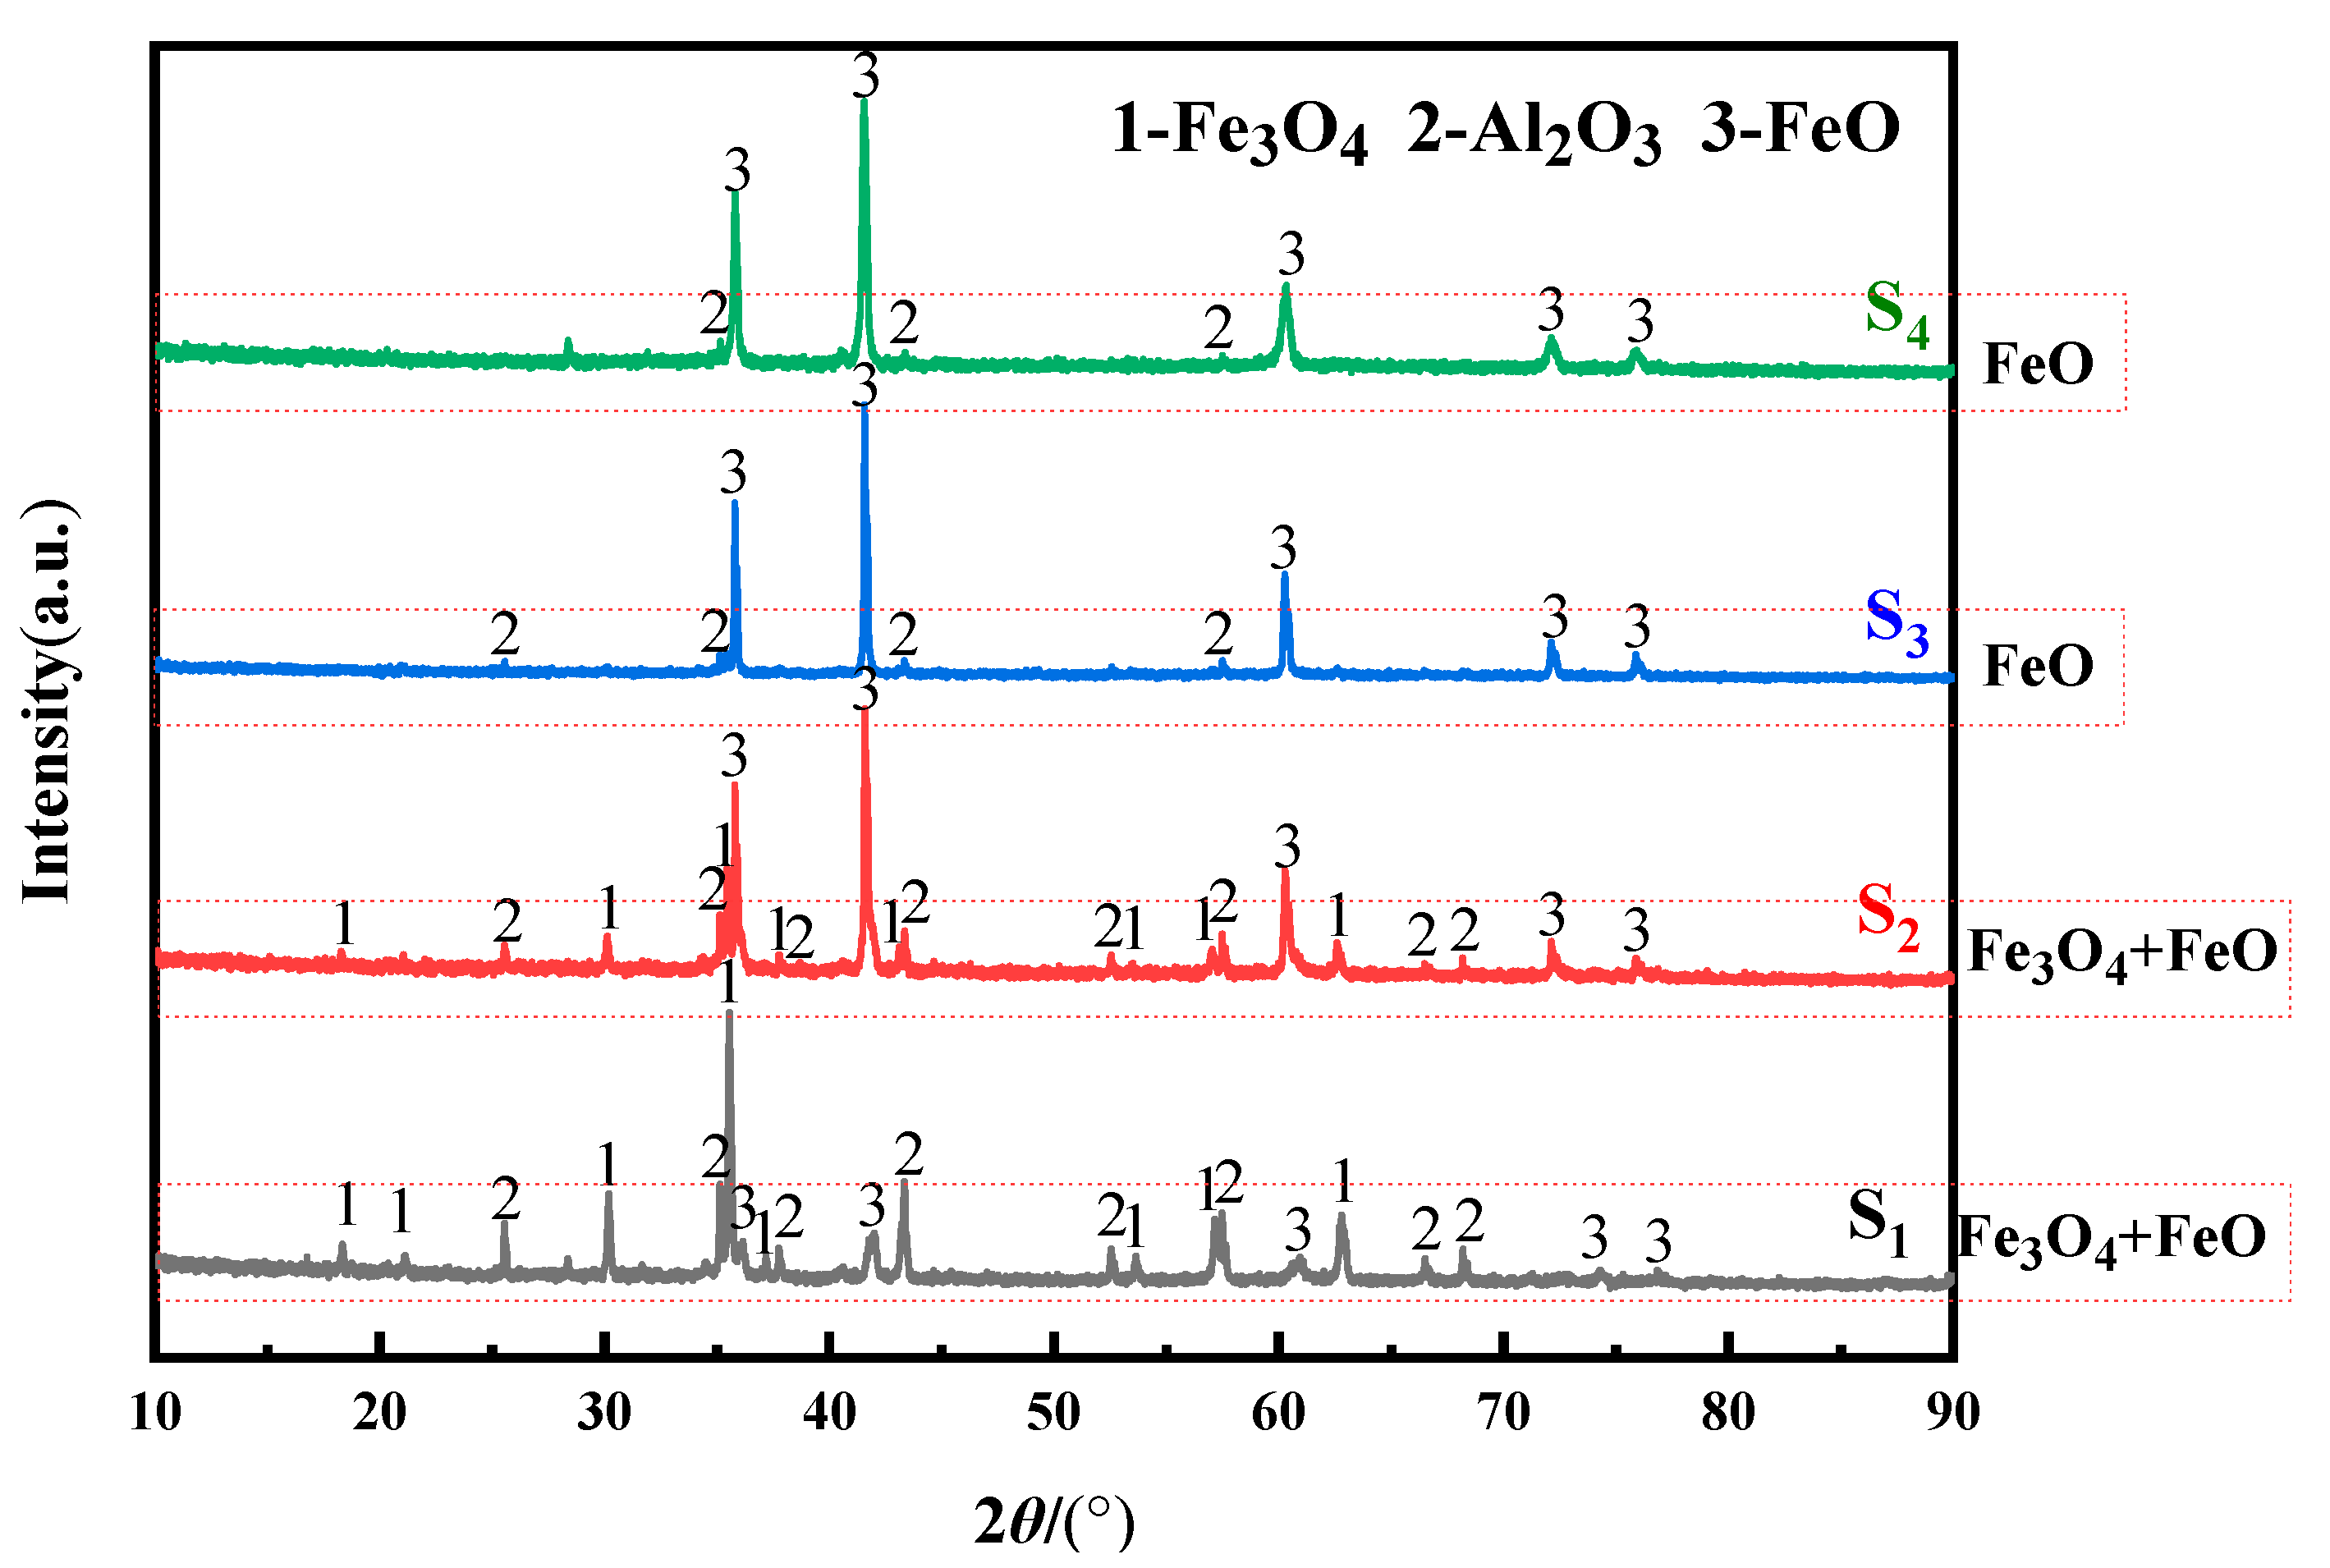
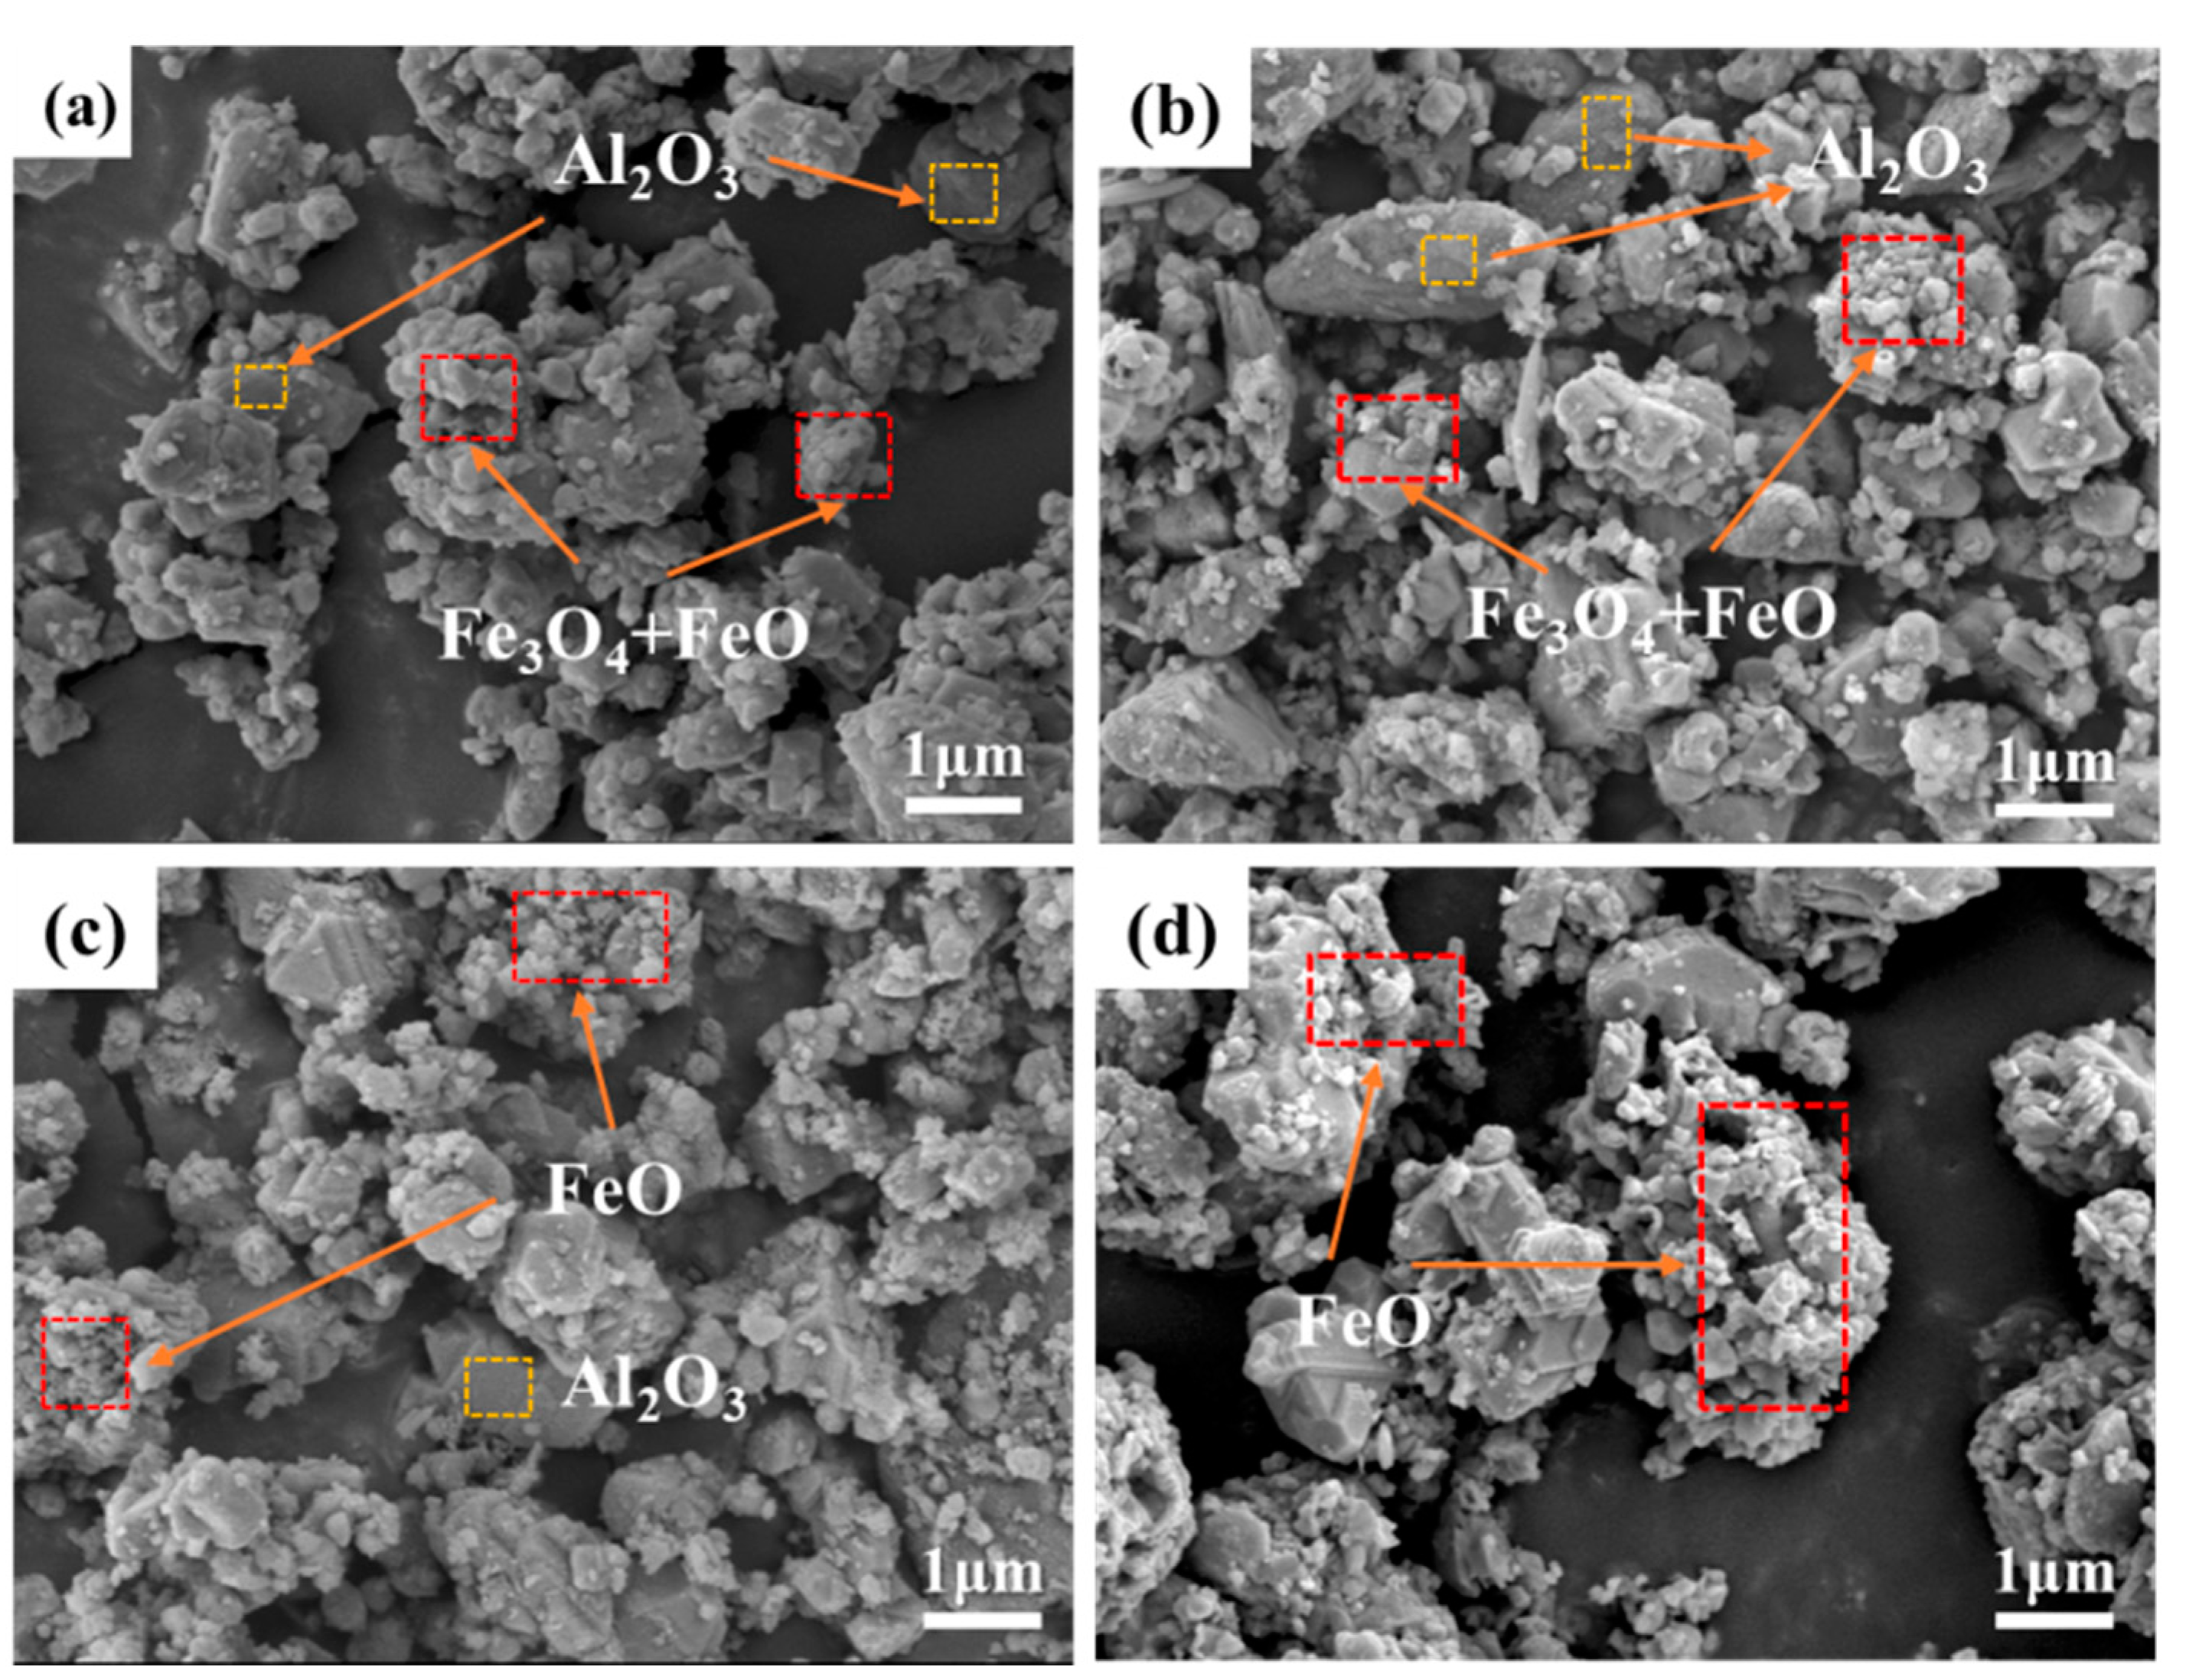
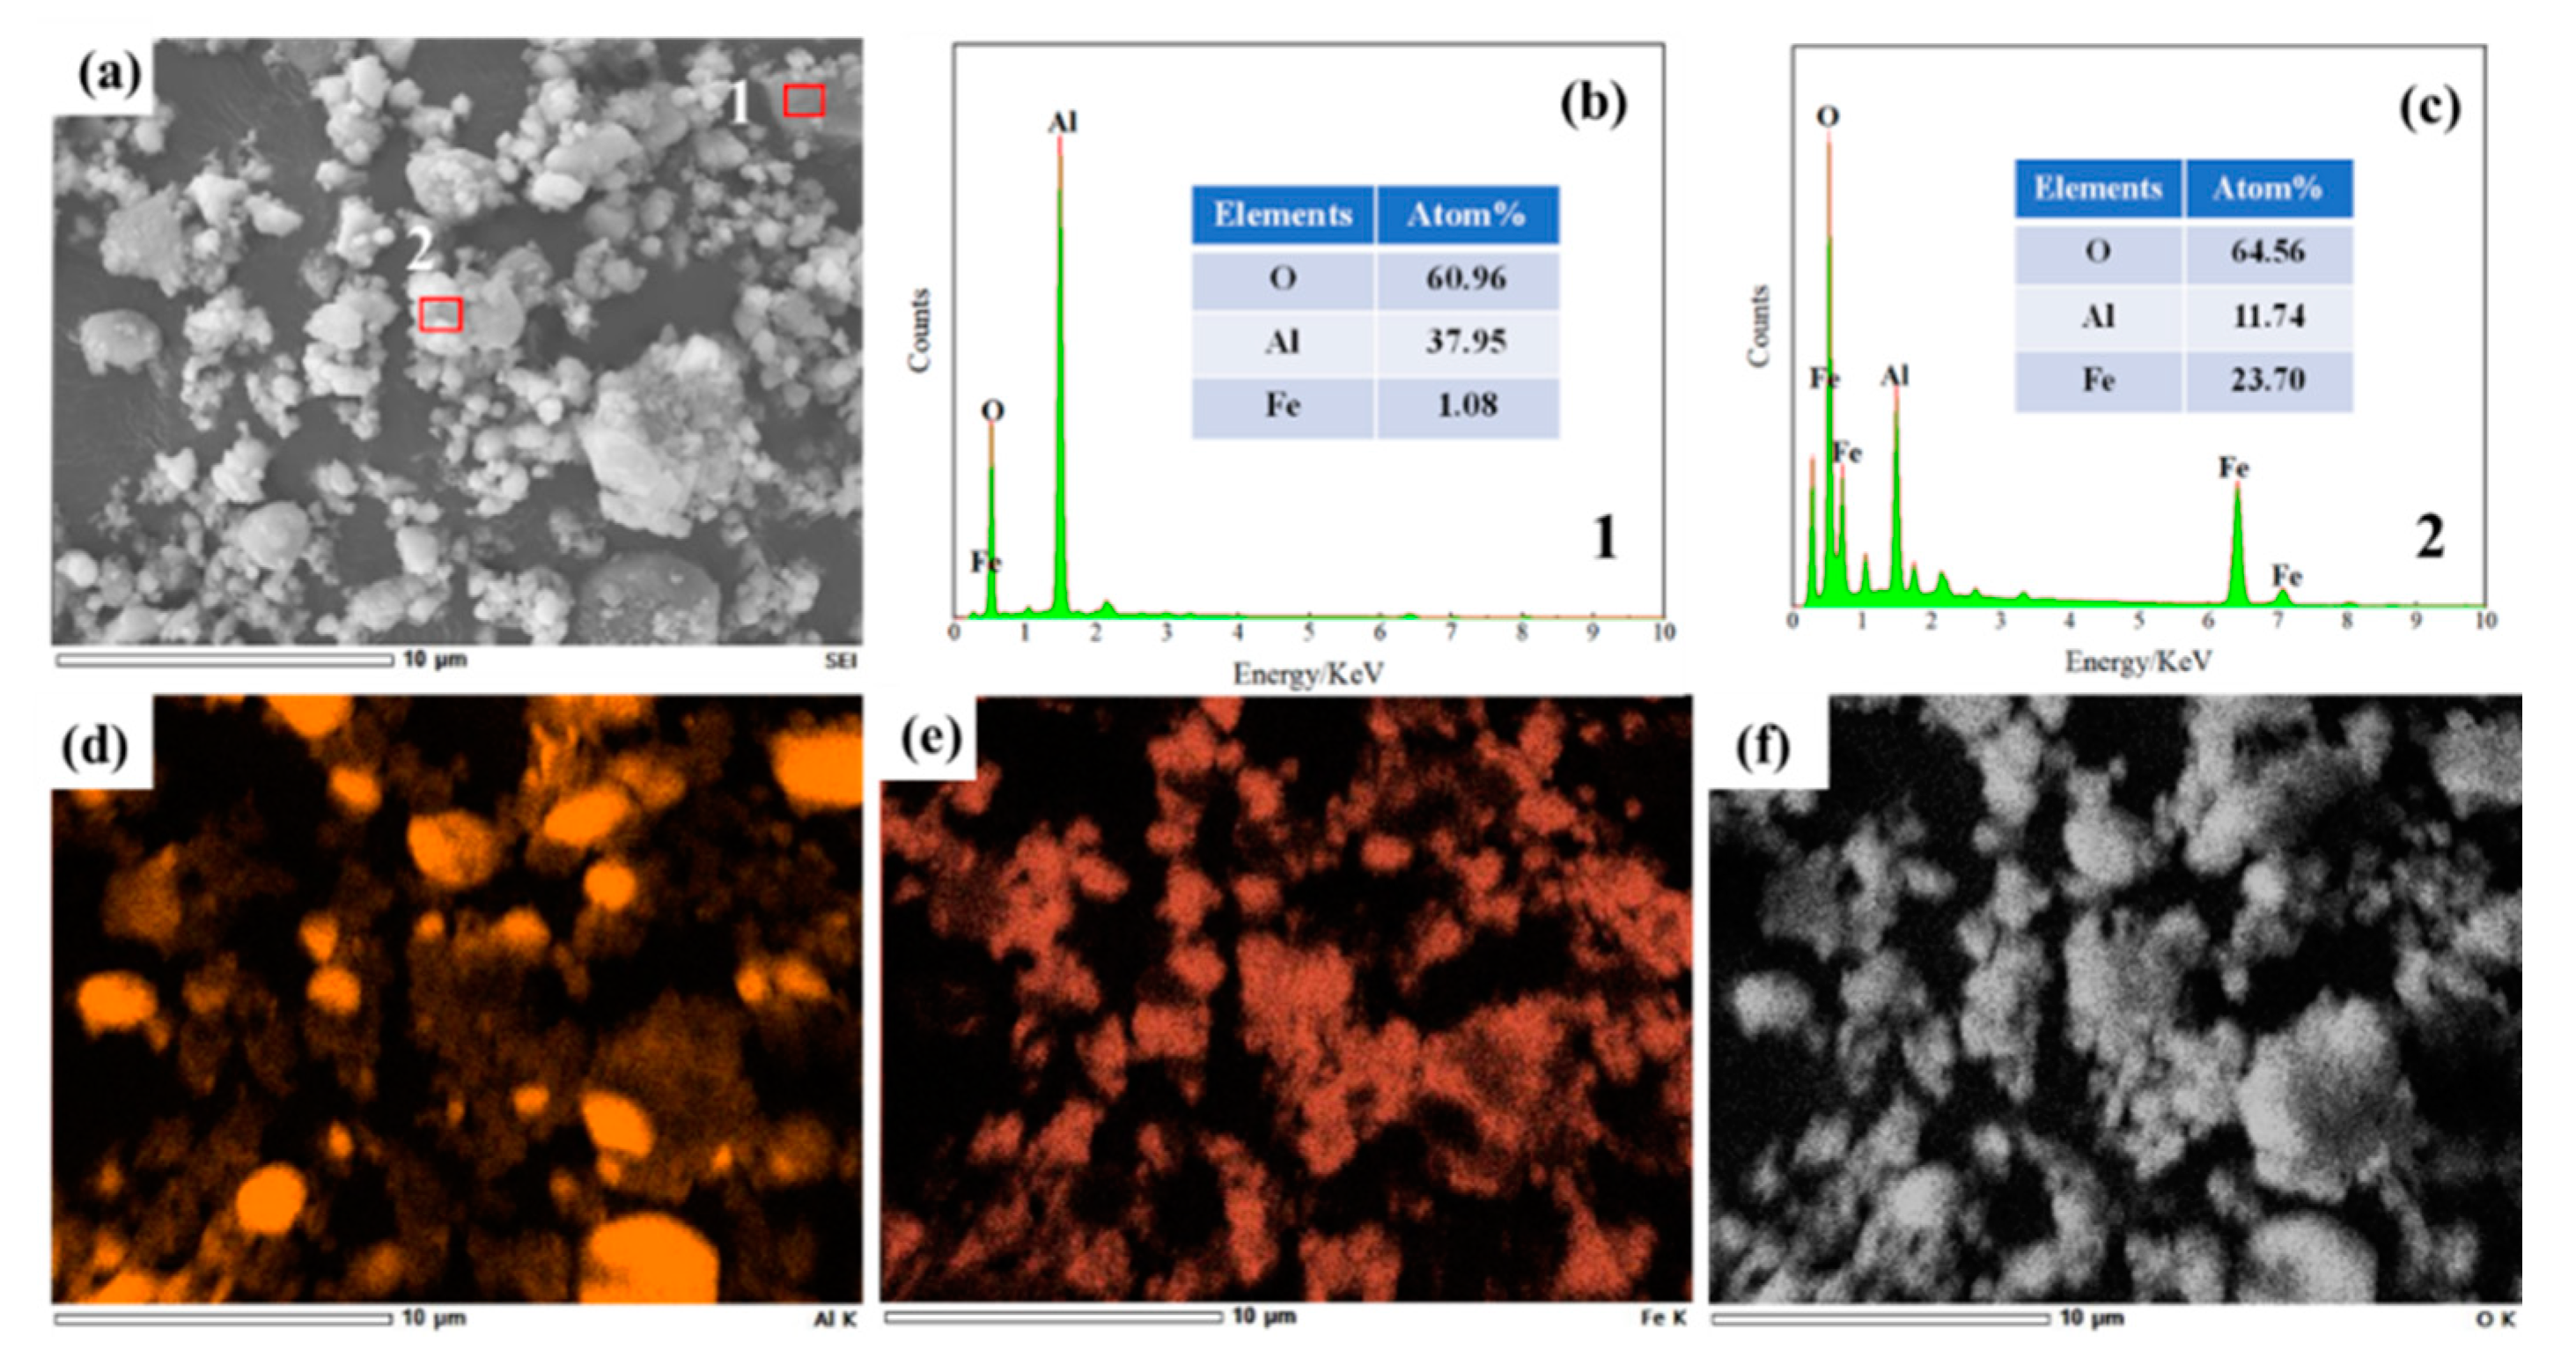
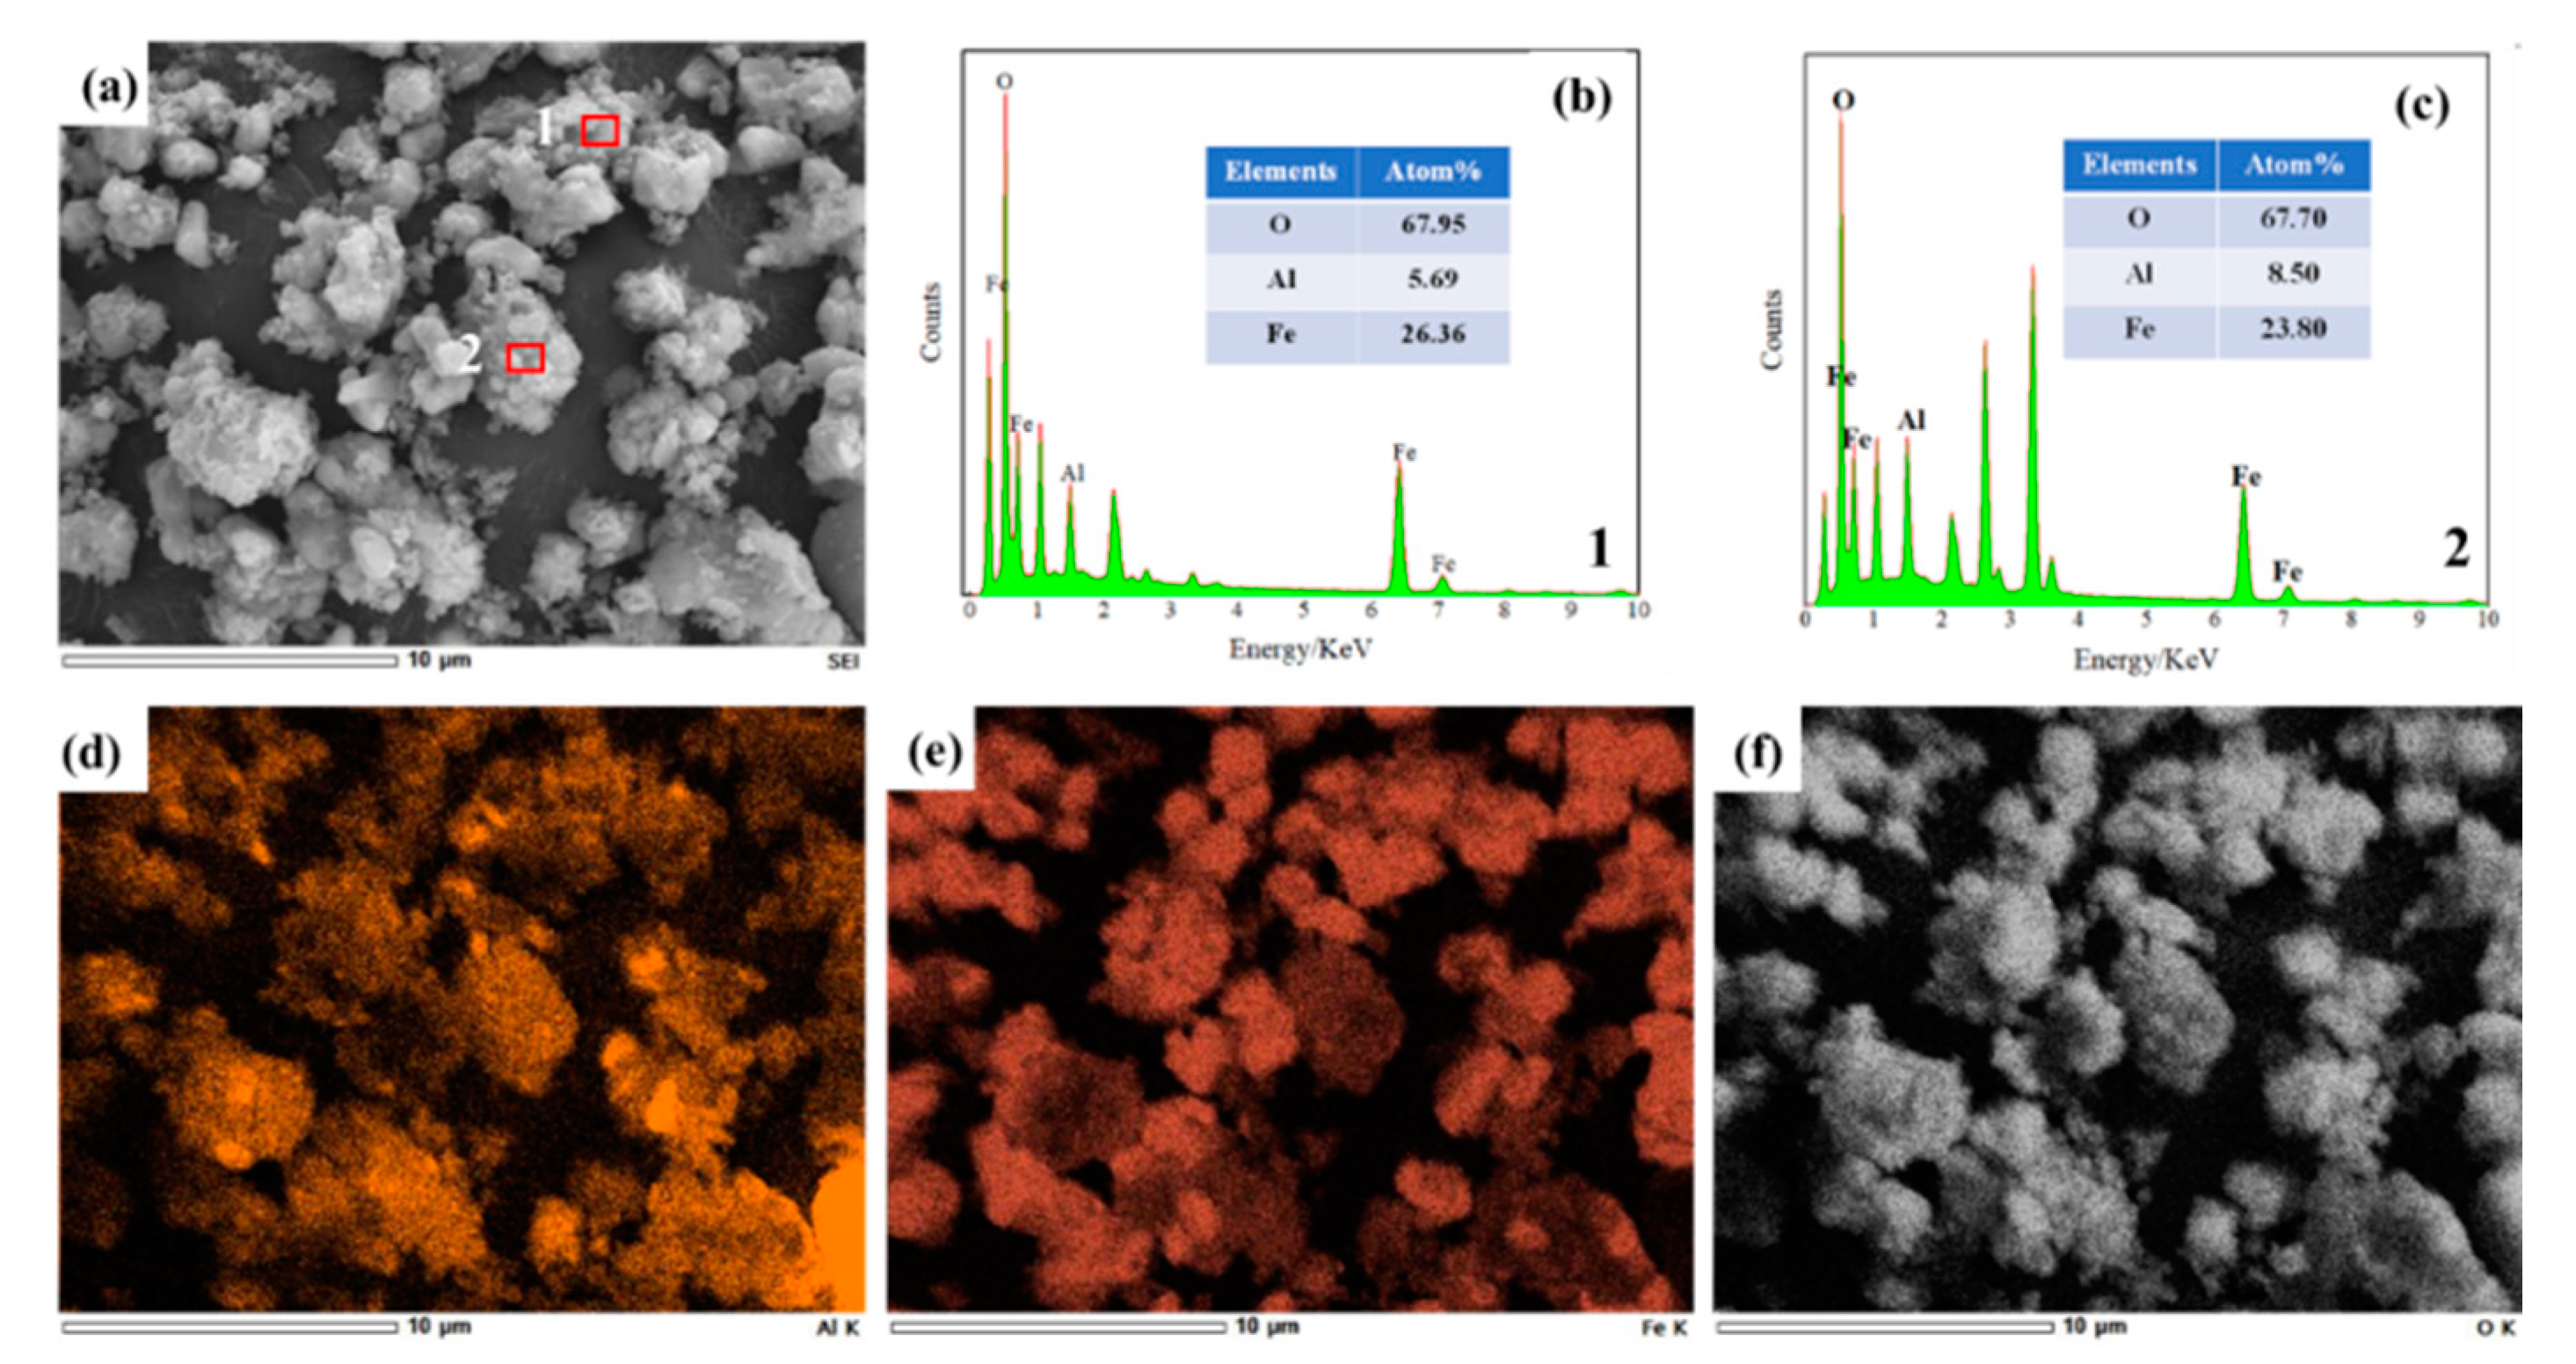
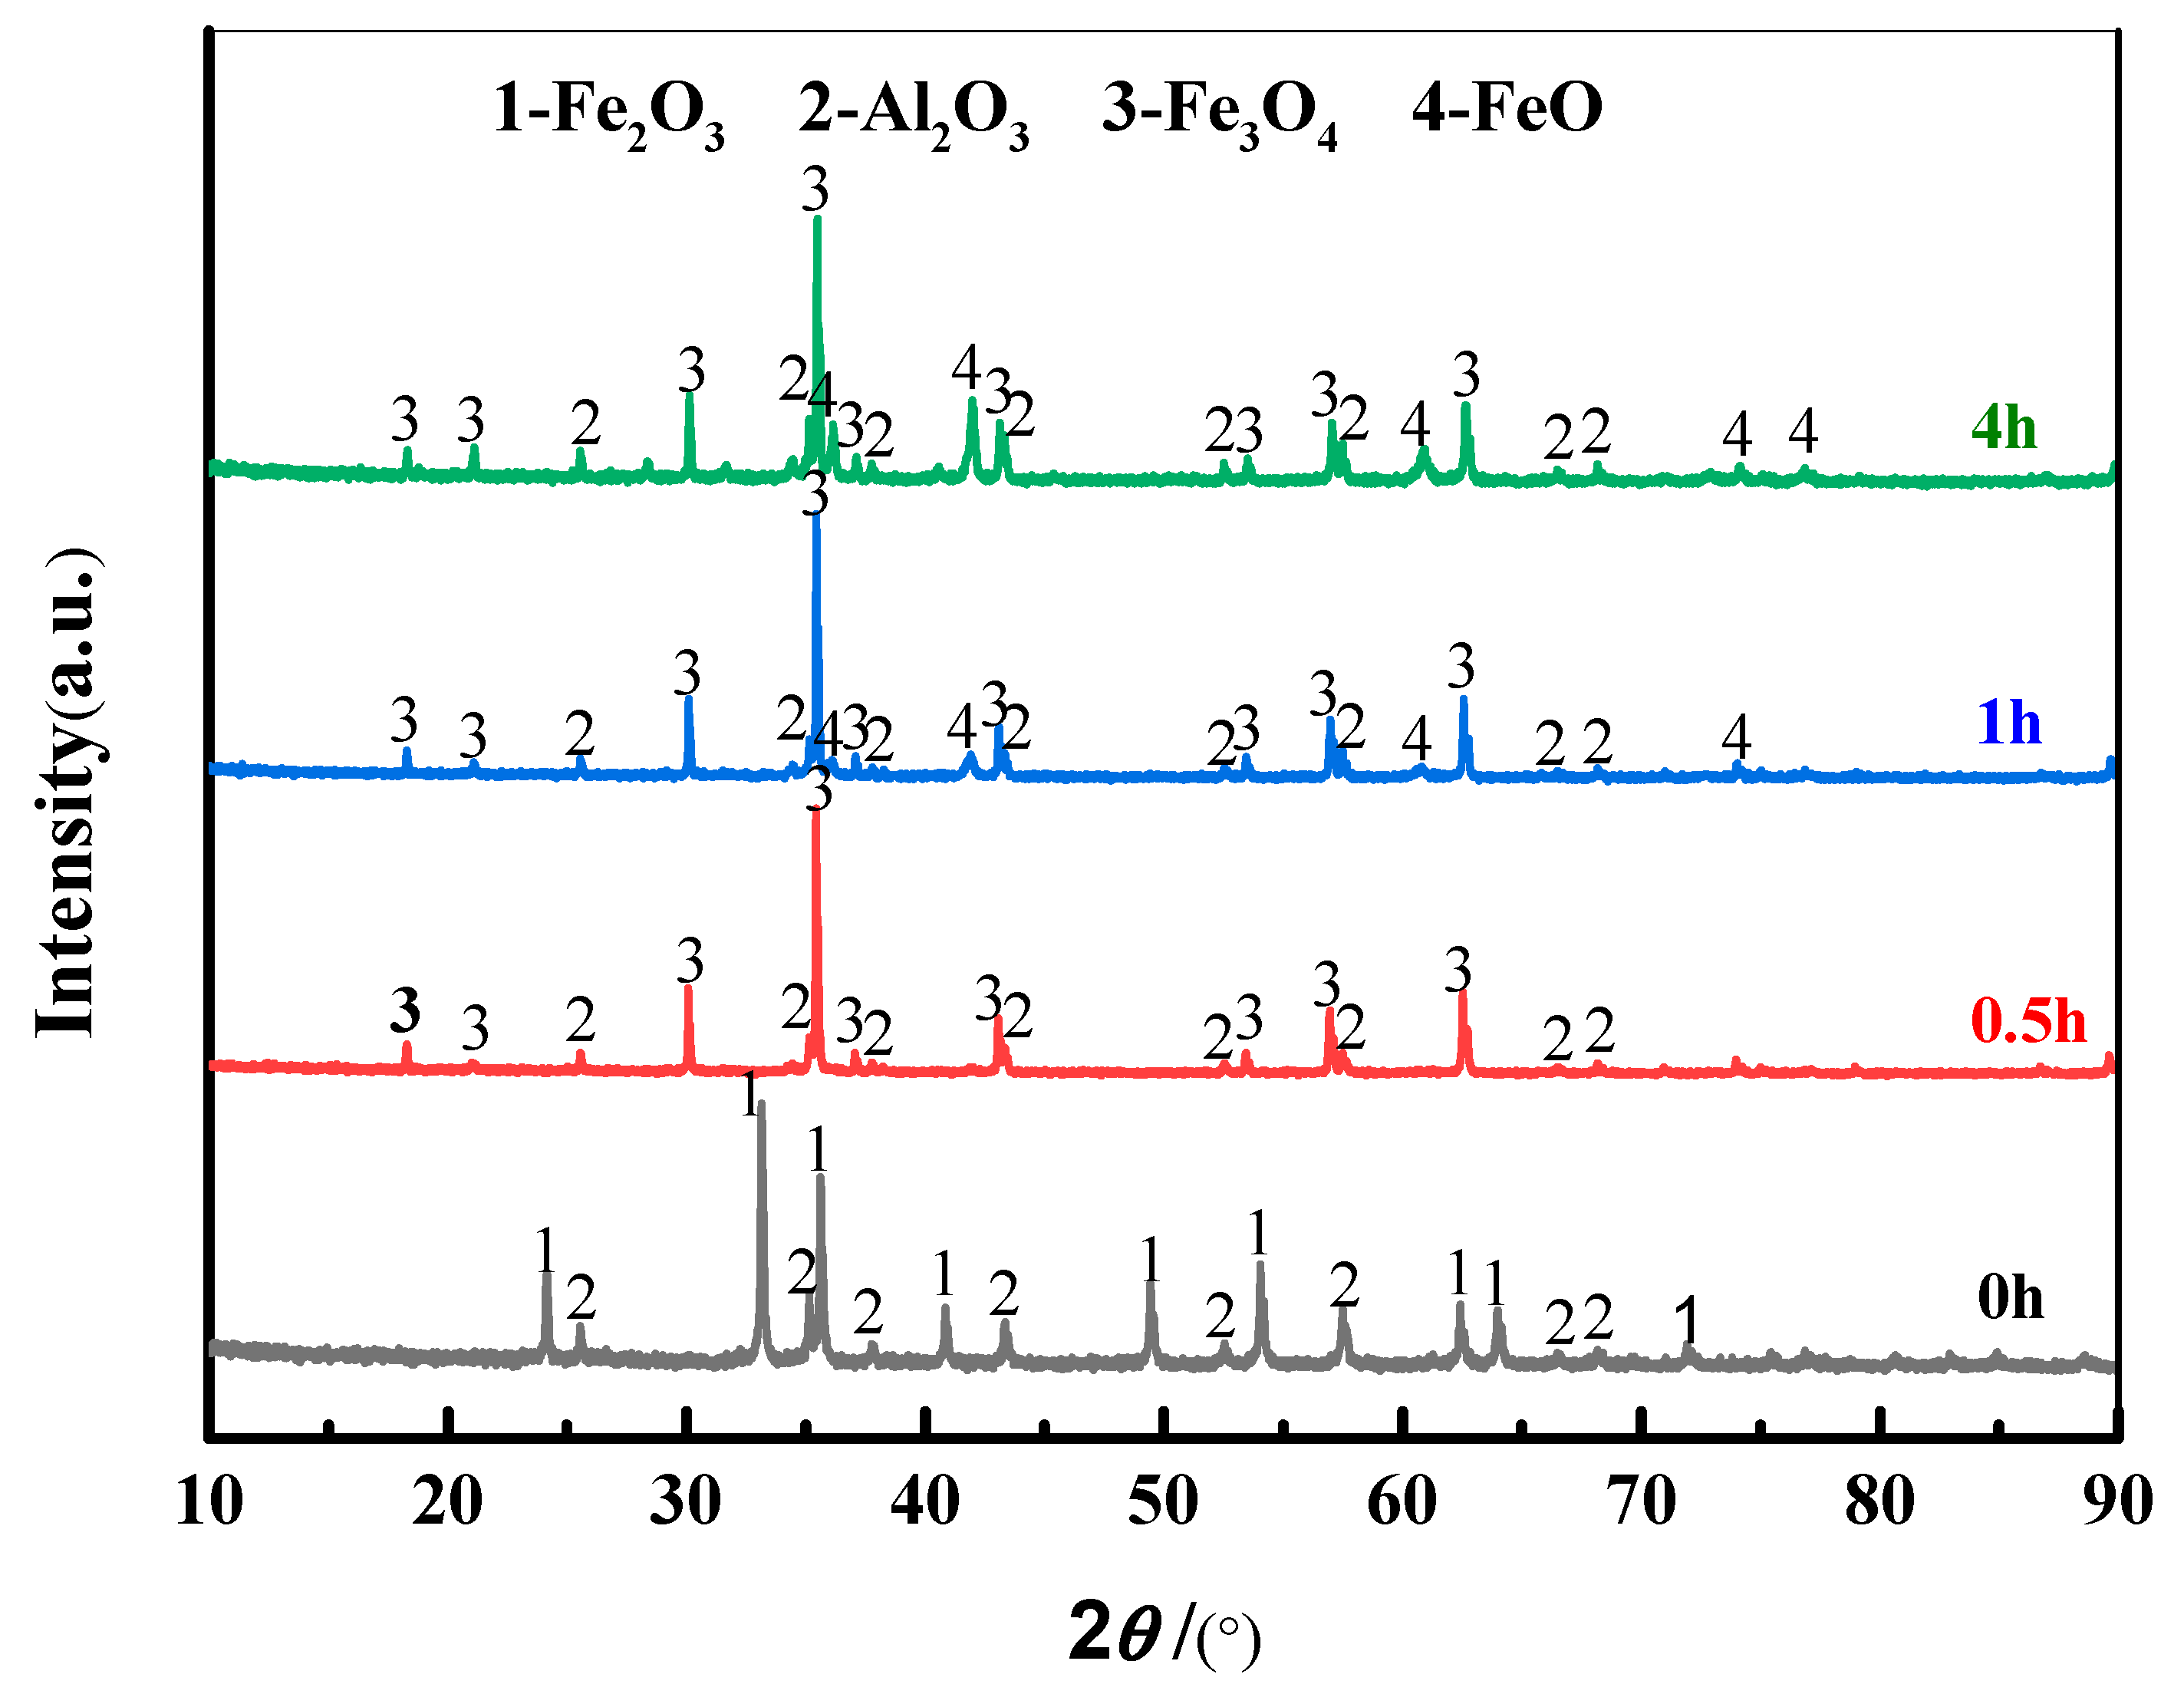
3.3. Effect on Organizational Structure

Figure 5, Figure 6 and Figure 7 showed the SEM morphology, spot scan, and surface scan of the Fe2O3/Al2O3 electro-deoxidation product. It can be seen that S1 and S2 are Fe3O4, FeO, and Al2O3. S3 and S4 are FeO and Al2O3. Al2O3 is the regular and smooth large particles, and the Fe3O4 and FeO particles are smaller. Fe3O4 and FeO adhered to Al2O3, nucleated, and grew. With the increase in the Fe2O3 content, the exposed Al2O3 decreased, and the low-valence iron oxides surrounding the surface of the Al2O3 particles increased. The low-valence iron oxide particles gradually became larger and angular polyhedrons. Under the same electrolysis conditions, with the increase in the Fe2O3 content, a low content of Fe2O3 could produce Fe3O4 and FeO, while a high content only produced FeO. This indicates that the increase in the Fe2O3 content increased the deoxidation reaction rate. The large, smooth, high-resistivity Al2O3 particles hindered the migration of active particles in the deoxidation process. Active particles needed to bypass Al2O3 and undergo the electrical deoxidation reaction on the Fe2O3 around Al2O3. Therefore, the Fe3O4 and FeO particles grew around Al2O3, and the decrease in the Al2O3 content was also beneficial to increase the deoxidation reaction rate. With the increase in the electro-deoxidation rate, the process of Fe2O3 electro-deoxidation to Fe3O4 (reaction (2)) was shortened, and the reaction of Fe3O4 electro-deoxidation to FeO (reaction (3)) was faster. At the same time, the FeO crystal nucleus had more time to grow, finally obtaining larger FeO particles.

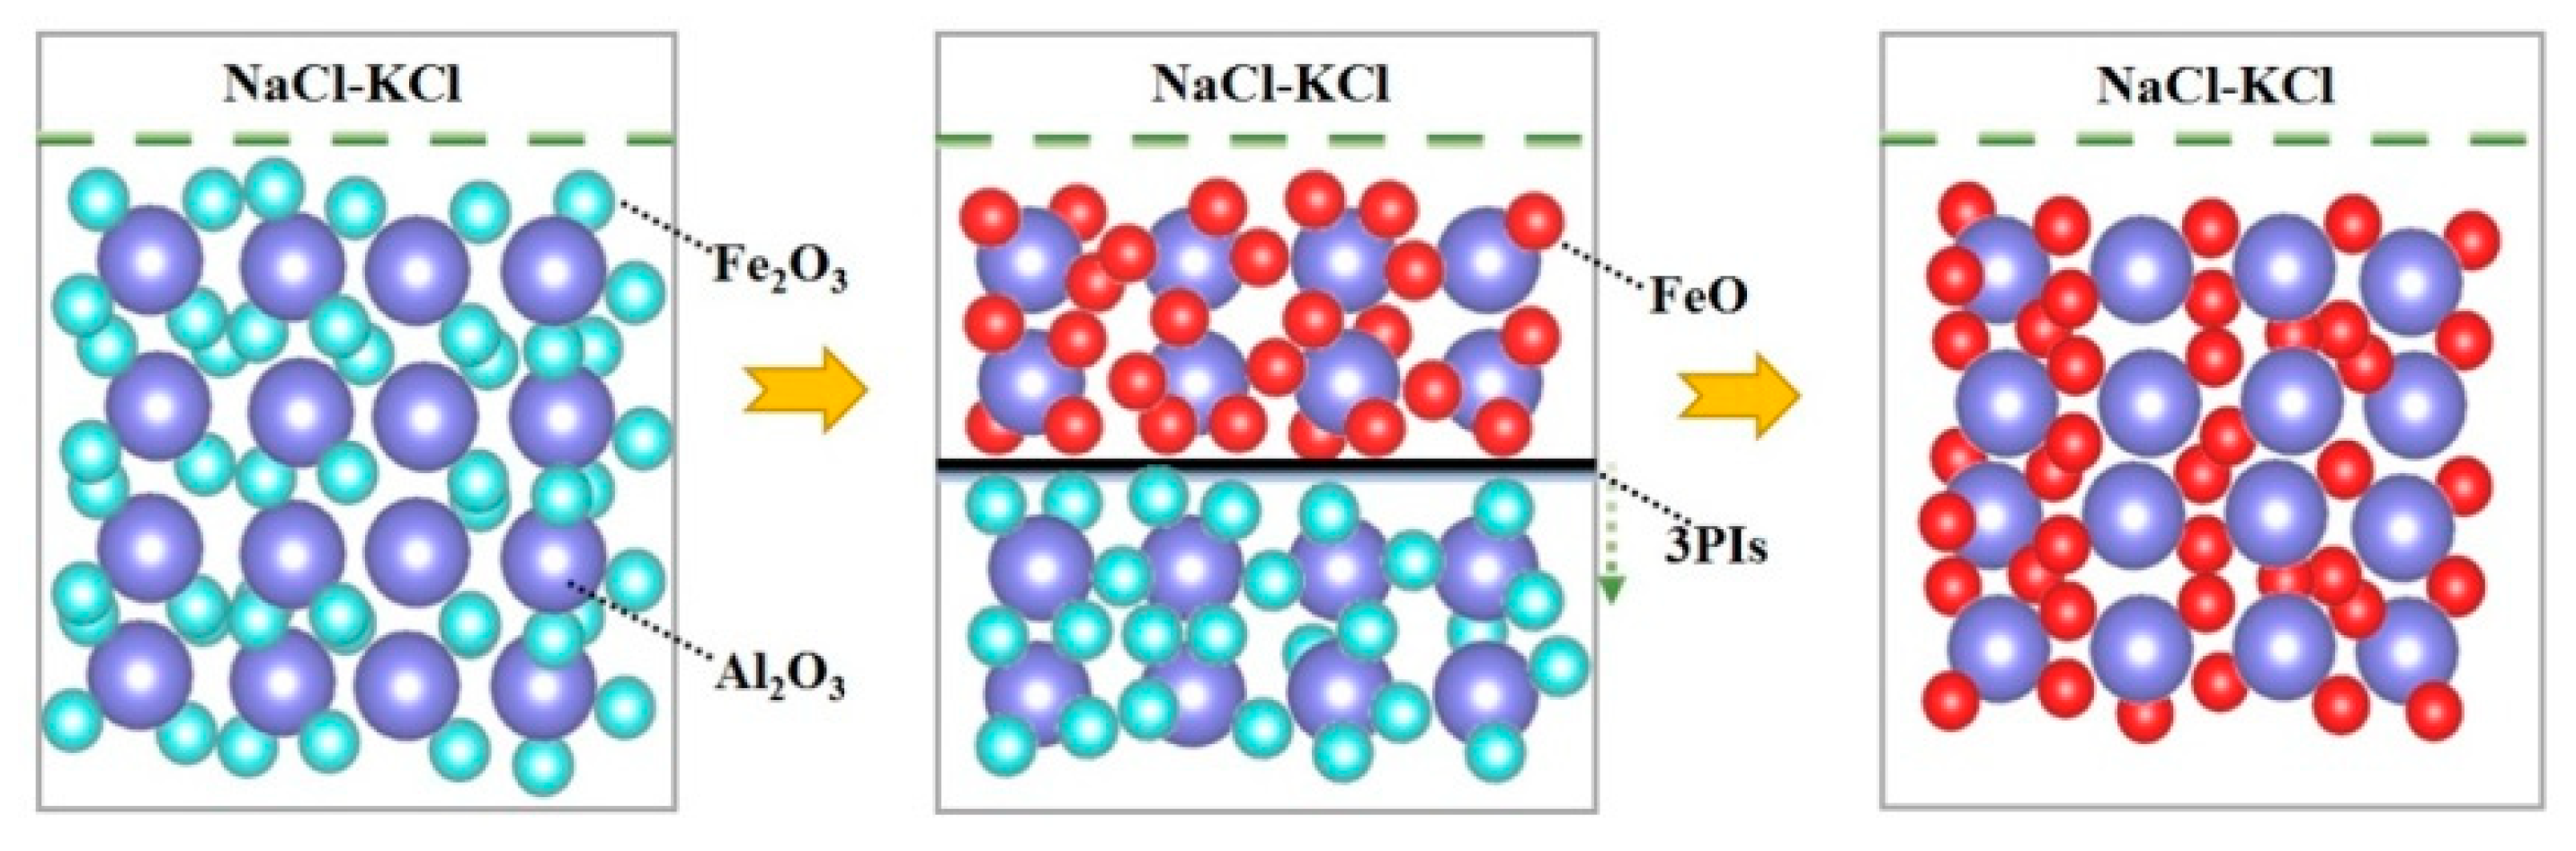
3.4. Effect Mechanism

From the above XRD and SEM results, it can be seen that the increase in the Fe2O3 content increased the deoxidation reaction rate of FeO/Al2O3 prepared by Fe2O3/Al2O3 electro-deoxidation. In order to further clarify the deoxygenation reaction process, XRD analysis was performed on the deoxygenation products of S2 at 0.5 h, 1 h, and 4 h, as shown in Figure 8. When the reaction reached 0.5 h, the sample color changed from red to black (Figure 9), and the deoxidation product was Fe3O4 and Al2O3. When the reaction reached 1 h, the deoxidation product was Fe3O4, FeO, and Al2O3. When the reaction reached 4 h, the sample color changed from black to dark green (Figure 9), and the deoxidized product was also Fe3O4, FeO, and Al2O3.
According to Figure 8 and Figure 9, it can be seen that the reaction from 0 to 0.19 h belonged to stage A, which was an electric double layer charging process. The active particles quickly gathered at 3PIs, and the Fe2O3 electro-deoxygenation reaction started at the maximum reaction rate. From 0.19 to 0.75 h, it belonged to stage B, and reaction (2) produced Fe3O4, accompanied by the formation of new 3PIs at the junction of Fe3O4/Fe2O3/NaCl-KCl molten salt. From 0.75 to 4 h, it belonged to stage C, and reaction (3) produced FeO, accompanied by the formation of new 3PIs at the junction of FeO/Fe3O4/NaCl-KCl molten salt. It can be seen from Figure 4 that the electro-deoxidation reaction with different Fe2O3 contents included three stages, A, B, and C. Combining the results of Figure 8 and Figure 9, the Fe2O3/Al2O3 electro-deoxidation reaction mechanism could be obtained, as shown in Figure 10. With the increase in the Fe2O3 content, the concentration of activated molecules in the system was increased, the resistance of Al2O3 in the system was reduced, and the reaction rate of reactions (2) and (3) was increased. This shortened the completion time of stages A, B, and C.

4. Conclusions

In this paper, molten salt electrolysis was used to study the reaction process of Fe2O3-Al2O3 electrolytic reduction of FeO-Al2O3 in the NaCl-KCl system. The influence of the Fe2O3 content on the electrolysis process was analyzed. When the electrolysis conditions were 850 °C, 2.3 V, and a reaction time of 4 h, Fe2O3-Al2O3 could be electrolyzed to Fe3O4, FeO, and Al2O3. FeO-Al2O3 could be obtained by adjusting the content of Fe2O3. The increasing content of Fe2O3 could increase the rate of the deoxidation reaction and shorten the time of Fe2O3 reduction to Fe3O4 and Fe3O4 reduction to FeO. The electrolysis product nucleated and grew around Al2O3, and it finally became angular polyhedrons. By studying the dynamic process of the electro-deoxygenation reaction, the electro-deoxygenation reaction mechanism was obtained. It included electric double layer charging, Fe2O3 electro-deoxygenation to produce Fe3O4, and Fe3O4 electro-deoxygenation to produce FeO, accompanied by the formation of new 3PIs, O2− transport, and other reactions. The principle of obtaining FeO by adjusting the content of Fe2O3 was that the increase in the Fe2O3 content increased the concentration of activated molecules in the system. Additionally, it reduced the resistance of Al2O3 in the system. The active particles migrated more smoothly in the cathode and increased the reaction rate of reactions (2) and (3). The reaction rate shortened the reaction time of the electric double layer charging, Fe3O4 generation, FeO generation, and other stages. As we all know, in addition to the Fe2O3 content, the reaction temperature, reaction time, and voltage are all factors that affect the electrolytic reduction of Fe2O3-Al2O3 to FeO-Al2O3. Subsequent research will focus on the mechanism of the reaction temperature, reaction time, and voltage in the reduction process.

Author Contributions

Y.X. designed the experiments; Z.J. analyzed the data; H.Y. wrote the paper; X.Q. reviewed the paper; H.L. and J.L. guided the experiment. All authors have read and agreed to the published version of the manuscript.

Funding

This research was funded by the National Natural Science Foundation of China, grant number 51874141.

Institutional Review Board Statement

Not applicable for studies not involving humans or animals.

Informed Consent Statement

Not applicable for studies not involving humans.

Data Availability Statement

Not applicable.

Acknowledgments

This work was supported by the National Natural Science Foundation of China (No. 51874141).

Conflicts of Interest

The authors declare they have no conflict of interest. The funders had no role in the design of the study; in the collection, analysis, or interpretation of data; in the writing of the manuscript; or in the decision to publish the results.

References

  1. Khairul, M.A.; Zanganeh, J.; Moghtaderi, B. The composition, recycling and utilization of Bayer red mud. Res. Cons. Rec. 2019, 141, 483–498. [Google Scholar] [CrossRef]
  2. Fan, G.Q.; Wang, M.; Dang, J.; Zhang, R.; Lv, Z.P.; He, W.C.; Lv, X.W. A novel recycling approach for efficient extraction of titanium from high-titanium-bearing blast furnace slag. Waste Manag. 2021, 120, 626–634. [Google Scholar] [CrossRef]
  3. Wang, N.; Yan, H.Y.; Luo, C.; Li, H. Thermodynamic analysis of preparation of cermet from zinc kiln slag. In TMS 2021 11th International Symposium on High-Temperature Metallurgical Processing; Springer: Cham, Switzerland, 2020; pp. 1023–1032. [Google Scholar]
  4. Agrawal, S.; Dhawan, N. Investigation of carbothermic microwave reduction followed by acid leaching for recovery of iron and aluminum values from Indian red mud. Miner. Eng. 2020, 159, 106653. [Google Scholar] [CrossRef]
  5. Mancini, A.; Lothenbach, B.; Geng, G.; Grolimund, D.; Wieland, E. Iron speciation in blast furnace slag cements. Cem. Concr. Res. 2021, 140, 106287. [Google Scholar] [CrossRef]
  6. Geng, C.; Liu, J.; Wu, S.; Jia, Y.; Du, B.; Yu, S. Novel method for comprehensive utilization of MSWI fly ash through co-reduction with red mud to prepare crude alloy and cleaned slag. J. Hazard. Mater. 2020, 384, 121315. [Google Scholar] [CrossRef] [PubMed]
  7. Mukiza, E.; Zhang, L.L.; Liu, X.; Zhang, N. Utilization of red mud in road base and subgrade materials: A review. Resour. Conserv. Recycl. 2019, 141, 187–199. [Google Scholar] [CrossRef]
  8. Luo, C.; Peng, J.; Yan, H.Y.; Liang, J.L. Thermodynamic behavior analysis of Fe-FeAl2O4 cermet prepared by zinc kiln slag. In TMS 2021 150th Annual Meeting & Exhibition Supplemental Proceedings; Springer International Publishing: Cham, Switzerland, 2021; pp. 935–942. [Google Scholar]
  9. Ma, T. Preparation of Fe-Al-Based Cermet with Red Mud and Properties Study. Master’s Thesis, University of Science and Technology Beijing, Beijing, China, 2017; pp. 52–70. [Google Scholar]
  10. Ikram, U.H.M.; Mukherjee, P.S.; Khanna, R. Formation of light-weight ferroalloys in the Fe2O3-Al2O3-C system at 1550 C: Influence of silica impurities. Metals 2017, 7, 391. [Google Scholar] [CrossRef] [Green Version]
  11. Chobtham, C.; Kongkarat, S. Synthesis of hercynite from aluminium dross at 1550 °C: Implication for Industrial Waste Recycling. Mater. Sci. Forum. 2020, 977, 223–228. [Google Scholar] [CrossRef]
  12. Zhang, R.; Dang, J.; Liu, D.; Lv, Z.P.; Fan, G.Q.; Hu, L.W. Reduction of perovskite-geikielite by methane–hydrogen gas mixture: Thermodynamic analysis and experimental results. Sci. Total. Environ. 2020, 699, 134355. [Google Scholar] [CrossRef]
  13. Zhou, L.; Enakonda, L.R.; Saih, Y.; Loptain, S.; Basset, J.M. Catalytic methane decomposition over Fe-Al2O3. ChemSusChem 2016, 9, 1243–1248. [Google Scholar] [CrossRef]
  14. Mei, D.; Zhao, H.; Yan, S. Kinetics model for the reduction of Fe2O3/Al2O3 by CO in chemical looping combustion. Chem. Eng. Process.-Process Intensif. 2018, 124, 137–146. [Google Scholar] [CrossRef]
  15. Ohno, K.; Konishi, H.; Watanabe, T.; Ishihara, S.; Kunitomo, K. Effect of pre-reduction degree on softening behavior of simulant sinter Iron ore. ISIJ Int. 2020, 60, 1520–1527. [Google Scholar] [CrossRef]
  16. Chen, G.Z.; Fray, D.J.; Farthing, T.W. Direct electrochemical reduction of titanium dioxide to titanium in molten calcium chloride. Nature 2000, 407, 361–364. [Google Scholar] [CrossRef] [PubMed]
  17. Pal, U.B.; Woolley, D.E.; Kenney, G.B. Emerging SOM technology for the green synthesis of metals from oxides. JOM 2001, 53, 32–35. [Google Scholar] [CrossRef]
  18. Ono, K.; Suzuki, R.O. A new concept for producing Ti sponge: Calciothermic reduction. JOM 2002, 54, 59–61. [Google Scholar] [CrossRef]
  19. Jiao, S.Q.; Zhu, H.M. Novel metallurgical process for titanium production. J. Mater. Res. 2006, 21, 2172–2175. [Google Scholar] [CrossRef]
  20. Chen, G.Z. Interactions of molten salts with cathode products in the FFC Cambridge Process. Int. J. Miner. Metall. Mater. 2020, 27, 1572–1587. [Google Scholar] [CrossRef]
  21. Li, H.; Jia, L.; Liang, J.L.; Yan, H.Y.; Cai, Z.Y.; Reddy, R.G. Study on the direct electrochemical reduction of Fe2O3 in NaCl-CaCl2 melt. Int. J. Electrochem. Sci. 2019, 14, 11267–11278. [Google Scholar] [CrossRef]
  22. Pepper, R.A.; Couperthwaite, S.J.; Millar, G.J. Comprehensive examination of acid leaching behaviour of mineral phases from red mud: Recovery of Fe, Al, Ti, and Si. Miner. Eng. 2016, 99, 8–18. [Google Scholar] [CrossRef] [Green Version]
  23. Heo, J.H.; Chung, Y.; Park, J.H. Recovery of iron and removal of hazardous elements from waste copper slag via a novel aluminothermic smelting reduction (ASR) process. J. Clean. Prod. 2016, 137, 777–787. [Google Scholar] [CrossRef]
  24. Zhu, X.; Niu, Z.; Li, W.; Zhao, H.; Tang, Q. A novel process for recovery of aluminum, iron, vanadium, scandium, titanium and silicon from red mud. J. Environ. Chem. Eng. 2020, 8, 103528. [Google Scholar] [CrossRef]
  25. Li, G.; Wang, D.; Chen, Z. Direct reduction of solid Fe2O3 in molten CaCl2 by potentially green process. J. Mater. Sci. Technol. 2009, 25, 767–771. [Google Scholar]
  26. Mohandas, K.S. Direct electrochemical conversion of metal oxides to metal by molten salt electrolysis: A review. Miner. Process. Extr. Metall. 2013, 122, 195–212. [Google Scholar] [CrossRef]
  27. Xie, Z.P. Structural Ceramics; Tsinghua University Press: Beijing, China, 2011; pp. 332–356. [Google Scholar]
Figure 1. Schematic illustration of the electrochemical deoxidation strategy of Fe2O3/Al2O3.
Crystals 11 01026 g001
Figure 2. EΘT diagram of electrochemical reactions that may occur in the process of electro-deoxidation.
Crystals 11 01026 g002
Figure 3. XRD patterns of oxide electrolysis products with different raw material ratios.
Crystals 11 01026 g003
Figure 4. The current–time curves during electrolysis of S1 (mFe2O3/mAl2O3 = 1:1), S2 (mFe2O3/mAl2O3 = 3:2), S3 (mFe2O3/mAl2O3 = 2:1), and S4 (mFe2O3/mAl2O3 = 4:1) at 2.3 V, 850 °C, and 4 h.
Crystals 11 01026 g004
Figure 5. The SEM images of S1 (mFe2O3/mAl2O3 = 1:1) in (a), S2 (mFe2O3/mAl2O3 = 3:2) in (b), S3 (mFe2O3/mAl2O3 = 2:1) in (c), and S4 (mFe2O3/mAl2O3 = 4:1) in (d) at 2.3 V, 850 °C, and 4 h.
Crystals 11 01026 g005
Figure 6. The SEM images of S1 (mFe2O3/mAl2O3 = 1:1) in (a), point spectrum for 1 in (b), point spectrum for 2 in (c), and the EDS spectrum of Fe in (d), Al in (e), and O in (f) at 2.3 V, 850 °C, and 4 h.
Crystals 11 01026 g006
Figure 7. The SEM images of S4 (mFe2O3/mAl2O3 = 4:1) in (a), point spectrum for 1 in (b), point spectrum for 2 in (c), and the EDS spectrum of Fe in (d), Al in (e), and O in (f) at 2.3 V, 850 °C, and 4 h.
Crystals 11 01026 g007
Figure 8. XRD patterns of S2 (mFe2O3/mAl2O3 = 3:2, at 2.3 V, 850 °C) at different times.
Crystals 11 01026 g008
Figure 9. It curves of electrolysis of S2 (mFe2O3/mAl2O3 = 3:2, at 2.3 V, 850 °C, and 4 h).
Crystals 11 01026 g009
Figure 10. Schematic illustration of electrochemical process during the electro-reduction of Fe2O3/Al2O3.
Crystals 11 01026 g010
Table 1. Specific experimental conditions in electrochemical deoxidation.
SamplesE (Decomposition Voltage)
V
T (Temperature)
°C
t (Reaction Time)
h
mFe2O3/mAl2O3
S12.385041:1
S22.385043:2
S32.385042:1
S42.385044:1
S52.38500.53:2
S62.385013:2
Publisher’s Note: MDPI stays neutral with regard to jurisdictional claims in published maps and institutional affiliations.

